Tata Motors
•
0 likes•112 views

Tata Motors reported strong results for the first quarter of fiscal year 2011. Consolidated net sales grew 65% year-over-year to Rs. 27,056 crore, driven by higher domestic and JLR volumes as well as a 27% increase in JLR realizations. Consolidated operating profit jumped 667% to Rs. 3,855 crore and operating margins increased substantially to 14.2% compared to 3.1% in the prior year period. However, standalone performance was marginally below expectations with net sales up 63% to Rs. 10,416 crore and net profit falling 23% to Rs. 396 crore due to lower other income. While volumes grew 48% driven by strong

Recommended
More Related Content
What's hot
What's hot (20)
Viewers also liked
Similar to Tata Motors
More from Angel Broking
More from Angel Broking (20)
Recently uploaded
Recently uploaded (20)
Tata Motors
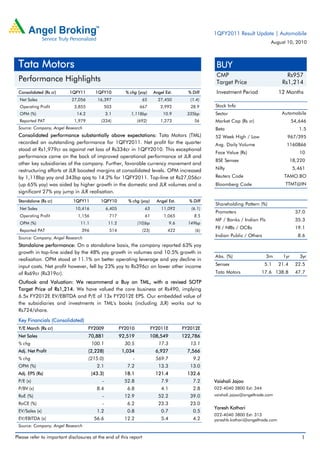
- 1. 1QFY2011 Result Update | Automobile August 10, 2010 Tata Motors BUY CMP Rs957 Performance Highlights Target Price Rs1,214 Consolidated (Rs cr) 1QFY11 1QFY10 % chg (yoy) Angel Est. % Diff Investment Period 12 Months Net Sales 27,056 16,397 65 27,450 (1.4) Operating Profit 3,855 503 667 2,992 28.9 Stock Info OPM (%) 14.2 3.1 1,118bp 10.9 335bp Sector Automobile Reported PAT 1,979 (334) (692) 1,273 56 Market Cap (Rs cr) 54,646 Source: Company, Angel Research Beta 1.5 Consolidated performance substantially above expectations: Tata Motors (TML) 52 Week High / Low 967/395 recorded an outstanding performance for 1QFY2011. Net profit for the quarter Avg. Daily Volume 1160866 stood at Rs1,979cr as against net loss of Rs334cr in 1QFY2010. This exceptional Face Value (Rs) 10 performance came on the back of improved operational performance at JLR and BSE Sensex 18,220 other key subsidiaries of the company. Further, favorable currency movement and restructuring efforts at JLR boosted margins at consolidated levels. OPM increased Nifty 5,461 by 1,118bp yoy and 343bp qoq to 14.2% for 1QFY2011. Top-line at Rs27,056cr Reuters Code TAMO.BO (up 65% yoy) was aided by higher growth in the domestic and JLR volumes and a Bloomberg Code TTMT@IN significant 27% yoy jump in JLR realisation. Standalone (Rs cr) 1QFY11 1QFY10 % chg (yoy) Angel Est. % Diff Shareholding Pattern (%) Net Sales 10,416 6,405 63 11,092 (6.1) Promoters 37.0 Operating Profit 1,156 717 61 1,065 8.5 MF / Banks / Indian Fls 35.3 OPM (%) 11.1 11.2 (10)bp 9.6 149bp FII / NRIs / OCBs 19.1 Reported PAT 396 514 (23) 422 (6) Source: Company, Angel Research Indian Public / Others 8.6 Standalone performance: On a standalone basis, the company reported 63% yoy growth in top-line aided by the 48% yoy growth in volumes and 10.5% growth in Abs. (%) 3m 1yr 3yr realisation. OPM stood at 11.1% on better operating leverage and yoy decline in input costs. Net profit however, fell by 23% yoy to Rs396cr on lower other income Sensex 5.1 21.4 22.5 of Rs69cr (Rs319cr). Tata Motors 17.6 138.8 47.7 Outlook and Valuation: We recommend a Buy on TML, with a revised SOTP Target Price of Rs1,214. We have valued the core business at Rs490, implying 6.5x FY2012E EV/EBITDA and P/E of 13x FY2012E EPS. Our embedded value of the subsidiaries and investments in TML's books (including JLR) works out to Rs724/share. Key Financials (Consolidated) Y/E March (Rs cr) FY2009 FY2010 FY2011E FY2012E Net Sales 70,881 92,519 108,549 122,786 % chg 100.1 30.5 17.3 13.1 Adj. Net Profit (2,228) 1,034 6,927 7,566 % chg (215.0) - 569.7 9.2 OPM (%) 2.1 7.2 13.3 13.0 Adj. EPS (Rs) (43.3) 18.1 121.4 132.6 P/E (x) - 52.8 7.9 7.2 Vaishali Jajoo P/BV (x) 8.4 6.8 4.1 2.8 022-4040 3800 Ext: 344 RoE (%) - 12.9 52.2 39.0 vaishali.jajoo@angeltrade.com RoCE (%) - 6.2 23.3 23.0 Yaresh Kothari EV/Sales (x) 1.2 0.8 0.7 0.5 022-4040 3800 Ext: 313 EV/EBITDA (x) 56.6 12.2 5.4 4.2 yareshb.kothari@angeltrade.com Source: Company, Angel Research Please refer to important disclosures at the end of this report 1
- 2. Tata Motors | 1QFY2011 Result Update Exhibit 1: Quarterly performance (Standalone) Y/E March (Rs cr) 1QFY11 1QFY10 % chg FY2010 FY2009 % chg Net Sales (includes Other Op. Inc.) 10,416 6,405 62.6 35,593 25,630 38.9 Consumption of RM 5,381 3,610 49.1 19,786 16,426 20.5 (% of Sales) 51.7 56.4 55.6 64.1 Staff Costs 509.8 398.4 28.0 1,836 1,551 18.4 (% of Sales) 4.9 6.2 5.2 6.1 Purchases of TG 1,965 668 194.2 4,513 2,180 107.0 (% of Sales) 18.9 10.4 12.7 8.5 Other Expenses 1,404 1,011 38.8 5,423 3,771 43.8 (% of Sales) 13.5 15.8 15.2 14.7 Total Expenditure 9,261 5,688 62.8 31,559 23,928 31.9 Operating Profit 1,156 717 61.2 4,034 1,701 137.1 OPM (%) 11.1 11.2 11.3 6.6 Interest 314.0 253.5 23.9 1,104 673.7 63.9 Depreciation 307.4 229.1 34.2 1,034 874.5 18.2 Other Income 69 319 (78.3) 1,853 926.0 100.2 PBT (excl. Extr. Items) 604 554 9.0 3,750 1,079 247.5 Exceptional Items 66.0 5.5 - 920.5 65.3 - PBT (incl. Extr. Items) 537.6 548.0 (1.9) 2,830 1,014 179.1 (% of Sales) 5.2 8.6 7.9 4.0 Provision for Taxation 141.9 34.3 314.0 589.5 12.5 4,616 (% of PBT) 26.4 6.3 20.8 1.2 Reported PAT 395.7 513.8 (23.0) 2,240 1,001 123.7 PATM 3.8 8.0 6.3 3.9 Equity capital (cr) 570.6 514.1 570.7 514.1 EPS (Rs) 6.9 10.0 (30.6) 19.6 9.7 101.5 Source: Company, Angel Research Exhibit 2: Quarterly volume performance (Standalone) Y/E March (units) 1QFY11 1QFY10 % chg FY2010 FY2009 % chg M&HCV 45,298 28,965 56.4 167,598 123,011 36.2 LCV 61,639 47,358 30.2 233,652 168,495 38.7 Total Commercial Vehicles 106,937 76,323 40.1 401,250 291,506 37.6 Utility Vehicles 9,795 8,117 20.7 34,124 39,981 (14.6) Cars 64,979 38,673 68.0 207,033 166,660 24.2 Total Passenger Vehicles 74,774 46,790 59.8 241,157 206,641 16.7 Exports (Inc Above ) 12,243 5,220 134.5 33,862 33,410 1.4 Total Sales 181,711 123,113 47.6 642,407 498,147 29.0 Source: Company, Angel Research August 10, 2010 2
- 3. Tata Motors | 1QFY2011 Result Update Standalone performance marginally below expectation: For 1QFY2011, TML reported substantial 63% yoy growth in net sales to Rs10,416cr (Rs6,405cr) on a low base, and was marginally lower than our expectation. Top-line was primarily driven by the 48% yoy growth in volumes. Net average realisation jumped almost 10.5% yoy largely owing to favourable product mix and the 1% hike in the product prices taken by the company during the quarter. During 1QFY2011, EBITDA margins declined by a marginal 10bp yoy to 11.1% (11.2%) owing to improved operating leverage. Thus, TML reported a 61.2% yoy jump in operating profit to Rs1,156cr (Rs717cr). Exhibit 3: Revival in volumes, up 48% yoy... Exhibit 4: ... led to robust top-line growth, up 63% yoy (units) Total CV Total PV Total sales growth yoy (RHS) (%) (Rs cr) Net Sales (LHS) Net Sales Growth (RHS) (%) 13,000 100 250,000 80.0 79.5 88.7 62.6 75 200,000 55.6 47.6 60.0 11,000 63.0 150,000 40.0 50 9,000 100,000 20.0 25 12.3 12.7 7,000 (7.6) 50,000 0.0 0 (6.5) 0 (20.0) 5,000 (25) 1QFY10 2QFY10 3QFY10 4QFY10 1QFY11 1QFY10 2QFY10 3QFY10 4QFY10 1QFY11 Source: Company, Angel Research Source: Company, Angel Research Exhibit 5: M&HCV and LCV market share trend Exhibit 6: Passenger car and UV market share trend (%) M&HCV LCV (%) Passenger Car Total UV 80 30 68.5 63.6 63.3 60.9 59.2 19.7 20.4 20.4 19.2 60 20 17.5 60.7 60.5 58.4 55.6 55.4 15.3 14.4 40 10 12.4 12.8 11.6 20 0 1QFY10 2QFY10 3QFY10 4QFY10 1QFY11 1QFY10 2QFY10 3QFY10 4QFY10 1QFY11 Source: Company, SIAM, Angel Research Source: Company, SIAM, Angel Research TML reported 23%yoy fall in net profit of Rs396cr (Rs514cr) for the quarter due to lower other income of Rs69 (Rs319). Higher tax provision and interest rates arrested further gain in net profit for the quarter. The commissioning of the Sanand facility resulted in reduction in the capitalisation of interest expense and higher depreciation. August 10, 2010 3
- 4. Tata Motors | 1QFY2011 Result Update Exhibit 7: EBITDA margins ahead of estimates Exhibit 8: Net profit down 23% yoy on lower other income (%) EBITDA Margin Raw Material Cost/Sales (Rs cr) Net Profit (LHS) Net Profit Margin (RHS) (%) 100 800 12 68.9 70.9 71.0 8.0 9.1 75 67.4 66.1 600 8 50 400 4.9 4.5 3.8 4 25 13.2 12.6 200 11.2 9.4 11.1 0 0 0 1QFY10 2QFY10 3QFY10 4QFY10 1QFY11 1QFY10 2QFY10 3QFY10 4QFY10 1QFY11 Source: Company, Angel Research Source: Company, Angel Research Exhibit 9: Quarterly performance (Consolidated) Y/E March (Rs cr) 1QFY11 1QFY10 % chg FY2010 FY2009 % chg Net Sales 27,056 16,397 65.0 92,519 70,881 30.5 Consumption of RM 14,521 9,280 56.5 52,957 39,326 34.7 (% of Sales) 55.9 35.7 203.8 151.4 Staff Costs 2,149 2,044 5.1 8,943 7,297 22.5 (% of Sales) 8.3 7.9 34.4 28.1 Purchase of Goods 2,526 1,980 27.6 8,539 8,698 (1.8) (% of Sales) 9.7 7.6 32.9 33.5 Other Expenses 4,004 2,591 54.6 15,414 14,049 9.7 (% of Sales) 15.4 10.0 59.3 54.1 Total Expenditure 23,200 15,894 46.0 85,852 69,371 23.8 Operating Profit 3,855 503 666.6 6,667 1,509 341.7 OPM (%) 14.2 3.1 7.2 2.1 Interest 561.6 583.5 (3.8) 2,465 2,170 13.6 Depreciation 1,012 844 19.8 3,887 2,507 55.1 Other Income 34.6 321.1 (89) 1,672 1,316 27 PBT (excl. Extr. Items) 2,317 (604) - 1,986 (1,852) - Exceptional Items 41.4 (334) - (1,537) (291) - PBT (incl. Extr. Items) 2,275 (270) - 3,523 (1,561) - (% of Sales) 8.4 (1.6) 3.8 (2.2) Provision for Taxation 296 64 361 1,006 336 199.6 (% of PBT) 13.0 (23.8) 28.6 (21.5) PAT 1,979 (334) - 2,517 (1,897) - PATM (%) 7.3 (2.0) - 2.7 (2.7) - Minority Interest 6.3 (5.1) - 30.3 (11.5) - Associate Companies Profit 15.6 0.3 5,892.3 84.5 (51.7) - PAT after MI 1,988 (328) - 2,571 (1,937) - Adj. PAT 2,030 (662) - 1,034 (2,228) - Equity shares (cr) 570.6 514.1 11.0 570.6 570.6 - EPS (Rs) 34.9 (6.4) - 45 (34) - Source: Company, Angel Research August 10, 2010 4
- 5. Tata Motors | 1QFY2011 Result Update Outstanding consolidated performance: TML reported consolidated net sales of Rs27,056cr (Rs16,395cr) for 1QFY2011, up 65% yoy aided by a substantial jump improvement in JLR performance and a decent turnaround performance registered by the company’s other key subsidiaries. The company recorded operating profit of Rs3,855cr (operating loss Rs503cr in 1QFY2010). OPM for the quarter stood at 14.2%, substantially higher than our estimates. Exhibit 10: Net sales jumps 65% yoy, led by surge in JLR volumes (Rs cr) Net Sales (LHS) Net Sales Growth (RHS) (%) 30,000 120 84.6 25,000 80 65.0 47.1 20,000 40 13.2 15,000 0 (8.2) 10,000 (40) 1QFY10 2QFY10 3QFY10 4QFY10 1QFY11 Source: Company, Angel Research The good performance in consolidated top-line came on the back of improved operating leverage, which resulted from the aggressive cost-cutting measures adopted by the company in its domestic and overseas operations. Further, a better product mix, favourable currency movement (average GBP/USD for 1QFY2010 was 1.55 v/s 1.49 for 1QFY2011 and average GBP/EUR for 1QFY2010 was 1.14 v/s 1.17 for 1QFY2011) and reduced inventory levels also aided the substantial jump in operating margins. The company reported net profit of Rs1,989cr for 1QFY2011 as against a net loss of Rs663cr owing to JLR’s improved performance. Exhibit 11: Increased op. leverage benefitted margins Exhibit 12: Improved performance helps net profit growth (%) EBITDA Margin Raw Material Cost/Sales (Rs cr) Net Profit (LHS) Net Profit Margin (RHS) (%) 100 2,600 12 69.1 67.3 67.1 75 65.2 63.4 1,850 7.7 8 50 7.4 1,100 25 14.2 4 11.4 10.8 7.1 3.1 350 2.5 0 1QFY10 2QFY10 3QFY10 4QFY10 1QFY11 1QFY10 2QFY10 3QFY10 4QFY10 1QFY11 (400) 0.1 0 Source: Company, Angel Research Source: Company, Angel Research TML's total net debt, on a consolidated basis, increased marginally on a qoq basis to Rs19,983cr (Rs18,800cr in 4QFY2010). The consolidated net debt-to-equity ratio stood at around 1.96x in 1QFY2011 (2.33x in 4QFY2010). August 10, 2010 5
- 6. Tata Motors | 1QFY2011 Result Update Exhibit 13: JLR - Income Statement (£ mn) 1QFY11 1QFY10 % yoy chg 4QFY10 % qoq chg FY2010 FY2011E FY2012E Volume (units) 57,151 35,947 59.0 57,005 0.3 193,957 219,151 236,683 Realisation(£) 39,579 31,296 26.5 35,927 10.2 33,791 37,673 37,673 Net Sales 2,262 1,125 101.1 2,048 10.4 6,554 8,256 8,916 Total Income 2,262 1,125 101.1 2,048 10.4 6,554 8,256 8,916 Total Expenditure 1,923 1,170 64.4 1,834 4.9 6,169 7,131 7,698 Raw Material 1,393 814 71.1 1300 7.2 4,438 5,150 5,555 % to Sales 61.6 72.4 63.5 67.7 62.4 62.3 Staff Cost 191 176 8.5 175 9.1 730 709 758 % to Sales 8.4 15.6 8.5 11.1 8.6 8.5 Other Exp. 328 170 92.9 339 (3.2) 953 1,227 1,337 % to Sales 14.5 15.1 16.6 14.5 14.9 15.0 Product development Cost 11 11 - 20 (45.0) 48 45 48 % to Sales 0.5 1.0 1.0 0.7 0.5 0.5 Operating Profit 339 (45) 214 58.4 385 1,125 1,218 OPM (%) 15.0 (4) 10.4 13.6 13.7 Interest 17 13 30.8 19 (10.5) 53 68 65 Gross Profit 322 (58) 195 65.1 332 1,057 1,153 Depreciation 87 69 26.1 65 33.8 310 372 380 Notional Forex gain / (loss) (1) 65 (41) 10 (1) - PBT 234 (62) 89 162.9 32 684 773 Tax 13 2 550.0 16 (18.8) 29 73 93 PAT 221 (64) 73 202.7 3 611 680 Source: Company, Angel Research JLR recorded top-line of £2,262mn and operating profit of £339mn for the quarter. JLR’s combined volume for 1QFY2010 increased to 57,157 units (35,974). A shift in product mix towards higher-margin vehicles as well as reduction in discounts or subventions on new product launches led to better average realisations yoy and qoq. This was largely supported by the good growth in volumes and around 27% yoy and 10% qoq increase in realisations. JLR recoded a substantial jump in OPM at 15% (10.4% in 4QFY2010) owing to the cost cutting measures initiated by the company and favourable currency movement. After providing for depreciation, interest and tax JLR posted profit of £221mn (or Rs1,613cr) for the quarter. JLR has exposure to the USD and Euro. However, the company’s Euro imports exceed its Euro sales. On the USD front, it is a net receiver of USD. Thus, favourable currency movement in the USD and Euro has benefitted the company the last few quarters. Average realisations for the quarter came in higher than our expectation of around £36,000, which brought a positive impact on EBITDA of £339m as against our expectation of ~£225m. This was aided by better product mix (launch of XJ), favourable currency movement and better pricing. JLR’s business performance turned profitable in FY2010. The company credits this revival to the introduction of new models and restructuring exercise, which it initiated at its UK subsidiary. August 10, 2010 6
- 7. Tata Motors | 1QFY2011 Result Update JLR has around 20-25% Sales in the US and close to 55% sales in Europe and UK. JLR is highly dependent on the UK market, which continues to be a significant market for it. Management remains positive on JLR and feels that the European crisis will not impact JLR sales as it has a healthy order book. Economic recovery in the US and China is expected to further augment JLR’s volume growth. In FY2010, JLR sold 25,000 units in China. To broaden its foothold in China, JLR proposes to set up a national sales company in the region. The company has also seen revival in demand from Russia in the last few months. TML intends to incur capex of £700-850 million for new product development under the JLR brand in FY2011. JLR operates with a negative working capital cycle. In January 2010, the company launched the new XJ. Customer delivery of the same commenced in March 2010, which helped to clock richer product mix for JLR. It also plans to launch the all-new small Range Rover (LRX concept-car) in 2010. Thus, on overall excellent performance, we revise our PAT for JLR to £611mn (£227mn earlier) and £680mn (£275mn earlier). Exhibit 14: Change in estimates (JLR) % chg Y/E March (mn £) Earlier Estimates Revised Estimates FY2011E FY2012E FY2011E FY2012E FY2011E FY2012E Revenue 7,291 7,885 8,256 8,916 13.2 13.1 OPM (%) 8.7 8.4 13.6 13.7 492 526 PAT 227 257 611 680 170 165 Source: Company, Angel Research Exhibit 15: JLR quarterly performance Exhibit 16: JLR performance – Region-wise ('000 units) Jaguar Land Rover ('000 units) North America UK Europe Russia China Others 50 46.1 30 43.7 41.9 40 34.6 20 30 24.3 20 15.5 12.1 13.4 10 11.6 10.9 10 0 0 1QFY10 2QFY10 3QFY10 4QFY10 1QFY11 1QFY10 2QFY10 3QFY10 4QFY10 1QFY11 Source: Company, Angel Research Source: Company, Angel Research August 10, 2010 7
- 8. Tata Motors | 1QFY2011 Result Update Exhibit 17: Subsidiary performance during the quarter Key Subsidiaries (Rs cr) 1QFY2011 1QFY2010 Revenue EBITDA OPM (%) Net Profit Revenue EBITDA OPM (%) Net Profit Tata Daewoo 853 74 8.7 36 669 40 6.0 18.0 TELCON 390 (1) (0.3) (0) 390 (1) (0.3) (0.4) Tata Tech. 298 42 14.1 27 246 14 5.7 5.0 Tata M. finance 320 27 8.4 24 210 (74) (35.2) (37.0) HV Transmissions 62 35 56.5 17 39 19 48.7 7.0 HV Axles 73 45 61.6 22 44 25 56.8 10.0 Total 1,996 222 11.1 126 1,598 23 1.4 2.6 Source: Company, Angel Research Subsidiaries showing substantial growth in performance: TML’s other key subsidiaries combined recorded 25% yoy jump in net sales to around Rs1,996cr (Rs1,598cr) in 1QFY2011. On account of the increase in net sales in almost all its subsidiaries and improved operating leverage, subsidiaries combined recorded a substantial yoy increase in net profit for the quarter to Rs126cr (Rs2.6cr). HVAL and HVTL reported significant improvement in top-line and bottom-line owing to continued growth in domestic MHCV volumes. The subsidiaries also plan to venture into manufacturing axles for the LCV range of vehicles and construction equipment. Total vehicle financing disbursals (TMF) for 1QFY2011 stood at Rs1,630cr, an increase of 18% yoy, mainly on account of the significant volume traction in the domestic four-wheeler industry. The book size at the end of June’10 for TMFL and TML (vehicle financing) stood at Rs7,436cr and Rs554cr, respectively. TMF’s market-share for 1QFY2011 stood at 20.7%. Net interest margins (NIM) of the vehicle financing business (TMF) for 1QFY2011 was 10.0%. Outlook and Valuation FY2010 has been a year of recovery for TML’s standalone business. The cut in interest rates and overall improvement in the financing scenario helped TML in reporting better volume growth in FY2010. Volume traction continued in 1QFY2011, with improved liquidity and further improvement in IIP. Our estimates for TML factor in around ~11% CAGR in commercial vehicle (CV) volumes over FY2010-12E and ~35% CAGR in passenger vehicle (PV, including Nano) volumes. Following recovery in its core business, TML’s key subsidiaries (linked to the fortunes of CVs) are also expected to show good results. Moreover, with the positive trend in the external environment (in financial markets and improvement in general liquidity), TML has partially met its overall funding requirements (including JLR) at reasonable terms. Further, full recovery in the domestic CV cycle is expected to reduce the pressure on cash flows and facilitate debt repayment going forward. JLR has also recorded excellent recovery aided by a good recovery in its key markets. We expect the launch of new products in 2010 to help JLR register ~11% CAGR over FY2010-12E. We have also revised our OPM estimates to factor in higher operating efficiency in both its domestic and overseas operations. However, we await further clarification on the tax outgo at JLR (at present JLR does not have any tax liability in UK and overall tax rate is lower due to the statutory operations in various countries). August 10, 2010 8
- 9. Tata Motors | 1QFY2011 Result Update Exhibit 18: Change in estimates (Consolidated) Y/E March Earlier Estimates Revised Estimates % chg FY2011E FY2012E FY2011E FY2012E FY2011E FY2012E Gross Revenue (Rs cr) 110,307 123,432 113,072 127,902 2.5 3.6 OPM (%) 9.5 9.6 13.3 13.0 375bp 340bp EPS (Rs) 58.4 73.4 121.4 132.6 107.9 80.6 Source: Angel Research We estimate TML to record a CAGR of 171% in net profit over FY2010-12E on a consolidated basis, owing to the better-than-expected recovery in JLR. At the CMP of Rs957, on a consolidated basis, the stock is trading at 7.9x and 7.2x FY2011E and FY2012E earnings, respectively. We have valued the stock on the sum-of the- parts (SOTP) methodology. We recommend a Buy on TML, with a revised SOTP Target Price of Rs1,214. We have valued the core business at Rs490, implying 6.5x FY2012E EV/EBITDA and P/E of 13x FY2012E EPS. Our embedded value of the subsidiaries and investments in TML's books (including JLR) works out to Rs724/share. We value JLR at 7x PAT and 4.5x EV/EBITDA on FY2012E basis, in line with its peers. Exhibit 19: SOTP Valuation Particulars Parameter Value/Share (Rs) TML (Standalone) FY2012E (13x P/E and 6.5x EV/EBITDA)) 490 JLR FY2012E (7x PAT and 4.5x EV/EBITDA) 609 Key Subsidiaries and Others - 115 Fair Value 1,214 Source: Angel Research Exhibit 20 : JLR peer valuation P/E (x) P/B (x) EV/EBITDA (x) P/Sales (x) CY10E CY11E CY10E CY11E CY10E CY11E CY10E CY11E Audi 14.7 11.7 2.4 2.2 - - 0.8 0.7 BMW 11.8 9.3 1.2 1.1 2.9 2.3 0.5 0.5 Daimler 11.5 9.4 1.3 1.1 5.2 4.3 0.5 0.4 Porsche 85.6 8.5 0.5 0.4 11.8 13.1 1.0 0.8 Volkswagen 13.4 10.1 0.9 0.8 3.7 3.2 0.3 0.3 Source: Bloomberg, Angel Research Kew downside risk to our estimates: Lower-than-expected recovery in IIP and credit cycle would in turn result in lower off-take of CVs and PVs, which can impact our standalone numbers. If the recent debt crises in the European markets further aggravates, it would pose downside risks to our JLR estimates and in turn consolidated earnings. August 10, 2010 9
- 10. Tata Motors | 1QFY2011 Result Update Exhibit 21 : Angel v/s consensus forecast Angel estimates Consensus Variation (%) FY11E FY12E FY11E FY12E FY11E FY12E Net Sales (Rs cr) 108,549 122,786 106,598 122,847 1.8 (0.05) EPS (Rs) 121.4 132.6 68.42 93.5 77.4 41.8 Source: Bloomberg, Angel Research Exhibit 22: Key Assumptions Y/E March (units) FY07 FY08 FY09 FY10 FY11E FY12E M&HCV 183,592 179,415 123,011 167,598 197,766 217,542 LCV 145,763 173,434 168,495 233,652 252,344 277,579 Total Commercial Vehicles 329,355 352,849 291,506 401,250 450,110 495,121 Utility Vehicles 48,599 50,299 39,981 34,124 37,536 40,539 Cars 191,934 179,268 166,660 176,683 189,051 202,284 Nano - - - 30,350 100,000 200,000 Total Passenger Vehicles 240,533 229,567 206,641 241,157 326,587 442,824 Exports (Inc Above ) 49,018 54,272 33,410 33,862 46,602 56,277 Total volume 569,888 582,416 498,147 642,407 776,697 937,944 JLR volume - - - 193,957 219,151 236,683 Source: Company, Angel Research Exhibit 23: One-year forward EV/EBITDA band Exhibit 24: Tata Motors v/s Sensex (Rs cr) EV (Rs cr) 2x 4x 6x 8x Tata Motors Sensex 140,000 185.0 120,000 160.0 100,000 135.0 80,000 110.0 60,000 85.0 40,000 60.0 20,000 35.0 0 10.0 Dec-03 Aug-04 Dec-05 Aug-06 Dec-07 Aug-08 Dec-09 Aug-10 Apr-03 Apr-05 Apr-07 Apr-09 Feb-08 Feb-09 Feb-10 Aug-07 Aug-08 Aug-09 Aug-10 Oct-07 Dec-07 Apr-08 Oct-08 Dec-08 Apr-09 Oct-09 Dec-09 Apr-10 Apr-07 Jun-07 Jun-08 Jun-09 Jun-10 Source: Company, Bloomberg, Angel Research Source: Company, Bloomberg, Angel Research Exhibit 25: Automobile - Recommendation summary CMP Tgt Price Upside P/E (x) EV/EBITDA (x) RoE (%) FY10-12E EPS Company Reco. (Rs) (Rs) (%) FY11E FY12E FY11E FY12E FY11E FY12E CAGR (%) Ashok Leyland Neutral 71 - - 16.3 13.6 11.5 9.9 15.1 16.7 34.1 Bajaj Auto* Neutral 2,653 - - 16.9 15.3 11.0 9.4 61.5 48.0 21.5 Hero Honda Accumulate 1,868 1,978 5.9 16.5 14.4 12.0 10.3 53.8 50.4 7.6 Maruti Suzuki Accumulate 1,226 1,356 10.6 15.3 13.0 8.8 6.9 18.0 16.1 4.4 M&M Buy 640 772 20.5 15.9 13.6 13.2 11.2 25.3 24.4 15.8 Tata Motors Buy 957 1,214 26.8 7.9 7.2 5.4 4.2 36.7 43.8 170.5 TVS Motor* Neutral 140 - - 19.5 14.3 9.9 8.4 18.8 22.9 64.0 Source: Company, Angel Research; Note: * The numbers are not adjusted for bonus, Price as on August 10, 2010 August 10, 2010 10
- 11. Tata Motors | 1QFY2011 Result Update Profit & Loss Statement (Consolidated) Y/E March (Rs cr) FY07 FY08 FY09 FY10 FY11E FY12E Gross sales 36,705 40,089 74,093 95,567 113,072 127,902 Less: Excise duty 4,639 4,668 3,212 3,048 4,523 5,116 Net Sales 32,067 35,422 70,881 92,519 108,549 122,786 Total operating income 32,067 35,422 70,881 92,519 108,549 122,786 % chg 35.8 10.5 100.1 30.5 17.3 13.1 Total Expenditure 28,320 31,490 69,371 85,852 94,166 106,824 Net Raw Materials 21,961 24,376 48,025 61,495 71,642 81,039 Other Mfg costs 1,713 1,515 2,325 2,963 3,528 3,991 Personnel 2,409 2,745 7,297 8,943 9,769 10,437 Other 2,237 2,854 11,724 12,452 9,227 11,358 EBITDA 3,746 3,932 1,509 6,667 14,383 15,962 % chg 11.7 4.9 (61.6) 341.7 115.7 11.0 (% of Net Sales) 11.7 11.1 2.1 7.2 13.3 13.0 Depreciation & Amortisation 688.1 782.1 2,506.8 3,887.1 4,122.1 4,333.6 EBIT 3,058 3,150 (997) 2,780 10,261 11,629 % chg 37.7 3.0 - - 269.1 13.3 (% of Net Sales) 9.5 8.9 (1.4) 3.0 9.5 9.5 Interest & other Charges 465 913 2,171 2,465 2,018 2,018 Other Income 491 619 1,316 1,672 323 375 (% of PBT) 15.7 20.1 (84.3) 47.5 3.6 3.6 Recurring PBT 3,084 2,856 (1,852) 1,986 8,566 9,985 % chg (7.4) - - 331.3 16.6 Extraordinary Expense/(Inc.) (43.5) (230.4) (290.9) (1,536.7) (445.6) (467.9) PBT (reported) 3,127 3,086 (1,561) 3,523 9,011 10,453 Tax 883 852 336 1,006 1,712 2,509 (% of PBT) 28.2 27.6 (21.5) 28.6 19.0 24.0 PAT (reported) 2,244 2,235 (1,897) 2,517 7,299 7,945 Add: Share of earnings of associate 39 65 (52) 85 106 132 Less: Minority interest (MI) 74.2 132.3 (11.5) 30.3 32.6 42.7 PAT after MI (reported) 2,209 2,168 (1,937) 2,571 7,372 8,034 ADJ. PAT 2,166 1,937 (2,228) 1,034 6,927 7,566 % chg 31.8 (10.6) - - 569.7 9.2 (% of Net Sales) 6.8 5.5 (3.1) 1.1 6.4 6.2 Basic EPS (Rs) 56.2 50.2 (43.3) 18.1 121.4 132.6 Fully Diluted EPS (Rs) 38.0 34.0 (39.0) 18.1 121.4 132.6 % chg 31.8 (10.6) - - 569.7 9.2 August 10, 2010 11
- 12. Tata Motors | 1QFY2011 Result Update Balance Sheet (Consolidated) Y/E March (Rs cr) FY07 FY08 FY09 FY10 FY11E FY12E SOURCES OF FUNDS Equity Share Capital 385 386 514 571 571 571 Preference Capital - - - - - - Reserves& Surplus 7,336 8,312 5,427 7,636 12,889 19,030 Shareholders’ Funds 7,722 8,698 5,941 8,206 13,459 19,601 Minority Interest 250 468 403 214 246 289 Total Loans 7,302 11,585 34,974 35,192 28,834 28,834 Deferred Tax Liability 817 974 680 1,154 1,514 1,932 Total Liabilities 16,091 21,725 41,998 44,766 44,054 50,656 APPLICATION OF FUNDS Gross Block 10,359 12,976 58,469 62,145 68,702 72,227 Less: Acc. Depreciation 5,427 6,060 33,269 34,414 38,536 42,869 Net Block 4,933 6,915 25,200 27,732 30,166 29,358 Capital Work-in-Progress 2,582 5,948 10,533 8,068 6,870 7,223 Goodwill 443 566 3,719 6,129 6,129 6,129 Investments 1,175 2,666 1,257 2,219 1,101 1,266 Current Assets 15,812 19,244 33,322 42,530 44,890 56,314 Cash 1,154 3,833 4,121 8,743 5,082 15,646 Loans & Advances 9,789 10,056 13,456 15,283 19,539 22,102 Other 4,869 5,355 15,745 18,503 20,269 18,566 Current liabilities 8,865 13,621 32,120 41,912 45,104 49,634 Net Current Assets 6,947 5,623 1,202 618 (213) 6,680 Mis. Exp. not written off 12 7 86 - - - Total Assets 16,091 21,725 41,998 44,766 44,054 50,656 August 10, 2010 12
- 13. Tata Motors | 1QFY2011 Result Update Cash Flow Statement (Consolidated) Y/E March (Rs cr) FY07 FY08 FY09 FY10 FY11E FY12E Profit before tax 3,127 3,086 (1,561) 3,523 9,011 10,453 Depreciation 688 782 2,507 3,887 4,122 4,334 Change in Working Capital (699) (4,397) (15,377) (7,425) (4,710) (3,924) Less: Other income 3,109 (6,976) (15,517) (14,635) (13,228) (10,691) Direct taxes paid 883 852 336 1,006 1,712 2,509 Cash Flow from Operations (875) 5,596 750 13,614 19,939 19,045 (Inc.)/Dec. in Fixed Assets (2,661) (5,983) (50,078) (1,211) (5,359) (3,878) (Inc.)/Dec. in Investments 87 (1,491) 1,408 (962) 1,118 (165) (Inc.)/Dec. in loans and advances 11 278 3,582 500 (1,989) (1,025) Other income 491 619 1,316 1,672 323 375 Cash Flow from Investing (2,073) (6,577) (43,772) (1) (5,906) (4,693) Issue of Equity 110 - 3,958 57 - - Inc./(Dec.) in loans 3,923 4,283 23,389 219 (6,358) - Dividend Paid (Incl. Tax) 584 688 677 365 1,002 1,001 Others 1,897 1,304 (14,833) 9,630 12,338 4,790 Cash Flow from Financing 2,720 3,667 42,856 (8,990) (17,694) (3,789) Inc./(Dec.) in Cash (228) 2,685 (166) 4,622 (3,661) 10,564 Opening Cash balances 1,386 1,154 3,833 4,121 8,743 5,082 Closing Cash balances 1,154 3,833 4,121 8,743 5,082 15,646 August 10, 2010 13
- 14. Tata Motors | 1QFY2011 Result Update Key Ratios Y/E March FY07 FY08 FY09 FY10 FY11E FY12E Valuation Ratio (x) P/E (on FDEPS) 17.0 19.0 - 52.8 7.9 7.2 P/CEPS 12.6 12.2 80.6 11.1 4.9 4.6 P/BV 4.8 4.3 8.4 6.8 4.1 2.8 Dividend yield (%) 1.6 1.6 0.6 1.6 1.6 1.6 EV/Sales 1.7 1.6 1.2 0.8 0.7 0.5 EV/EBITDA 16.2 15.9 56.6 12.2 5.4 4.2 EV / Total Assets 3.8 2.9 2.0 1.8 1.8 1.3 Per Share Data (Rs) EPS (Basic) 56.2 50.2 (43.3) 18.1 121.4 132.6 EPS (fully diluted) 38.0 34.0 (39.0) 18.1 121.4 132.6 Cash EPS 76.1 78.2 11.9 86.3 193.6 208.5 DPS 15.0 15.0 6.1 15.1 15.0 15.0 Book Value 134.9 152.0 102.2 140.6 232.6 340.3 Dupont Analysis EBIT margin 9.5 8.9 (1.4) 3.0 9.5 9.5 Tax retention ratio 0.7 0.7 1.2 0.7 0.8 0.8 Asset turnover (x) 3.0 2.4 2.7 2.6 3.0 3.4 ROIC (Post-tax) 20.5 15.8 (4.7) 5.7 23.3 24.8 Cost of Debt (Post Tax) 6.2 7.0 11.3 5.0 5.1 5.3 Leverage (x) 0.4 0.6 2.4 3.8 2.2 1.0 Operating ROE 26.4 21.1 (42.6) 8.1 62.7 45.2 Returns (%) ROCE (Pre-tax) 23.1 16.7 (3.1) 6.4 23.1 24.6 Angel ROIC (Pre-tax) 22.3 20.7 (2.7) 8.3 27.2 34.7 ROE 27.5 25.0 (2.0) (8.4) 36.7 43.8 Turnover ratios (x) Asset Turnover (Gross Block) 3.3 3.0 2.0 1.5 1.7 1.7 Inventory / Sales (days) 32 33 37 44 43 39 Receivables (days) 17 19 18 24 20 20 Payables (days) 82 116 123 135 127 125 Working capital cycle (ex-cash) (days) 66 39 (3) (22) (23) (21) Solvency ratios (x) Net debt to equity 0.6 0.6 5.0 3.0 1.7 0.6 Net debt to EBITDA 1.3 1.3 19.6 3.6 1.6 0.7 Interest Coverage (EBIT / Interest) 6.6 3.5 (0.5) 1.1 5.1 5.8 August 10, 2010 14
- 15. Tata Motors | 1QFY2011 Result Update Research Team Tel: 022 - 4040 3800 E-mail: research@angeltrade.com Website: www.angeltrade.com DISCLAIMER This document is solely for the personal information of the recipient, and must not be singularly used as the basis of any investment decision. Nothing in this document should be construed as investment or financial advice. Each recipient of this document should make such investigations as they deem necessary to arrive at an independent evaluation of an investment in the securities of the companies referred to in this document (including the merits and risks involved), and should consult their own advisors to determine the merits and risks of such an investment. Angel Broking Limited, its affiliates, directors, its proprietary trading and investment businesses may, from time to time, make investment decisions that are inconsistent with or contradictory to the recommendations expressed herein. The views contained in this document are those of the analyst, and the company may or may not subscribe to all the views expressed within. Reports based on technical and derivative analysis center on studying charts of a stock's price movement, outstanding positions and trading volume, as opposed to focusing on a company's fundamentals and, as such, may not match with a report on a company's fundamentals. The information in this document has been printed on the basis of publicly available information, internal data and other reliable sources believed to be true, but we do not represent that it is accurate or complete and it should not be relied on as such, as this document is for general guidance only. Angel Broking Limited or any of its affiliates/ group companies shall not be in any way responsible for any loss or damage that may arise to any person from any inadvertent error in the information contained in this report. Angel Broking Limited has not independently verified all the information contained within this document. Accordingly, we cannot testify, nor make any representation or warranty, express or implied, to the accuracy, contents or data contained within this document. While Angel Broking Limited endeavours to update on a reasonable basis the information discussed in this material, there may be regulatory, compliance, or other reasons that prevent us from doing so. This document is being supplied to you solely for your information, and its contents, information or data may not be reproduced, redistributed or passed on, directly or indirectly. Angel Broking Limited and its affiliates may seek to provide or have engaged in providing corporate finance, investment banking or other advisory services in a merger or specific transaction to the companies referred to in this report, as on the date of this report or in the past. Neither Angel Broking Limited, nor its directors, employees or affiliates shall be liable for any loss or damage that may arise from or in connection with the use of this information. Note: Please refer to the important `Stock Holding Disclosure' report on the Angel website (Research Section). Also, please refer to the latest update on respective stocks for the disclosure status in respect of those stocks. Angel Broking Limited and its affiliates may have investment positions in the stocks recommended in this report. Disclosure of Interest Statement Tata Motors 1. Analyst ownership of the stock Yes 2. Angel and its Group companies ownership of the stock Yes 3. Angel and its Group companies' Directors ownership of the stock No 4. Broking relationship with company covered No Note: We have not considered any Exposure below Rs 1 lakh for Angel, its Group companies and Directors. Ratings (Returns) : Buy (> 15%) Accumulate (5% to 15%) Neutral (-5 to 5%) Reduce (-5% to 15%) Sell (< -15%) August 10, 2010 15