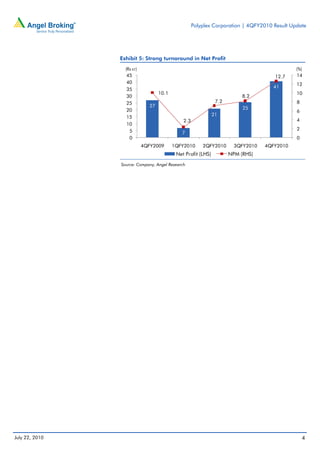
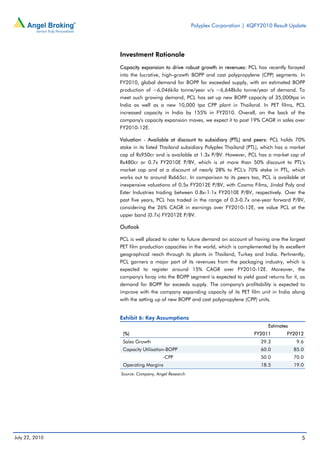
4QFY2010 Result Update | Packaging-Polyester Films
                                                                                                                               July 22, 2010


 Polyplex Corporation                                                                             BUY
                                                                                                  CMP                                    Rs300
 Performance Highlights                                                                           Target Price                           Rs418
   (Rs cr)                4QFY2010 4QFY2009 %chg (yoy) 3QFY2010 %chg (qoq)                        Investment Period                12 Months
  Net Sales                         321            269         19.4          310         3.4
                                                                                                 Stock Info
  EBITDA                            59             52          13.0           55         6.7
                                                                                                 Sector                             Packaging
  EBITDA Margin (%)                18.4        19.5         (104)bp       17.9         58bp
                                                                                                 Market Cap (Rs cr)                        480
  Net Profit                        41             27          50.2           25        59.8
                                                                                                 Beta                                       0.4
  Source: Company, Angel research
                                                                                                 52 Week High / Low                  305/164
 Polyplex Corporation (PCL) has reported higher-than-estimated 4QFY2010                          Avg. Daily Volume                        6472
 numbers. Net sales grew 19.4% yoy to Rs321cr (Rs269cr). The company                             Face Value (Rs)                            10
 reported 104bp contraction in OPM to 18.4% (19.5%), but above our estimate                      BSE Sensex                              18,113
 of 17.9%, mainly due to the increase in raw material costs. Net profit jumped by                Nifty                                    5,442
 50.2% yoy to Rs41cr (Rs27cr) on the back of the substantial increase in other                   Reuters Code                        PLYP.BO
 income.
                                                                                                 Bloomberg Code                      PPC@IN
 FY2010 results above expectation: PCL reported 9.1% yoy growth in net sales to
 Rs1223cr mainly on the back of better economic conditions, which led to a rise
                                                                                                 Shareholding Pattern (%)
 in capacity utilizations to 93% in FY2010 v/s 85% in FY2009. PCL reported
 OPM of 18.3% (20.9%) for FY2010, which contracted by 260bp yoy but was                          Promoters                                 46.9
 slightly above our estimate of 18.2%. Net profit for FY2010 declined by 14.9%                   MF / Banks / Indian Fls                   19.2
 to Rs94cr (Rs110cr) but was still above our expectation of Rs72cr.                              FII / NRIs / OCBs                         11.6
                                                                                                 Indian Public / Others                    22.3
 Outlook and Valuation: PCL holds 70% stake in its listed Thailand subsidiary
 Polyplex Thailand (PTL), which has a market cap of Rs950cr and is available at
 1.3x P/BV. However, PCL has a market cap of Rs480cr or 0.7x FY2010E P/BV,                       Abs. (%)                 3m       1yr      3yr
 which is at more than 50% discount to PTL's market cap and at a discount of
                                                                                                 Sensex                   3.1 22.0        16.4
 nearly 28% to PCL's 70% stake in PTL, which works out to around Rs665cr. In
                                                                                                 Polyplex              34.2 60.9           93.8
 comparison to its peers too, PCL is available at inexpensive valuations of 0.5x
 FY2012E P/BV, with Cosmo Films, Jindal Poly and Ester Industries trading
 between 0.8x-1.1x FY2010E P/BV, respectively. Considering the 26% estimated
 CAGR in earnings over FY2010-12E, we maintain a Buy on the stock, with a
 Target Price of Rs418.

 Key Financials (Consolidated)
 Y/E March (Rs cr)                        FY2009         FY2010    FY2011E         FY2012E
 Net Sales                                 1,121          1,223       1,581          1,733
 % chg                                      11.9            9.1        29.3            9.6
 Net Profit                                 110              94        124            150
 % chg                                      10.4          (14.9)       32.5           20.1
 EBITDA Margin (%)                          20.9           18.3        18.5           19.0
 FDEPS (Rs)                                 69.0           58.8        77.8           93.5
 P/E (x)                                     4.4            5.1         3.9            3.2
 RoE (%)                                    19.4           13.9        16.1           16.7
 RoCE (%)                                    14              10         13             14
                                                                                                 Sharan Lillaney
 P/BV (x)                                    0.8            0.7         0.6            0.5       022-4040 3800 Ext: 338
 EV/Sales (x)                                0.9            1.0         0.7            0.5       sharanb.lillaney@angeltrade.com
 EV/EBITDA (x)                               4.5            4.1         2.6            1.8
 Source: Company, Angel Research


Please refer to important disclosures at the end of this report                                                                              1
Polyplex Corporation | 4QFY2010 Result Update


Exhibit 1: 4QFY2010 performance
(Rs cr)                           4QFY2010    3QFY2010          %chg    4QFY2009          %chg         FY2010          FY2009       %chg
                                       4Q              3Q       (qoq)             4Q       (yoy)                                    (yoy)
 Net Sales                             321          310           3.4         269          19.4         1,223           1,121         9.1
 Total Expenditure                     262          255           2.7         216          21.0          999             886        12.8
 EBITDA                                 59             55         6.7             52       13.0          224             235        (4.6)
 Depreciation                           16             15         5.0             14       14.1           60              54        10.8
 EBIT                                   44             41         7.4             39       12.6          164             181        (9.3)
 Interest                                7               5      36.1               8       (5.9)          25              35       (29.6)
 Other Income                           13               1    1,562.0              8       59.3           17              21       (16.0)
 PBT                                    49             36       37.3              39       26.3          156             166        (5.8)
 Tax                                    (6)            (0)          -              2           -          19              12        61.0
 Minority Interest                      14             10       36.8              10       41.9           43              44        (0.6)
 Net Profit                             41             25       59.8              27       50.2           94             110       (14.9)
 Basic EPS (Rs)                         25             16       59.8              17       50.2           59              69       (14.9)
Source: Company, Angel Research

                                                Exhibit 2: 4QFY2010- Actual v/s Angel estimates
                                                 Rs cr                                  Estimates           Actual         Variation (%)
                                                 Net Sales                                   299                321                 7.5
                                                 EBITDA                                       54                 59                 9.1
                                                 EBITDA Margin (%)                          17.9                18.4                2.8
                                                 Tax                                               -             (6)                   -
                                                 Net Profit                                   19                 41              115.0
                                                Source: Company, Angel Research

                                                Revenues up 19.4%, substantially above expectation: The company’s net sales
                                                grew by 19.4% yoy to Rs321cr (Rs269cr) for the quarter, driven by better capacity
                                                utilisation and commencement of new biaxially oriented polypropylene (BOPP) and
                                                PET units in 4QFY2010. On qoq basis, the company managed a marginal 3.4%
                                                growth in revenues. For FY2010, capacity utilisation stood at 93% v/s 85% in
                                                FY2009. For FY2010, revenues increased marginally by 9.1% to Rs1,223cr
                                                (Rs1,121cr).


July 22, 2010                                                                                                                          2
Polyplex Corporation | 4QFY2010 Result Update


                Exhibit 3: Quarterly Revenue trend

                  (Rs cr)                                                                       (%)
                  330                                                                           25
                  320                                                                           20
                  310                                                                  321
                                                                                                15
                  300                                                     310
                                             301                                                10
                  290
                                                           290                                  5
                  280
                                                                                                0
                  270
                  260         269                                                               (5)
                  250                                                                           (10)
                  240                                                                           (15)
                            4QFY2009     1QFY2010      2QFY2010      3QFY2010    4QFY2010
                                 Net Sales (LHS)           Growth (qoq)         Growth (yoy)

                Source: Company, Angel Research


                OPM contracts yoy on higher raw materials costs but increases qoq: PCL reported
                104bp contraction in OPM to 18.4% (19.5%) for the quarter, which however
                exceeded our estimate of 17.9%. On a qoq basis, the company managed to
                increase its OPM by 58bp on strong demand for PET films. For FY2010, the
                company’s OPM declined to 18.3% (20.9%) mainly due to higher raw material
                costs.


                Exhibit 4: Quarterly OPM trend

                   (%)
                  20.0

                  19.5              19.5

                  19.0

                  18.5                                             18.5                        18.4
                                                    18.4
                  18.0
                                                                                17.9
                  17.5

                  17.0
                            4QFY2009       1QFY2010        2QFY2010       3QFY2010     4QFY2010

                Source: Company, Angel Research


                Bottom-line increases on tax reversal and higher other income: In 4QFY2010, PCL
                reported net profit of Rs41cr (Rs27cr), up 50.2% yoy on the back of higher other
                income, which stood at Rs13cr (Rs1cr) and tax reversal of Rs6cr. For FY2010, the
                net profit fell 14.9% to Rs94cr (Rs110cr) largely on the back of weak 1HFY2010.


July 22, 2010                                                                                         3
Polyplex Corporation | 4QFY2010 Result Update


                Exhibit 5: Strong turnaround in Net Profit
                  (Rs cr)                                                                    (%)
                  45                                                                 12.7    14
                  40                                                                         12
                                                                                    41
                  35
                                   10.1                                                      10
                  30                                                      8.2
                  25                                           7.2                           8
                              27                                          25
                  20                                                                         6
                                                              21
                  15
                                              2.3                                            4
                  10
                   5                                                                         2
                                             7
                   0                                                                         0
                            4QFY2009      1QFY2010      2QFY2010       3QFY2010   4QFY2010
                                           Net Profit (LHS)          NPM (RHS)
                Source: Company, Angel Research


July 22, 2010                                                                                    4
Polyplex Corporation | 4QFY2010 Result Update


                Investment Rationale
                Capacity expansion to drive robust growth in revenues: PCL has recently forayed
                into the lucrative, high-growth BOPP and cast polypropylene (CPP) segments. In
                FY2010, global demand for BOPP far exceeded supply, with an estimated BOPP
                production of ~6,046kilo tonne/year v/s ~6,648kilo tonne/year of demand. To
                meet such growing demand, PCL has set up new BOPP capacity of 35,000tpa in
                India as well as a new 10,000 tpa CPP plant in Thailand. In PET films, PCL
                increased capacity in India by 155% in FY2010. Overall, on the back of the
                company's capacity expansion moves, we expect it to post 19% CAGR in sales over
                FY2010-12E.

                Valuation - Available at discount to subsidiary (PTL) and peers: PCL holds 70%
                stake in its listed Thailand subsidiary Polyplex Thailand (PTL), which has a market
                cap of Rs950cr and is available at 1.3x P/BV. However, PCL has a market cap of
                Rs480cr or 0.7x FY2010E P/BV, which is at more than 50% discount to PTL's
                market cap and at a discount of nearly 28% to PCL's 70% stake in PTL, which
                works out to around Rs665cr. In comparison to its peers too, PCL is available at
                inexpensive valuations of 0.5x FY2012E P/BV, with Cosmo Films, Jindal Poly and
                Ester Industries trading between 0.8x-1.1x FY2010E P/BV, respectively. Over the
                past five years, PCL has traded in the range of 0.3-0.7x one-year forward P/BV,
                considering the 26% CAGR in earnings over FY2010-12E, we value PCL at the
                upper band (0.7x) FY2012E P/BV.

                Outlook

                PCL is well placed to cater to future demand on account of having one the largest
                PET film production capacities in the world, which is complemented by its excellent
                geographical reach through its plants in Thailand, Turkey and India. Pertinently,
                PCL garners a major part of its revenues from the packaging industry, which is
                expected to register around 15% CAGR over FY2010-12E. Moreover, the
                company's foray into the BOPP segment is expected to yield good returns for it, as
                demand for BOPP far exceeds supply. The company's profitability is expected to
                improve with the company expanding capacity of its PET film unit in India along
                with the setting up of new BOPP and cast polypropylene (CPP) units.


                Exhibit 6: Key Assumptions
                                                                                  Estimates
                 (%)                                                        FY2011        FY2012
                 Sales Growth                                                  29.3            9.6
                 Capacity Utilisation-BOPP                                     60.0           85.0
                                    -CPP                                       50.0           70.0
                 Operating Margins                                             18.5           19.0
                Source: Company, Angel Research


July 22, 2010                                                                                    5
Polyplex Corporation | 4QFY2010 Result Update


                Exhibit 7: One-year forward P/BV band
                  600
                  500
                  400
                  300
                  200
                  100
                    0


                        Jun-04


                                          Jun-05


                                                              Jun-06


                                                                                 Jun-07


                                                                                                    Jun-08


                                                                                                                         Jun-09


                                                                                                                                           Jun-10
                                 Dec-04


                                                   Dec-05


                                                                       Dec-06


                                                                                           Dec-07


                                                                                                                Dec-08


                                                                                                                                  Dec-09
                                          Price             0.2x          0.4x            0.6x               0.8x        1x

                Source: Company, Angel Research


July 22, 2010                                                                                                                               6
Polyplex Corporation | 4QFY2010 Result Update


                Profit and Loss Statement (Consolidated)
                Y/E March (Rs cr)               FY07     FY08     FY09    FY10     FY11E    FY12E
                Net Sales                         767    1,001    1,121   1,223    1,581    1,733
                % chg                           44.36    30.51    11.92    9.14    29.27     9.62
                Total Expenditure                 674     834      886      999    1,289    1,404
                Net Raw Materials                 550     691      681      771     996     1,092
                Other Mfg costs                 126.7    144.9    198.6   277.2    308.3    329.3
                Other                            (2.8)    (1.9)     6.2   (48.6)   (15.8)   (17.3)
                EBITDA                           92.9    167.6    234.6   223.7    292.2    328.9
                % chg                            7.77    80.55    39.92   (4.64)   30.62    12.58
                (% of Net Sales)                 12.1     16.7     20.9    18.3     18.5     19.0
                Depreciation& Amortisation       35.1     21.2     54.0    59.9     62.5     65.6
                EBIT                             57.7    146.5    180.5   163.8    229.7    263.3
                % chg                            (3.2)   153.8     23.3    (9.3)    40.2     14.6
                (% of Net Sales)                  7.5     14.6     16.1    13.4     14.5     15.2
                Interest & other Charges         20.4     19.4     35.3    24.8     46.5     38.6
                Other Income                     10.7      9.9     20.6    17.3     19.0     18.1
                (% of PBT)                       22.2      7.2     12.4    11.1      9.4      7.5
                Recurring PBT                    48.0    137.0    165.9   156.3    202.1    242.8
                % chg                           (16.6)   181.9     22.4    (5.8)    29.3     20.1
                PBT (reported)                   48.0    137.0    165.9   156.3    202.1    242.8
                Tax                               3.5      5.1     11.9    19.0     20.2     24.3
                (% of PBT)                        7.3      3.7      7.1    12.2     10.0     10.0
                PAT (reported)                   44.5    131.9    154.0   137.3    181.9    218.5
                Less: Minority interest (MI)     12.7     30.4     43.6    43.3     57.4     69.0
                PAT after MI (reported)          31.9    101.6    110.4    94.0    124.5    149.6
                ADJ. PAT                         31.9    101.6    110.4    94.0    124.5    149.6
                % chg                           (16.6)   213.6     10.4   (14.9)    32.5     20.1
                (% of Net Sales)                  4.2     10.1      9.9     7.7      7.9      8.6
                Basic EPS (Rs)                   21.8     62.6     69.0    58.8     77.8     93.5
                Fully Diluted EPS (Rs)           21.8     62.6     69.0    58.8     77.8     93.5
                % chg                           (16.6)   187.2     10.4   (14.9)    32.5     20.1


July 22, 2010                                                                                  7
Polyplex Corporation | 4QFY2010 Result Update


                Exhibit 8: Balance Sheet (Consolidated)
                Y/E March (Rs cr)                FY07      FY08            FY09        FY10E    FY11E    FY12E
                SOURCES OF FUNDS
                Equity Share Capital               15           17           17          17        17       17
                Reserves& Surplus                 392          483          622         701      811       945
                Shareholders Funds                407          500          639         718      827       962
                Minority Interest                 138          158          198         241      299       368
                Total Loans                       335          455          681         854      696       591
                Deferred Tax Liability             16           14           15            -        -        -
                Total Liabilities                 897      1,127           1,533       1,813    1,823    1,921
                APPLICATION OF FUNDS
                Gross Block                       827          825         1,205       1,643    1,715    1,800
                Less: Acc. Depreciation           191          227          293         353      415       481
                Net Block                         636          598          912        1,290    1,299    1,320
                Capital Work-in-Progress           26          264          218          72         -        -
                Goodwill                            1            0            1            1        1        1
                Investments                        52           15           50          50        50       50
                Current Assets                    291          390          503         568      683       781
                Cash                               29           20           93         121      115       159
                Loans & Advances                   28           43           52          57        63       69
                Inventories                       106          122          160         174      225       247
                Debtors                           128          205          198         216      279       306
                Current liabilities               110          150          153         168      210       231
                Net Current Assets                181          241          350         401      473       551
                Mis. Exp. not written off           0            8            3            -        -        -
                Total Assets                      897      1,127           1,533       1,813    1,823    1,921


                Cash flow Statement (Consolidated)
                Y/E March (Rs cr)                   FY07        FY08         FY09 FY10E         FY11E    FY12E
                Profit before tax                        37      126          145        139      183     225
                Depreciation                             35          21        54         60       63      66
                Change in Working Capital                 5      (68)         (36)       (21)     (75)    (32)
                Other income                             11          10        21         17       19      18
                Direct taxes paid                         6           1            3       5       12      19
                Cash Flow from Operations                83          88       181        190      178     258
                (Inc)./ Dec. in Fixed Assets        (159)       (236)        (333)      (292)        -    (86)
                (Inc)./ Dec. in Investments             (23)         37       (35)          -        -       -
                (Inc)./ Dec. in loans and adv.           15      (16)          (9)        (5)      (6)     (6)
                Cash Flow from Investing            (167)       (215)        (377)      (297)      (6)    (92)
                Issue of Equity                            -           -           -        -        -       -
                Inc./(Dec.) in loans                     37      120          226        173     (158)   (105)
                Dividend Paid (Incl. Tax)                (7)     (11)         (13)       (15)     (15)    (15)
                Others                                   60          10        56        (23)      (5)     (2)
                Cash Flow from Financing                 91      118          269        135     (178)   (122)
                Inc./(Dec.) in Cash                       6          (9)       73         27       (6)     44
                Opening Cash balances                    23          29        20         93      121     115
                Closing Cash balances                    29          20        93        121      115     159


July 22, 2010                                                                                                    8
Polyplex Corporation | 4QFY2010 Result Update


                Key Ratios
                Y/E March                                FY07 FY08 FY09 FY10E FY11E FY12E
                Valuation Ratio (x)
                P/E (on FDEPS)                           13.8    4.8    4.4    5.1    3.9    3.2
                P/E (on basic, reported EPS)             13.8    4.8    4.4    5.1    3.9    3.2
                P/CEPS                                    6.6    3.9    2.9    3.1    2.6    2.2
                P/BV                                      1.1    1.0    0.8    0.7    0.6    0.5
                Dividend yield (%)                        1.3    2.0    2.3    2.7    2.7    2.7
                Market cap. / Sales                       0.6    0.5    0.4    0.4    0.3    0.3
                EV/Sales                                  1.0    0.9    0.9    1.0    0.7    0.5
                EV/EBITDA                                 8.0    5.4    4.5    5.4    3.6    2.8
                EV / Total Assets                         0.8    0.8    0.7    0.7    0.6    0.5
                Per Share Data (Rs)
                EPS (Basic)                               22     63     69     59     78     94
                EPS (fully diluted)                       22     63     69     59     78     94
                Cash EPS                                  56    115    144    131    164    191
                DPS                                       4.0    6.0    7.0    8.0    8.0    8.0
                Book Value                               278    313    399    449    517    601
                ROE Decomposition (%)
                EBIT margin                               7.5   14.6   16.1   13.4   14.5   15.2
                Tax retention ratio                      92.7   96.3   92.9   87.8   90.0   90.0
                Asset turnover (x)                        0.9    0.9    0.8    0.7    1.0    1.0
                ROIC (Post-tax)                           6.6   12.9   12.1    8.8   12.5   13.8
                Cost of Debt (Post Tax)                   6.0    4.7    5.8    2.8    5.4    5.4
                Leverage (x)                              0.6    0.7    0.7    0.9    0.7    0.5
                Operating ROE                             6.9   18.4   16.8   13.8   17.7   17.9
                Returns (%)
                ROCE (Pre-tax)                            6.9   14.5   13.6    9.8   12.6   14.1
                Angel ROIC (Pre-tax)                      7.3   17.7   15.4   10.4   13.9   15.4
                ROE                                       8.5   22.4   19.4   13.9   16.1   16.7
                Turnover ratios (x)
                Inventory / Sales (days)                  53     41     46     50     46     50
                Receivables (days)                        54     61     66     62     57     62
                Payables (days)                           43     42     41     38     35     38
                Working capital cycle (ex-cash) (days)    78     68     78     80     74     79


July 22, 2010                                                                                  9
Polyplex Corporation | 4QFY2010 Result Update


  Research Team Tel: 022 - 4040 3800               E-mail: research@angeltrade.com                   Website: www.angeltrade.com

  DISCLAIMER

 This document is solely for the personal information of the recipient, and must not be singularly used as the basis of any investment
 decision. Nothing in this document should be construed as investment or financial advice. Each recipient of this document should make
 such investigations as they deem necessary to arrive at an independent evaluation of an investment in the securities of the companies
 referred to in this document (including the merits and risks involved), and should consult their own advisors to determine the merits and
 risks of such an investment.

 Angel Broking Limited, its affiliates, directors, its proprietary trading and investment businesses may, from time to time, make
 investment decisions that are inconsistent with or contradictory to the recommendations expressed herein. The views contained in this
 document are those of the analyst, and the company may or may not subscribe to all the views expressed within.

 Reports based on technical and derivative analysis center on studying charts of a stock's price movement, outstanding positions and
 trading volume, as opposed to focusing on a company's fundamentals and, as such, may not match with a report on a company's
 fundamentals.

 The information in this document has been printed on the basis of publicly available information, internal data and other reliable
 sources believed to be true, but we do not represent that it is accurate or complete and it should not be relied on as such, as this
 document is for general guidance only. Angel Broking Limited or any of its affiliates/ group companies shall not be in any way
 responsible for any loss or damage that may arise to any person from any inadvertent error in the information contained in this report.
 Angel Broking Limited has not independently verified all the information contained within this document. Accordingly, we cannot testify,
 nor make any representation or warranty, express or implied, to the accuracy, contents or data contained within this document. While
 Angel Broking Limited endeavours to update on a reasonable basis the information discussed in this material, there may be regulatory,
 compliance, or other reasons that prevent us from doing so.
 This document is being supplied to you solely for your information, and its contents, information or data may not be reproduced,
 redistributed or passed on, directly or indirectly.

 Angel Broking Limited and its affiliates may seek to provide or have engaged in providing corporate finance, investment banking or
 other advisory services in a merger or specific transaction to the companies referred to in this report, as on the date of this report or in
 the past.

 Neither Angel Broking Limited, nor its directors, employees or affiliates shall be liable for any loss or damage that may arise from or in
 connection with the use of this information.

 Note: Please refer to the important `Stock Holding Disclosure' report on the Angel website (Research Section). Also, please
 refer to the latest update on respective stocks for the disclosure status in respect of those stocks. Angel Broking Limited and
 its affiliates may have investment positions in the stocks recommended in this report.


 Disclosure of Interest Statement                                         Polyplex Corporation
 1. Analyst ownership of the stock                                                 No
 2. Angel and its Group companies ownership of the stock                           Yes
 3. Angel and its Group companies' Directors ownership of the stock                Yes
 4. Broking relationship with company covered                                      No

 Note: We have not considered any Exposure below Rs 1 lakh for Angel, its Group companies and Directors.


 Ratings (Returns) :             Buy (> 15%)                      Accumulate (5% to 15%)                 Neutral (-5 to 5%)
                                 Reduce (-5% to 15%)              Sell (< -15%)


July 22, 2010                                                                                                                             10

Polyplex Corporation

  • 1.
    4QFY2010 Result Update| Packaging-Polyester Films July 22, 2010 Polyplex Corporation BUY CMP Rs300 Performance Highlights Target Price Rs418 (Rs cr) 4QFY2010 4QFY2009 %chg (yoy) 3QFY2010 %chg (qoq) Investment Period 12 Months Net Sales 321 269 19.4 310 3.4 Stock Info EBITDA 59 52 13.0 55 6.7 Sector Packaging EBITDA Margin (%) 18.4 19.5 (104)bp 17.9 58bp Market Cap (Rs cr) 480 Net Profit 41 27 50.2 25 59.8 Beta 0.4 Source: Company, Angel research 52 Week High / Low 305/164 Polyplex Corporation (PCL) has reported higher-than-estimated 4QFY2010 Avg. Daily Volume 6472 numbers. Net sales grew 19.4% yoy to Rs321cr (Rs269cr). The company Face Value (Rs) 10 reported 104bp contraction in OPM to 18.4% (19.5%), but above our estimate BSE Sensex 18,113 of 17.9%, mainly due to the increase in raw material costs. Net profit jumped by Nifty 5,442 50.2% yoy to Rs41cr (Rs27cr) on the back of the substantial increase in other Reuters Code PLYP.BO income. Bloomberg Code PPC@IN FY2010 results above expectation: PCL reported 9.1% yoy growth in net sales to Rs1223cr mainly on the back of better economic conditions, which led to a rise Shareholding Pattern (%) in capacity utilizations to 93% in FY2010 v/s 85% in FY2009. PCL reported OPM of 18.3% (20.9%) for FY2010, which contracted by 260bp yoy but was Promoters 46.9 slightly above our estimate of 18.2%. Net profit for FY2010 declined by 14.9% MF / Banks / Indian Fls 19.2 to Rs94cr (Rs110cr) but was still above our expectation of Rs72cr. FII / NRIs / OCBs 11.6 Indian Public / Others 22.3 Outlook and Valuation: PCL holds 70% stake in its listed Thailand subsidiary Polyplex Thailand (PTL), which has a market cap of Rs950cr and is available at 1.3x P/BV. However, PCL has a market cap of Rs480cr or 0.7x FY2010E P/BV, Abs. (%) 3m 1yr 3yr which is at more than 50% discount to PTL's market cap and at a discount of Sensex 3.1 22.0 16.4 nearly 28% to PCL's 70% stake in PTL, which works out to around Rs665cr. In Polyplex 34.2 60.9 93.8 comparison to its peers too, PCL is available at inexpensive valuations of 0.5x FY2012E P/BV, with Cosmo Films, Jindal Poly and Ester Industries trading between 0.8x-1.1x FY2010E P/BV, respectively. Considering the 26% estimated CAGR in earnings over FY2010-12E, we maintain a Buy on the stock, with a Target Price of Rs418. Key Financials (Consolidated) Y/E March (Rs cr) FY2009 FY2010 FY2011E FY2012E Net Sales 1,121 1,223 1,581 1,733 % chg 11.9 9.1 29.3 9.6 Net Profit 110 94 124 150 % chg 10.4 (14.9) 32.5 20.1 EBITDA Margin (%) 20.9 18.3 18.5 19.0 FDEPS (Rs) 69.0 58.8 77.8 93.5 P/E (x) 4.4 5.1 3.9 3.2 RoE (%) 19.4 13.9 16.1 16.7 RoCE (%) 14 10 13 14 Sharan Lillaney P/BV (x) 0.8 0.7 0.6 0.5 022-4040 3800 Ext: 338 EV/Sales (x) 0.9 1.0 0.7 0.5 sharanb.lillaney@angeltrade.com EV/EBITDA (x) 4.5 4.1 2.6 1.8 Source: Company, Angel Research Please refer to important disclosures at the end of this report 1
  • 2.
    Polyplex Corporation |4QFY2010 Result Update Exhibit 1: 4QFY2010 performance (Rs cr) 4QFY2010 3QFY2010 %chg 4QFY2009 %chg FY2010 FY2009 %chg 4Q 3Q (qoq) 4Q (yoy) (yoy) Net Sales 321 310 3.4 269 19.4 1,223 1,121 9.1 Total Expenditure 262 255 2.7 216 21.0 999 886 12.8 EBITDA 59 55 6.7 52 13.0 224 235 (4.6) Depreciation 16 15 5.0 14 14.1 60 54 10.8 EBIT 44 41 7.4 39 12.6 164 181 (9.3) Interest 7 5 36.1 8 (5.9) 25 35 (29.6) Other Income 13 1 1,562.0 8 59.3 17 21 (16.0) PBT 49 36 37.3 39 26.3 156 166 (5.8) Tax (6) (0) - 2 - 19 12 61.0 Minority Interest 14 10 36.8 10 41.9 43 44 (0.6) Net Profit 41 25 59.8 27 50.2 94 110 (14.9) Basic EPS (Rs) 25 16 59.8 17 50.2 59 69 (14.9) Source: Company, Angel Research Exhibit 2: 4QFY2010- Actual v/s Angel estimates Rs cr Estimates Actual Variation (%) Net Sales 299 321 7.5 EBITDA 54 59 9.1 EBITDA Margin (%) 17.9 18.4 2.8 Tax - (6) - Net Profit 19 41 115.0 Source: Company, Angel Research Revenues up 19.4%, substantially above expectation: The company’s net sales grew by 19.4% yoy to Rs321cr (Rs269cr) for the quarter, driven by better capacity utilisation and commencement of new biaxially oriented polypropylene (BOPP) and PET units in 4QFY2010. On qoq basis, the company managed a marginal 3.4% growth in revenues. For FY2010, capacity utilisation stood at 93% v/s 85% in FY2009. For FY2010, revenues increased marginally by 9.1% to Rs1,223cr (Rs1,121cr). July 22, 2010 2
  • 3.
    Polyplex Corporation |4QFY2010 Result Update Exhibit 3: Quarterly Revenue trend (Rs cr) (%) 330 25 320 20 310 321 15 300 310 301 10 290 290 5 280 0 270 260 269 (5) 250 (10) 240 (15) 4QFY2009 1QFY2010 2QFY2010 3QFY2010 4QFY2010 Net Sales (LHS) Growth (qoq) Growth (yoy) Source: Company, Angel Research OPM contracts yoy on higher raw materials costs but increases qoq: PCL reported 104bp contraction in OPM to 18.4% (19.5%) for the quarter, which however exceeded our estimate of 17.9%. On a qoq basis, the company managed to increase its OPM by 58bp on strong demand for PET films. For FY2010, the company’s OPM declined to 18.3% (20.9%) mainly due to higher raw material costs. Exhibit 4: Quarterly OPM trend (%) 20.0 19.5 19.5 19.0 18.5 18.5 18.4 18.4 18.0 17.9 17.5 17.0 4QFY2009 1QFY2010 2QFY2010 3QFY2010 4QFY2010 Source: Company, Angel Research Bottom-line increases on tax reversal and higher other income: In 4QFY2010, PCL reported net profit of Rs41cr (Rs27cr), up 50.2% yoy on the back of higher other income, which stood at Rs13cr (Rs1cr) and tax reversal of Rs6cr. For FY2010, the net profit fell 14.9% to Rs94cr (Rs110cr) largely on the back of weak 1HFY2010. July 22, 2010 3
  • 4.
    Polyplex Corporation |4QFY2010 Result Update Exhibit 5: Strong turnaround in Net Profit (Rs cr) (%) 45 12.7 14 40 12 41 35 10.1 10 30 8.2 25 7.2 8 27 25 20 6 21 15 2.3 4 10 5 2 7 0 0 4QFY2009 1QFY2010 2QFY2010 3QFY2010 4QFY2010 Net Profit (LHS) NPM (RHS) Source: Company, Angel Research July 22, 2010 4
  • 5.
    Polyplex Corporation |4QFY2010 Result Update Investment Rationale Capacity expansion to drive robust growth in revenues: PCL has recently forayed into the lucrative, high-growth BOPP and cast polypropylene (CPP) segments. In FY2010, global demand for BOPP far exceeded supply, with an estimated BOPP production of ~6,046kilo tonne/year v/s ~6,648kilo tonne/year of demand. To meet such growing demand, PCL has set up new BOPP capacity of 35,000tpa in India as well as a new 10,000 tpa CPP plant in Thailand. In PET films, PCL increased capacity in India by 155% in FY2010. Overall, on the back of the company's capacity expansion moves, we expect it to post 19% CAGR in sales over FY2010-12E. Valuation - Available at discount to subsidiary (PTL) and peers: PCL holds 70% stake in its listed Thailand subsidiary Polyplex Thailand (PTL), which has a market cap of Rs950cr and is available at 1.3x P/BV. However, PCL has a market cap of Rs480cr or 0.7x FY2010E P/BV, which is at more than 50% discount to PTL's market cap and at a discount of nearly 28% to PCL's 70% stake in PTL, which works out to around Rs665cr. In comparison to its peers too, PCL is available at inexpensive valuations of 0.5x FY2012E P/BV, with Cosmo Films, Jindal Poly and Ester Industries trading between 0.8x-1.1x FY2010E P/BV, respectively. Over the past five years, PCL has traded in the range of 0.3-0.7x one-year forward P/BV, considering the 26% CAGR in earnings over FY2010-12E, we value PCL at the upper band (0.7x) FY2012E P/BV. Outlook PCL is well placed to cater to future demand on account of having one the largest PET film production capacities in the world, which is complemented by its excellent geographical reach through its plants in Thailand, Turkey and India. Pertinently, PCL garners a major part of its revenues from the packaging industry, which is expected to register around 15% CAGR over FY2010-12E. Moreover, the company's foray into the BOPP segment is expected to yield good returns for it, as demand for BOPP far exceeds supply. The company's profitability is expected to improve with the company expanding capacity of its PET film unit in India along with the setting up of new BOPP and cast polypropylene (CPP) units. Exhibit 6: Key Assumptions Estimates (%) FY2011 FY2012 Sales Growth 29.3 9.6 Capacity Utilisation-BOPP 60.0 85.0 -CPP 50.0 70.0 Operating Margins 18.5 19.0 Source: Company, Angel Research July 22, 2010 5
  • 6.
    Polyplex Corporation |4QFY2010 Result Update Exhibit 7: One-year forward P/BV band 600 500 400 300 200 100 0 Jun-04 Jun-05 Jun-06 Jun-07 Jun-08 Jun-09 Jun-10 Dec-04 Dec-05 Dec-06 Dec-07 Dec-08 Dec-09 Price 0.2x 0.4x 0.6x 0.8x 1x Source: Company, Angel Research July 22, 2010 6
  • 7.
    Polyplex Corporation |4QFY2010 Result Update Profit and Loss Statement (Consolidated) Y/E March (Rs cr) FY07 FY08 FY09 FY10 FY11E FY12E Net Sales 767 1,001 1,121 1,223 1,581 1,733 % chg 44.36 30.51 11.92 9.14 29.27 9.62 Total Expenditure 674 834 886 999 1,289 1,404 Net Raw Materials 550 691 681 771 996 1,092 Other Mfg costs 126.7 144.9 198.6 277.2 308.3 329.3 Other (2.8) (1.9) 6.2 (48.6) (15.8) (17.3) EBITDA 92.9 167.6 234.6 223.7 292.2 328.9 % chg 7.77 80.55 39.92 (4.64) 30.62 12.58 (% of Net Sales) 12.1 16.7 20.9 18.3 18.5 19.0 Depreciation& Amortisation 35.1 21.2 54.0 59.9 62.5 65.6 EBIT 57.7 146.5 180.5 163.8 229.7 263.3 % chg (3.2) 153.8 23.3 (9.3) 40.2 14.6 (% of Net Sales) 7.5 14.6 16.1 13.4 14.5 15.2 Interest & other Charges 20.4 19.4 35.3 24.8 46.5 38.6 Other Income 10.7 9.9 20.6 17.3 19.0 18.1 (% of PBT) 22.2 7.2 12.4 11.1 9.4 7.5 Recurring PBT 48.0 137.0 165.9 156.3 202.1 242.8 % chg (16.6) 181.9 22.4 (5.8) 29.3 20.1 PBT (reported) 48.0 137.0 165.9 156.3 202.1 242.8 Tax 3.5 5.1 11.9 19.0 20.2 24.3 (% of PBT) 7.3 3.7 7.1 12.2 10.0 10.0 PAT (reported) 44.5 131.9 154.0 137.3 181.9 218.5 Less: Minority interest (MI) 12.7 30.4 43.6 43.3 57.4 69.0 PAT after MI (reported) 31.9 101.6 110.4 94.0 124.5 149.6 ADJ. PAT 31.9 101.6 110.4 94.0 124.5 149.6 % chg (16.6) 213.6 10.4 (14.9) 32.5 20.1 (% of Net Sales) 4.2 10.1 9.9 7.7 7.9 8.6 Basic EPS (Rs) 21.8 62.6 69.0 58.8 77.8 93.5 Fully Diluted EPS (Rs) 21.8 62.6 69.0 58.8 77.8 93.5 % chg (16.6) 187.2 10.4 (14.9) 32.5 20.1 July 22, 2010 7
  • 8.
    Polyplex Corporation |4QFY2010 Result Update Exhibit 8: Balance Sheet (Consolidated) Y/E March (Rs cr) FY07 FY08 FY09 FY10E FY11E FY12E SOURCES OF FUNDS Equity Share Capital 15 17 17 17 17 17 Reserves& Surplus 392 483 622 701 811 945 Shareholders Funds 407 500 639 718 827 962 Minority Interest 138 158 198 241 299 368 Total Loans 335 455 681 854 696 591 Deferred Tax Liability 16 14 15 - - - Total Liabilities 897 1,127 1,533 1,813 1,823 1,921 APPLICATION OF FUNDS Gross Block 827 825 1,205 1,643 1,715 1,800 Less: Acc. Depreciation 191 227 293 353 415 481 Net Block 636 598 912 1,290 1,299 1,320 Capital Work-in-Progress 26 264 218 72 - - Goodwill 1 0 1 1 1 1 Investments 52 15 50 50 50 50 Current Assets 291 390 503 568 683 781 Cash 29 20 93 121 115 159 Loans & Advances 28 43 52 57 63 69 Inventories 106 122 160 174 225 247 Debtors 128 205 198 216 279 306 Current liabilities 110 150 153 168 210 231 Net Current Assets 181 241 350 401 473 551 Mis. Exp. not written off 0 8 3 - - - Total Assets 897 1,127 1,533 1,813 1,823 1,921 Cash flow Statement (Consolidated) Y/E March (Rs cr) FY07 FY08 FY09 FY10E FY11E FY12E Profit before tax 37 126 145 139 183 225 Depreciation 35 21 54 60 63 66 Change in Working Capital 5 (68) (36) (21) (75) (32) Other income 11 10 21 17 19 18 Direct taxes paid 6 1 3 5 12 19 Cash Flow from Operations 83 88 181 190 178 258 (Inc)./ Dec. in Fixed Assets (159) (236) (333) (292) - (86) (Inc)./ Dec. in Investments (23) 37 (35) - - - (Inc)./ Dec. in loans and adv. 15 (16) (9) (5) (6) (6) Cash Flow from Investing (167) (215) (377) (297) (6) (92) Issue of Equity - - - - - - Inc./(Dec.) in loans 37 120 226 173 (158) (105) Dividend Paid (Incl. Tax) (7) (11) (13) (15) (15) (15) Others 60 10 56 (23) (5) (2) Cash Flow from Financing 91 118 269 135 (178) (122) Inc./(Dec.) in Cash 6 (9) 73 27 (6) 44 Opening Cash balances 23 29 20 93 121 115 Closing Cash balances 29 20 93 121 115 159 July 22, 2010 8
  • 9.
    Polyplex Corporation |4QFY2010 Result Update Key Ratios Y/E March FY07 FY08 FY09 FY10E FY11E FY12E Valuation Ratio (x) P/E (on FDEPS) 13.8 4.8 4.4 5.1 3.9 3.2 P/E (on basic, reported EPS) 13.8 4.8 4.4 5.1 3.9 3.2 P/CEPS 6.6 3.9 2.9 3.1 2.6 2.2 P/BV 1.1 1.0 0.8 0.7 0.6 0.5 Dividend yield (%) 1.3 2.0 2.3 2.7 2.7 2.7 Market cap. / Sales 0.6 0.5 0.4 0.4 0.3 0.3 EV/Sales 1.0 0.9 0.9 1.0 0.7 0.5 EV/EBITDA 8.0 5.4 4.5 5.4 3.6 2.8 EV / Total Assets 0.8 0.8 0.7 0.7 0.6 0.5 Per Share Data (Rs) EPS (Basic) 22 63 69 59 78 94 EPS (fully diluted) 22 63 69 59 78 94 Cash EPS 56 115 144 131 164 191 DPS 4.0 6.0 7.0 8.0 8.0 8.0 Book Value 278 313 399 449 517 601 ROE Decomposition (%) EBIT margin 7.5 14.6 16.1 13.4 14.5 15.2 Tax retention ratio 92.7 96.3 92.9 87.8 90.0 90.0 Asset turnover (x) 0.9 0.9 0.8 0.7 1.0 1.0 ROIC (Post-tax) 6.6 12.9 12.1 8.8 12.5 13.8 Cost of Debt (Post Tax) 6.0 4.7 5.8 2.8 5.4 5.4 Leverage (x) 0.6 0.7 0.7 0.9 0.7 0.5 Operating ROE 6.9 18.4 16.8 13.8 17.7 17.9 Returns (%) ROCE (Pre-tax) 6.9 14.5 13.6 9.8 12.6 14.1 Angel ROIC (Pre-tax) 7.3 17.7 15.4 10.4 13.9 15.4 ROE 8.5 22.4 19.4 13.9 16.1 16.7 Turnover ratios (x) Inventory / Sales (days) 53 41 46 50 46 50 Receivables (days) 54 61 66 62 57 62 Payables (days) 43 42 41 38 35 38 Working capital cycle (ex-cash) (days) 78 68 78 80 74 79 July 22, 2010 9
  • 10.
    Polyplex Corporation |4QFY2010 Result Update Research Team Tel: 022 - 4040 3800 E-mail: research@angeltrade.com Website: www.angeltrade.com DISCLAIMER This document is solely for the personal information of the recipient, and must not be singularly used as the basis of any investment decision. Nothing in this document should be construed as investment or financial advice. Each recipient of this document should make such investigations as they deem necessary to arrive at an independent evaluation of an investment in the securities of the companies referred to in this document (including the merits and risks involved), and should consult their own advisors to determine the merits and risks of such an investment. Angel Broking Limited, its affiliates, directors, its proprietary trading and investment businesses may, from time to time, make investment decisions that are inconsistent with or contradictory to the recommendations expressed herein. The views contained in this document are those of the analyst, and the company may or may not subscribe to all the views expressed within. Reports based on technical and derivative analysis center on studying charts of a stock's price movement, outstanding positions and trading volume, as opposed to focusing on a company's fundamentals and, as such, may not match with a report on a company's fundamentals. The information in this document has been printed on the basis of publicly available information, internal data and other reliable sources believed to be true, but we do not represent that it is accurate or complete and it should not be relied on as such, as this document is for general guidance only. Angel Broking Limited or any of its affiliates/ group companies shall not be in any way responsible for any loss or damage that may arise to any person from any inadvertent error in the information contained in this report. Angel Broking Limited has not independently verified all the information contained within this document. Accordingly, we cannot testify, nor make any representation or warranty, express or implied, to the accuracy, contents or data contained within this document. While Angel Broking Limited endeavours to update on a reasonable basis the information discussed in this material, there may be regulatory, compliance, or other reasons that prevent us from doing so. This document is being supplied to you solely for your information, and its contents, information or data may not be reproduced, redistributed or passed on, directly or indirectly. Angel Broking Limited and its affiliates may seek to provide or have engaged in providing corporate finance, investment banking or other advisory services in a merger or specific transaction to the companies referred to in this report, as on the date of this report or in the past. Neither Angel Broking Limited, nor its directors, employees or affiliates shall be liable for any loss or damage that may arise from or in connection with the use of this information. Note: Please refer to the important `Stock Holding Disclosure' report on the Angel website (Research Section). Also, please refer to the latest update on respective stocks for the disclosure status in respect of those stocks. Angel Broking Limited and its affiliates may have investment positions in the stocks recommended in this report. Disclosure of Interest Statement Polyplex Corporation 1. Analyst ownership of the stock No 2. Angel and its Group companies ownership of the stock Yes 3. Angel and its Group companies' Directors ownership of the stock Yes 4. Broking relationship with company covered No Note: We have not considered any Exposure below Rs 1 lakh for Angel, its Group companies and Directors. Ratings (Returns) : Buy (> 15%) Accumulate (5% to 15%) Neutral (-5 to 5%) Reduce (-5% to 15%) Sell (< -15%) July 22, 2010 10