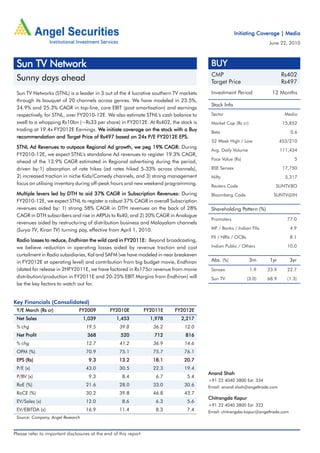
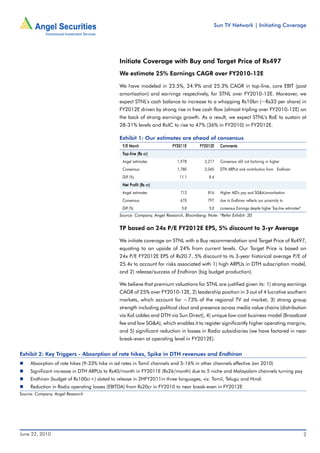
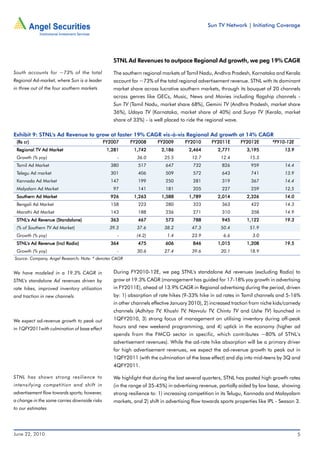
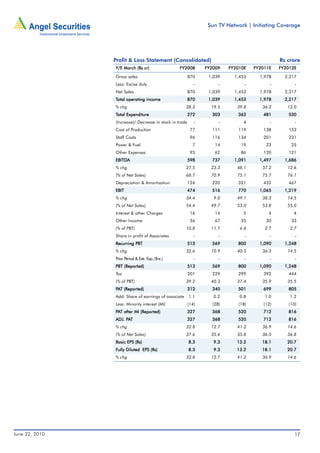
Initiating Coverage | Media
                                                                                                                   June 22, 2010


 Sun TV Network                                                                        BUY
                                                                                       CMP                                Rs402
 Sunny days ahead                                                                      Target Price                       Rs497
 Sun TV Networks (STNL) is a leader in 3 out of the 4 lucrative southern TV markets    Investment Period            12 Months
 through its bouquet of 20 channels across genres. We have modeled in 23.5%,
                                                                                       Stock Info
 24.9% and 25.3% CAGR in top-line, core EBIT (post amortisation) and earnings
 respectively, for STNL, over FY2010-12E. We also estimate STNL's cash balance to      Sector                               Media
 swell to a whopping Rs10bn (~Rs33 per share) in FY2012E. At Rs402, the stock is       Market Cap (Rs cr)                  15,852
 trading at 19.4x FY2012E Earnings. We initiate coverage on the stock with a Buy       Beta                                     0.6
                         Target Price
 recommendation and Target Price of Rs497 based on 24x P/E FY2012E EPS.     EPS.
                                                                                       52 Week High / Low                 453/210
 STNL Ad Revenues to outpace Regional Ad growth, we peg 19% CAGR: During
                                                                    CAGR:
                                                                                       Avg. Daily Volume                  111,434
 FY2010-12E, we expect STNL's standalone Ad revenues to register 19.3% CAGR,
                                                                                       Face Value (Rs)                            5
 ahead of the 13.9% CAGR estimated in Regional advertising during the period,
 driven by:1) absorption of rate hikes (ad rates hiked 5-33% across channels),         BSE Sensex                          17,750
 2) increased traction in niche Kids/Comedy channels, and 3) strong management         Nifty                                5,317
 focus on utilising inventory during off-peak hours and new weekend programming.       Reuters Code                   SUNTV.BO
 Multiple levers led by DTH to aid 37% CAGR in Subscription Revenues: During
                                            CAGR                                       Bloomberg Code                SUNTV@IN
 FY2010-12E, we expect STNL to register a robust 37% CAGR in overall Subscription
 revenues aided by: 1) strong 58% CAGR in DTH revenues on the back of 28%              Shareholding Pattern (%)
 CAGR in DTH subscribers and rise in ARPUs to Rs40, and 2) 20% CAGR in Analogue
                                                                                       Promoters                             77.0
 revenues aided by restructuring of distribution business and Malayalam channels
 (Surya TV, Kiran TV) turning pay, effective from April 1, 2010.                       MF / Banks / Indian FIIs                 4.9
                                                                                       FII / NRIs / OCBs                        8.1
 Radio losses to reduce, Endhiran the wild card in FY2011E: Beyond broadcasting,
                                                   FY2011E:
 we believe reduction in operating losses aided by revenue traction and cost           Indian Public / Others                10.0
 curtailment in Radio subsidiaries, Kal and SAFM (we have modeled in near breakeven
 in FY2012E at operating level) and contribution from big budget movie, Endhiran       Abs. (%)             3m      1yr         3yr
 (slated for release in 2HFY2011E, we have factored in Rs175cr revenue from movie      Sensex               1.9    23.9      22.7
 distribution/production in FY2011E and 20-25% EBIT Margins from Endhiran) will        Sun TV              (3.0)   68.9      (1.3)
 be the key factors to watch out for.


Key Financials (Consolidated)
 Y/E March (Rs cr)              FY2009         FY2010E            FY2011E   FY2012E
 Net Sales                         1,039           1,453            1,978     2,217
 % chg                              19.5            39.8             36.2      12.0
     Profit
 Net Profit                         368              520             712       816
 % chg                              12.7            41.2             36.9      14.6
 OPM (%)                            70.9            75.1             75.7      76.1
 EPS (Rs)                            9.3            13.2             18.1      20.7
 P/E (x)                            43.0            30.5             22.3      19.4
                                                                                      Anand Shah
 P/BV (x)                            9.3             8.4              6.7       5.4
                                                                                      +91 22 4040 3800 Ext: 334
 RoE (%)                            21.6            28.0             33.0      30.6   Email: anand.shah@angeltrade.com
 RoCE (%)                           30.2            39.8             46.8      43.7
                                                                                                 Kapur
                                                                                      Chitrangda Kapur
 EV/Sales (x)                       12.0             8.6              6.3       5.6
                                                                                      +91 22 4040 3800 Ext: 323
 EV/EBITDA (x)                      16.9            11.4              8.3       7.4   Email: chitrangdar.kapur@angeltrade.com
 Source: Company, Angel Research


Please refer to important disclosures at the end of this report
Sun TV Network | Initiating Coverage


                                              Initiate Coverage with Buy and Target Price of Rs497
                                              We estimate 25% Earnings CAGR over FY2010-12E

                                              We have modeled in 23.5%, 24.9% and 25.3% CAGR in top-line, core EBIT (post
                                              amortisation) and earnings respectively, for STNL over FY2010-12E. Moreover, we
                                              expect STNL's cash balance to increase to a whopping Rs10bn (~Rs33 per share) in
                                              FY2012E driven by strong rise in free cash flow (almost tripling over FY2010-12E) on
                                              the back of strong earnings growth. As a result, we expect STNL's RoE to sustain at
                                              28-31% levels and RoIC to rise to 47% (36% in FY2010) in FY2012E.

                                              Exhibit 1: Our estimates are ahead of consensus
                                                Y/E March                FY2011E       FY2012E    Comments
                                                Top-line (Rs cr)
                                                 op-line
                                                Angel estimates            1,978         2,217    Consensus still not factoring in higher
                                                Consensus                  1,780         2,045    DTH ARPUs and contribution from Endhiran
                                                Diff (%)                    11.1           8.4
                                                    Profit
                                                Net Profit (Rs cr)
                                                Angel estimates              712           816    Higher MD's pay and SG&A/amortisation
                                                Consensus                    670           797    due to Endhiran reflects our proximity to
                                                Diff (%)                     5.8            5.0   consensus Earnings despite higher Top-line estimates*
                                              Source: Company, Angel Research, Bloomberg; Note: *Refer Exhibit: 20


                                              TP based on 24x P/E FY2012E EPS, 5% discount to 3-yr Average

                                              We initiate coverage on STNL with a Buy recommendation and Target Price of Rs497,
                                              equating to an upside of 24% from current levels. Our Target Price is based on
                                              24x P/E FY2012E EPS of Rs20.7, 5% discount to its 3-year historical average P/E of
                                              25.4x to account for risks associated with 1) high ARPUs in DTH subscription model,
                                              and 2) release/success of Endhiran (big budget production).

                                              We believe that premium valuations for STNL are justified given its: 1) strong earnings
                                              CAGR of 25% over FY2010-12E, 2) leadership position in 3 out of 4 lucrative southern
                                              markets, which account for ~73% of the regional TV ad market, 3) strong group
                                              strength including political clout and presence across media value chains (distribution
                                              via Kal cables and DTH via Sun Direct), 4) unique low-cost business model (Broadcast
                                              fee and low SG&A), which enables it to register significantly higher operating margins,
                                              and 5) significant reduction in losses in Radio subsidiaries (we have factored in near
                                              break-even at operating level in FY2012E).


Exhibit 2: Key Triggers - Absorption of rate hikes, Spike in DTH revenues and Endhiran
     Absorption of rate hikes (9-33% hike in ad rates in Tamil channels and 5-16% in other channels effective Jan 2010)
     Significant increase in DTH ARPUs to Rs40/month in FY2011E (Rs26/month) due to 5 niche and Malayalam channels turning pay
     Endhiran (budget of Rs100cr+) slated to release in 2HFY2011in three languages, viz. Tamil, Telugu and Hindi
     Reduction in Radio operating losses (EBITDA) from Rs20cr in FY2010 to near break-even in FY2012E
Source: Company, Angel Research


June 22, 2010                                                                                                                                             2
Sun TV Network | Initiating Coverage


Exhibit 3: STNL trading below its 3yr avg P/E of 25x                                                                                                                                                                                                                Exhibit 4: STNL’s 3yr avg Prem over Sensex at 44%
 55.0                                                                                                                                                                                                                                                               250%

 50.0

 45.0                                                                                                                                                                                                                                                               200%

 40.0

 35.0                                                                                                                                                                                                                                                               150%

 30.0

 25.0                                                                                                                                                                                                                                                               100%

 20.0

 15.0                                                                                                                                                                                                                                                                50%

 10.0

   5.0                                                                                                                                                                                                                                                                0%


                                                                                                                                                                                                                                                                                       Jun-06
                                                                                                                                                                                                                                                                                                  Aug-06


                                                                                                                                                                                                                                                                                                                     Dec-06


                                                                                                                                                                                                                                                                                                                                                      Jun-07
                                                                                                                                                                                                                                                                                                                                                                  Aug-07


                                                                                                                                                                                                                                                                                                                                                                                    Dec-07


                                                                                                                                                                                                                                                                                                                                                                                                                    Jun-08
                                                                                                                                                                                                                                                                                                                                                                                                                             Aug-08


                                                                                                                                                                                                                                                                                                                                                                                                                                               Dec-08


                                                                                                                                                                                                                                                                                                                                                                                                                                                                                  Jun-09
                                                                                                                                                                                                                                                                                                                                                                                                                                                                                              Aug-09


                                                                                                                                                                                                                                                                                                                                                                                                                                                                                                                Dec-09
                                                                                                                                                                                                                                                                            Apr-06


                                                                                                                                                                                                                                                                                                            Oct-06


                                                                                                                                                                                                                                                                                                                              Feb-07
                                                                                                                                                                                                                                                                                                                                          Apr-07


                                                                                                                                                                                                                                                                                                                                                                           Oct-07


                                                                                                                                                                                                                                                                                                                                                                                             Feb-08
                                                                                                                                                                                                                                                                                                                                                                                                       Apr-08


                                                                                                                                                                                                                                                                                                                                                                                                                                      Oct-08


                                                                                                                                                                                                                                                                                                                                                                                                                                                          Feb-09
                                                                                                                                                                                                                                                                                                                                                                                                                                                                      Apr-09


                                                                                                                                                                                                                                                                                                                                                                                                                                                                                                       Oct-09


                                                                                                                                                                                                                                                                                                                                                                                                                                                                                                                          Feb-10
                                                                                                                                                                                                                                                                                                                                                                                                                                                                                                                                     Apr-10
           Apr-06
                      Jun-06
                                 Aug-06


                                                                         Apr-07
                                                                                   Jun-07
                                                                                            Aug-07


                                                                                                                                Apr-08
                                                                                                                                         Jun-08
                                                                                                                                                  Aug-08


                                                                                                                                                                                       Apr-09
                                                                                                                                                                                                 Jun-09
                                                                                                                                                                                                           Aug-09


                                                                                                                                                                                                                                                     Apr-10
                                           Oct-06
                                                     Dec-06
                                                               Feb-07


                                                                                                     Oct-07
                                                                                                              Dec-07
                                                                                                                       Feb-08


                                                                                                                                                           Oct-08
                                                                                                                                                                    Dec-08
                                                                                                                                                                             Feb-09


                                                                                                                                                                                                                     Oct-09
                                                                                                                                                                                                                               Dec-09
                                                                                                                                                                                                                                          Feb-10


Source: Company, Angel Research; Note: Blue-line denotes 3yr avg P/E                                                                                                                                                                                                 Source: Company, Angel Research; Note: Blue-line denotes 3yr avg Premium


Exhibit 5: STNL & ZEEL trading at similar 1yr Fwd P/E                                                                                                                                                                                                               Exhibit 6: STNL trades at 3yr avg Prem of 9% to ZEEL
 55.0                                                                                       BSE Sensex                                       Sun TV                                   Zee Ent                                                                         95%

 50.0
                                                                                                                                                                                                                                                                      75%
 45.0

 40.0
                                                                                                                                                                                                                                                                      55%
 35.0

 30.0                                                                                                                                                                                                                                                                 35%

 25.0
                                                                                                                                                                                                                                                                      15%
 20.0

 15.0
                                                                                                                                                                                                                                                                          -5%
 10.0

  5.0                                                                                                                                                                                                                                                                 -25%
                                                                                                                                                                                                                                                                                     Apr-06
                                                                                                                                                                                                                                                                                                Jun-06
                                                                                                                                                                                                                                                                                                           Aug-06
                                                                                                                                                                                                                                                                                                           Oct-06
                                                                                                                                                                                                                                                                                                                          Dec-06
                                                                                                                                                                                                                                                                                                                                       Feb-07
                                                                                                                                                                                                                                                                                                                                                   Apr-07
                                                                                                                                                                                                                                                                                                                                                               Jun-07
                                                                                                                                                                                                                                                                                                                                                                        Aug-07
                                                                                                                                                                                                                                                                                                                                                                        Oct-07
                                                                                                                                                                                                                                                                                                                                                                                        Dec-07
                                                                                                                                                                                                                                                                                                                                                                                                  Feb-08
                                                                                                                                                                                                                                                                                                                                                                                                           Apr-08
                                                                                                                                                                                                                                                                                                                                                                                                                        Jun-08
                                                                                                                                                                                                                                                                                                                                                                                                                                 Aug-08
                                                                                                                                                                                                                                                                                                                                                                                                                                 Oct-08
                                                                                                                                                                                                                                                                                                                                                                                                                                                 Dec-08
                                                                                                                                                                                                                                                                                                                                                                                                                                                             Feb-09
                                                                                                                                                                                                                                                                                                                                                                                                                                                                         Apr-09
                                                                                                                                                                                                                                                                                                                                                                                                                                                                                     Jun-09
                                                                                                                                                                                                                                                                                                                                                                                                                                                                                                Aug-09
                                                                                                                                                                                                                                                                                                                                                                                                                                                                                                Oct-09
                                                                                                                                                                                                                                                                                                                                                                                                                                                                                                                 Dec-09
                                                                                                                                                                                                                                                                                                                                                                                                                                                                                                                            Feb-10
                                                                                                                                                                                                                                                                                                                                                                                                                                                                                                                                      Apr-10
         Apr-06
                    Jun-06


                                                                        Apr-07
                                                                                  Jun-07


                                                                                                                                Apr-08
                                                                                                                                         Jun-08


                                                                                                                                                                                        Apr-09
                                                                                                                                                                                                  Jun-09


                                                                                                                                                                                                                                                       Apr-10
                               Aug-06


                                                    Dec-06
                                                              Feb-07


                                                                                            Aug-07


                                                                                                              Dec-07
                                                                                                                       Feb-08


                                                                                                                                                  Aug-08


                                                                                                                                                                    Dec-08
                                                                                                                                                                              Feb-09


                                                                                                                                                                                                            Aug-09


                                                                                                                                                                                                                                 Dec-09
                                                                                                                                                                                                                                            Feb-10
                                          Oct-06


                                                                                                     Oct-07


                                                                                                                                                           Oct-08


                                                                                                                                                                                                                      Oct-09


Source: Company, Angel Research                                                                                                                                                                                                                                      Source: Company, Angel Research; Note: Blue-line denotes 3yr avg Premium


Exhibit 7: Relative Valuation - Sun TV has the highest EPS CAGR and strong RoEs v/s peers
                                                                                     MCap                                    CAGR
                                                                                                                         EPS CAGR                                                               PEG (x)                                                         P/E (x)                                    RoE (%)                                                                  EV/EBITDA (x)
                                                                                                                                                                                                                                                                                                                                                                                    EV/EBITDA                                                                              EV/Sales (x)
                                                                                      (Rs cr)                                   FY10-12E                                          FY10-12E                                                FY11E                     FY12E                       FY11E                                    FY12E                                      FY11E                                        FY12E                                 FY11E                                    FY12E
 India
 Broadcasting
 Sun TV                                                                           15,877                                                          25.3                                                        0.8                                  22.3               19.5                               33.0                                   30.6                                             8.3                                     7.4                                          6.3                                  5.6
 Zee Ent #                                                                        14,322                                                          21.8                                                        0.9                                  23.1               19.5                               14.5                                      15.4                                          NA                                       NA                                          5.1                                  4.4
 Print
 HT Media                                                                             3,597                                                       22.2                                                        0.8                                  20.2               16.8                               15.1                                      15.7                                      12.3                                     10.2                                            2.3                                  2.0
 Jagran Prakashan                                                                     3,766                                                       16.2                                                        1.0                                  19.1               15.9                               31.0                                      34.3                                      11.3                                        9.5                                          3.4                                  2.9
 Deccan Chronicle                                                                     3,035                                                       11.3                                                       0.8                                   10.6                   9.3                            18.9                                   19.1                                             5.7                                     4.9                                          2.7                                  2.3
Source: Company, Angel research; Note: # Zee Entertainment figures are consensus estimates from Bloomberg


June 22, 2010                                                                                                                                                                                                                                                                                                                                                                                                                                                                                                                                  3
Sun TV Network | Initiating Coverage


                                                  Investment Arguments
                                                  TV Ad to grow 15.6% CAGR, Regional Ad to grow faster

Television sector is expected to outpace the      During FY2010, the Media & Entertainment (M&E) industry grew at a mere 1.5% yoy
M&E growth, registering a CAGR of 15.2%           to Rs590bn impacted by the economic slowdown and shrinking corporate budgets.
over FY2010-15E                                   However, amidst weak macro economic conditions, the TV industry registered a modest
                                                  growth of 6.9% yoy to Rs260bn. Going ahead, the M&E industry is expected to rebound
                                                  and register 13.2% CAGR over FY2010-15E, while the Television sector is expected to
                                                  outpace the M&E industry growth, registering a CAGR of 15.2% over the mentioned
                                                  period.

                                                  Television advertising, which accounts for 40% of the total advertisement market, is
                                                  expected to post a CAGR of 15.6% over FY2010-15E to Rs182bn, aided by:
                                                  1) increasing number of channels (have nearly quadrupled to over 460 since FY2004),
                                                  2) rising viewership fragmentation, and 3) robust growth in niche genres like sports
                                                  (due to strong properties like IPL) and regional (emerging as a strong cost-effective
                                                  medium).


Exhibit 8: Regional advertising to grow at faster pace v/s Hindi GECs and overall TV Advertising
 (Rs cr)                      FY2007     FY2008   FY2009     FY2010 FY2011E FY2012E          FY2013E       FY2014E FY2015E     #
                                                                                                                                FY10-15E
 Total M&E Size               44,160     51,630   57,840     58,700    65,230      74,180      83,610       95,640   109,200         13.2
 Growth (% yoy)                 14.8       16.9      12.0       1.5       11.1        13.7        12.7        14.4      14.2
 Total Television Market
       Television             18,250     21,130   24,050     25,700    28,900      33,700      38,200       44,800    52,100         15.2
 Growth (% yoy)                 11.8       15.8      13.8       6.9       12.5        16.6        13.4        17.3      16.3
 Total Advertising Market     16,570     19,640   22,120     22,030    24,690      28,130      32,270       37,070    42,690         14.1
 (% of Total M&E)               37.5       38.0      38.2      37.5       37.9        37.9        38.6        38.8      39.1
 (% of GDP)                     0.46       0.50      0.53      0.49       0.51        0.53        0.56        0.59      0.62
 Television Ad Market          6,100      7,110    8,250      8,800      9,860     11,330      13,260       15,520    18,150         15.6
 (% of Total Ad Market)         36.8       36.2      37.3      39.9       39.9        40.3        41.1        41.9      42.5
 (% of Total Television Market) 33.4       33.6      34.3      34.2       34.1        33.6        34.7        34.6      34.8
 Growth (% yoy)                 17.5       16.6      16.0       6.7       12.0        14.9        17.0        17.0      16.9
 Hindi GEC*                    2,501      2,588    2,863      2,860      3,066      3,456       3,978        4,625     5,372         13.4
 (% of Televsion Ad Market)     41.0       36.4      34.7      32.5       31.1        30.5        30.0        29.8      29.6
 Growth (% yoy)                      -      3.5      10.6      (0.1)        7.2       12.7        15.1        16.3      16.2
 Regional TV Ad Market         1,281      1,742    2,186      2,464      2,771      3,195       3,766        4,439     5,245         16.3
 (% of Televsion Ad Market)     21.0       24.5      26.5      28.0       28.1        28.2        28.4        28.6      28.9
 Growth (% yoy)                      -     36.0      25.5      12.7       12.4        15.3        17.9        17.9      18.2
Source: FICCI-KPMG report 2010, Angel research, # denotes: CAGR, * Hindi GEC Market includes Doordarshan


Favourable demographics and significant           In Television, we believe the Regional Ad market is all set to outpace the larger Hindi
changes in dynamics of Television industry        GEC market and record 16.3% CAGR during FY2010-15E on the back of favourable
coupled with strong cost effective                demographics and significant changes in the dynamics of the Television industry
proposition is expected to help the Regional      (increasing fragmentation and consolidation in the Hindi GEC space). Moreover,
Ad market to grow at a faster clip                Regional Media has witnessed increased levels of activity owing to significantly untapped
                                                  markets of Tier-II and III towns, which are emerging as the new focus areas of marketers
                                                  owing to low penetration levels, steady growth in consumer spending and high
                                                  long-term growth potential.

June 22, 2010                                                                                                                               4
Sun TV Network | Initiating Coverage


                                                 STNL Ad Revenues to outpace Regional Ad growth, we peg 19% CAGR
South accounts for ~73% of the total             The southern regional markets of Tamil Nadu, Andhra Pradesh, Karnataka and Kerala
Regional Ad-market, where Sun is a leader        account for ~73% of the total regional advertisement revenue. STNL with its dominant
in three out of the four southern markets        market share across lucrative southern markets, through its bouquet of 20 channels
                                                 across genres like GECs, Music, News and Movies including flagship channels -
                                                 Sun TV (Tamil Nadu, market share 68%), Gemini TV (Andhra Pradesh, market share
                                                 36%), Udaya TV (Karnataka, market share of 40%) and Surya TV (Kerala, market
                                                 share of 33%) - is well placed to ride the regional wave.

Exhibit 9: STNL's Ad Revenue to grow at faster 19% CAGR vis-à-vis Regional Ad growth at 14% CAGR
 (Rs cr)                                      FY2007    FY2008       FY2009       FY2010       FY2011E       FY2012E       #
                                                                                                                            FY10-12E
 Regional TV Ad Market                         1,281      1,742        2,186        2,464         2,771        3,195             13.9
 Growth (% yoy)                                    -        36.0         25.5        12.7          12.4          15.3
 Tamil Ad Market                                380         517          647          732           826          959             14.4
 Telegu Ad market                               301         406          509          572           643          741             13.9
 Kannada Ad Market                              147         199          250          281           319          367             14.4
 Malyalam Ad Market                              97         141          181          205           227          259             12.5
 Southern Ad Market                             926       1,263        1,588        1,789         2,014        2,326             14.0
 Bengali Ad Market                              158         223          280          323           363          422             14.3
 Marathi Ad Market                              143         188          236          271           310          358             14.9
 STNL's Ad Revenue (Standalone)                 363         467          573          788           945        1,122             19.3
 (% of Southern TV Ad Market)                   39.3        37.6         38.2        47.3          50.4          51.9
 Growth (% yoy)                                    -       (4.2)          1.4        23.9           6.6           3.0
 STNL's Ad Revenue (Incl Radio)                 364         475          606          846         1,015        1,208             19.5
 Growth (% yoy)                                    -        30.6         27.4        39.6          20.1          18.9
Source: Company, Angel Research; Note: # denotes CAGR


We have modeled in a 19.3% CAGR in               During FY2010-12E, we peg STNL's standalone Ad revenues (excluding Radio) to
STNL's standalone Ad revenues driven by          grow at 19.3% CAGR (management has guided for 17-18% yoy growth in advertising
rate hikes, improved inventory utilisation       in FY2011E), ahead of 13.9% CAGR in Regional advertising during the period, driven
and traction in new channels                     by: 1) absorption of rate hikes (9-33% hike in ad rates in Tamil channels and 5-16%
                                                 in other channels effective January 2010), 2) increased traction from niche kids/comedy
                                                 channels (Adhitya TV, Khushi TV, Navvulu TV, Chintu TV and Ushe TV) launched in
We expect ad-revenue growth to peak out          1QFY2010, 3) strong focus of management on utilising inventory during off-peak
in 1QFY2011with culmination of base effect       hours and new weekend programming, and 4) uptick in the economy (higher ad
                                                 spends from the FMCG sector in specific, which contributes ~80% of STNL's
                                                 advertisement revenues). While the ad-rate hike absorption will be a primary driver
                                                 for high advertisement revenues, we expect the ad-revenue growth to peak out in
                                                 1QFY2011 (with the culmination of the base effect) and dip into mid-teens by 3Q and
                                                 4QFY2011.

STNL has shown strong resilience to              We highlight that during the last several quarters, STNL has posted high growth rates
intensifying competition and shift in            (in the range of 35-45%) in advertising revenue, partially aided by low base, showing
advertisement flow towards sports; however,      strong resilience to: 1) increasing competition in its Telugu, Kannada and Malayalam
a change in the same carries downside risks      markets, and 2) shift in advertising flow towards sports properties like IPL - Season 3.
to our estimates


June 22, 2010                                                                                                                           5
Sun TV Network | Initiating Coverage


Exhibit 10: High Per Capita Income and Urban Population make South a lucrative market
                                                         Per Capita                          Growth                                        Total Pop
                                                                                                                                                 Pop                          Pop
                                                                                                                                                                        Urban Pop                            % of Urban
                                                               Income                           (%)                                         (1,000s)                       (1,000s)                                   Pop
                                                 (current price - Rs)
       TN                                                      38,573                          10.6                                         62,406                             27,459                                      44
       Andhra Pradesh                                          34,063                          16.3                                         76,210                             19,053                                      25
       Karnataka                                               35,555                          16.6                                         52,851                             18,498                                      35
       Kerela                                                  41,814                          14.2                                         31,841                             11,463                                      36
       All India                                               33,283                                                                     1,028,737                        285,989                                         28
Source: Economic Survey 2007-08, Angel Research


Exhibit 11: Sun's Bastion with ~70% share                                                               Exhibit 12: Successfully fending off competition
                                                     Tamil GEC                                                                                                          Telegu GEC
                   80.0                                                                                                          45.0
                                                                                                                                              40.3                                                                    40.1
                   70.0                                                                                                          40.0                       36.5         36.4                             36.7
                                                                                                                                                                                        34.5
                                          68.1        68.5          69.0                       69.8                              35.0
                            66.7                                                      67.4
Market Share (%)


                   60.0                                                                                 Market Share (%)
                                                                                                                                 30.0
                   50.0
                                                                                                                                 25.0
                   40.0
                                                                                                                                 20.0
                   30.0
                                                                                                                                 15.0
                   20.0
                                                                                                                                 10.0
                   10.0
                                                                                                                                 5.0
                    -
                                                                                                                                  -
                          4QFY2009     1QFY2010 2QFY2010          3QFY2010 4QFY2010          1QFY2011
                                                                                                                                           4QFY2009      1QFY2010     2QFY2010       3QFY2010        4QFY2010       1QFY2011
                               Sun TV               Kalaignar TV           Vijay TV           Jaya TV                                                Gemini TV        Eanadu TV          Zee Telugu              Maa Telugu
                               Raj TV               Zee Tamizh             Others                                                                    DD8 Telugu       Sitara TV          Vanitha TV

Source: TAM, Angel Research                                                                             Source: TAM, Angel Research


Exhibit 13: Battling out to stay a strong No1                                                           Exhibit 14: Playing 2nd fiddle to leader Asianet
                                                      Kannada GEC                                                                                                     Malyalam GEC
                   50.0                                                                                                          60.0
                            43.7          44.1                                                 42.8
                   45.0
                                                                    38.4              39.1
                   40.0                               37.6                                                                       50.0
                                                                                                              Market Share (%)
Market Share (%)


                   35.0
                                                                                                                                 40.0         35.0          34.6
                   30.0                                                                                                                                                 32.2           33.3           32.7          32.3
                   25.0
                                                                                                                                 30.0
                   20.0

                   15.0                                                                                                          20.0
                   10.0

                    5.0                                                                                                          10.0

                     -
                                                                                                                                      -
                          4QFY2009     1QFY2010     2QFY2010      3QFY2010      4QFY2010     1QFY2011
                                                                                                                                            4QFY2009     1QFY2010     2QFY2010       3QFY2010      4QFY2010      1QFY2011
                                   Udaya TV         ETV Kannada             Zee Kannada
                                   Kasturi          Suvarna                 DD9 Chandana (Kannada)                                          Asianet        Surya TV        Kairali            Amrita TV          DD4 Malayalam

Source: TAM, Angel Research                                                                                  Source: TAM, Angel Research


June 22, 2010                                                                                                                                                                                                                   6
Sun TV Network | Initiating Coverage


                                                Multiple levers led by DTH to aid 37% CAGR in Subscription

                                                During FY2010-12E, we expect STNL to register a robust 37% CAGR in its overall
Strong 58% CAGR in DTH and 20% CAGR             Subscription revenues (including international) and higher 42% CAGR in domestic
in Analogue revenues to drive 42% CAGR          Subscription revenues aided by: 1) strong 58% CAGR in DTH revenues on the back of
in domestic Subscription revenues over          28% CAGR in DTH subscribers and rise in ARPU to Rs40 (due to revised bouquet rates
FY2010-12E                                      at Rs52/month as reported in 4QFY2010), and 2) 20% CAGR in Analogue revenues
                                                aided by restructuring of distribution business and Malayalam channels (Surya TV,
                                                Kiran TV) turning pay effective April 1, 2010.


Exhibit 15: STNL's Domestic Subscription Revenues to double over next two years
                                             FY2007       FY2008       FY2009        FY2010E       FY2011E     FY2012E    FY10-12E
                                                                                                                          #


 TV Subscription Market Industry Estimates
 C&S TV Households (mn)                            70          78              86         95           104        112           8.6
 Growth (% yoy)                                  12.9        11.4         10.3          10.5            9.5        7.7
 C&S TV Penetration (%)                          62.5         66.1        69.9          73.6           77.0       79.4
 Analogue Cable Households (mn)                  63.4        68.6         70.0          69.0           67.5       63.5        (4.1)
 Growth (% yoy)                                      -         8.2             2.0      (1.4)          (2.2)      (5.9)
 Analogue Share (%)                              90.6        88.0         81.4          72.6           64.9       56.7
 DTH Households (mn)                              2.6          4.0        10.0          16.0           24.0       30.0         36.9
 Growth (% yoy)                                      -       53.8        150.0          60.0           50.0       25.0
 DTH Penetration (%)                              3.7          5.1        11.6          16.8           23.1       26.8
 Analogue Cable ARPUs                            153          158          161          160            161         168          2.5
 DTH ARPUs                                       160          170          160          155            155        171           5.2
 Analogue Cable Revenues (Rs cr)              11,613       12,985       13,553        13,248        13,021      12,802        (1.7)
 DTH Revenues (Rs cr)                            499          816        1,920         2,976          4,464      6,172         44.0
 Total TV Subscription Market (Rs cr)         12,200       14,020      15,810         16,900        19,100      22,300        14.9
 Growth (% yoy)                                      -       14.9         12.8           6.9           13.0       16.8
 Analog Contribution (%)                         95.2        92.6         85.7          78.4           68.2       57.4
 DTH Contribution (%)                             4.1          5.8        12.1          17.6           23.4       27.7
 STNL Subscription Revenue estimates
 Analogue Cable HHs (mn)                          8.2        10.1              6.6       7.9           10.8       11.6        21.3
 Growth (% yoy)                                     -        22.9        (35.0)         20.4           37.0        7.4
 DTH HHs (mn)                                       -          1.1             2.8       5.8            7.7        9.5        28.0
 Growth (% yoy)                                     -            -       154.5         107.1           32.8       23.4
 % of total DTH Households                           -        27.5        28.0          36.3           32.1       31.7
 Avg. Analogue Cable ARPUs                         17          18              17         17             16         16        (1.1)
 DTH ARPUs                                          -          25              25         26             40         40         23.3
 Analogue Cable Revenues                         167          219          131          158            212        227          19.9
 DTH Revenues                                       -          10              84       183            370        456          57.8
 Domestic Subscription Revenue(Rs cr)            167          229          215          341            581        683         41.5
 Growth (% yoy)                                     -        36.7         (5.9)         58.4           70.4       17.6
 Analog Contribution (%)                       100.0         95.7         61.0          46.3           36.4       33.3
 DTH Contribution (%)                                -         4.3        39.0          53.7           63.6       66.7
 License Income (Int. Subscription)                34          38              54         56             59         62          5.0
 Growth (% yoy)                                      -       12.4         41.2           3.6            5.0        5.0
 STNL Subscription Revenue (Rs cr)               201          267          269          397            640        745         37.0
Source: FICCI-KPMG Report 2010, Company, Angel Research; Note: #denotes CAGR


June 22, 2010                                                                                                                         7
Sun TV Network | Initiating Coverage


                                               Higher ARPUs and Subscribers to aid 58% CAGR in DTH revenues

4QFY2010 registered a sharp revision in        During 4QFY2010, the company reported a subscriber base of 6mn and a sharp
DTH ARPUs to Rs36/month aided by               uptick in DTH realizations to Rs35-36/month (Rs26-27/month) on account of 5 new
addition of 5 niche channels and a new         niche channels turning pay adding to the company's ARPUs (new channel bouquet
bouquet priced at Rs52/month                   available at Rs52/month). Hence, we have modeled in 58% CAGR in DTH Subscription
                                               revenues over FY2010-12E, driven by - 1) yoy growth of 33% and 23% for
                                               FY2011-12E in the Subscriber base to 7.7mn and 9.5mn respectively, 2) significant
                                               52% yoy increase in ARPU to Rs40/month (Rs26/month) in FY2011E.

Non-confirmation of 4QFY2010 ARPU trend        However, we note that ~60% of the DTH revenues for STNL come from its sister
carries downside risks to our estimates        concern Sun Direct, which has accepted the revised bouquet driving this sharp up-tick
                                               in DTH revenues. Nonetheless, STNL continues to offer its original bouquet. However,
                                               the stickiness of other operators to the same and non-confirmation of 4QFY2010
                                               ARPU trend carries downside risks to our estimates.

                                               Malayalam channels and distribution re-jig to boost Analogue revenues

Re-jig of Distribution and renewed focus on    Post the significant dip in Analogue subscription revenues in FY2009 due to power
domestic Subscription augurs well for STNL's   cuts in Tamil Nadu, launch of new distributors (Arasu, Royal Cable) and Sun Direct
Analogue Subscription revenues                 (cable operators boycotted the launch of DTH by cutting declaration levels), STNL has
                                               renewed its focus and restructured its Distribution business with two separate teams,
                                               the first focusing on South Indian operations and International business, and the second
                                               focusing on expanding the company's bouquet to the North, West and Eastern markets
                                               in India.

We expect incremental addition of              Moreover, on February 2010, STNL announced that its Malayalam channels Surya TV
Rs20-25cr to STNL's Subscription revenues      and Kiran TV would become pay channels from April 1, 2010. According to
in FY2011E on account of Malayalam             management, the non-CAS cable rates for the said channels, as a bouquet, would be
channels turning pay                           Rs20.3/month and CAS cable rates would be Rs5.4/channel/month. We highlight
                                               that this move has come post its key competitor, Asianet, turning pay. We estimate that
                                               the Malayalam market has ~4mn C&S households and have modeled in an initial
                                               addition of 1.5mn subscribers in FY2011E with an ARPU of Rs15/month for STNL.
                                               Hence, we expect incremental addition of Rs20-25cr to STNL's Subscription revenues
                                               in FY2011E on account of the Malayalam channels turning pay.

                                               We expect the Analogue subscription revenues to register 20% CAGR over
                                               FY2010-12E, with 34% yoy growth in FY2011E itself on a low base (inclusion of
                                               Malayalam subscription revenues)

                                               Management upbeat on International subscription, we defer

In contrast to management guidance, we         In contrast to management guidance of sharp improvement in International subscription
have conservatively modeled in 5% yoy          revenue (program license fees), we have conservatively modeled in 5% CAGR over
growth in Sun's International subscription     FY2010-12E, owing to: 1) lack of traction in the same since several quarters, 2) changed
revenues in our FY2011-12E estimates           regulations for Pay TV in the South-East Asian countries of Malaysia and Singapore,
                                               and 3) currency fluctuation risks. However, the distribution re-jig done by the company
                                               (STNL has floated a wholly-owned subsidiary, Sun TV Network Europe in the UK to
                                               distribute and broadcast its channel in UK and Europe) poses an upside risk to our
                                               estimates.


June 22, 2010                                                                                                                        8
Sun TV Network | Initiating Coverage


                                               Sun Pictures - Betting big on Endhiran

                                               Sun entered the Movie business in September 2008 through subsidiary, Sun Pictures,
                                               and has so far distributed 12-15 films, most of which have been successful and earning
                                               an estimated 15-20% Return on Capital Employed. Going ahead, we have modeled
                                               in an outlay of Rs70-80cr for FY2011-12E for distribution of 10-12 movies annually.

Endhiran slated for release in 2HFY2011E       STNL recently entered into movie production with its high budget movie, Endhiran
is expected to register returns of 20-25% at   (estimated budget for the movie is Rs100cr+), starring the southern superstar Rajnikant
EBIT level. We estimate a 150% yoy growth      and Bollywood's Aishwarya Rai. The movie is expected to be released in 2HFY2011in
in Movie revenue for FY2011E to Rs175cr,       three languages, viz. Tamil, Telugu and Hindi. Given the star cast and cutting edge
tapering down to Rs110cr in FY2012E            production techniques used in this movie, we expect it to register returns of 20-25% at
                                               the EBIT level. Management has indicated that this is a one-off venture, and the company
                                               would be focusing only on the distribution business in the future.

                                               For FY2011E, we estimate STNL revenues from movie distribution (including release
                                               of Endhiran) to increase 150% yoy to Rs175cr (Rs70cr) and then taper down to Rs110cr
                                               in FY2012E, as effects of revenue traction from Endhiran wanes.

                                               Radio - to reach near break-even at operating level by FY2012E

                                               Sun operates 44 radio stations in total and has two subsidiaries Kal Radio (Kal) and
                                               South Asia FM (SAFM) with stake of 97.8% and 59.2% respectively. STNL has entered
                                               into a strategic tie-up to broadcast its own radio channels under the Red FM brand
                                               (holds 48.9% stake in Red FM), operating at 93.5MHz. Consequently, S FM or Suryan
                                               FM was re-branded into Red FM across 38 cities (except for the ones in Tamil Nadu) in
                                               India.

                                               Exhibit 16: Consolidated Radio losses to moderate to Rs37cr in FY2012E
                                                Y/E March                  FY2008       FY2009    FY2010      FY2011E       FY2012E
                                                Net Sales                          9        33         58            70           86
                                                Growth (% yoy)                      -    273.8       74.4           21.9        21.9
                                                Other Income                       6         2          2             3             3
                                                Total Income                      14        35         59            73           89
                                                Operating Expenditure             33        68         77            80           87
                                                (% of sales)                 377.6       205.9      134.0        113.6         100.9
                                                          Profit
                                                Operating Profit                 (25)      (35)       (20)          (10)          (1)
                                                OPM %                      (277.6)      (105.9)     (34.0)       (13.6)         (0.9)
                                                Depn. & Amortn.                   11        36         36            37           39
                                                (% of sales)                 122.5       107.1       61.4           52.5        45.0
                                                PBIT                             (35)      (71)       (55)          (47)         (39)
                                                PBIT %                     (400.1)      (213.1)     (95.4)       (66.1)        (45.8)
                                                Interest                         24.9     28.2       12.8            1.0          1.0
                                                PAT                              (55)      (97)       (66)          (45)         (37)
                                               Source: Company, Angel Research


June 22, 2010                                                                                                                           9
Sun TV Network | Initiating Coverage


We peg 22% CAGR in top-line aided by                                    On a consolidated basis, we expect the company's Radio subsidiaries (Kal and SAFM)
re-branding of radio stations to Red FM and                             to report top-line CAGR of 22% over FY2010-12E to Rs86cr (Rs58cr) driven by:
Ad-rate hike of 12-15% effective June 2010                              1) Red FM, the uniform brand identity of the company's radio channels, will act as an
                                                                        effective tool for marketing the stations with agencies and customers, and 2) Red FM
                                                                        has announced an increase in its ad rates by 12-15% effective June 2010.

At operating level, we expect Radio business                            In terms of Earnings, we expect the Radio business to register significant reduction in
to reach near break-even in FY2012E but                                 operating losses (EBITDA level) from Rs20cr in FY2010 to near break-even in FY2012E
drag consolidated EPS down by ~4%                                       aided by sharp cost curtailment measures. Moreover, at the PAT level, we expect the
                                                                        Radio business to reduce its losses to Rs37cr in FY2012E (aided by significant reduction
                                                                        in interest costs as Loans & Advances to Radio subsidiaries have been reversed), down
                                                                        from Rs66cr in FY2010, dragging down the consolidated EPS by ~4%.

Exhibit 17: Kal Radio - Strong Operating Profitability                                            Exhibit 18: SAFM - To remain a drag operationally
           60.0                                                                                             40.0                                                                          34.3
                                                                                    51.6
           50.0                                                                                             30.0                                                          27.5
                                                                      43.0                                                                             22.0
           40.0                                     35.9                                                    20.0
                                                                                                                                    11.1
           30.0                                                                                             10.0
 (Rs cr)


                                  22.0                                                                               2.3
                                                                                                  (Rs cr)


                                                                                           19.9
           20.0                                                                                                -
                                                                             14.0
                                                           8.2                                              (10.0)
           10.0     6.6

              -                                                                                             (20.0)         (16.7)
                                                                                                                                                                                                 (20.6)
                                                                                                                                                                                 (23.6)
           (10.0)                        (6.2)                                                              (30.0)
                          (7.9)                                                                                                            (28.9)             (27.9)

           (20.0)                                                                                           (40.0)

                     FY08          FY09               FY10             FY11E         FY12E                            FY08           FY09                FY10              FY11E           FY12E

                                                 Revenue     EBITDA                                                                                 Revenue      EBITDA

Source: Company, Angel Research                                                                   Source: Company, Angel Research


                                                                        Kal Radio - Profitable at Operating level, to break-even at PAT in FY12E

Kal Radio to drive growth at operational                                During FY2010, Kal Radio (18 radio stations under operation primarily in South India)
level, while SAFM is unlikely to achieve                                clocked 63% yoy growth in top-line to Rs36cr (Rs22cr) aided by addition of new stations
EBITDA breakeven by FY2012E                                             and better inventory utilisation, and achieved operating profit of Rs8.2cr (loss of Rs6.2cr)
                                                                        as operational cost remained flat. Going forward, we have modeled in 20% CAGR in
                                                                        top-line (aided largely by rate hikes as incremental gain from new stations getting
                                                                        added is factored in the base) and expect it to report a turnover of Rs43cr and Rs52cr
                                                                        in FY2011E and FY2012E, respectively. Operating profit is expected to log in 55%
                                                                        CAGR over FY2010-12E as we have factored in only a marginal 7-8% yoy increase in
                                                                        operating expenditure.

                                                                        SAFM - Operational losses to sustain in near term

                                                                        In FY2010, SAFM (23 radio stations under operation primarily in Tier-III cities) doubled
                                                                        its top-line to Rs22cr (Rs11cr) aided by addition of new stations and better inventory
                                                                        utilisation. However, SAFM registered operating loss of Rs28cr (loss of Rs29cr) due to
                                                                        25% rise in operational costs. Going forward, we expect SAFM to post revenue CAGR
                                                                        of 25% over FY2010-12E. However, we do not expect the subsidiary to achieve EBITDA
                                                                        breakeven by FY2012E, in contrast to management guidance of EBITDA breakeven
                                                                        by FY2011E, and have modeled in a loss of Rs21cr for FY2012E.


June 22, 2010                                                                                                                                                                                             10
Sun TV Network | Initiating Coverage


                                                  Financial Outlook
                                                  Steady Advt., sharp spike in DTH to aid 24% CAGR in top-line

                                                  During FY2010-12E, we expect STNL to report a strong consolidated 23.5% CAGR in
                                                  revenues driven largely by: 1) 19.5% CAGR in Advertising revenues, 2) 37% CAGR in
                                                  Subscription revenues largely led by 58% CAGR in DTH revenues, and 3) sharp spike
                                                  in Movie revenues driven by the release of the big budget Endhiran (slated for release
                                                  in 2HFY2011E), though mainly captured in FY2011E and tapering off in FY2012E.

Exhibit 19: Consolidated Top-line Model - 36% yoy in FY2011E and 24% CAGR over FY2010-12E
 (Rs cr)                 FY08    FY09     FY10     FY11E     FY12E    FY10-12E
                                                                      #
                                                                                 Key Growth Drivers
 Advertising Revenue      475     606      846     1,015     1,208        19.5
 Growth (% yoy)          30.6     27.4     39.6      20.1     18.9
 Broadcasting             467      573     788         945   1,122        19.3   Rate hike absorption, Incremental gains from niche channels
 Growth (% yoy)          28.5     22.7     37.6      20.0     18.7               and better inventory utilisation
 Radio                       9      33      58          70      86        21.9   Higher inventory off-take and recent rate hikes in Red FM
 Growth (% yoy)         790.0    272.6     74.4      21.9     21.9               (12-15%)
           Fee
 Broadcast Fee            126     130      135         142    148          4.6   Modeling in conservative growth based on hike in slot rates,
 Growth (% yoy)          15.7      3.8      3.4        5.0     4.2               await 1QFY11 results before upgrading
 Subscription             268     269      397         640    745         37.0
 Growth (% yoy)          32.8      0.6     47.4      61.4     16.4
 Analogue                 219      131     158         212     227        20.1   Distribution re-jig (4QFY10 exhibits traction) and Malayalam
 Growth (% yoy)          31.1    (40.2)    20.2      34.5      7.4               channels turning pay (to add Rs20-25cr)
 DTH                       10       84     183         370     456        57.8   Subscriber addition and revised ARPU (Rs40/month)
 Growth (% yoy)              -   748.5    117.9    101.9      23.4
 Program Licence           38       54      56          59      62         5.0   Renewed focus, distribution tie-ups in UK - modeled a 5%
 Growth (% yoy)          12.4     41.2      3.6        5.0     5.0               CAGR significantly lower than Mgmt guidance
 Movies                      -      28      70         175    110         25.4   Endhiran release to spike revenues in FY11E, partialy
 Growth (% yoy)              -        -   148.0    150.0     (37.1)              spill-over in FY12E
 Other Sales                 1       6        6         6        6         3.3   Largely Income from content trading and Aircraft charter
 Growth (% yoy)              -        -     0.9        3.2     3.4               services - to remain flat
 Net Sales                870 1,039       1,453    1,978     2,217        23.5
 Growth (% yoy)              -    19.5     39.8      36.2     12.0
Source: Company, Angel Research; Note: #denotes CAGR


June 22, 2010                                                                                                                               11
Sun TV Network | Initiating Coverage


                                                 Margins to sustain, we peg consolidated Earnings CAGR at 25%

                                                 During FY2010-12E, we expect EBITDA Margins to hover between 75-76% levels
                                                 aided by significant reduction in Radio losses (to achieve near break-even in FY2012E
                                                 at operational level) and higher operating leverage (as majority of incremental
                                                 top-line growth will be driven by ad rate hike and higher subscription revenues).
                                                 However, higher SG&A expenses (Endhiran release in FY2011E) and spike in MD's
                                                 pay (low base) to the usual 10% of PBT is likely to restrict Margin expansion.

                                                 In terms of core EBIT margins (including amortisation costs for films and distribution
                                                 rights), we expect STNL to sustain margins at ~59% in FY2011E, before expanding by
                                                 130bp yoy in FY2012E due to higher amortisation charges on the back of release of
                                                 Endhiran in FY2011E.

                                                 On a consolidated basis, we expect STNL's earnings to register 25.3% CAGR over
                                                 FY2010-12E driven largely by strong top-line growth and stable Margins.

Exhibit 20:Cost and Earnings Breakup - Expect Margins to remain stable in FY11E before expansion in FY12E
 (Rs cr)                   FY08   FY09   FY10     FY11E      FY12E   FY10-12E
                                                                     #
                                                                                 Key Growth Drivers
 Cost of Revenues           77    111     119          138    153        13.3    Drop as % of sales as incremental revenue from Ad rate hike
 % of Sales                 8.8   10.7     8.2         7.0     6.9               and DTH, Model absolute growth of ~13%
 Staff Cost                 96    116     134          201    231        31.4    Spike in FY11 as we model higher Pay to MD in FY11-12E
 % of Sales                11.0   11.1     9.2      10.1      10.4               and Staff costs for new team set-ups
 MD's Pay                   65      74      74         125    141         38.1   In FY10, MD's Pay remained at FY09 levels, We model FY11
 % of Sales                 7.5    7.1     5.1         6.3     6.4               Pay at usual 10% of PBT
 Other Staff Costs          26     28       42          56     68         27.9   Modeled in 28% CAGR rise in Staff costs due to new team
 % of Sales                 3.0    2.7     2.9         2.9     3.1               set-ups in distribution and new channels
 Radio Staff Costs           5      13      18          19     21          9.4   To rise moderately at 9% CAGR as all stations are now
 % of Radio Sales          51.0   40.7    31.0      27.5      25.0               operational and strong cost focus
 SG&A Expenses              41     54       75         107    106        19.1    Modeling in 19% CAGR to support new launches, FY11 to
 % of Sales                 4.7    5.2     5.2         5.4     4.8               see spike due to Endhiran release
 Other Expenses             59     22       34         35      40          8.4   To register significant moderation due to lower losses in Radio
 % of Sales                 6.8    2.1     2.3         1.8     1.8
 EBITDA
 EBITDA                    597    737 1,091       1,497      1,686       24.3
 EBITDA Margin (%)         68.7   70.9    75.1      75.7      76.1
 Amortisation               86    153     233          326    347        22.1    Spike in FY11E due to release of Endhiran, to moderate in
 % of Intangible Assets    15.9   20.8    23.6      26.7      24.3               FY12E
 Core EBIT                 511    583     858     1,171      1,339       24.9    Core EBIT Margins to expand 130bp due to lower losses in
 Core EBIT Margin (%)      58.8   56.1    59.1      59.2      60.4               Radio and higher operating leverage
          PA
 Reported PAT (After MI)   327    368     520          712    816        25.3
 PAT Margin (%)            37.6   35.4    35.8      36.0      36.8
Source: Company, Angel Research; Note: #denotes CAGR


June 22, 2010                                                                                                                               12
Sun TV Network | Initiating Coverage


                                                             Debt-free Balance Sheet, Cash to swell to ~Rs10bn in FY2012E

                                                             STNL has a strong zero debt balance sheet and cash balance of ~Rs435cr as on
                                                             FY2010. Moreover, despite modeling heavy capex (including movie acquisition costs)
                                                             in the range of Rs420-440cr for FY2011-12E (in line with management guidance), we
                                                             expect STNL's cash balance to swell to a whopping Rs10bn or ~Rs33/share in FY2012E
                                                             accounting for almost 34% of capital employed. We attribute the jump in cash balance
                                                             to strong rise in free cash flow (almost tripling over FY2010-12E) on strong earnings
                                                             growth. As result, we expect STNL's RoE to sustain at 28-31% levels and RoIC to rise to
                                                             47% (36% in FY2010).

Exhibit 21: FCF to triple boosting cash balance                                   Exhibit 22: RoE to sustain, RoIC to rise to 47%
           1,200                                                                        50                                                         47
                                                                                                                                         45
                                                                         1,036          45
           1,000
                                                                                        40
                                                                                                  36                       36
            800                                                                         35                                          33
                                                                       721
                                                                                                                                              31
                                                                 581                    30                    27      28
            600
 (Rs cr)


                                                                                  (%)


                           430                     435     463                          25   24
                                                                                                         22
            400                        365
                                                                                        20
                                             202
            200                                                                         15
                                 110
                                                                                        10
              -
                                                                                        5
                    (38)
            (200)                                                                       -
                     FY08        FY09         FY10         FY11E       FY12E                  FY08       FY09         FY10          FY11E     FY12E

                                  Free Cash Flow     Cash Balance                                                   RoE      RoIC

Source: Company, Angel Research                                                   Source: Company, Angel Research


June 22, 2010                                                                                                                                           13
Sun TV Network | Initiating Coverage


                Key Concerns
                    Delay/difficulty in absorption of rate hikes: We have modeled in a steady 19.3%
                CAGR in STNL's standalone advertising revenues over FY2010-12E aided by absorption
                of rate hikes (9-33% hike in ad rates in Tamil channels and 5-16% in other channels
                effective Jan 2010). Any delay/difficulty to pass the same to advertisers on account of
                competitive pressures, slowdown in GDP or other unforeseen factors would entail
                downside risks to our estimates.

                    Fall in DTH ARPUs beyond Rs35-40/month: During 4QFY2010, the company
                reported a subscriber base of 6mn and a sharp uptick in DTH realisations to
                Rs35-36/month (Rs26-27/month) on account of 5 new niche channels turning pay
                (new channel bouquet available at Rs52/month). Hence, we have modeled in 58%
                CAGR in DTH Subscription revenues over FY2010-12E, driven by - 1) growth of 33%
                and 23% for FY2011-12E in the Subscriber base to 7.7mn and 9.5mn respectively,
                2) significant 52% yoy increase in ARPU to Rs40/month (Rs26/month) in FY2011E.
                Hence, non-confirmation of 4QFY2010 ARPU trend carries significant downside risks
                to our estimates.

                    Delay/failure of big budget Endhiran: STNL is slated to release its first big budget
                                                Endhiran:
                movie, Endhiran (estimated budget of Rs100cr+), starring the southern superstar
                Rajnikant and Bollywood's Aishwarya Rai. For FY2011E, we estimate revenues from
                movie distribution (including release of Endhiran) to increase 150% yoy to Rs175cr
                (Rs70cr) with Endhiran expected to register 20-25% returns at the EBIT level. Any
                delays in the release of movie or the movie tanking at the box office would dent our
                revenue and earnings estimates.


June 22, 2010                                                                                        14
Sun TV Network | Initiating Coverage


                Company Background
                Headquartered in Chennai, STNL was incorporated in December 1985 and listed in
                April 2006. STNL, promoted by Kalanithi Maran, belongs to the Sun Network Group,
                which is straddled across the media value chain, viz. Broadcasting, Radio, Films, Cable
                distribution, DTH and Print Media. STNL is India's leading media conglomerate with
                20 TV channels with a significant presence in the south (leader in three of the four
                southern states - operates in Tamil Nadu, Andhra Pradesh and Karnataka).

                Exhibit 23: STNL operates 20 channels in 4 Southern markets
                 Channels                   Tamil                   Telegu                            Kannada             Malyalam
                 GEC                     Sun TV                Gemini TV                             Udaya TV               Surya TV
                 News               Sun News               Gemini News               Udaya Varthegalu
                 Movies                      K TV                   Teja TV                 Udaya Movies                    Kiran TV
                 Music              Sun Music              Gemini Music                          Udaya TV 2
                 Kids                 Chutti TV                 Khushi TV                             Chintu TV
                 Comedy             Adithya TV                 Navvulu TV                                 Ushe TV
                Source: Company, Angel Research

                Beyond television broadcasting, the company has a strong presence in radio
                broadcasting (has a total of 44 FM licences) via its two subsidiaries - Kal FM (98%
                stake) and SAFM (59% stake) and strategic tie-up with Red FM. Moreover, STNL entered
                the movie business in September 2008 through its subsidiary, Sun Pictures and has so
                far distributed 12-15 films. The company is also slated to release its first in-house
                production, Endhiran during 2HFY2011.

                Exhibit 24: Sun TV Business Model - Spans Broadcasting, Radio and Movies

                                                                           Sun TV Network
                                                 20 television channels across 4 southern states & 3 FM radio stations


                                      59.2%                                                 Division of                       97.8%
                                    Subsidiary                                                 STNL                         Subsidiary


                                           South Asia FM                     Sun Pictures                           Kal Radio


                   49% beneficial       23 licenses focused                Production/distrib                   18 licenses focused
                      interest          on northern, eastern               ution of movies in                    on Southern cities
                                         & western region                   southern region


                                      Strategic Alliance                       3 radio stations in Mumbai,
                                         with RED FM                               Delhi and Kolkatta


                Source: Company, Angel Research


June 22, 2010                                                                                                                            15
Sun TV Network | Initiating Coverage


                Unique low-cost business model keeps cost off STNL's books

                STNL operates on "Sponsored Revenue model", wherein it leases out its time slots to
                third party content producers for a fixed fee (termed as broadcast fee in P&L). In
                return, the content producers have the right to about 4mins of advertising inventory
                per half an hour, while STNL gets 2mins of this half an hour slot. Since the content
                aired on STNL channels are not owned by STNL, the cost of content and the risks of
                recouping the cost lie with the producer.

                Moreover, the company also produces a large amount of content aired in the
                non-prime time slots in-house, which furthers lowers its production costs. The company's
                in-house production team sources around 75% of its daily content requirement
                in-house, out of which 40-45% is movie based, 8-10% is news and the rest is accounted
                by game, talk and variety shows. Further, the company has exclusive contracts with
                artistes and anchors as part of its talent retention strategy.

                STNL leads movie broadcasting via its largest movie library

                STNL has a strong movie library comprising more than 8,500 titles, with rights across
                all the four major South Indian languages. Apart from having an extensive movie
                library, STNL purchases around 90% of all movie releases in these languages. The
                company employs various strategies such as airing free trailers of movies prior to
                release, through its wide range of channels. Consequently, the producer contracts
                satellite rights to STNL at lower rates, resulting in lower acquisition costs for the company.
                Usually, Sun pays Rs1-1.5cr for acquiring satellite rights and recovers the same in the
                first two runs of the movie. In the southern market, screening of movies on satellite
                channels is allowed only after 1-3 years of the theatrical release. Movies and
                movie-related content attracts significant viewership in down south. As a result, STNL
                earns around 25% of its advertising revenues from movies aired on dedicated channels
                in each market.

                Foray into niche channels like Kids and Comedy genre

                Apart from the various GEC channels, STNL also broadcasts dedicated movie channels,
                kids and infotainment channels and comedy channels (refer Exhibit 23). Foray into
                these niche categories and entertaining selective TV viewers was a bold move.
                Nonetheless, the move has paid well for the company - Chutti TV, the Tamil children
                entertainment channel has ~5% market share and contributes ~3% to Sun's revenues.

                For its kid's channels, Sun has exclusive tie ups with the content providers (tied up with
                Disney India in December 2009 and DQ Entertainment in June 2010), wherein Sun
                buys exclusive rights to cartoons and then dubs them in four languages. Operating
                costs involved are confined to dubbing costs. This scale and low-cost model ensures
                that these niche channels do not cause any significant margin dilution. STNL's comedy
                channels also work on a similar low-cost model wherein clips from the movies in Sun's
                library are telecast, keeping production costs minimal.


June 22, 2010                                                                                              16
Sun TV Network | Initiating Coverage


                Profit & Loss Statement (Consolidated)                                       Rs crore
                Y/E March (Rs cr)                  FY2008       FY2009   FY2010E   FY2011E   FY2012E

                Gross sales                              870     1,039     1,453     1,978     2,217
                Less: Excise duty                           -        -         -         -         -
                Net Sales                                870     1,039     1,453     1,978     2,217
                Total operating income                   870     1,039     1,453     1,978     2,217
                % chg                                 28.3        19.5      39.8      36.2      12.0
                Total Expenditure                        272      303       362       481       530
                (Increase)/ Decrease in stock in trade      -        -        4          -         -
                Cost of Production                        77      111       119       138       153
                Staff Costs                               96      116       134       201       231
                Power & Fuel                               7       14        19        23        25
                Other Expenses                            93       62        86       120       121
                EBITDA
                EBITDA                                   598      737      1,091     1,497     1,686
                % chg                                 27.5        23.3      48.1      37.2      12.6
                (% of Net Sales)                      68.7        70.9      75.1      75.7      76.1
                Depreciation & Amortisation              124      220       321       432       467
                EBIT                                     474      516       770      1,065     1,219
                % chg                                 34.4         9.0      49.1      38.3      14.5
                (% of Net Sales)                      54.4        49.7      53.0      53.8      55.0
                Interest & other Charges                  16       14         5         4         4
                Other Income                              56       67        35        30        33
                (% of PBT)                            10.8        11.7       4.4       2.7       2.7
                Share in profit of Associates               -        -         -         -         -
                Recurring PBT                            513      569       800      1,090     1,248
                % chg                                 32.6        10.9      40.5      36.3      14.5
                Prior Period & Extr. Exp./(Inc.)            -        -         -         -         -
                PBT (Reported)                           513      569       800      1,090     1,248
                Tax                                      201      229       299       392       444
                (% of PBT)                            39.2        40.3      37.4      35.9      35.5
                PAT (Reported)                           312      340       501       699       805
                Add: Share of earnings of associate      1.1       0.2       0.8       1.0       1.2
                Less: Minority interest (MI)             (14)     (28)      (18)      (12)      (10)
                PAT after MI (Reported)                  327      368       520       712       816
                ADJ. PAT
                ADJ. PA                                  327      368       520       712       816
                % chg                                 32.8        12.7      41.2      36.9      14.6
                (% of Net Sales)                      37.6        35.4      35.8      36.0      36.8
                Basic EPS (Rs)                           8.3       9.3      13.2      18.1      20.7
                Fully Diluted EPS (Rs)                   8.3       9.3      13.2      18.1      20.7
                % chg                                 32.8        12.7      41.2      36.9      14.6


June 22, 2010                                                                                      17
Sun TV Network | Initiating Coverage


                Balance Sheet (Consolidated)                                      Rs crore
                Y/E March (Rs cr)           FY2008   FY2009   FY2010E   FY2011E   FY2012E

                Equity Share Capital          197      197       197       197       197
                Preference Capital               -        -       88        88        88
                Reserves& Surplus            1,252    1,505     1,679     2,160     2,711
                             Funds
                Shareholders Funds           1,449    1,702     1,964     2,445     2,996
                Minority Interest              60       38        37        37        37
                Total Loans                    69       72         0         0         0
                Deferred Tax Liability          1       26        34        34        34
                Total Liabilities            1,580    1,838     2,035     2,516     3,067

                APPLICATION OF FUNDS
                APPLICATION
                Gross Block                  1,019    1,491     1,889     2,383     2,788
                Less: Acc. Depreciation       474      677       998      1,430     1,897
                Net Block                     545      815       892       954       891
                Capital Work-in-Progress      222      157       315       262       279
                Goodwill                         -        -         -         -         -
                Investments                   180      181       228       278       378
                Non Current Assets              8       23        30        45        55
                Current Assets                880      896      1,031     1,353     1,895
                  Cash                        430      365       435       581      1,036
                  Loans & Advances            192      286       267       336       377
                  Other                       258      245       330       435       482
                Current liabilities           256      234       461       376       431
                Net Current Assets            624      662       570       977      1,463
                Mis. Exp. not written off       0         0        0         0         0
                Total Assets                 1,580    1,838     2,035     2,516     3,067


June 22, 2010                                                                           18
Sun TV Network | Initiating Coverage


                Cash Flow Statement (Consolidated)                                    Rs crore
                Y/E March (Rs cr)              FY2008    FY2009   FY2010E   FY2011E   FY2012E

                Profit before tax                513       569       800      1,090     1,248
                Depreciation                     124       220       321       432       467
                Change in Working Capital        (93)       41       (54)     (109)      (41)
                Interest / Dividend (Net)         (32)     (26)      (31)      (24)      (28)
                Direct taxes paid                213       202       299       392       444
                Others                             54        1        21       (93)      (61)
                Cash Flow from Operations        354       604       757       905      1,142
                (Inc.)/ Dec. in Fixed Assets    (392)     (494)     (556)     (441)     (422)
                (Inc.)/ Dec. in Investments     (180)       (0)      (47)      (50)     (100)
                Cash Flow from Investing        (572)     (494)     (603)     (491)     (522)
                Issue of Equity                    76        6        67        12        10
                Inc./(Dec.) in loans              (49)      (4)      (73)       (4)       (3)
                Dividend Paid (Incl. Tax)        (46)     (184)     (105)     (296)     (197)
                Interest / Dividend (Net)          17        8        26        20        24
                               Financing
                Cash Flow from Financing           (1)    (174)      (85)     (267)     (166)
                Inc./(Dec.) in Cash             (220)      (64)       70       146       454
                Opening Cash balances            649       430       365       435       581
                Closing Cash balances            430       365       435       581      1,036


June 22, 2010                                                                               19
Sun TV Network | Initiating Coverage


                Key Ratios
                Y/E March (Rs cr)                     FY2008    FY2009   FY2010E   FY2011E   FY2012E

                Valuation Ratio (x)
                P/E (on FDEPS)                           48.5     43.0      30.5      22.3      19.4
                P/CEPS                                   45.3     38.9      26.9      19.7      17.1
                P/BV                                     10.9      9.3       8.4       6.7       5.4
                Dividend yield (%)                        0.6      0.6       1.9       1.2       1.4
                EV/Sales                                 14.3     12.0       8.6       6.3       5.6
                EV/EBITDA                                20.8     16.9      11.4       8.3       7.4
                EV / Total Assets                         7.9      6.8       6.1       4.9       4.1
                Per Share Data (Rs)
                EPS (Basic)                               8.3      9.3      13.2      18.1      20.7
                EPS (fully diluted)                       8.3      9.3      13.2      18.1      20.7
                Cash EPS                                  8.9     10.3      14.9      20.4      23.5
                DPS                                       2.5      2.5       7.5       5.0       5.8
                Book Value                               36.8     43.2      47.6      59.8      73.8
                Dupont Analysis
                EBIT margin                              54.4     49.7      53.0      53.8      55.0
                Tax retention ratio                       0.6      0.6       0.6       0.6       0.6
                Asset turnover (x)                        1.1      0.9       1.1       1.3       1.3
                RoIC (Post-tax)                          36.0     27.3      36.2      45.1      47.5
                Cost of Debt (Post Tax)                   0.1      0.1       0.1      18.2      18.5
                Leverage (x)                              0.8      0.4       0.2       0.0       0.0
                Operating RoE                            63.7     33.3      33.7      32.0      30.4
                Returns (%)
                RoCE (Pre-tax)                           33.1     30.2      39.8      46.8      43.7
                Angel RoIC (Pre-tax)                     59.2     45.7      57.8      70.3      73.6
                RoE                                      23.6     21.6      28.0      33.0      30.6
                Turnover ratios (x)
                Asset Turnover (Gross Block)              0.9      0.7       0.8       0.8       0.8
                Inventory / Sales (days)                   0         0        0         0         0
                Receivables (days)                       108       86        83        80        79
                Payables (days)                           15       17        12        12        11
                Working capital cycle (ex-cash) (days)    81      104        34        73        70
                Solvency ratios (x)
                Net debt to equity                        0.4      0.4       0.0       0.0       0.0
                Net debt to EBITDA                        0.1      0.1       0.0       0.0       0.0
                Interest Coverage (EBIT / Interest)      29.8     37.4     155.9     266.2     304.7


June 22, 2010                                                                                      20
Sun TV Network


Disclaimer
This document is solely for the personal information of the recipient, and must not be singularly used as the basis of any investment
decision. Nothing in this document should be construed as investment or financial advice. Each recipient of this document should make
such investigations as they deem necessary to arrive at an independent evaluation of an investment in the securities of the companies
referred to in this document (including the merits and risks involved), and should consult their own advisors to determine the merits and
risks of such an investment.

Angel Securities Limited, its affiliates, directors, its proprietary trading and investment businesses may, from time to time, make investment
decisions that are inconsistent with or contradictory to the recommendations expressed herein. The views contained in this document are
those of the analyst, and the company may or may not subscribe to all the views expressed within.

Reports based on technical and derivative analysis center on studying charts of a stock's price movement, outstanding positions and trading
volume, as opposed to focusing on a company's fundamentals and, as such, may not match with a report on a company's fundamentals.

The information in this document has been printed on the basis of publicly available information, internal data and other reliable sources
believed to be true, and is for general guidance only. Angel Securities Limited has not independently verified all the information contained
within this document. Accordingly, we cannot testify, nor make any representation or warranty, express or implied, to the accuracy, contents
or data contained within this document. While Angel Securities Limited endeavours to update on a reasonable basis the information
discussed in this material, there may be regulatory, compliance, or other reasons that prevent us from doing so.

This document is being supplied to you solely for your information, and its contents, information or data may not be reproduced, redistributed
or passed on, directly or indirectly.

Angel Securities Limited and its affiliates may seek to provide or have engaged in providing corporate finance, investment banking or other
advisory services in a merger or specific transaction to the companies referred to in this report, as on the date of this report or in the past.

Neither Angel Securities Limited, nor its directors, employees or affiliates shall be liable for any loss or damage that may arise from or in
connection with the use of this information.

Note: Please refer to the important `Stock Holding Disclosure' report on the Angel website (Research Section).


  Disclosure of Interest Statement                                           Sun TV Networks
  1. Analyst ownership of the stock                                                 No
  2. Angel and its Group companies ownership of the stock                           No
  3. Angel and its Group companies' Directors ownership of the stock                No
  4. Broking relationship with company covered                                      No

 Note: We have not considered any Exposure below Rs 1 lakh for Angel, its Group companies and Directors.


  Ratings (Returns) :             Buy (> 15%)                             Accumulate (5% to 15%)                       Neutral (-5 to 5%)
                                  Reduce (-5% to -15%)                    Sell (< -15%)
Sun TV Netwrok


               Address: Acme Plaza, ‘A’ Wing, 3rd Floor, M.V. Road, Opp. Sangam Cinema, Andheri (E), Mumbai - 400 059.
                                                        Tel : (022) 3952 4568 / 4040 3800


Research Team
Fundamental:
Sarabjit Kour Nangra                                                                               VP-Research, Pharmaceutical                                                            sarabjit@angeltrade.com
Vaibhav Agrawal                                                                                    VP-Research, Banking                                                                   vaibhav.agrawal@angeltrade.com
Vaishali Jajoo                                                                                     Automobile                                                                             vaishali.jajoo@angeltrade.com
Shailesh Kanani                                                                                    Infrastructure, Real Estate                                                            shailesh.kanani@angeltrade.com
Anand Shah                                                                                         FMCG , Media                                                                           anand.shah@angeltrade.com
Deepak Pareek                                                                                      Oil & Gas                                                                              deepak.pareek@angeltrade.com
Puneet Bambha                                                                                      Capital Goods, Engineering                                                             puneet.bambha@angeltrade.com
Sushant Dalmia                                                                                     Pharmaceutical                                                                         sushant.dalmia@angeltrade.com
Rupesh Sankhe                                                                                      Cement, Power                                                                          rupeshd.sankhe@angeltrade.com
Param Desai                                                                                        Real Estate, Logistics, Shipping                                                       paramv.desai@angeltrade.com
Sageraj Bariya                                                                                     Fertiliser, Mid-cap                                                                    sageraj.bariya@angeltrade.com
Viraj Nadkarni                                                                                     Retail, Hotels, Mid-cap                                                                virajm.nadkarni@angeltrade.com
Paresh Jain                                                                                        Metals & Mining                                                                        pareshn.jain@angeltrade.com
Amit Rane                                                                                          Banking                                                                                amitn.rane@angeltrade.com
Rahul Jain                                                                                         IT, Telecom                                                                            rahul.j@angeltrade.com
Jai Sharda                                                                                         Mid-cap                                                                                jai.sharda@angeltrade.com
Sharan Lillaney                                                                                    Mid-cap                                                                                sharanb.lillaney@angeltrade.com

Amit Vora                                                                                          Research Associate (Oil & Gas)                                                         amit.vora@angeltrade.com
V Srinivasan                                                                                       Research Associate (Cement, Power)                                                     v.srinivasan@angeltrade.com
Aniruddha Mate                                                                                     Research Associate (Infra, Real Estate)                                                aniruddha.mate@angeltrade.com
Mihir Salot                                                                                        Research Associate (Logistics, Shipping)                                               mihirr.salot@angeltrade.com
Chitrangda Kapur                                                                                   Research Associate (FMCG, Media)                                                       chitrangdar.kapur@angeltrade.com
Vibha Salvi                                                                                        Research Associate (IT, Telecom)                                                       vibhas.salvi@angeltrade.com
Pooja Jain                                                                                         Research Associate (Metals & Mining)                                                   pooja.j@angeltrade.com

Technicals:
Shardul Kulkarni                                                                                   Sr. Technical Analyst                                                                  shardul.kulkarni@angeltrade.com
Mileen Vasudeo                                                                                     Technical Analyst                                                                      vasudeo.kamalakant@angeltrade.com
Derivatives:
Siddarth Bhamre                                                                                    Head - Derivatives                                                                     siddarth.bhamre@angeltrade.com
Jaya Agarwal                                                                                       Derivative Analyst                                                                     jaya.agarwal@angeltrade.com


Institutional Sales Team:
Mayuresh Joshi                                                                                     VP - Institutional Sales                                                               mayuresh.joshi@angeltrade.com
Abhimanyu Sofat                                                                                    AVP - Institutional Sales                                                              abhimanyu.sofat@angeltrade.com
Nitesh Jalan                                                                                       Sr. Manager                                                                            niteshk.jalan@angeltrade.com
Pranav Modi                                                                                        Sr. Manager                                                                            pranavs.modi@angeltrade.com
Sandeep Jangir                                                                                     Sr. Manager                                                                            sandeepp.jangir@angeltrade.com
Ganesh Iyer                                                                                        Sr. Manager                                                                            ganeshb.Iyer@angeltrade.com
Jay Harsora                                                                                        Sr. Dealer                                                                             jayr.harsora@angeltrade.com
Meenakshi Chavan                                                                                   Dealer                                                                                 meenakshis.chavan@angeltrade.com
Gaurang Tisani                                                                                     Dealer                                                                                 gaurangp.tisani@angeltrade.com


Production Team:
Bharathi Shetty                                                                                    Research Editor                                                                        bharathi.shetty@angeltrade.com
Bharat Patil                                                                                       Production                                                                             bharat.patil@angeltrade.com
Dilip Patel                                                                                        Production                                                                             dilipm.patel@angeltrade.com


Angel Broking Ltd: BSE Sebi Regn No : INB 010996539 / CDSL Regn No: IN - DP - CDSL - 234 - 2004 / PMS Regn Code: PM/INP000001546 Angel Securities Ltd:BSE: INB010994639/INF010994639 NSE: INB230994635/INF230994635 Membership numbers: BSE 028/NSE:09946
Angel Capital & Debt Market Ltd: INB 231279838 / NSE FNO: INF 231279838 / NSE Member code -12798 Angel Commodities Broking (P) Ltd: MCX Member ID: 12685 / FMC Regn No: MCX / TCM / CORP / 0037 NCDEX : Member ID 00220 / FMC Regn No: NCDEX / TCM / CORP / 0302

Sun TV: Initiating Coverage

  • 1.
    Initiating Coverage |Media June 22, 2010 Sun TV Network BUY CMP Rs402 Sunny days ahead Target Price Rs497 Sun TV Networks (STNL) is a leader in 3 out of the 4 lucrative southern TV markets Investment Period 12 Months through its bouquet of 20 channels across genres. We have modeled in 23.5%, Stock Info 24.9% and 25.3% CAGR in top-line, core EBIT (post amortisation) and earnings respectively, for STNL, over FY2010-12E. We also estimate STNL's cash balance to Sector Media swell to a whopping Rs10bn (~Rs33 per share) in FY2012E. At Rs402, the stock is Market Cap (Rs cr) 15,852 trading at 19.4x FY2012E Earnings. We initiate coverage on the stock with a Buy Beta 0.6 Target Price recommendation and Target Price of Rs497 based on 24x P/E FY2012E EPS. EPS. 52 Week High / Low 453/210 STNL Ad Revenues to outpace Regional Ad growth, we peg 19% CAGR: During CAGR: Avg. Daily Volume 111,434 FY2010-12E, we expect STNL's standalone Ad revenues to register 19.3% CAGR, Face Value (Rs) 5 ahead of the 13.9% CAGR estimated in Regional advertising during the period, driven by:1) absorption of rate hikes (ad rates hiked 5-33% across channels), BSE Sensex 17,750 2) increased traction in niche Kids/Comedy channels, and 3) strong management Nifty 5,317 focus on utilising inventory during off-peak hours and new weekend programming. Reuters Code SUNTV.BO Multiple levers led by DTH to aid 37% CAGR in Subscription Revenues: During CAGR Bloomberg Code SUNTV@IN FY2010-12E, we expect STNL to register a robust 37% CAGR in overall Subscription revenues aided by: 1) strong 58% CAGR in DTH revenues on the back of 28% Shareholding Pattern (%) CAGR in DTH subscribers and rise in ARPUs to Rs40, and 2) 20% CAGR in Analogue Promoters 77.0 revenues aided by restructuring of distribution business and Malayalam channels (Surya TV, Kiran TV) turning pay, effective from April 1, 2010. MF / Banks / Indian FIIs 4.9 FII / NRIs / OCBs 8.1 Radio losses to reduce, Endhiran the wild card in FY2011E: Beyond broadcasting, FY2011E: we believe reduction in operating losses aided by revenue traction and cost Indian Public / Others 10.0 curtailment in Radio subsidiaries, Kal and SAFM (we have modeled in near breakeven in FY2012E at operating level) and contribution from big budget movie, Endhiran Abs. (%) 3m 1yr 3yr (slated for release in 2HFY2011E, we have factored in Rs175cr revenue from movie Sensex 1.9 23.9 22.7 distribution/production in FY2011E and 20-25% EBIT Margins from Endhiran) will Sun TV (3.0) 68.9 (1.3) be the key factors to watch out for. Key Financials (Consolidated) Y/E March (Rs cr) FY2009 FY2010E FY2011E FY2012E Net Sales 1,039 1,453 1,978 2,217 % chg 19.5 39.8 36.2 12.0 Profit Net Profit 368 520 712 816 % chg 12.7 41.2 36.9 14.6 OPM (%) 70.9 75.1 75.7 76.1 EPS (Rs) 9.3 13.2 18.1 20.7 P/E (x) 43.0 30.5 22.3 19.4 Anand Shah P/BV (x) 9.3 8.4 6.7 5.4 +91 22 4040 3800 Ext: 334 RoE (%) 21.6 28.0 33.0 30.6 Email: anand.shah@angeltrade.com RoCE (%) 30.2 39.8 46.8 43.7 Kapur Chitrangda Kapur EV/Sales (x) 12.0 8.6 6.3 5.6 +91 22 4040 3800 Ext: 323 EV/EBITDA (x) 16.9 11.4 8.3 7.4 Email: chitrangdar.kapur@angeltrade.com Source: Company, Angel Research Please refer to important disclosures at the end of this report
  • 2.
    Sun TV Network| Initiating Coverage Initiate Coverage with Buy and Target Price of Rs497 We estimate 25% Earnings CAGR over FY2010-12E We have modeled in 23.5%, 24.9% and 25.3% CAGR in top-line, core EBIT (post amortisation) and earnings respectively, for STNL over FY2010-12E. Moreover, we expect STNL's cash balance to increase to a whopping Rs10bn (~Rs33 per share) in FY2012E driven by strong rise in free cash flow (almost tripling over FY2010-12E) on the back of strong earnings growth. As a result, we expect STNL's RoE to sustain at 28-31% levels and RoIC to rise to 47% (36% in FY2010) in FY2012E. Exhibit 1: Our estimates are ahead of consensus Y/E March FY2011E FY2012E Comments Top-line (Rs cr) op-line Angel estimates 1,978 2,217 Consensus still not factoring in higher Consensus 1,780 2,045 DTH ARPUs and contribution from Endhiran Diff (%) 11.1 8.4 Profit Net Profit (Rs cr) Angel estimates 712 816 Higher MD's pay and SG&A/amortisation Consensus 670 797 due to Endhiran reflects our proximity to Diff (%) 5.8 5.0 consensus Earnings despite higher Top-line estimates* Source: Company, Angel Research, Bloomberg; Note: *Refer Exhibit: 20 TP based on 24x P/E FY2012E EPS, 5% discount to 3-yr Average We initiate coverage on STNL with a Buy recommendation and Target Price of Rs497, equating to an upside of 24% from current levels. Our Target Price is based on 24x P/E FY2012E EPS of Rs20.7, 5% discount to its 3-year historical average P/E of 25.4x to account for risks associated with 1) high ARPUs in DTH subscription model, and 2) release/success of Endhiran (big budget production). We believe that premium valuations for STNL are justified given its: 1) strong earnings CAGR of 25% over FY2010-12E, 2) leadership position in 3 out of 4 lucrative southern markets, which account for ~73% of the regional TV ad market, 3) strong group strength including political clout and presence across media value chains (distribution via Kal cables and DTH via Sun Direct), 4) unique low-cost business model (Broadcast fee and low SG&A), which enables it to register significantly higher operating margins, and 5) significant reduction in losses in Radio subsidiaries (we have factored in near break-even at operating level in FY2012E). Exhibit 2: Key Triggers - Absorption of rate hikes, Spike in DTH revenues and Endhiran Absorption of rate hikes (9-33% hike in ad rates in Tamil channels and 5-16% in other channels effective Jan 2010) Significant increase in DTH ARPUs to Rs40/month in FY2011E (Rs26/month) due to 5 niche and Malayalam channels turning pay Endhiran (budget of Rs100cr+) slated to release in 2HFY2011in three languages, viz. Tamil, Telugu and Hindi Reduction in Radio operating losses (EBITDA) from Rs20cr in FY2010 to near break-even in FY2012E Source: Company, Angel Research June 22, 2010 2
  • 3.
    Sun TV Network| Initiating Coverage Exhibit 3: STNL trading below its 3yr avg P/E of 25x Exhibit 4: STNL’s 3yr avg Prem over Sensex at 44% 55.0 250% 50.0 45.0 200% 40.0 35.0 150% 30.0 25.0 100% 20.0 15.0 50% 10.0 5.0 0% Jun-06 Aug-06 Dec-06 Jun-07 Aug-07 Dec-07 Jun-08 Aug-08 Dec-08 Jun-09 Aug-09 Dec-09 Apr-06 Oct-06 Feb-07 Apr-07 Oct-07 Feb-08 Apr-08 Oct-08 Feb-09 Apr-09 Oct-09 Feb-10 Apr-10 Apr-06 Jun-06 Aug-06 Apr-07 Jun-07 Aug-07 Apr-08 Jun-08 Aug-08 Apr-09 Jun-09 Aug-09 Apr-10 Oct-06 Dec-06 Feb-07 Oct-07 Dec-07 Feb-08 Oct-08 Dec-08 Feb-09 Oct-09 Dec-09 Feb-10 Source: Company, Angel Research; Note: Blue-line denotes 3yr avg P/E Source: Company, Angel Research; Note: Blue-line denotes 3yr avg Premium Exhibit 5: STNL & ZEEL trading at similar 1yr Fwd P/E Exhibit 6: STNL trades at 3yr avg Prem of 9% to ZEEL 55.0 BSE Sensex Sun TV Zee Ent 95% 50.0 75% 45.0 40.0 55% 35.0 30.0 35% 25.0 15% 20.0 15.0 -5% 10.0 5.0 -25% Apr-06 Jun-06 Aug-06 Oct-06 Dec-06 Feb-07 Apr-07 Jun-07 Aug-07 Oct-07 Dec-07 Feb-08 Apr-08 Jun-08 Aug-08 Oct-08 Dec-08 Feb-09 Apr-09 Jun-09 Aug-09 Oct-09 Dec-09 Feb-10 Apr-10 Apr-06 Jun-06 Apr-07 Jun-07 Apr-08 Jun-08 Apr-09 Jun-09 Apr-10 Aug-06 Dec-06 Feb-07 Aug-07 Dec-07 Feb-08 Aug-08 Dec-08 Feb-09 Aug-09 Dec-09 Feb-10 Oct-06 Oct-07 Oct-08 Oct-09 Source: Company, Angel Research Source: Company, Angel Research; Note: Blue-line denotes 3yr avg Premium Exhibit 7: Relative Valuation - Sun TV has the highest EPS CAGR and strong RoEs v/s peers MCap CAGR EPS CAGR PEG (x) P/E (x) RoE (%) EV/EBITDA (x) EV/EBITDA EV/Sales (x) (Rs cr) FY10-12E FY10-12E FY11E FY12E FY11E FY12E FY11E FY12E FY11E FY12E India Broadcasting Sun TV 15,877 25.3 0.8 22.3 19.5 33.0 30.6 8.3 7.4 6.3 5.6 Zee Ent # 14,322 21.8 0.9 23.1 19.5 14.5 15.4 NA NA 5.1 4.4 Print HT Media 3,597 22.2 0.8 20.2 16.8 15.1 15.7 12.3 10.2 2.3 2.0 Jagran Prakashan 3,766 16.2 1.0 19.1 15.9 31.0 34.3 11.3 9.5 3.4 2.9 Deccan Chronicle 3,035 11.3 0.8 10.6 9.3 18.9 19.1 5.7 4.9 2.7 2.3 Source: Company, Angel research; Note: # Zee Entertainment figures are consensus estimates from Bloomberg June 22, 2010 3
  • 4.
    Sun TV Network| Initiating Coverage Investment Arguments TV Ad to grow 15.6% CAGR, Regional Ad to grow faster Television sector is expected to outpace the During FY2010, the Media & Entertainment (M&E) industry grew at a mere 1.5% yoy M&E growth, registering a CAGR of 15.2% to Rs590bn impacted by the economic slowdown and shrinking corporate budgets. over FY2010-15E However, amidst weak macro economic conditions, the TV industry registered a modest growth of 6.9% yoy to Rs260bn. Going ahead, the M&E industry is expected to rebound and register 13.2% CAGR over FY2010-15E, while the Television sector is expected to outpace the M&E industry growth, registering a CAGR of 15.2% over the mentioned period. Television advertising, which accounts for 40% of the total advertisement market, is expected to post a CAGR of 15.6% over FY2010-15E to Rs182bn, aided by: 1) increasing number of channels (have nearly quadrupled to over 460 since FY2004), 2) rising viewership fragmentation, and 3) robust growth in niche genres like sports (due to strong properties like IPL) and regional (emerging as a strong cost-effective medium). Exhibit 8: Regional advertising to grow at faster pace v/s Hindi GECs and overall TV Advertising (Rs cr) FY2007 FY2008 FY2009 FY2010 FY2011E FY2012E FY2013E FY2014E FY2015E # FY10-15E Total M&E Size 44,160 51,630 57,840 58,700 65,230 74,180 83,610 95,640 109,200 13.2 Growth (% yoy) 14.8 16.9 12.0 1.5 11.1 13.7 12.7 14.4 14.2 Total Television Market Television 18,250 21,130 24,050 25,700 28,900 33,700 38,200 44,800 52,100 15.2 Growth (% yoy) 11.8 15.8 13.8 6.9 12.5 16.6 13.4 17.3 16.3 Total Advertising Market 16,570 19,640 22,120 22,030 24,690 28,130 32,270 37,070 42,690 14.1 (% of Total M&E) 37.5 38.0 38.2 37.5 37.9 37.9 38.6 38.8 39.1 (% of GDP) 0.46 0.50 0.53 0.49 0.51 0.53 0.56 0.59 0.62 Television Ad Market 6,100 7,110 8,250 8,800 9,860 11,330 13,260 15,520 18,150 15.6 (% of Total Ad Market) 36.8 36.2 37.3 39.9 39.9 40.3 41.1 41.9 42.5 (% of Total Television Market) 33.4 33.6 34.3 34.2 34.1 33.6 34.7 34.6 34.8 Growth (% yoy) 17.5 16.6 16.0 6.7 12.0 14.9 17.0 17.0 16.9 Hindi GEC* 2,501 2,588 2,863 2,860 3,066 3,456 3,978 4,625 5,372 13.4 (% of Televsion Ad Market) 41.0 36.4 34.7 32.5 31.1 30.5 30.0 29.8 29.6 Growth (% yoy) - 3.5 10.6 (0.1) 7.2 12.7 15.1 16.3 16.2 Regional TV Ad Market 1,281 1,742 2,186 2,464 2,771 3,195 3,766 4,439 5,245 16.3 (% of Televsion Ad Market) 21.0 24.5 26.5 28.0 28.1 28.2 28.4 28.6 28.9 Growth (% yoy) - 36.0 25.5 12.7 12.4 15.3 17.9 17.9 18.2 Source: FICCI-KPMG report 2010, Angel research, # denotes: CAGR, * Hindi GEC Market includes Doordarshan Favourable demographics and significant In Television, we believe the Regional Ad market is all set to outpace the larger Hindi changes in dynamics of Television industry GEC market and record 16.3% CAGR during FY2010-15E on the back of favourable coupled with strong cost effective demographics and significant changes in the dynamics of the Television industry proposition is expected to help the Regional (increasing fragmentation and consolidation in the Hindi GEC space). Moreover, Ad market to grow at a faster clip Regional Media has witnessed increased levels of activity owing to significantly untapped markets of Tier-II and III towns, which are emerging as the new focus areas of marketers owing to low penetration levels, steady growth in consumer spending and high long-term growth potential. June 22, 2010 4
  • 5.
    Sun TV Network| Initiating Coverage STNL Ad Revenues to outpace Regional Ad growth, we peg 19% CAGR South accounts for ~73% of the total The southern regional markets of Tamil Nadu, Andhra Pradesh, Karnataka and Kerala Regional Ad-market, where Sun is a leader account for ~73% of the total regional advertisement revenue. STNL with its dominant in three out of the four southern markets market share across lucrative southern markets, through its bouquet of 20 channels across genres like GECs, Music, News and Movies including flagship channels - Sun TV (Tamil Nadu, market share 68%), Gemini TV (Andhra Pradesh, market share 36%), Udaya TV (Karnataka, market share of 40%) and Surya TV (Kerala, market share of 33%) - is well placed to ride the regional wave. Exhibit 9: STNL's Ad Revenue to grow at faster 19% CAGR vis-à-vis Regional Ad growth at 14% CAGR (Rs cr) FY2007 FY2008 FY2009 FY2010 FY2011E FY2012E # FY10-12E Regional TV Ad Market 1,281 1,742 2,186 2,464 2,771 3,195 13.9 Growth (% yoy) - 36.0 25.5 12.7 12.4 15.3 Tamil Ad Market 380 517 647 732 826 959 14.4 Telegu Ad market 301 406 509 572 643 741 13.9 Kannada Ad Market 147 199 250 281 319 367 14.4 Malyalam Ad Market 97 141 181 205 227 259 12.5 Southern Ad Market 926 1,263 1,588 1,789 2,014 2,326 14.0 Bengali Ad Market 158 223 280 323 363 422 14.3 Marathi Ad Market 143 188 236 271 310 358 14.9 STNL's Ad Revenue (Standalone) 363 467 573 788 945 1,122 19.3 (% of Southern TV Ad Market) 39.3 37.6 38.2 47.3 50.4 51.9 Growth (% yoy) - (4.2) 1.4 23.9 6.6 3.0 STNL's Ad Revenue (Incl Radio) 364 475 606 846 1,015 1,208 19.5 Growth (% yoy) - 30.6 27.4 39.6 20.1 18.9 Source: Company, Angel Research; Note: # denotes CAGR We have modeled in a 19.3% CAGR in During FY2010-12E, we peg STNL's standalone Ad revenues (excluding Radio) to STNL's standalone Ad revenues driven by grow at 19.3% CAGR (management has guided for 17-18% yoy growth in advertising rate hikes, improved inventory utilisation in FY2011E), ahead of 13.9% CAGR in Regional advertising during the period, driven and traction in new channels by: 1) absorption of rate hikes (9-33% hike in ad rates in Tamil channels and 5-16% in other channels effective January 2010), 2) increased traction from niche kids/comedy channels (Adhitya TV, Khushi TV, Navvulu TV, Chintu TV and Ushe TV) launched in We expect ad-revenue growth to peak out 1QFY2010, 3) strong focus of management on utilising inventory during off-peak in 1QFY2011with culmination of base effect hours and new weekend programming, and 4) uptick in the economy (higher ad spends from the FMCG sector in specific, which contributes ~80% of STNL's advertisement revenues). While the ad-rate hike absorption will be a primary driver for high advertisement revenues, we expect the ad-revenue growth to peak out in 1QFY2011 (with the culmination of the base effect) and dip into mid-teens by 3Q and 4QFY2011. STNL has shown strong resilience to We highlight that during the last several quarters, STNL has posted high growth rates intensifying competition and shift in (in the range of 35-45%) in advertising revenue, partially aided by low base, showing advertisement flow towards sports; however, strong resilience to: 1) increasing competition in its Telugu, Kannada and Malayalam a change in the same carries downside risks markets, and 2) shift in advertising flow towards sports properties like IPL - Season 3. to our estimates June 22, 2010 5
  • 6.
    Sun TV Network| Initiating Coverage Exhibit 10: High Per Capita Income and Urban Population make South a lucrative market Per Capita Growth Total Pop Pop Pop Urban Pop % of Urban Income (%) (1,000s) (1,000s) Pop (current price - Rs) TN 38,573 10.6 62,406 27,459 44 Andhra Pradesh 34,063 16.3 76,210 19,053 25 Karnataka 35,555 16.6 52,851 18,498 35 Kerela 41,814 14.2 31,841 11,463 36 All India 33,283 1,028,737 285,989 28 Source: Economic Survey 2007-08, Angel Research Exhibit 11: Sun's Bastion with ~70% share Exhibit 12: Successfully fending off competition Tamil GEC Telegu GEC 80.0 45.0 40.3 40.1 70.0 40.0 36.5 36.4 36.7 34.5 68.1 68.5 69.0 69.8 35.0 66.7 67.4 Market Share (%) 60.0 Market Share (%) 30.0 50.0 25.0 40.0 20.0 30.0 15.0 20.0 10.0 10.0 5.0 - - 4QFY2009 1QFY2010 2QFY2010 3QFY2010 4QFY2010 1QFY2011 4QFY2009 1QFY2010 2QFY2010 3QFY2010 4QFY2010 1QFY2011 Sun TV Kalaignar TV Vijay TV Jaya TV Gemini TV Eanadu TV Zee Telugu Maa Telugu Raj TV Zee Tamizh Others DD8 Telugu Sitara TV Vanitha TV Source: TAM, Angel Research Source: TAM, Angel Research Exhibit 13: Battling out to stay a strong No1 Exhibit 14: Playing 2nd fiddle to leader Asianet Kannada GEC Malyalam GEC 50.0 60.0 43.7 44.1 42.8 45.0 38.4 39.1 40.0 37.6 50.0 Market Share (%) Market Share (%) 35.0 40.0 35.0 34.6 30.0 32.2 33.3 32.7 32.3 25.0 30.0 20.0 15.0 20.0 10.0 5.0 10.0 - - 4QFY2009 1QFY2010 2QFY2010 3QFY2010 4QFY2010 1QFY2011 4QFY2009 1QFY2010 2QFY2010 3QFY2010 4QFY2010 1QFY2011 Udaya TV ETV Kannada Zee Kannada Kasturi Suvarna DD9 Chandana (Kannada) Asianet Surya TV Kairali Amrita TV DD4 Malayalam Source: TAM, Angel Research Source: TAM, Angel Research June 22, 2010 6
  • 7.
    Sun TV Network| Initiating Coverage Multiple levers led by DTH to aid 37% CAGR in Subscription During FY2010-12E, we expect STNL to register a robust 37% CAGR in its overall Strong 58% CAGR in DTH and 20% CAGR Subscription revenues (including international) and higher 42% CAGR in domestic in Analogue revenues to drive 42% CAGR Subscription revenues aided by: 1) strong 58% CAGR in DTH revenues on the back of in domestic Subscription revenues over 28% CAGR in DTH subscribers and rise in ARPU to Rs40 (due to revised bouquet rates FY2010-12E at Rs52/month as reported in 4QFY2010), and 2) 20% CAGR in Analogue revenues aided by restructuring of distribution business and Malayalam channels (Surya TV, Kiran TV) turning pay effective April 1, 2010. Exhibit 15: STNL's Domestic Subscription Revenues to double over next two years FY2007 FY2008 FY2009 FY2010E FY2011E FY2012E FY10-12E # TV Subscription Market Industry Estimates C&S TV Households (mn) 70 78 86 95 104 112 8.6 Growth (% yoy) 12.9 11.4 10.3 10.5 9.5 7.7 C&S TV Penetration (%) 62.5 66.1 69.9 73.6 77.0 79.4 Analogue Cable Households (mn) 63.4 68.6 70.0 69.0 67.5 63.5 (4.1) Growth (% yoy) - 8.2 2.0 (1.4) (2.2) (5.9) Analogue Share (%) 90.6 88.0 81.4 72.6 64.9 56.7 DTH Households (mn) 2.6 4.0 10.0 16.0 24.0 30.0 36.9 Growth (% yoy) - 53.8 150.0 60.0 50.0 25.0 DTH Penetration (%) 3.7 5.1 11.6 16.8 23.1 26.8 Analogue Cable ARPUs 153 158 161 160 161 168 2.5 DTH ARPUs 160 170 160 155 155 171 5.2 Analogue Cable Revenues (Rs cr) 11,613 12,985 13,553 13,248 13,021 12,802 (1.7) DTH Revenues (Rs cr) 499 816 1,920 2,976 4,464 6,172 44.0 Total TV Subscription Market (Rs cr) 12,200 14,020 15,810 16,900 19,100 22,300 14.9 Growth (% yoy) - 14.9 12.8 6.9 13.0 16.8 Analog Contribution (%) 95.2 92.6 85.7 78.4 68.2 57.4 DTH Contribution (%) 4.1 5.8 12.1 17.6 23.4 27.7 STNL Subscription Revenue estimates Analogue Cable HHs (mn) 8.2 10.1 6.6 7.9 10.8 11.6 21.3 Growth (% yoy) - 22.9 (35.0) 20.4 37.0 7.4 DTH HHs (mn) - 1.1 2.8 5.8 7.7 9.5 28.0 Growth (% yoy) - - 154.5 107.1 32.8 23.4 % of total DTH Households - 27.5 28.0 36.3 32.1 31.7 Avg. Analogue Cable ARPUs 17 18 17 17 16 16 (1.1) DTH ARPUs - 25 25 26 40 40 23.3 Analogue Cable Revenues 167 219 131 158 212 227 19.9 DTH Revenues - 10 84 183 370 456 57.8 Domestic Subscription Revenue(Rs cr) 167 229 215 341 581 683 41.5 Growth (% yoy) - 36.7 (5.9) 58.4 70.4 17.6 Analog Contribution (%) 100.0 95.7 61.0 46.3 36.4 33.3 DTH Contribution (%) - 4.3 39.0 53.7 63.6 66.7 License Income (Int. Subscription) 34 38 54 56 59 62 5.0 Growth (% yoy) - 12.4 41.2 3.6 5.0 5.0 STNL Subscription Revenue (Rs cr) 201 267 269 397 640 745 37.0 Source: FICCI-KPMG Report 2010, Company, Angel Research; Note: #denotes CAGR June 22, 2010 7
  • 8.
    Sun TV Network| Initiating Coverage Higher ARPUs and Subscribers to aid 58% CAGR in DTH revenues 4QFY2010 registered a sharp revision in During 4QFY2010, the company reported a subscriber base of 6mn and a sharp DTH ARPUs to Rs36/month aided by uptick in DTH realizations to Rs35-36/month (Rs26-27/month) on account of 5 new addition of 5 niche channels and a new niche channels turning pay adding to the company's ARPUs (new channel bouquet bouquet priced at Rs52/month available at Rs52/month). Hence, we have modeled in 58% CAGR in DTH Subscription revenues over FY2010-12E, driven by - 1) yoy growth of 33% and 23% for FY2011-12E in the Subscriber base to 7.7mn and 9.5mn respectively, 2) significant 52% yoy increase in ARPU to Rs40/month (Rs26/month) in FY2011E. Non-confirmation of 4QFY2010 ARPU trend However, we note that ~60% of the DTH revenues for STNL come from its sister carries downside risks to our estimates concern Sun Direct, which has accepted the revised bouquet driving this sharp up-tick in DTH revenues. Nonetheless, STNL continues to offer its original bouquet. However, the stickiness of other operators to the same and non-confirmation of 4QFY2010 ARPU trend carries downside risks to our estimates. Malayalam channels and distribution re-jig to boost Analogue revenues Re-jig of Distribution and renewed focus on Post the significant dip in Analogue subscription revenues in FY2009 due to power domestic Subscription augurs well for STNL's cuts in Tamil Nadu, launch of new distributors (Arasu, Royal Cable) and Sun Direct Analogue Subscription revenues (cable operators boycotted the launch of DTH by cutting declaration levels), STNL has renewed its focus and restructured its Distribution business with two separate teams, the first focusing on South Indian operations and International business, and the second focusing on expanding the company's bouquet to the North, West and Eastern markets in India. We expect incremental addition of Moreover, on February 2010, STNL announced that its Malayalam channels Surya TV Rs20-25cr to STNL's Subscription revenues and Kiran TV would become pay channels from April 1, 2010. According to in FY2011E on account of Malayalam management, the non-CAS cable rates for the said channels, as a bouquet, would be channels turning pay Rs20.3/month and CAS cable rates would be Rs5.4/channel/month. We highlight that this move has come post its key competitor, Asianet, turning pay. We estimate that the Malayalam market has ~4mn C&S households and have modeled in an initial addition of 1.5mn subscribers in FY2011E with an ARPU of Rs15/month for STNL. Hence, we expect incremental addition of Rs20-25cr to STNL's Subscription revenues in FY2011E on account of the Malayalam channels turning pay. We expect the Analogue subscription revenues to register 20% CAGR over FY2010-12E, with 34% yoy growth in FY2011E itself on a low base (inclusion of Malayalam subscription revenues) Management upbeat on International subscription, we defer In contrast to management guidance, we In contrast to management guidance of sharp improvement in International subscription have conservatively modeled in 5% yoy revenue (program license fees), we have conservatively modeled in 5% CAGR over growth in Sun's International subscription FY2010-12E, owing to: 1) lack of traction in the same since several quarters, 2) changed revenues in our FY2011-12E estimates regulations for Pay TV in the South-East Asian countries of Malaysia and Singapore, and 3) currency fluctuation risks. However, the distribution re-jig done by the company (STNL has floated a wholly-owned subsidiary, Sun TV Network Europe in the UK to distribute and broadcast its channel in UK and Europe) poses an upside risk to our estimates. June 22, 2010 8
  • 9.
    Sun TV Network| Initiating Coverage Sun Pictures - Betting big on Endhiran Sun entered the Movie business in September 2008 through subsidiary, Sun Pictures, and has so far distributed 12-15 films, most of which have been successful and earning an estimated 15-20% Return on Capital Employed. Going ahead, we have modeled in an outlay of Rs70-80cr for FY2011-12E for distribution of 10-12 movies annually. Endhiran slated for release in 2HFY2011E STNL recently entered into movie production with its high budget movie, Endhiran is expected to register returns of 20-25% at (estimated budget for the movie is Rs100cr+), starring the southern superstar Rajnikant EBIT level. We estimate a 150% yoy growth and Bollywood's Aishwarya Rai. The movie is expected to be released in 2HFY2011in in Movie revenue for FY2011E to Rs175cr, three languages, viz. Tamil, Telugu and Hindi. Given the star cast and cutting edge tapering down to Rs110cr in FY2012E production techniques used in this movie, we expect it to register returns of 20-25% at the EBIT level. Management has indicated that this is a one-off venture, and the company would be focusing only on the distribution business in the future. For FY2011E, we estimate STNL revenues from movie distribution (including release of Endhiran) to increase 150% yoy to Rs175cr (Rs70cr) and then taper down to Rs110cr in FY2012E, as effects of revenue traction from Endhiran wanes. Radio - to reach near break-even at operating level by FY2012E Sun operates 44 radio stations in total and has two subsidiaries Kal Radio (Kal) and South Asia FM (SAFM) with stake of 97.8% and 59.2% respectively. STNL has entered into a strategic tie-up to broadcast its own radio channels under the Red FM brand (holds 48.9% stake in Red FM), operating at 93.5MHz. Consequently, S FM or Suryan FM was re-branded into Red FM across 38 cities (except for the ones in Tamil Nadu) in India. Exhibit 16: Consolidated Radio losses to moderate to Rs37cr in FY2012E Y/E March FY2008 FY2009 FY2010 FY2011E FY2012E Net Sales 9 33 58 70 86 Growth (% yoy) - 273.8 74.4 21.9 21.9 Other Income 6 2 2 3 3 Total Income 14 35 59 73 89 Operating Expenditure 33 68 77 80 87 (% of sales) 377.6 205.9 134.0 113.6 100.9 Profit Operating Profit (25) (35) (20) (10) (1) OPM % (277.6) (105.9) (34.0) (13.6) (0.9) Depn. & Amortn. 11 36 36 37 39 (% of sales) 122.5 107.1 61.4 52.5 45.0 PBIT (35) (71) (55) (47) (39) PBIT % (400.1) (213.1) (95.4) (66.1) (45.8) Interest 24.9 28.2 12.8 1.0 1.0 PAT (55) (97) (66) (45) (37) Source: Company, Angel Research June 22, 2010 9
  • 10.
    Sun TV Network| Initiating Coverage We peg 22% CAGR in top-line aided by On a consolidated basis, we expect the company's Radio subsidiaries (Kal and SAFM) re-branding of radio stations to Red FM and to report top-line CAGR of 22% over FY2010-12E to Rs86cr (Rs58cr) driven by: Ad-rate hike of 12-15% effective June 2010 1) Red FM, the uniform brand identity of the company's radio channels, will act as an effective tool for marketing the stations with agencies and customers, and 2) Red FM has announced an increase in its ad rates by 12-15% effective June 2010. At operating level, we expect Radio business In terms of Earnings, we expect the Radio business to register significant reduction in to reach near break-even in FY2012E but operating losses (EBITDA level) from Rs20cr in FY2010 to near break-even in FY2012E drag consolidated EPS down by ~4% aided by sharp cost curtailment measures. Moreover, at the PAT level, we expect the Radio business to reduce its losses to Rs37cr in FY2012E (aided by significant reduction in interest costs as Loans & Advances to Radio subsidiaries have been reversed), down from Rs66cr in FY2010, dragging down the consolidated EPS by ~4%. Exhibit 17: Kal Radio - Strong Operating Profitability Exhibit 18: SAFM - To remain a drag operationally 60.0 40.0 34.3 51.6 50.0 30.0 27.5 43.0 22.0 40.0 35.9 20.0 11.1 30.0 10.0 (Rs cr) 22.0 2.3 (Rs cr) 19.9 20.0 - 14.0 8.2 (10.0) 10.0 6.6 - (20.0) (16.7) (20.6) (23.6) (10.0) (6.2) (30.0) (7.9) (28.9) (27.9) (20.0) (40.0) FY08 FY09 FY10 FY11E FY12E FY08 FY09 FY10 FY11E FY12E Revenue EBITDA Revenue EBITDA Source: Company, Angel Research Source: Company, Angel Research Kal Radio - Profitable at Operating level, to break-even at PAT in FY12E Kal Radio to drive growth at operational During FY2010, Kal Radio (18 radio stations under operation primarily in South India) level, while SAFM is unlikely to achieve clocked 63% yoy growth in top-line to Rs36cr (Rs22cr) aided by addition of new stations EBITDA breakeven by FY2012E and better inventory utilisation, and achieved operating profit of Rs8.2cr (loss of Rs6.2cr) as operational cost remained flat. Going forward, we have modeled in 20% CAGR in top-line (aided largely by rate hikes as incremental gain from new stations getting added is factored in the base) and expect it to report a turnover of Rs43cr and Rs52cr in FY2011E and FY2012E, respectively. Operating profit is expected to log in 55% CAGR over FY2010-12E as we have factored in only a marginal 7-8% yoy increase in operating expenditure. SAFM - Operational losses to sustain in near term In FY2010, SAFM (23 radio stations under operation primarily in Tier-III cities) doubled its top-line to Rs22cr (Rs11cr) aided by addition of new stations and better inventory utilisation. However, SAFM registered operating loss of Rs28cr (loss of Rs29cr) due to 25% rise in operational costs. Going forward, we expect SAFM to post revenue CAGR of 25% over FY2010-12E. However, we do not expect the subsidiary to achieve EBITDA breakeven by FY2012E, in contrast to management guidance of EBITDA breakeven by FY2011E, and have modeled in a loss of Rs21cr for FY2012E. June 22, 2010 10
  • 11.
    Sun TV Network| Initiating Coverage Financial Outlook Steady Advt., sharp spike in DTH to aid 24% CAGR in top-line During FY2010-12E, we expect STNL to report a strong consolidated 23.5% CAGR in revenues driven largely by: 1) 19.5% CAGR in Advertising revenues, 2) 37% CAGR in Subscription revenues largely led by 58% CAGR in DTH revenues, and 3) sharp spike in Movie revenues driven by the release of the big budget Endhiran (slated for release in 2HFY2011E), though mainly captured in FY2011E and tapering off in FY2012E. Exhibit 19: Consolidated Top-line Model - 36% yoy in FY2011E and 24% CAGR over FY2010-12E (Rs cr) FY08 FY09 FY10 FY11E FY12E FY10-12E # Key Growth Drivers Advertising Revenue 475 606 846 1,015 1,208 19.5 Growth (% yoy) 30.6 27.4 39.6 20.1 18.9 Broadcasting 467 573 788 945 1,122 19.3 Rate hike absorption, Incremental gains from niche channels Growth (% yoy) 28.5 22.7 37.6 20.0 18.7 and better inventory utilisation Radio 9 33 58 70 86 21.9 Higher inventory off-take and recent rate hikes in Red FM Growth (% yoy) 790.0 272.6 74.4 21.9 21.9 (12-15%) Fee Broadcast Fee 126 130 135 142 148 4.6 Modeling in conservative growth based on hike in slot rates, Growth (% yoy) 15.7 3.8 3.4 5.0 4.2 await 1QFY11 results before upgrading Subscription 268 269 397 640 745 37.0 Growth (% yoy) 32.8 0.6 47.4 61.4 16.4 Analogue 219 131 158 212 227 20.1 Distribution re-jig (4QFY10 exhibits traction) and Malayalam Growth (% yoy) 31.1 (40.2) 20.2 34.5 7.4 channels turning pay (to add Rs20-25cr) DTH 10 84 183 370 456 57.8 Subscriber addition and revised ARPU (Rs40/month) Growth (% yoy) - 748.5 117.9 101.9 23.4 Program Licence 38 54 56 59 62 5.0 Renewed focus, distribution tie-ups in UK - modeled a 5% Growth (% yoy) 12.4 41.2 3.6 5.0 5.0 CAGR significantly lower than Mgmt guidance Movies - 28 70 175 110 25.4 Endhiran release to spike revenues in FY11E, partialy Growth (% yoy) - - 148.0 150.0 (37.1) spill-over in FY12E Other Sales 1 6 6 6 6 3.3 Largely Income from content trading and Aircraft charter Growth (% yoy) - - 0.9 3.2 3.4 services - to remain flat Net Sales 870 1,039 1,453 1,978 2,217 23.5 Growth (% yoy) - 19.5 39.8 36.2 12.0 Source: Company, Angel Research; Note: #denotes CAGR June 22, 2010 11
  • 12.
    Sun TV Network| Initiating Coverage Margins to sustain, we peg consolidated Earnings CAGR at 25% During FY2010-12E, we expect EBITDA Margins to hover between 75-76% levels aided by significant reduction in Radio losses (to achieve near break-even in FY2012E at operational level) and higher operating leverage (as majority of incremental top-line growth will be driven by ad rate hike and higher subscription revenues). However, higher SG&A expenses (Endhiran release in FY2011E) and spike in MD's pay (low base) to the usual 10% of PBT is likely to restrict Margin expansion. In terms of core EBIT margins (including amortisation costs for films and distribution rights), we expect STNL to sustain margins at ~59% in FY2011E, before expanding by 130bp yoy in FY2012E due to higher amortisation charges on the back of release of Endhiran in FY2011E. On a consolidated basis, we expect STNL's earnings to register 25.3% CAGR over FY2010-12E driven largely by strong top-line growth and stable Margins. Exhibit 20:Cost and Earnings Breakup - Expect Margins to remain stable in FY11E before expansion in FY12E (Rs cr) FY08 FY09 FY10 FY11E FY12E FY10-12E # Key Growth Drivers Cost of Revenues 77 111 119 138 153 13.3 Drop as % of sales as incremental revenue from Ad rate hike % of Sales 8.8 10.7 8.2 7.0 6.9 and DTH, Model absolute growth of ~13% Staff Cost 96 116 134 201 231 31.4 Spike in FY11 as we model higher Pay to MD in FY11-12E % of Sales 11.0 11.1 9.2 10.1 10.4 and Staff costs for new team set-ups MD's Pay 65 74 74 125 141 38.1 In FY10, MD's Pay remained at FY09 levels, We model FY11 % of Sales 7.5 7.1 5.1 6.3 6.4 Pay at usual 10% of PBT Other Staff Costs 26 28 42 56 68 27.9 Modeled in 28% CAGR rise in Staff costs due to new team % of Sales 3.0 2.7 2.9 2.9 3.1 set-ups in distribution and new channels Radio Staff Costs 5 13 18 19 21 9.4 To rise moderately at 9% CAGR as all stations are now % of Radio Sales 51.0 40.7 31.0 27.5 25.0 operational and strong cost focus SG&A Expenses 41 54 75 107 106 19.1 Modeling in 19% CAGR to support new launches, FY11 to % of Sales 4.7 5.2 5.2 5.4 4.8 see spike due to Endhiran release Other Expenses 59 22 34 35 40 8.4 To register significant moderation due to lower losses in Radio % of Sales 6.8 2.1 2.3 1.8 1.8 EBITDA EBITDA 597 737 1,091 1,497 1,686 24.3 EBITDA Margin (%) 68.7 70.9 75.1 75.7 76.1 Amortisation 86 153 233 326 347 22.1 Spike in FY11E due to release of Endhiran, to moderate in % of Intangible Assets 15.9 20.8 23.6 26.7 24.3 FY12E Core EBIT 511 583 858 1,171 1,339 24.9 Core EBIT Margins to expand 130bp due to lower losses in Core EBIT Margin (%) 58.8 56.1 59.1 59.2 60.4 Radio and higher operating leverage PA Reported PAT (After MI) 327 368 520 712 816 25.3 PAT Margin (%) 37.6 35.4 35.8 36.0 36.8 Source: Company, Angel Research; Note: #denotes CAGR June 22, 2010 12
  • 13.
    Sun TV Network| Initiating Coverage Debt-free Balance Sheet, Cash to swell to ~Rs10bn in FY2012E STNL has a strong zero debt balance sheet and cash balance of ~Rs435cr as on FY2010. Moreover, despite modeling heavy capex (including movie acquisition costs) in the range of Rs420-440cr for FY2011-12E (in line with management guidance), we expect STNL's cash balance to swell to a whopping Rs10bn or ~Rs33/share in FY2012E accounting for almost 34% of capital employed. We attribute the jump in cash balance to strong rise in free cash flow (almost tripling over FY2010-12E) on strong earnings growth. As result, we expect STNL's RoE to sustain at 28-31% levels and RoIC to rise to 47% (36% in FY2010). Exhibit 21: FCF to triple boosting cash balance Exhibit 22: RoE to sustain, RoIC to rise to 47% 1,200 50 47 45 1,036 45 1,000 40 36 36 800 35 33 721 31 581 30 27 28 600 (Rs cr) (%) 430 435 463 25 24 22 400 365 20 202 200 15 110 10 - 5 (38) (200) - FY08 FY09 FY10 FY11E FY12E FY08 FY09 FY10 FY11E FY12E Free Cash Flow Cash Balance RoE RoIC Source: Company, Angel Research Source: Company, Angel Research June 22, 2010 13
  • 14.
    Sun TV Network| Initiating Coverage Key Concerns Delay/difficulty in absorption of rate hikes: We have modeled in a steady 19.3% CAGR in STNL's standalone advertising revenues over FY2010-12E aided by absorption of rate hikes (9-33% hike in ad rates in Tamil channels and 5-16% in other channels effective Jan 2010). Any delay/difficulty to pass the same to advertisers on account of competitive pressures, slowdown in GDP or other unforeseen factors would entail downside risks to our estimates. Fall in DTH ARPUs beyond Rs35-40/month: During 4QFY2010, the company reported a subscriber base of 6mn and a sharp uptick in DTH realisations to Rs35-36/month (Rs26-27/month) on account of 5 new niche channels turning pay (new channel bouquet available at Rs52/month). Hence, we have modeled in 58% CAGR in DTH Subscription revenues over FY2010-12E, driven by - 1) growth of 33% and 23% for FY2011-12E in the Subscriber base to 7.7mn and 9.5mn respectively, 2) significant 52% yoy increase in ARPU to Rs40/month (Rs26/month) in FY2011E. Hence, non-confirmation of 4QFY2010 ARPU trend carries significant downside risks to our estimates. Delay/failure of big budget Endhiran: STNL is slated to release its first big budget Endhiran: movie, Endhiran (estimated budget of Rs100cr+), starring the southern superstar Rajnikant and Bollywood's Aishwarya Rai. For FY2011E, we estimate revenues from movie distribution (including release of Endhiran) to increase 150% yoy to Rs175cr (Rs70cr) with Endhiran expected to register 20-25% returns at the EBIT level. Any delays in the release of movie or the movie tanking at the box office would dent our revenue and earnings estimates. June 22, 2010 14
  • 15.
    Sun TV Network| Initiating Coverage Company Background Headquartered in Chennai, STNL was incorporated in December 1985 and listed in April 2006. STNL, promoted by Kalanithi Maran, belongs to the Sun Network Group, which is straddled across the media value chain, viz. Broadcasting, Radio, Films, Cable distribution, DTH and Print Media. STNL is India's leading media conglomerate with 20 TV channels with a significant presence in the south (leader in three of the four southern states - operates in Tamil Nadu, Andhra Pradesh and Karnataka). Exhibit 23: STNL operates 20 channels in 4 Southern markets Channels Tamil Telegu Kannada Malyalam GEC Sun TV Gemini TV Udaya TV Surya TV News Sun News Gemini News Udaya Varthegalu Movies K TV Teja TV Udaya Movies Kiran TV Music Sun Music Gemini Music Udaya TV 2 Kids Chutti TV Khushi TV Chintu TV Comedy Adithya TV Navvulu TV Ushe TV Source: Company, Angel Research Beyond television broadcasting, the company has a strong presence in radio broadcasting (has a total of 44 FM licences) via its two subsidiaries - Kal FM (98% stake) and SAFM (59% stake) and strategic tie-up with Red FM. Moreover, STNL entered the movie business in September 2008 through its subsidiary, Sun Pictures and has so far distributed 12-15 films. The company is also slated to release its first in-house production, Endhiran during 2HFY2011. Exhibit 24: Sun TV Business Model - Spans Broadcasting, Radio and Movies Sun TV Network 20 television channels across 4 southern states & 3 FM radio stations 59.2% Division of 97.8% Subsidiary STNL Subsidiary South Asia FM Sun Pictures Kal Radio 49% beneficial 23 licenses focused Production/distrib 18 licenses focused interest on northern, eastern ution of movies in on Southern cities & western region southern region Strategic Alliance 3 radio stations in Mumbai, with RED FM Delhi and Kolkatta Source: Company, Angel Research June 22, 2010 15
  • 16.
    Sun TV Network| Initiating Coverage Unique low-cost business model keeps cost off STNL's books STNL operates on "Sponsored Revenue model", wherein it leases out its time slots to third party content producers for a fixed fee (termed as broadcast fee in P&L). In return, the content producers have the right to about 4mins of advertising inventory per half an hour, while STNL gets 2mins of this half an hour slot. Since the content aired on STNL channels are not owned by STNL, the cost of content and the risks of recouping the cost lie with the producer. Moreover, the company also produces a large amount of content aired in the non-prime time slots in-house, which furthers lowers its production costs. The company's in-house production team sources around 75% of its daily content requirement in-house, out of which 40-45% is movie based, 8-10% is news and the rest is accounted by game, talk and variety shows. Further, the company has exclusive contracts with artistes and anchors as part of its talent retention strategy. STNL leads movie broadcasting via its largest movie library STNL has a strong movie library comprising more than 8,500 titles, with rights across all the four major South Indian languages. Apart from having an extensive movie library, STNL purchases around 90% of all movie releases in these languages. The company employs various strategies such as airing free trailers of movies prior to release, through its wide range of channels. Consequently, the producer contracts satellite rights to STNL at lower rates, resulting in lower acquisition costs for the company. Usually, Sun pays Rs1-1.5cr for acquiring satellite rights and recovers the same in the first two runs of the movie. In the southern market, screening of movies on satellite channels is allowed only after 1-3 years of the theatrical release. Movies and movie-related content attracts significant viewership in down south. As a result, STNL earns around 25% of its advertising revenues from movies aired on dedicated channels in each market. Foray into niche channels like Kids and Comedy genre Apart from the various GEC channels, STNL also broadcasts dedicated movie channels, kids and infotainment channels and comedy channels (refer Exhibit 23). Foray into these niche categories and entertaining selective TV viewers was a bold move. Nonetheless, the move has paid well for the company - Chutti TV, the Tamil children entertainment channel has ~5% market share and contributes ~3% to Sun's revenues. For its kid's channels, Sun has exclusive tie ups with the content providers (tied up with Disney India in December 2009 and DQ Entertainment in June 2010), wherein Sun buys exclusive rights to cartoons and then dubs them in four languages. Operating costs involved are confined to dubbing costs. This scale and low-cost model ensures that these niche channels do not cause any significant margin dilution. STNL's comedy channels also work on a similar low-cost model wherein clips from the movies in Sun's library are telecast, keeping production costs minimal. June 22, 2010 16
  • 17.
    Sun TV Network| Initiating Coverage Profit & Loss Statement (Consolidated) Rs crore Y/E March (Rs cr) FY2008 FY2009 FY2010E FY2011E FY2012E Gross sales 870 1,039 1,453 1,978 2,217 Less: Excise duty - - - - - Net Sales 870 1,039 1,453 1,978 2,217 Total operating income 870 1,039 1,453 1,978 2,217 % chg 28.3 19.5 39.8 36.2 12.0 Total Expenditure 272 303 362 481 530 (Increase)/ Decrease in stock in trade - - 4 - - Cost of Production 77 111 119 138 153 Staff Costs 96 116 134 201 231 Power & Fuel 7 14 19 23 25 Other Expenses 93 62 86 120 121 EBITDA EBITDA 598 737 1,091 1,497 1,686 % chg 27.5 23.3 48.1 37.2 12.6 (% of Net Sales) 68.7 70.9 75.1 75.7 76.1 Depreciation & Amortisation 124 220 321 432 467 EBIT 474 516 770 1,065 1,219 % chg 34.4 9.0 49.1 38.3 14.5 (% of Net Sales) 54.4 49.7 53.0 53.8 55.0 Interest & other Charges 16 14 5 4 4 Other Income 56 67 35 30 33 (% of PBT) 10.8 11.7 4.4 2.7 2.7 Share in profit of Associates - - - - - Recurring PBT 513 569 800 1,090 1,248 % chg 32.6 10.9 40.5 36.3 14.5 Prior Period & Extr. Exp./(Inc.) - - - - - PBT (Reported) 513 569 800 1,090 1,248 Tax 201 229 299 392 444 (% of PBT) 39.2 40.3 37.4 35.9 35.5 PAT (Reported) 312 340 501 699 805 Add: Share of earnings of associate 1.1 0.2 0.8 1.0 1.2 Less: Minority interest (MI) (14) (28) (18) (12) (10) PAT after MI (Reported) 327 368 520 712 816 ADJ. PAT ADJ. PA 327 368 520 712 816 % chg 32.8 12.7 41.2 36.9 14.6 (% of Net Sales) 37.6 35.4 35.8 36.0 36.8 Basic EPS (Rs) 8.3 9.3 13.2 18.1 20.7 Fully Diluted EPS (Rs) 8.3 9.3 13.2 18.1 20.7 % chg 32.8 12.7 41.2 36.9 14.6 June 22, 2010 17
  • 18.
    Sun TV Network| Initiating Coverage Balance Sheet (Consolidated) Rs crore Y/E March (Rs cr) FY2008 FY2009 FY2010E FY2011E FY2012E Equity Share Capital 197 197 197 197 197 Preference Capital - - 88 88 88 Reserves& Surplus 1,252 1,505 1,679 2,160 2,711 Funds Shareholders Funds 1,449 1,702 1,964 2,445 2,996 Minority Interest 60 38 37 37 37 Total Loans 69 72 0 0 0 Deferred Tax Liability 1 26 34 34 34 Total Liabilities 1,580 1,838 2,035 2,516 3,067 APPLICATION OF FUNDS APPLICATION Gross Block 1,019 1,491 1,889 2,383 2,788 Less: Acc. Depreciation 474 677 998 1,430 1,897 Net Block 545 815 892 954 891 Capital Work-in-Progress 222 157 315 262 279 Goodwill - - - - - Investments 180 181 228 278 378 Non Current Assets 8 23 30 45 55 Current Assets 880 896 1,031 1,353 1,895 Cash 430 365 435 581 1,036 Loans & Advances 192 286 267 336 377 Other 258 245 330 435 482 Current liabilities 256 234 461 376 431 Net Current Assets 624 662 570 977 1,463 Mis. Exp. not written off 0 0 0 0 0 Total Assets 1,580 1,838 2,035 2,516 3,067 June 22, 2010 18
  • 19.
    Sun TV Network| Initiating Coverage Cash Flow Statement (Consolidated) Rs crore Y/E March (Rs cr) FY2008 FY2009 FY2010E FY2011E FY2012E Profit before tax 513 569 800 1,090 1,248 Depreciation 124 220 321 432 467 Change in Working Capital (93) 41 (54) (109) (41) Interest / Dividend (Net) (32) (26) (31) (24) (28) Direct taxes paid 213 202 299 392 444 Others 54 1 21 (93) (61) Cash Flow from Operations 354 604 757 905 1,142 (Inc.)/ Dec. in Fixed Assets (392) (494) (556) (441) (422) (Inc.)/ Dec. in Investments (180) (0) (47) (50) (100) Cash Flow from Investing (572) (494) (603) (491) (522) Issue of Equity 76 6 67 12 10 Inc./(Dec.) in loans (49) (4) (73) (4) (3) Dividend Paid (Incl. Tax) (46) (184) (105) (296) (197) Interest / Dividend (Net) 17 8 26 20 24 Financing Cash Flow from Financing (1) (174) (85) (267) (166) Inc./(Dec.) in Cash (220) (64) 70 146 454 Opening Cash balances 649 430 365 435 581 Closing Cash balances 430 365 435 581 1,036 June 22, 2010 19
  • 20.
    Sun TV Network| Initiating Coverage Key Ratios Y/E March (Rs cr) FY2008 FY2009 FY2010E FY2011E FY2012E Valuation Ratio (x) P/E (on FDEPS) 48.5 43.0 30.5 22.3 19.4 P/CEPS 45.3 38.9 26.9 19.7 17.1 P/BV 10.9 9.3 8.4 6.7 5.4 Dividend yield (%) 0.6 0.6 1.9 1.2 1.4 EV/Sales 14.3 12.0 8.6 6.3 5.6 EV/EBITDA 20.8 16.9 11.4 8.3 7.4 EV / Total Assets 7.9 6.8 6.1 4.9 4.1 Per Share Data (Rs) EPS (Basic) 8.3 9.3 13.2 18.1 20.7 EPS (fully diluted) 8.3 9.3 13.2 18.1 20.7 Cash EPS 8.9 10.3 14.9 20.4 23.5 DPS 2.5 2.5 7.5 5.0 5.8 Book Value 36.8 43.2 47.6 59.8 73.8 Dupont Analysis EBIT margin 54.4 49.7 53.0 53.8 55.0 Tax retention ratio 0.6 0.6 0.6 0.6 0.6 Asset turnover (x) 1.1 0.9 1.1 1.3 1.3 RoIC (Post-tax) 36.0 27.3 36.2 45.1 47.5 Cost of Debt (Post Tax) 0.1 0.1 0.1 18.2 18.5 Leverage (x) 0.8 0.4 0.2 0.0 0.0 Operating RoE 63.7 33.3 33.7 32.0 30.4 Returns (%) RoCE (Pre-tax) 33.1 30.2 39.8 46.8 43.7 Angel RoIC (Pre-tax) 59.2 45.7 57.8 70.3 73.6 RoE 23.6 21.6 28.0 33.0 30.6 Turnover ratios (x) Asset Turnover (Gross Block) 0.9 0.7 0.8 0.8 0.8 Inventory / Sales (days) 0 0 0 0 0 Receivables (days) 108 86 83 80 79 Payables (days) 15 17 12 12 11 Working capital cycle (ex-cash) (days) 81 104 34 73 70 Solvency ratios (x) Net debt to equity 0.4 0.4 0.0 0.0 0.0 Net debt to EBITDA 0.1 0.1 0.0 0.0 0.0 Interest Coverage (EBIT / Interest) 29.8 37.4 155.9 266.2 304.7 June 22, 2010 20
  • 21.
    Sun TV Network Disclaimer Thisdocument is solely for the personal information of the recipient, and must not be singularly used as the basis of any investment decision. Nothing in this document should be construed as investment or financial advice. Each recipient of this document should make such investigations as they deem necessary to arrive at an independent evaluation of an investment in the securities of the companies referred to in this document (including the merits and risks involved), and should consult their own advisors to determine the merits and risks of such an investment. Angel Securities Limited, its affiliates, directors, its proprietary trading and investment businesses may, from time to time, make investment decisions that are inconsistent with or contradictory to the recommendations expressed herein. The views contained in this document are those of the analyst, and the company may or may not subscribe to all the views expressed within. Reports based on technical and derivative analysis center on studying charts of a stock's price movement, outstanding positions and trading volume, as opposed to focusing on a company's fundamentals and, as such, may not match with a report on a company's fundamentals. The information in this document has been printed on the basis of publicly available information, internal data and other reliable sources believed to be true, and is for general guidance only. Angel Securities Limited has not independently verified all the information contained within this document. Accordingly, we cannot testify, nor make any representation or warranty, express or implied, to the accuracy, contents or data contained within this document. While Angel Securities Limited endeavours to update on a reasonable basis the information discussed in this material, there may be regulatory, compliance, or other reasons that prevent us from doing so. This document is being supplied to you solely for your information, and its contents, information or data may not be reproduced, redistributed or passed on, directly or indirectly. Angel Securities Limited and its affiliates may seek to provide or have engaged in providing corporate finance, investment banking or other advisory services in a merger or specific transaction to the companies referred to in this report, as on the date of this report or in the past. Neither Angel Securities Limited, nor its directors, employees or affiliates shall be liable for any loss or damage that may arise from or in connection with the use of this information. Note: Please refer to the important `Stock Holding Disclosure' report on the Angel website (Research Section). Disclosure of Interest Statement Sun TV Networks 1. Analyst ownership of the stock No 2. Angel and its Group companies ownership of the stock No 3. Angel and its Group companies' Directors ownership of the stock No 4. Broking relationship with company covered No Note: We have not considered any Exposure below Rs 1 lakh for Angel, its Group companies and Directors. Ratings (Returns) : Buy (> 15%) Accumulate (5% to 15%) Neutral (-5 to 5%) Reduce (-5% to -15%) Sell (< -15%)
  • 22.
    Sun TV Netwrok Address: Acme Plaza, ‘A’ Wing, 3rd Floor, M.V. Road, Opp. Sangam Cinema, Andheri (E), Mumbai - 400 059. Tel : (022) 3952 4568 / 4040 3800 Research Team Fundamental: Sarabjit Kour Nangra VP-Research, Pharmaceutical sarabjit@angeltrade.com Vaibhav Agrawal VP-Research, Banking vaibhav.agrawal@angeltrade.com Vaishali Jajoo Automobile vaishali.jajoo@angeltrade.com Shailesh Kanani Infrastructure, Real Estate shailesh.kanani@angeltrade.com Anand Shah FMCG , Media anand.shah@angeltrade.com Deepak Pareek Oil & Gas deepak.pareek@angeltrade.com Puneet Bambha Capital Goods, Engineering puneet.bambha@angeltrade.com Sushant Dalmia Pharmaceutical sushant.dalmia@angeltrade.com Rupesh Sankhe Cement, Power rupeshd.sankhe@angeltrade.com Param Desai Real Estate, Logistics, Shipping paramv.desai@angeltrade.com Sageraj Bariya Fertiliser, Mid-cap sageraj.bariya@angeltrade.com Viraj Nadkarni Retail, Hotels, Mid-cap virajm.nadkarni@angeltrade.com Paresh Jain Metals & Mining pareshn.jain@angeltrade.com Amit Rane Banking amitn.rane@angeltrade.com Rahul Jain IT, Telecom rahul.j@angeltrade.com Jai Sharda Mid-cap jai.sharda@angeltrade.com Sharan Lillaney Mid-cap sharanb.lillaney@angeltrade.com Amit Vora Research Associate (Oil & Gas) amit.vora@angeltrade.com V Srinivasan Research Associate (Cement, Power) v.srinivasan@angeltrade.com Aniruddha Mate Research Associate (Infra, Real Estate) aniruddha.mate@angeltrade.com Mihir Salot Research Associate (Logistics, Shipping) mihirr.salot@angeltrade.com Chitrangda Kapur Research Associate (FMCG, Media) chitrangdar.kapur@angeltrade.com Vibha Salvi Research Associate (IT, Telecom) vibhas.salvi@angeltrade.com Pooja Jain Research Associate (Metals & Mining) pooja.j@angeltrade.com Technicals: Shardul Kulkarni Sr. Technical Analyst shardul.kulkarni@angeltrade.com Mileen Vasudeo Technical Analyst vasudeo.kamalakant@angeltrade.com Derivatives: Siddarth Bhamre Head - Derivatives siddarth.bhamre@angeltrade.com Jaya Agarwal Derivative Analyst jaya.agarwal@angeltrade.com Institutional Sales Team: Mayuresh Joshi VP - Institutional Sales mayuresh.joshi@angeltrade.com Abhimanyu Sofat AVP - Institutional Sales abhimanyu.sofat@angeltrade.com Nitesh Jalan Sr. Manager niteshk.jalan@angeltrade.com Pranav Modi Sr. Manager pranavs.modi@angeltrade.com Sandeep Jangir Sr. Manager sandeepp.jangir@angeltrade.com Ganesh Iyer Sr. Manager ganeshb.Iyer@angeltrade.com Jay Harsora Sr. Dealer jayr.harsora@angeltrade.com Meenakshi Chavan Dealer meenakshis.chavan@angeltrade.com Gaurang Tisani Dealer gaurangp.tisani@angeltrade.com Production Team: Bharathi Shetty Research Editor bharathi.shetty@angeltrade.com Bharat Patil Production bharat.patil@angeltrade.com Dilip Patel Production dilipm.patel@angeltrade.com Angel Broking Ltd: BSE Sebi Regn No : INB 010996539 / CDSL Regn No: IN - DP - CDSL - 234 - 2004 / PMS Regn Code: PM/INP000001546 Angel Securities Ltd:BSE: INB010994639/INF010994639 NSE: INB230994635/INF230994635 Membership numbers: BSE 028/NSE:09946 Angel Capital & Debt Market Ltd: INB 231279838 / NSE FNO: INF 231279838 / NSE Member code -12798 Angel Commodities Broking (P) Ltd: MCX Member ID: 12685 / FMC Regn No: MCX / TCM / CORP / 0037 NCDEX : Member ID 00220 / FMC Regn No: NCDEX / TCM / CORP / 0302