Download to read offline
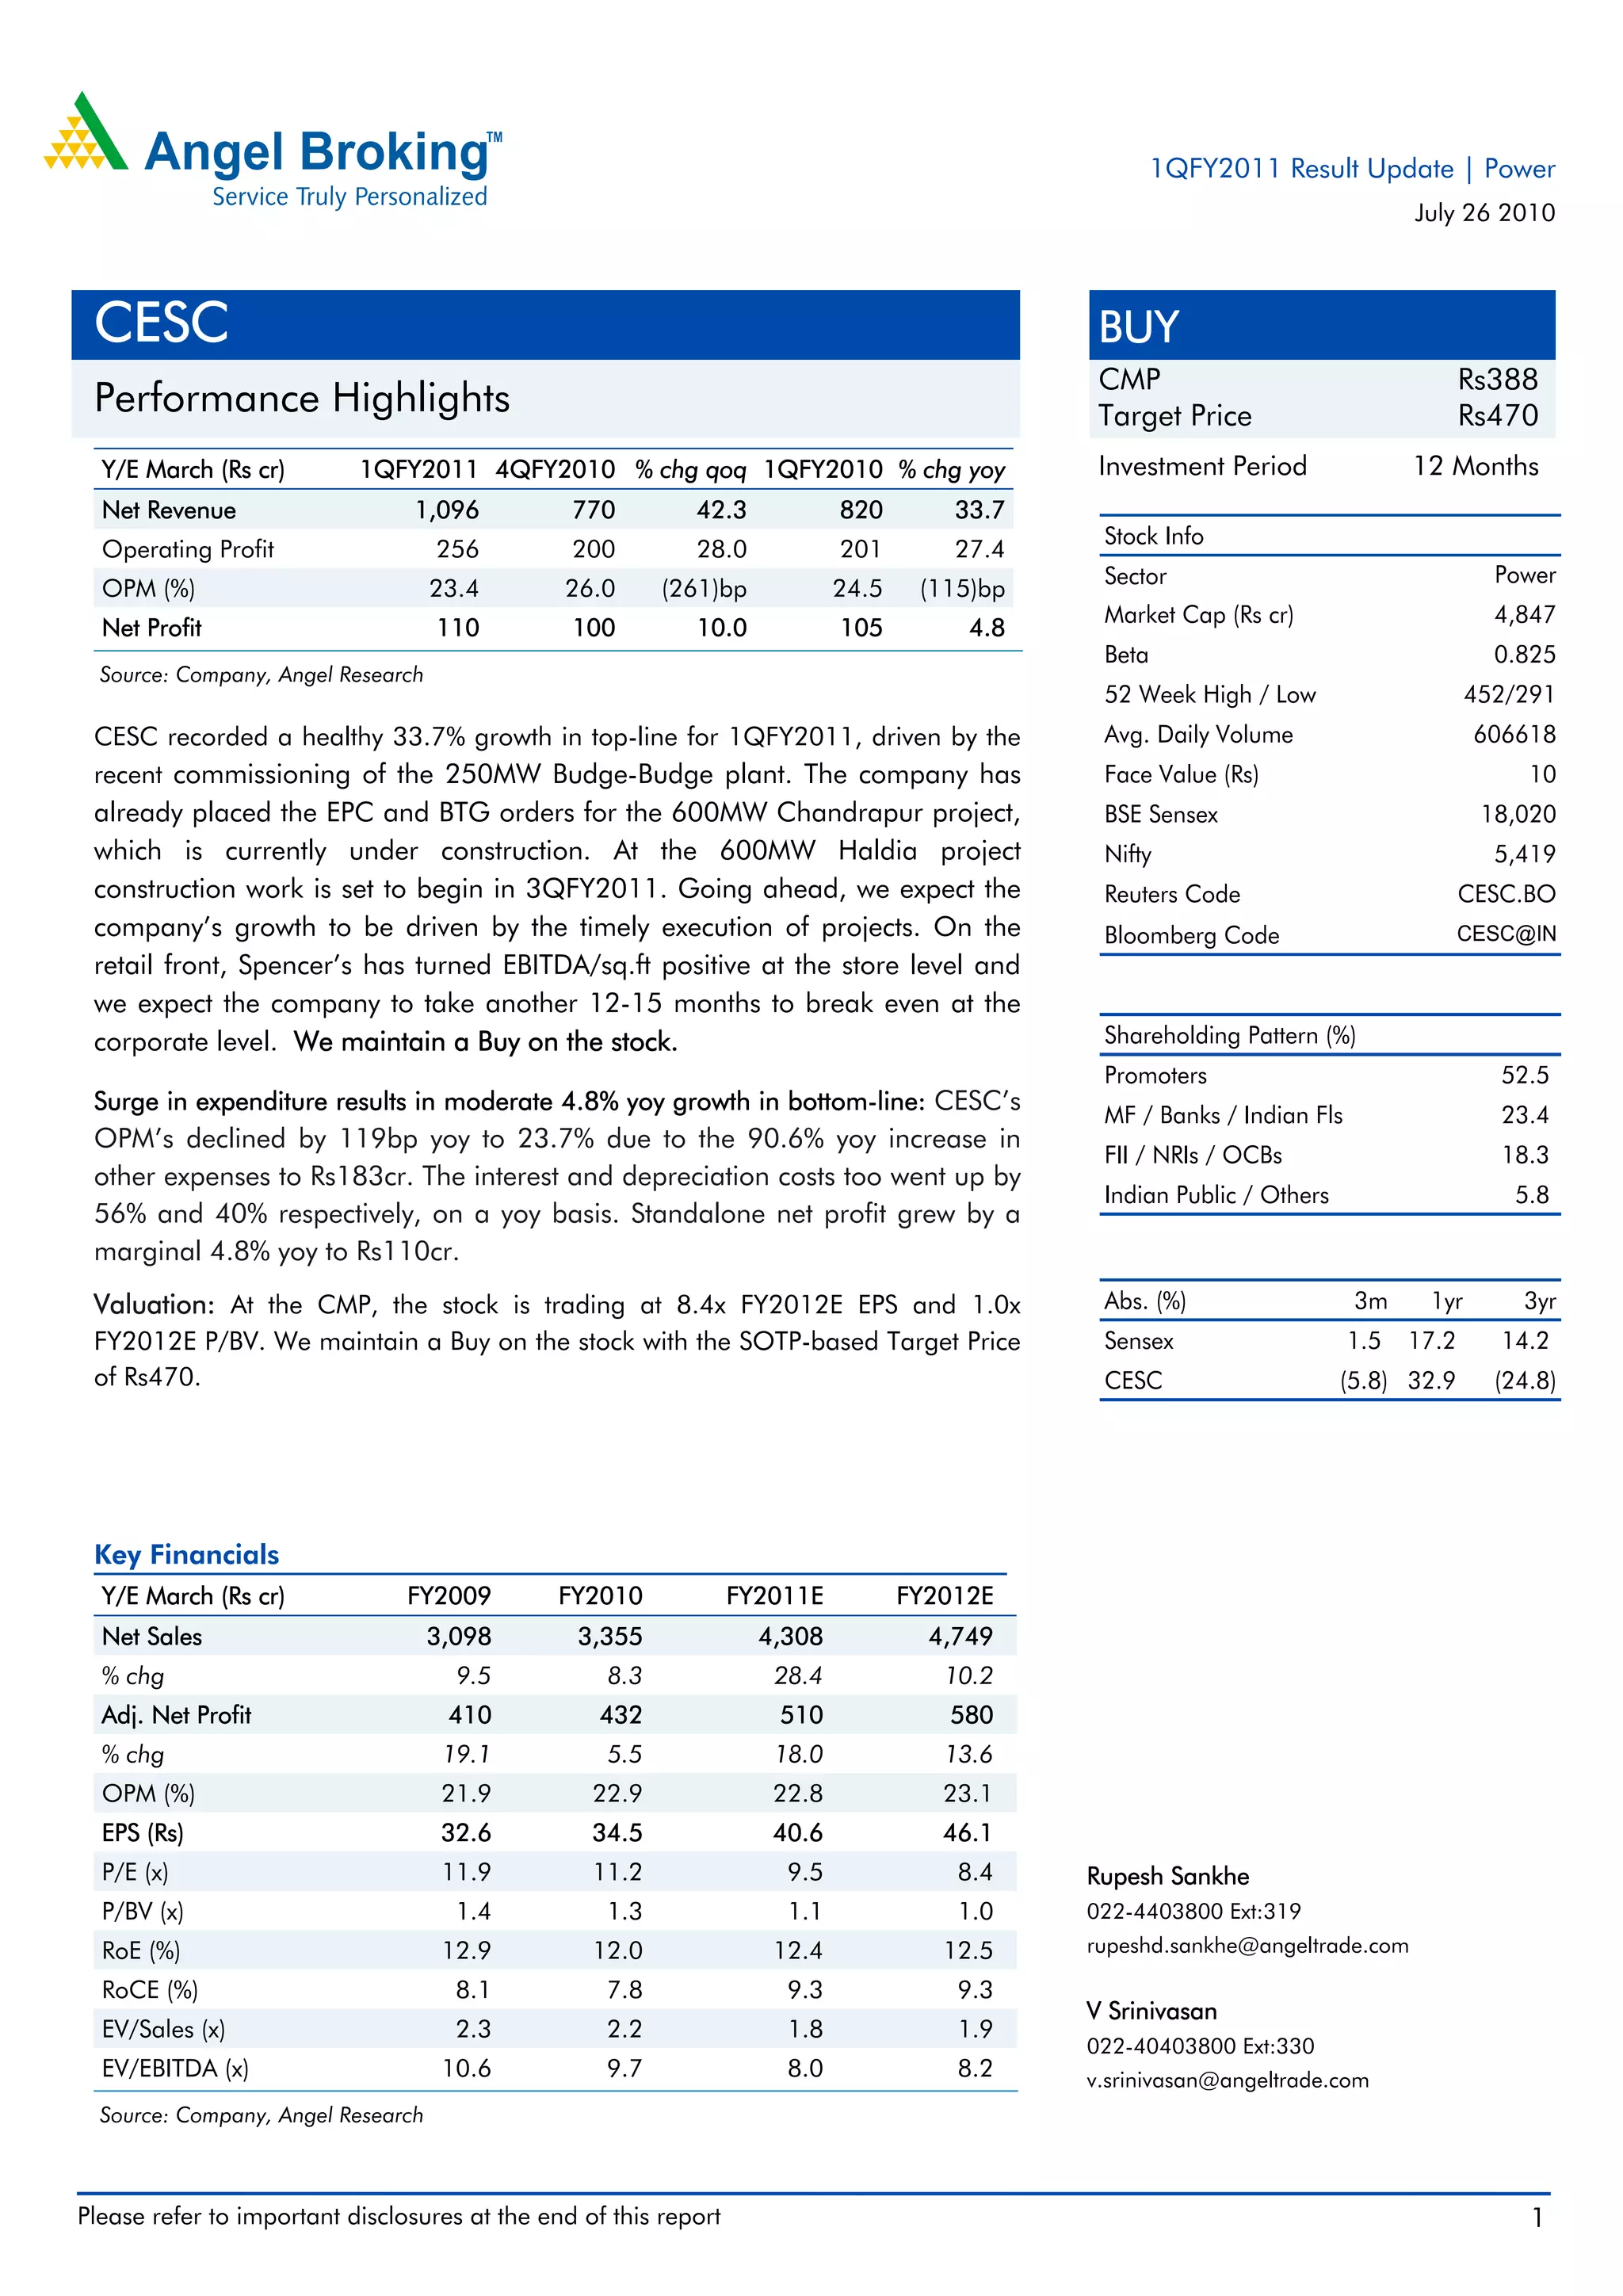
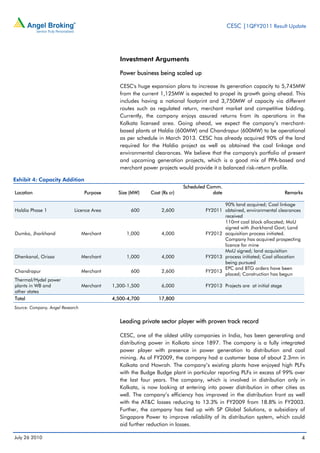
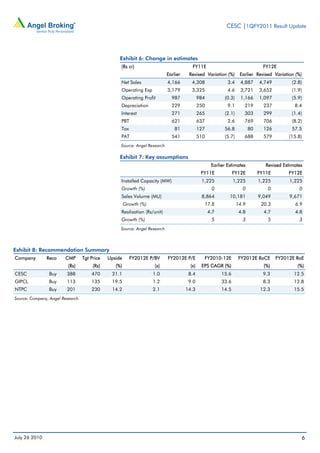
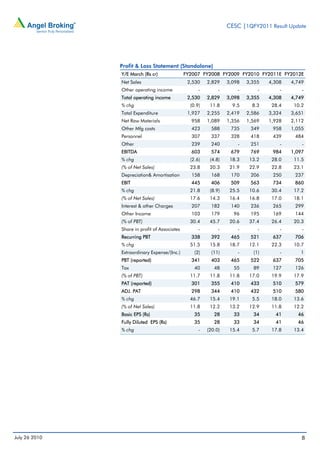

CESC reported a 33.7% year-over-year growth in revenue for the first quarter of fiscal year 2011, driven by the commissioning of its new 250MW Budge-Budge power plant. However, operating margins declined from the previous quarter due to a 90.6% year-over-year increase in other expenses. While revenue beat estimates, net profit growth was moderate at 4.8% year-over-year due to higher expenditure, growing at a faster pace than revenues. The company continues construction on its 600MW Chandrapur and Haldia power projects.


