Download to read offline

![“Sometimes we’ve had cost of living [wage] increases, not
turning my nose up at that at all – but it doesn’t really
touch the sides when your inflation’s been going up by that
amount.”
4
@resfoundation
Quotes from qualitative workshop in Cardiff in September 2025, part of the Resolution Foundation’s ‘Unsung Britain’ research programme.](https://image.slidesharecdn.com/unsungbritainconferencepresentation-260212093317-d8472714/85/Unsung-Britain-conference-Context-setting-presentation-from-Resolution-Foundation-presentation-4-320.jpg)
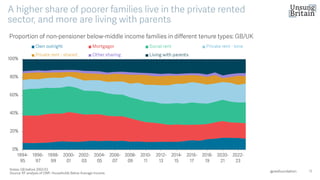
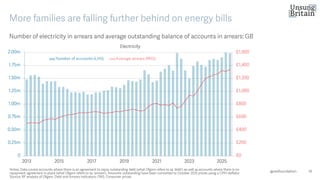
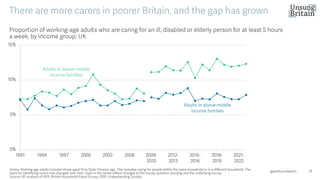

The 13 million working-age families across the poorest half of the country, who at various times have been dubbed the ‘squeezed middle’, ‘just about managing families’ and ‘alarm clock Britain’ are widely courted by politicians of all persuasions. No party can win elections without their votes, and the country cannot succeed without their needs being met. And yet they are poorly understood and badly served in the 21st century so far, which is why we have dubbed them ‘Unsung Britain’. If policy makers want to turn their fortunes around and regain their trust, they need to better understand this group’s changing circumstances, opportunities and challenges. Only then will they find the correct answers to make Britain a better place to live in. Over the last 18 months, the Resolution Foundation has undertaken a programme of work, supported by JPMorganChase, to examine how the lives of Unsung Britain have changed in recent decades, and why their experiences have left them at the heart of Britain’s political and economic malaise. This work sheds new light on how the shape, size and age of lower-income families are evolving, how they earn, save and spend their income, and how they’ve responded to cost of living challenges. We examine the types of paid jobs they do, and the kind of unpaid work they carry out as families navigate the wider pressures of rising ill-health and disability in an ageing society, and their knock-on effects on caring responsibilities. The Resolution Foundation is publishing a major new book – combining analysis and policy work with in-depth conversations to fully understand the needs of lower income families – and hosting a major conference to discuss their issues. We will hear keynote speeches from the Mayor of Greater Manchester Andy Burnham and UK Chief Executive of Tesco Ashwin Prasad, alongside a range of leading experts on topics including cost of living pressures, and how rising ill-health interacts with the labour market. The event will be open for people to physically attend at Central Hall, Westminster, alongside being broadcast via YouTube and the Resolution Foundation website. Viewers will be able to submit questions to the panel before and during the event via Slido. Copies of the book will also be handed out at the conference.


