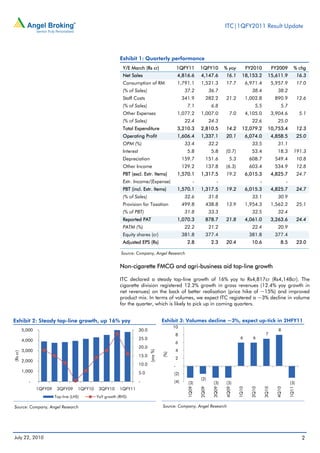
ITC|1QFY2011 Result Update
                                                                                                                      July 22, 2010


 ITC                                                                                      NEUTRAL
                                                                                          CMP                                Rs298
 Performance Highlights                                                                   Target Price                           -
  (Rs cr)                   1QFY11       1QFY10          % yoy     Angel Est     % Diff   Investment Period                          -
  Revenue                    4,816.6     4,147.6          16.1      4,839.6       (0.5)
  EBITDA                     1,606.4     1,337.1          20.1      1,597.1        0.6     Stock Info

  OPM (%)                       33.4         32.2         111          33.0         35     Sector                            FMCG
  PAT                        1,070.3        878.7         21.8      1,042.5        2.7     Market Cap (Rs cr)              1,13,826
 Source: Company, Angel Research                                                           Beta                                 0.8
                                                                                           52 Week High / Low              308/215
 ITC posted strong set of numbers for 1QFY2011 in line with expectations. We
 estimate cigarette volumes declined ~3%, which is likely to pick up in the coming         Avg. Daily Volume               498,356
 quarters. Other key highlights of the results include: 1) double-digit sales and          Face Value (Rs)                      1.0
 EBIT growth in cigarettes, 2) ~Rs10cr yoy decline in non-cigarette losses but
 similar increase qoq, 3) 44% yoy jump in agri-business revenues, and 4) 524bp             BSE Sensex                       18,113
 margin expansion in Paperboards. We have marginally tweaked our numbers to                Nifty                             5,442
 account for: 1) higher sales in Agri-business, and 2) higher margins in
                                                                                           Reuters Code                     ITC.BO
 paperboards. We maintain Neutral view on the stock.
                                                                                            Bloomberg Code                  ITC@IN
 Agri-business drives top-line, paperboards aid margins: ITC declared a modest
 top-line growth of 16% yoy to Rs4,816cr (Rs4,148cr) aided by a 12.2% growth in
 cigarette gross revenues (estimated decline of ~3% in volumes, growth driven by           Shareholding Pattern (%)
 ~15% price hikes) along with strong growth of 44% and 32% in agri-business
 and non-cigarette FMCG business, respectively. Earnings grew by a robust 22%              Promoters                                 -
 yoy to Rs1,070cr (Rs879cr) largely due to top-line growth, 147bp decline in tax           MF /Banks /Indian FIs               42.3
 rate and margin expansion. Operating margin expanded 111bp yoy to 33.4%
                                                                                           FII /NRIs /OCBs                     46.0
 (32.2%) due to the 192bp decline in other expenditure aided by 90bp expansion
 in cigarettes (driven by price hikes), ~Rs10cr yoy decline in non-cigarette FMCG          Indian Public /Others              11.7
 losses to Rs89cr and 524bp expansion in paperboards margins.

 Outlook and Valuation: At the CMP of Rs298, the stock is trading at 21.1x
                                                                                           Abs. (%)          3m     1yr       3yr
 FY2012E earnings (~10% discount to other FMCG companies). However, owing
 to the recent run up in stock price (12% over last 3 months vis-à-vis 3% in Sensex),      Sensex             3.1   22.0      16.4
 we retain our Neutral rating on the stock, with a revised fair value of Rs310 based       ITC               12.8   36.6      92.8
 on our SOTP model (in line with its historical P/E multiple of 22x one-yr forward
 earnings).


 Key Financials
  Y/E March (Rs cr)                      FY2009       FY2010      FY2011E      FY2012E
  Net Sales                              15,612       18,153       21,050       23,757
  % chg                                     11.9         16.3        16.0         12.9
  Net Profit (Adj)                         3,264        4,061       4,803        5,386
  % chg                                      4.6         24.4        18.3         12.2
  EBITDA (%)                                31.1         33.5        34.7         34.3
  EPS (Rs)                                   8.5         10.6        12.6         14.1
  P/E (x)                                   34.9         28.0        23.7         21.1    Anand Shah
  P/BV (x)                                   8.2           8.1        6.9          5.9    022-4040 3800-334
                                                                                          anand.shah@angeltrade.com
  RoE (%)                                   25.3         29.2        31.4         30.1
  RoCE (%)                                  31.2         36.8        41.0         39.6
                                                                                          Chitrangda Kapur
  EV/Sales (x)                               6.9           5.8        5.0          4.4    022-4040 3800-323
  EV/EBITDA (x)                             22.3         17.3        14.5         12.8    chitrangdar.kapur@angeltrade.com
 Source: Company, Angel Research


Please refer to important disclosures at the end of this report                                                                      1
ITC|1QFY2011 Result Update


                                                             Exhibit 1: Quarterly performance


                                                                 Y/E March (Rs cr)                     1QFY11       1QFY10         % yoy          FY2010              FY2009          % chg
                                                                 Net Sales                             4,816.6      4,147.6        16.1      18,153.2             15,611.9                16.3
                                                                 Consumption of RM                     1,791.1      1,521.3        17.7           6,971.4             5,957.9             17.0
                                                                 (% of Sales)                               37.2           36.7                      38.4                38.2
                                                                 Staff Costs                               341.9       282.2       21.2           1,002.8              890.9              12.6
                                                                 (% of Sales)                                7.1            6.8                       5.5                  5.7
                                                                 Other Expenses                        1,077.2      1,007.0          7.0          4,105.0             3,904.6              5.1
                                                                 (% of Sales)                               22.4           24.3                      22.6                25.0
                                                                 Total Expenditure                     3,210.3      2,810.5        14.2      12,079.2             10,753.4                12.3
                                                                 Operating Profit                      1,606.4      1,337.1        20.1           6,074.0             4,858.5             25.0
                                                                 OPM (%)                                    33.4           32.2                      33.5                31.1
                                                                 Interest                                    5.8            5.8    (0.7)            53.4                18.3          191.3
                                                                 Depreciation                              159.7       151.6         5.3           608.7               549.4              10.8
                                                                 Other Income                              129.2       137.8       (6.3)           603.4               534.9              12.8
                                                                 PBT (excl. Extr. Items)               1,570.1      1,317.5        19.2           6,015.3             4,825.7             24.7
                                                                 Extr. Income/(Expense)                         -             -                            -                   -
                                                                 PBT (incl. Extr. Items)               1,570.1      1,317.5        19.2           6,015.3             4,825.7             24.7
                                                                 (% of Sales)                               32.6           31.8                      33.1                30.9
                                                                 Provision for Taxation                    499.8       438.8       13.9           1,954.3             1,562.2             25.1
                                                                 (% of PBT)                                 31.8           33.3                      32.5                32.4
                                                                 Reported PAT                          1,070.3         878.7       21.8           4,061.0             3,263.6             24.4
                                                                 PATM (%)                                   22.2           21.2                      22.4                20.9
                                                                 Equity shares (cr)                        381.8       377.4                       381.8               377.4
                                                                 Adjusted EPS (Rs)                           2.8            2.3    20.4             10.6                   8.5            23.0

                                                                 Source: Company, Angel Research


                                                             Non-cigarette FMCG and agri-business aid top-line growth

                                                             ITC declared a steady top-line growth of 16% yoy to Rs4,817cr (Rs4,148cr). The
                                                             cigarette division registered 12.2% growth in gross revenues (12.4% yoy growth in
                                                             net revenues) on the back of better realisation (price hike of ~15%) and improved
                                                             product mix. In terms of volumes, we expect ITC registered a ~3% decline in volume
                                                             for the quarter, which is likely to pick up in coming quarters.


Exhibit 2: Steady top-line growth, up 16% yoy                                                Exhibit 3: Volumes decline ~3%, expect up-tick in 2HFY11
                                                                                                   10
          5,000                                                             30.0                                                                                         8
                                                                                                       8                                                        7
                                                                            25.0                                                            6        6
          4,000
                                                                                                       6
                                                                            20.0
          3,000                                                                                        4
                                                                                   (yoy %)
(Rs cr)


                                                                                             (%)


                                                                            15.0
                                                                                                       2
          2,000
                                                                            10.0                   -
          1,000                                                             5.0                    (2)
                                                                                                                    (2)
             -                                                              -                      (4)       (3)             (3)    (3)                                            (3)
                  1QFY09    3QFY09      1QFY10    3QFY10     1QFY11
                                                                                                             1Q09

                                                                                                                    2Q09

                                                                                                                            3Q09

                                                                                                                                   4Q09

                                                                                                                                           1Q10

                                                                                                                                                    2Q10

                                                                                                                                                               3Q10

                                                                                                                                                                        4Q10

                                                                                                                                                                                   1Q11


                           Top-line (LHS)        YoY growth (RHS)

Source: Company, Angel Research                                                              Source: Company, Angel Research


July 22, 2010                                                                                                                                                                               2
ITC|1QFY2011 Result Update


                                                            Amongst other segments, agri-business and non-cigarette FMCG business posted
                                                            strong growth of 44% and 32% yoy respectively, while hotels and paperboards
                                                            registered modest growth to 21% and 13% yoy, respectively.

   Exhibit 4: Segmental growth trend (yoy)
            100                                                                                                                                                       88
                80
                60                                                                                                                                               46        44
                                                                  34 32
                40                                          23                                                 21                   26
                         14 15 13 14 12                                                                   14                                                19
                                                    9 14                                                                    12 9         12 13
    (%)


                20
                -
            (20)                                                                                    (2)
            (40)                                                                        (28) (25)
            (60)                                                                                                                                        (49)
                           Cigarettes                Non-Cig FMCG                              Hotels                        Paperboards                  Agri-Business
                                                                1QFY10          2QFY10            3QFY10            4QFY10     1QFY11

    Source: Company, Angel Research


                                                            22% earnings growth aided by cigarettes and paperboards

                                                            Earnings grew by a robust 22% yoy to Rs1,070cr (Rs879cr) largely on account of
                                                            steady top-line growth, 147bp yoy decline in tax rate and modest margin expansion.
                                                            Operating margin expanded 111bp yoy to 33.4% (32.2%) due to 192bp decline in
                                                            other expenditure aided by 90bp expansion in cigarette EBIT margins (driven by
                                                            price hikes), ~Rs10cr yoy decline in non-cigarette FMCG losses to Rs89cr and
                                                            524bp expansion in paperboards margins. However, losses in non-cigarette FMCG
                                                            increased sequentially by ~Rs10cr indicating step-up in spends for new launches like
                                                            skin-care.
                                                             
Exhibit 5: 20%+ earnings growth rate maintained                                             Exhibit 6: Cigarettes/ Paperboards expand OPM
    1,210                                                                 30.0                    70.0                              62.7 63.3                           62.8
                                                                          25.0                                          58.9 60.4                  60.0 59.8
                                                                                                                                                                 56.9
    1,010                                                                                         60.0          53.8
                                                                          20.0
          810
                                                                                  (yoy %)


                                                                          15.0                    50.0
(Rs cr)


                                                                                            (%)


          610                                                             10.0
                                                                                                  40.0                       35.3                  35.8 36.6
                                                                          5.0                                                       32.0 32.2                           33.4
          410                                                                                                   28.9 29.7                                        30.5
                                                                          -                       30.0
          210
                                                                          (5.0)
           10                                                             (10.0)                  20.0

                1QFY09    3QFY09      1QFY10    3QFY10      1QFY11                                             1QFY09      3QFY09         1QFY10      3QFY10          1QFY11
                          PAT (LHS)            YoY growth (RHS)                                                               OPM                    Gross Margin

Source: Company, Angel Research                                                             Source: Company, Angel Research


July 22, 2010                                                                                                                                                                   3
ITC|1QFY2011 Result Update


                                                                        Exhibit 7: Segment-wise Performance
                                                                            Y/E March (Rs cr)               1QFY11        1QFY10          % chg      FY2010           FY2009           % chg
                                                                            Cigarettes                      4,669.7       4,160.6          12.2     17,283.0         15,115.1           14.3
                                                                            Others                          1,005.6          759.4         32.4          3,641.7          3,014.0          20.8
                                                                            Hotels                              225.1        185.7         21.2           910.8           1,020.3      (10.7)
                                                                            Agri Business                   1,349.8          940.6         43.5          3,862.1          3,846.0           0.4
                                                                            Paperboards & Packg.                829.1        730.6         13.5          3,233.6          2,822.0          14.6
                                                                            Less: Inter-Seg. Rev.           1,036.5          646.0         60.4          2,671.7          2,673.8          (0.1)
                                                                            Total Gross Income              7,043.0       6,130.9          14.9     26,259.6         23,143.5              13.5
                                                                            Cigarettes                      1,305.0       1,125.4          16.0          4,938.1          4,183.8          18.0
                                                                            Others                              (89.3)       (99.8)                      (349.5)          (483.5)
                                                                            Hotels                               38.5            30.6      25.9           216.6            316.2       (31.5)
                                                                            Agri Business                       123.1            99.9      23.2           436.4            256.2           70.3
                                                                            Paperboards & Packg.                188.5        127.8         47.5           684.3            508.6           34.5
                                                                            Total PBIT                      1,565.8       1,283.9          22.0          5,925.9          4,781.3          23.9
                                                                            PBIT Margin (%)
                                                                            Cigarettes                           27.9            27.0                      28.6             27.7
                                                                            Others                               (8.9)       (13.1)                        (9.6)           (16.0)
                                                                            Hotels                               17.1            16.5                      23.8             31.0
                                                                            Agri Business                         9.1            10.6                      11.3               6.7
                                                                            Paperboards & Packg.                 22.7            17.5                      21.2             18.0
                                                                            Source: Company, Angel Research


                                                                        Cigarette segment registered double-digit sales and EBIT growth

                                                                        ITC’s cigarette division, for the quarter, registered 12.2% growth in gross revenues
                                                                        (12.4% yoy growth in net revenues) on the back of ~15% weighted average price
                                                                        hikes taken across portfolio post excise duty hike of ~17%. In terms of volume, we
                                                                        expect ITC registered a ~3% decline for the quarter, which is likely to pick up in the
                                                                        coming quarters. EBIT margins expanded 90bp to 27.9% (27%) aided by price hikes
                                                                        driving a steady 16% growth in EBIT. We believe the cigarette business is well poised
                                                                        to post double-digit revenue and EBIT growth in FY2011E. We have modeled in a
                                                                        1.4% volume growth in cigarette volumes for FY2011E (likely to be back-ended in
                                                                        2HFY2011E).


Exhibit 8: Cigarette sales, EBIT grow double-digit                                                Exhibit 9: Volumes decline ~3%, expect up-tick in 2H
          5,000                                                                      40.0               10
                                                                                                                                                                             8
                                                                                                            8                                                       7
          4,000                                                                      30.0                                                          6        6
                                                                                                            6
          3,000
                                                                                     20.0                   4
          2,000
(Rs cr)


                                                                                                  (%)
                                                                                            (%)


                                                                                     10.0                   2
          1,000
                                                                                                        -
             -                                                                       -
                                                                                                        (2)                                                                         (1)
                  1Q09

                           2Q09

                                  3Q09

                                         4Q09

                                                1Q10

                                                       2Q10

                                                              3Q10

                                                                     4Q10

                                                                              1Q11


                                                                                                                          (2)
                                                                                                        (4)        (3)             (3)     (3)
                                                                                                                   1Q09

                                                                                                                          2Q09

                                                                                                                                   3Q09

                                                                                                                                          4Q09

                                                                                                                                                  1Q10

                                                                                                                                                           2Q10

                                                                                                                                                                   3Q10

                                                                                                                                                                            4Q10

                                                                                                                                                                                    1Q11


                         Gross Revenue (LHS)                     YoY growth (RHS)
                         EBIT Margin (RHS)


Source: Company, Angel Research                                                                   Source: Company, Angel Research


July 22, 2010                                                                                                                                                                                4
ITC|1QFY2011 Result Update


                                                                          Non-cigarette FMCG witnessing strong revenue traction

                                                                          ITC’s non-cigarette FMCG business registered a strong uptick in revenue growth to
                                                                          32% yoy to Rs1,006cr (Rs759cr) driven by the impressive performance from its
                                                                          branded packaged foods (up 34% yoy) and personal care (up 86% yoy). However,
                                                                          while losses reduced by ~Rs10cr yoy to Rs89cr (Rs100cr), it increased by similar
                                                                          amount on a sequential basis indicating step-up in investments to support new
                                                                          launches like skin-care. During the quarter, Sunfeast, Aashirvaad atta and
                                                                          confectioneries grew 43%, 21% and 25%, respectively. ITC made a foray into the fast
                                                                          growing domestic skin-care market with the launch of Vivel Active Fair Cream in June
                                                                          2010 in select markets and achieved a volume share of 5% in soaps. Going ahead,
                                                                          we expect revenue traction in the segment to continue and losses to reduce, albeit at
                                                                          a slower pace than FY2010, though break-even is likely to be achieved only in
                                                                          FY2013E.


Exhibit 10: Revenue growth maintained at 30%+                                                       Exhibit 11: Losses reduce yoy, up qoq by ~Rs10cr
      1,200                                                                            40.0                          -

      1,000                                                                            35.0                         (20)
                                                                                       30.0
          800                                                                                                       (40)
                                                                                       25.0
                                                                                                                    (60)
                                                                                                    (Rs cr)


          600                                                                          20.0
(Rs cr)


                                                                                              (%)


          400                                                                          15.0                         (80)
                                                                                       10.0                                                                                                      (79)
                                                                                                                   (100)                                                      (85)     (86)              (89)
          200                                                                          5.0                                                                           (100)
           -                                                                           -                           (120)
                                                                                                                                            (117)            (117)
                                                                                                                   (140)          (123)              (127)
                1Q09

                        2Q09

                               3Q09

                                      4Q09

                                             1Q10

                                                    2Q10

                                                           3Q10

                                                                   4Q10

                                                                            1Q11


                                                                                                                                  1Q09

                                                                                                                                            2Q09

                                                                                                                                                     3Q09

                                                                                                                                                              4Q09

                                                                                                                                                                     1Q10

                                                                                                                                                                              2Q10

                                                                                                                                                                                       3Q10

                                                                                                                                                                                                 4Q10

                                                                                                                                                                                                         1Q11
                       Gross Revenue (LHS)                  YoY growth (RHS)


Source: Company, Angel Research                                                                     Source: Company, Angel Research


                                                                          Hotel business on road to recovery

                                                                          ITC’s hotel business registered a robust growth of 21.2% yoy to Rs225cr (Rs186cr)
                                                                          during the quarter. Moreover, EBIT margins expanded by 64bp yoy to 17.1% driving
                                                                          a strong 25.9% yoy growth in EBIT. Construction activity of the new super luxury
                                                                          properties at Chennai and Kolkata are progressing satisfactorily. We believe the
                                                                          hotel business is well on track to post 20% CAGR in revenues during
                                                                          FY2010-12E aided by low base and up-tick in economic activity. Moreover, margins
                                                                          are likely to register significant improvement as average room rate (ARRs) recover.


Exhibit 12: Significant traction in revenue                                                         Exhibit 13: Stable margins, expect up-tick in 2HFY11E
          300                                                                      30.0                       100                                                                                       40.0
          250                                                                      20.0                                                                                                                 30.0
                                                                                                               80
                                                                                   10.0                                                                                                                 20.0
          200                                                                                                                                                                                           10.0
                                                                                   -                           60
                                                                                                    (Rs cr)


                                                                                                                                                                                                                 (%)


          150                                                                                                                                                                                           -
                                                                                              (%)
(Rs cr)


                                                                                   (10.0)                      40                                                                                       (10.0)
          100
                                                                                   (20.0)                                                                                                               (20.0)
                                                                                                               20
           50                                                                      (30.0)                                                                                                               (30.0)
           -                                                                       (40.0)                      -                                                                                        (40.0)
                                                                                                                           1Q09

                                                                                                                                     2Q09

                                                                                                                                              3Q09

                                                                                                                                                      4Q09

                                                                                                                                                              1Q10

                                                                                                                                                                     2Q10

                                                                                                                                                                             3Q10

                                                                                                                                                                                     4Q10

                                                                                                                                                                                              1Q11
                1Q09

                        2Q09

                               3Q09

                                      4Q09

                                             1Q10

                                                    2Q10

                                                           3Q10

                                                                  4Q10

                                                                           1Q11


                       Gross Revenue (LHS)                  YoY growth (RHS)                                                             EBIT (LHS)                    EBIT Margin (RHS)

Source: Company, Angel Research                                                                     Source: Company, Angel Research


July 22, 2010                                                                                                                                                                                                      5
ITC|1QFY2011 Result Update


                                                                                   Paperboard and packaging surprise on margins front

                                                                                   The segment registered a modest growth in revenue of 13.5% yoy (13% at the net
                                                                                   level) to Rs829cr (Rs371cr). However, EBIT Margins of the segment registered a
                                                                                   significant expansion of 524bp yoy to 22.7% (17.5%) driving a strong 47.5% yoy
                                                                                   jump in EBIT aided by a combination of product mix enrichment, higher realisations
                                                                                   and enhanced value capture through in-house pulp production. Going forward, we
                                                                                   expect the segment to post a modest 16% CAGR in revenues during FY2010-12E
                                                                                   driven by commencement of new units and margins to improve by ~100bp from
                                                                                   current levels aided largely by better product mix.


Exhibit 14: Sales growth stable at ~10-15%                                                             Exhibit 15: Sharp up-tick in margins this quarter
                                                                                                                 250                                                                      30.0
      1,000                                                                                 30.0
                                                                                                                                                                                          20.0
                                                                                            20.0                 200
          800                                                                                                                                                                             10.0
                                                                                            10.0
          600                                                                                                    150                                                                      -
                                                                                            -          (Rs cr)


                                                                                                                                                                                                 (%)
(Rs cr)


                                                                                            (10.0)                                                                                        (10.0)
                                                                                                 (%)


          400                                                                                                    100
                                                                                            (20.0)                                                                                        (20.0)
          200                                                                                                     50
                                                                                            (30.0)                                                                                        (30.0)
           -                                                                                (40.0)                -                                                                       (40.0)
                   1Q09

                            2Q09

                                     3Q09

                                             4Q09

                                                     1Q10

                                                             2Q10

                                                                     3Q10

                                                                            4Q10

                                                                                     1Q11


                                                                                                                       1Q09

                                                                                                                              2Q09

                                                                                                                                        3Q09

                                                                                                                                               4Q09

                                                                                                                                                       1Q10

                                                                                                                                                              2Q10

                                                                                                                                                                     3Q10

                                                                                                                                                                            4Q10

                                                                                                                                                                                   1Q11
                          Gross Revenue (LHS)                       YoY growth (RHS)                                            EBIT (LHS)                      EBIT Margin (RHS)

Source: Company, Angel Research                                                                        Source: Company, Angel Research


                                                                                   Agri business registers another quarter of strong revenue growth

                                                                                   ITC’s agri business registered a strong 44% yoy growth in revenues to Rs1,350cr
                                                                                   (Rs941cr), partially aided by low base and driven by increased sales of soya, leaf
                                                                                   tobacco and wheat. The business maintained its position as the foremost exporter of
                                                                                   leaf tobacco, leveraging the growing demand for Indian tobaccos. However, EBIT
                                                                                   margins contracted 150bp yoy to 9.1% resulting in a 23% yoy growth in segmental
                                                                                   EBIT largely due to adverse product mix (higher volumes of soya in the quarter).
                                                                                   Going ahead, we expect this segment to register 21% CAGR in revenues over
                                                                                   FY2010-12E and margins to remain stable at 10% levels owing to management’s
                                                                                   focus to shift to higher profitability products and firm leaf tobacco prices.


Exhibit 16: Revenue up 44% yoy and 37% qoq                                                             Exhibit 17: Margins decline yoy, sharp up-tick qoq
          2,000                                                                             100.0                200                                                                      20.0
                                                                                            80.0                                                                                          10.0
          1,500                                                                             60.0                 150
                                                                                                                                                                                          -
                                                                                            40.0
                                                                                                       (Rs cr)


          1,000                                                                             20.0                 100                                                                      (10.0)
                                                                                                                                                                                                   (%)
(Rs cr)


                                                                                                 (%)


                                                                                            -                                                                                             (20.0)
           500                                                                              (20.0)               50
                                                                                                                                                                                          (30.0)
                                                                                            (40.0)
               -                                                                            (60.0)                -                                                                       (40.0)
                                                                                                                       1Q09

                                                                                                                              2Q09

                                                                                                                                        3Q09

                                                                                                                                               4Q09

                                                                                                                                                       1Q10

                                                                                                                                                              2Q10

                                                                                                                                                                     3Q10

                                                                                                                                                                            4Q10

                                                                                                                                                                                   1Q11
                     1Q09

                              2Q09

                                      3Q09

                                              4Q09

                                                      1Q10

                                                             2Q10

                                                                     3Q10

                                                                            4Q10

                                                                                     1Q11


                            Gross Revenue (LHS)                        YoY growth (RHS)                                              EBIT (LHS)                  EBIT Margin (RHS)

Source: Company, Angel Research                                                                        Source: Company, Angel Research


July 22, 2010                                                                                                                                                                                       6
ITC|1QFY2011 Result Update


                                              Investment Rationale

                                                   Model double-digit sales and EBIT growth in cigarettes: We have modeled in
                                                   1.4% volume growth in cigarette volumes for FY2011E (likely to be back-ended
                                                   in 2HFY2011E) despite ~15% weighted average price hikes, which is likely to
                                                   fully offset: 1) ~17% excise hike in the Budget, and 2) rise in VAT announced in
                                                   several states. We believe the cigarette business is well poised to post double-
                                                   digit sales and EBIT growth in FY2011E. Moreover, we highlight that over the last
                                                   12 months, ITC has strengthened its brand portfolio significantly with brands
                                                   such as Flake Excel and Duke Filter, launched Lucky Strike at the premium end
                                                   and test-marketed 59mm mid-size filters (micro-filters).

                                                   Non-cigarette EBIT to log 30% CAGR over FY2010-12E: While cigarettes remain
                                                   the main profit center, investments in non-cigarette businesses like FMCG, hotels
                                                   and paperboards have started yielding positive contribution. During
                                                   FY2010-12E, we expect non-cigarette EBIT to post 30% CAGR aided by:
                                                   1) reduction in non-cigarette FMCG losses, 2) improvement in hotel margins
                                                   aided by higher ARRs, and 3) higher margin in paperboards.

                                                   Return ratios to improve across segments boosting cash flow generation: Over
                                                   FY2010-12E, we expect return ratios to improve across segments driven by
                                                   higher margins (refer Exhibit 20). Moreover, going ahead, we expect capex to
                                                   plateau from the peak of FY2007-08 driving strong cash flow generation post
                                                   dividend payout of ~50%. Hence, we expect ITC to achieve strong net cash
                                                   surplus of Rs~5,800cr (US $125mn) in FY2012E equating to Rs15 per share.

                                              Outlook and Valuation

                                              We have marginally tweaked our numbers to account for – 1) higher sales in
                                              agri-business, and 2) higher margins in paperboards.

                                              Exhibit 18: Change in estimates
                                              Parameter                 Old Estimate       New Estimate                % chg
                                              (Rs cr)             FY11E         FY12E   FY11E          FY12E       FY11E     FY12E
                                              Revenue            20,827        23,076   21,050         23,757         1.1       2.9
                                              OPM (%)                  34.4      34.2     34.7           34.3       29bp       12bp
                                              EPS (Rs)                 12.5      13.7     12.6           14.1        0.6        3.0
                                              Source: Company, Angel Research


                                              At the CMP of Rs298, the stock is trading at 21.1x FY2012E earnings (~10%
                                              discount to other FMCG companies). However, owing to the recent run up in the
                                              stock price (12% over last the 3 months vis-à-vis 3% in Sensex), we retain our Neutral
                                              rating on the stock with a revised fair value of Rs310 based on our SOTP model
                                              (in line with its historical P/E multiple of 22x one-yr forward earnings).

Exhibit 19: Sum-of-the-parts (SOTP) valuation
 Segment                          Parameter             Multiple (x)                      EV (Rs cr)            Per Share Value (Rs)
 Cigarettes                       EV/EBITDA                   13.0                         83,349                              218
 Non-Cigarette FMCG (Others)      EV/Sales                      2.0                        10,352                                27
 Hotels                           EV/EBITDA                   12.0                           5,778                               15
 Paperboards                      EV/EBITDA                     8.0                          9,814                               26
 Agri-Business                    EV/EBITDA                     5.0                          3,075                                8
 Less: Net Debt/ (Cash)                                                                    (5,808)                             (15)
 Total Equity Value                                                                       118,176                              310
Source: Company, Angel Research


July 22, 2010                                                                                                                          7
ITC|1QFY2011 Result Update


Exhibit 20: Key Assumptions
                                  FY2009    FY2010       FY2011E         FY2012E
 Top-line growth (%)
 Cigarettes                           9.3     14.3          14.3             9.9
 Volume growth (%)                  (2.9)       7.2          1.4             5.2
 Realisation growth (%)             12.6        6.7         12.8             4.4
 Non-Cigarette FMCG                 20.0      20.8          21.2            17.6
 Hotels                             (7.3)    (10.7)         20.1            20.0
 Paperboards                        19.4      14.6          18.6            13.9
 Agri-Business                      (0.6)      0.4          27.6            14.8
 PBIT Margin (%)
 Cigarettes                          27.7     28.6          29.1            28.7
 Non-Cigarette FMCG                (16.0)     (9.6)         (6.5)           (4.5)
 Hotels                              31.0     23.8          26.0            28.5
 Paperboards                         18.0     21.2          22.0            22.3
 Agri-Business                        6.7     11.3          10.2            10.0
 RoCE (%)
 Cigarettes                        142.5     164.7         177.1           180.5
 Non-Cigarette FMCG                (23.0)    (20.3)        (14.6)          (10.8)
 Hotels                              14.4      8.8          10.1            11.5
 Paperboards                         13.5     18.4          20.8            21.8
 Agri-Business                       24.7     27.6          26.1            25.4
Source: Company, Angel Research


July 22, 2010                                                                       8
ITC|1QFY2011 Result Update


Exhibit 21: Peer Valuation
 Company                         Reco                                 Mcap                     CMP                         TP*                  Upside                       P/E (x)                         EV/Sales (x)       RoE (%)              CAGR #
                                                                     (Rs cr)                    (Rs)                       (Rs)                    (%)                   FY11E FY12E                       FY11E FY12E       FY11E FY12E           Sales  PAT
 Asian Paints                        Neutral                        24,137                    2,516                      2,461                         (2.2)              28.2                      23.5      3.2     2.7         39.9      38.5   15.5         15.3
 Colgate                              Reduce                        11,549                        849                      798                         (6.0)              26.9                      23.5      4.9     4.3     117.3      108.8     14.3          7.8
 Dabur                                Reduce                        18,013                        209                      192                         (7.9)              30.3                      26.0      4.5     3.9         41.5      39.2   16.0         17.4
 GSKCHL                               Reduce                           7,538                  1,792                      1,622                         (9.5)              27.5                      23.2      3.0     2.5         27.7      27.8   17.8         18.8
 HUL                                  Reduce                        57,104                        262                      237                         (9.6)              25.9                      23.1      2.8     2.5         73.5      72.1   10.8          8.6
 ITC                                 Neutral                     1,13,826                         298                      310                            4.1             23.7                      21.1      5.0     4.4         31.4      30.1   14.4         15.2
 Marico                               Reduce                           7,591                      125                      115                         (8.0)              26.9                      22.8      2.5     2.2         36.6      32.3   14.4         17.4
 Nestle                              Neutral                        28,432                    2,949                      2,955                            0.2             36.2                      29.9      4.7     4.0     118.2      118.6     16.5         20.4
Source: Company, Angel Research, Note: #denotes CAGR for FY2010-12E, * In case of Neutral recommendation, TP = Fair value

Exhibit 22: Angel v/s Consensus estimates
 Top-line (Rs cr)                                                                       FY2011E                                                   FY2012E                 EPS (Rs)                                                FY2011E            FY2012E
 Angel estimates                                                                         21,050                                                    23,757                 Angel estimates                                            12.6               14.1
 Consensus                                                                               21,089                                                    23,996                 Consensus                                                  12.5               14.4
 Diff (%)                                                                                  (0.2)                                                     (1.0)                Diff (%)                                                    0.9               (2.0)
Source: Company, Angel Research

Exhibit 23: Returns - ITC v/s Sensex (Indexed to 100)                                                                                                                     Exhibit 24: One-yr forward P/E band

   250%                                                                                                                                                                                        350            15x           18x             21x           24x
                                                                  Sensex                              ITC
                                                                                                                                                                                               300
   200%
                                                                                                                                                                                               250
                                                                                                                                                                            Share Price (Rs)


   150%                                                                                                                                                                                        200
                                                                                                                                                                                               150
   100%
                                                                                                                                                                                               100
       50%                                                                                                                                                                                      50
                                                                                                                                                                                                -
        0%
                                                                                                                                                                                                      Jan-06


                                                                                                                                                                                                      Jan-07


                                                                                                                                                                                                      Jan-08


                                                                                                                                                                                                      Jan-09


                                                                                                                                                                                                      Jan-10
                                                                                                                                                                                                       Jul-05
                                                                                                                                                                                                      Oct-05


                                                                                                                                                                                                       Jul-06
                                                                                                                                                                                                      Oct-06


                                                                                                                                                                                                       Jul-07
                                                                                                                                                                                                      Oct-07


                                                                                                                                                                                                       Jul-08
                                                                                                                                                                                                      Oct-08


                                                                                                                                                                                                       Jul-09
                                                                                                                                                                                                      Oct-09


                                                                                                                                                                                                       Jul-10
                                                                                                                                                                                                      Apr-05


                                                                                                                                                                                                      Apr-06


                                                                                                                                                                                                      Apr-07


                                                                                                                                                                                                      Apr-08


                                                                                                                                                                                                      Apr-09


                                                                                                                                                                                                      Apr-10
                                     Oct-07

                                               Jan-08


                                                                               Oct-08

                                                                                         Jan-09


                                                                                                                          Oct-09

                                                                                                                                     Jan-10
              Apr-07


                                                         Apr-08


                                                                                                      Apr-09


                                                                                                                                                 Apr-10
                        Jul-07


                                                                    Jul-08


                                                                                                                Jul-09


                                                                                                                                                           Jul-10


Source: Company, Angel Research                                                                                                                                            Source: Company, Angel Research


Exhibit 25: One-yr forward P/E chart                                                                                                                                      Exhibit 26: One-yr forward Premium v/s Sensex chart

 35.0                                                                                                                                                                          80%
                                                                                                                                                                               70%
 30.0                                                                                                                                                                          60%
 25.0                                                                                                                                                                          50%
                                                                                                                                                                               40%
 20.0                                                                                                                                                                          30%
 15.0                                                                                                                                                                          20%
                                                                                                                                                                               10%
 10.0                                                                                                                                                                           0%
   5.0                                                                                                                                                                        -10%
                                                                                                                                                                              -20%
    -                                                                                                                                                                         -30%
                   Oct-02


                                      Oct-03


                                                        Oct-04


                                                                           Oct-05


                                                                                             Oct-06


                                                                                                                Oct-07


                                                                                                                                   Oct-08


                                                                                                                                                       Oct-09
          Apr-02


                            Apr-03


                                               Apr-04


                                                                  Apr-05


                                                                                    Apr-06


                                                                                                       Apr-07


                                                                                                                          Apr-08


                                                                                                                                              Apr-09


                                                                                                                                                                Apr-10


                                                                                                                                                                                               Feb-03


                                                                                                                                                                                               May-04
                                                                                                                                                                                               Oct-04
                                                                                                                                                                                               Mar-05

                                                                                                                                                                                               Jan-06


                                                                                                                                                                                               Feb-08


                                                                                                                                                                                               May-09
                                                                                                                                                                                               Oct-09
                                                                                                                                                                                               Mar-10
                                                                                                                                                                                               Apr-02


                                                                                                                                                                                               Aug-05


                                                                                                                                                                                               Nov-06
                                                                                                                                                                                               Apr-07
                                                                                                                                                                                               Sep-02

                                                                                                                                                                                                Jul-03
                                                                                                                                                                                               Dec-03


                                                                                                                                                                                               Jun-06


                                                                                                                                                                                               Sep-07

                                                                                                                                                                                                Jul-08
                                                                                                                                                                                               Dec-08


Source: Company, Angel Research, Note: Red line indicates 5-year average                                                                                                   Source: Company, Angel Research, Note: Red line indicates 5-year average


July 22, 2010                                                                                                                                                                                                                                                          9
ITC|1QFY2011 Result Update


                Profit & Loss Statement                                                     Rs crore
                Y/E March                       FY2007 FY2008 FY2009 FY2010 FY2011E FY2012E
                Gross sales                     19,300 21,356 23,144 26,260        30,507     34,303
                Less: Excise duty                7,136    7,408    7,532   8,106    9,456     10,547
                Net Sales                       12,164 13,948 15,612 18,153        21,050     23,757
                Total operating income          12,164 13,948 15,612 18,153        21,050     23,757
                % chg                            982.0     14.7     11.9    16.3     16.0       12.9
                Total Expenditure                8,208    9,544 10,753 12,079      13,748     15,603
                Cost of Materials                5,195    6,017    5,958   6,971    8,020      9,094
                Advertising Exp                   288      378      502     515      600         713
                Personnel                          630     733      891    1,003    1,179      1,339
                Others                           2,095    2,416    3,402   3,590    3,949      4,458
                EBITDA                           3,956    4,404    4,859   6,074    7,303      8,154
                % chg                           2176.4     11.3     10.3    25.0     20.2       11.7
                (% of Net Sales)                  32.5     31.6     31.1    33.5     34.7       34.3
                Depreciation& Amortisation        363      438      549     609      665         730
                EBIT                             3,593    3,965    4,309   5,465    6,638      7,424
                % chg                           2423.9     10.4      8.7    26.8     21.5       11.8
                (% of Net Sales)                  29.5     28.4     27.6    30.1     31.5       31.3
                Interest & other Charges             3       5       18      53       25          15
                Other Income                       336     611      535     603      555         630
                (% of PBT)                         8.6     13.4     11.1    10.0      7.7        7.8
                Share in profit of Associates         -       -        -       -        -            -
                Recurring PBT                    3,927    4,572    4,826   6,015    7,168      8,039
                % chg                           1990.0     16.4      5.6    24.7     19.2       12.2
                Extraordinary Expense/(Inc.)         0       0        0       0        0             0
                PBT (reported)                   3,927    4,572    4,826   6,015    7,168      8,039
                Tax                              1,227    1,452    1,562   1,954    2,365      2,653
                (% of PBT)                        31.2     31.8     32.4    32.5     33.0       33.0
                PAT (reported)                   2,700    3,120    3,264   4,061    4,803      5,386
                Add: Share of associates              -       -        -       -        -            -
                Less: Minority interest (MI)          -       -        -       -        -            -
                PAT after MI (reported)          2,700    3,120    3,264   4,061    4,803      5,386
                ADJ. PAT                         2,700    3,120    3,264   4,061    4,803      5,386
                % chg                           1862.2     15.6      4.6    24.4     18.3       12.2
                (% of Net Sales)                  22.2     22.4     20.9    22.4     22.8       22.7
                Basic EPS (Rs)                     7.1      8.2      8.5    10.6     12.6       14.1
                Fully Diluted EPS (Rs)             7.1      8.2      8.5    10.6     12.6       14.1
                % chg                            (30.1)    15.6      4.6    24.4     18.3       12.2


July 22, 2010                                                                                   10
ITC|1QFY2011 Result Update


                Balance Sheet                                                             Rs crore
                Y/E March                      FY2007 FY2008 FY2009 FY2010 FY2011E FY2012E
                SOURCES OF FUNDS
                Equity Share Capital             376      377       377      382       382         382
                Preference Capital                  -        -         -        -         -             -
                Reserves& Surplus              10,061 11,681 13,358 13,683           16,140     18,845
                Shareholders Funds             10,437 12,058 13,735 14,064           16,522     19,227
                Minority Interest                   -        -         -        -         -             -
                Total Loans                      201      214       178      108        83          58
                Deferred Tax Liability           473      545       867      785       785         785
                Total Liabilities              11,111 12,817 14,780 14,957           17,389     20,070
                APPLICATION OF FUNDS
                Gross Block                     7,134    8,960 10,559 11,968         13,494     15,180
                Less: Acc. Depreciation         2,390    2,791     3,287    3,825     4,490      5,220
                Net Block                       4,745    6,169     7,272    8,142     9,004      9,960
                Capital Work-in-Progress         866     1,127     1,214    1,009     1,080      1,214
                Goodwill                            -        -         -        -         -             -
                Investments                     3,068    2,935     2,838    5,727     5,227      5,977
                Current Assets                  6,301    7,031     8,172    8,142     8,686     10,463
                   Cash                          900      570      1,031    1,126      727       1,628
                   Loans & Advances             1,399    1,662     1,860    1,593     1,895      2,186
                   Other                        4,002    4,799     5,280    5,423     6,065      6,650
                Current liabilities             3,869    4,444     4,716    8,064     6,607      7,545
                Net Current Assets              2,432    2,587     3,456      79      2,079      2,919
                Misc Exp                            -        -         -        -         -             -
                Total Assets                   11,111 12,817 14,780 14,957           17,389     20,070


                Cash Flow Statement                                                            Rs crore
                Y/E March                      FY2007 FY2008 FY2009 FY2010 FY2011E FY2012E
                Profit before tax                3,927   4,572     4,826    6,015     7,168       8,039
                Depreciation                      363      438       549      609       665         730
                Change in Working Capital        (667)    (432)     (326)     392      (258)      (246)
                Interest / Dividend (Net)        (222)    (337)     (276)    (279)     (275)      (325)
                Direct taxes paid                1,227   1,452     1,562    1,954     2,365       2,653
                Others                            (37)     (80)       51      105       (35)        (27)
                Cash Flow from Operations        2,137 2,710 3,262 4,888              4,899       5,518
                (Inc.)/ Dec. in Fixed Assets    (1,739) (2,242) (1,686) (1,204)      (1,597)     (1,821)
                (Inc.)/ Dec. in Investments       435      172       144 (2,889)        500       (750)
                Cash Flow from Investing        (1,304) (2,071) (1,542) (4,093)      (1,097)     (2,571)
                Issue of Equity                     42      45        45      721         0             0
                Inc./(Dec.) in loans                81      14       (37)     (70)      (25)        (25)
                Dividend Paid (Incl. Tax)        1,135   1,365     1,543    1,630     4,452       2,345
                Interest / Dividend (Net)        (222)    (337)     (276)    (279)     (275)       (325)
                Cash Flow from Financing         (789)    (969) (1,259)      (700)   (4,202)     (2,045)
                Inc./(Dec.) in Cash                 44    (330)      461       95      (399)        901
                Opening Cash balances             856      900       570    1,031     1,126         727
                Closing Cash balances             900      570     1,031    1,126       727       1,628


July 22, 2010                                                                                      11
ITC|1QFY2011 Result Update


                Key Ratios
                Y/E March                    FY2007   FY2008   FY2009   FY2010   FY2011E FY2012E
                Valuation Ratio (x)
                P/E (on FDEPS)                 42.1     36.5     34.9     28.0      23.7    21.1
                P/CEPS                         36.6     31.6     29.5     24.4      20.8    18.6
                P/BV                           10.7      9.3      8.2      8.1       6.9     5.9
                Dividend yield (%)              1.0      1.2      1.2      3.4       1.8     2.0
                EV/Sales                        8.9      7.8      6.9      5.8       5.0     4.4
                EV/EBITDA                      27.4     24.7     22.3     17.3      14.5    12.8
                EV / Total Assets               9.8      8.5      7.3      7.0       6.1     5.2
                Per Share Data (Rs)
                EPS (Basic)                     7.1      8.2      8.5     10.6      12.6    14.1
                EPS (fully diluted)             7.1      8.2      8.5     10.6      12.6    14.1
                Cash EPS                        8.1      9.4     10.1     12.2      14.3    16.0
                DPS                             3.1      3.5      3.7     10.0       5.3     6.0
                Book Value                     27.7     32.0     36.4     36.8      43.3    50.4
                Returns (%)
                RoCE                           34.9     33.1     31.2     36.8      41.0    39.6
                Angel RoIC (Pre-tax)           51.0     43.2     38.8     50.2      57.7    54.2
                RoE                            27.7     27.7     25.3     29.2      31.4    30.1
                Turnover ratios (x)
                Asset Turnover                  1.8      1.7      1.6      1.6       1.7     1.7
                Inventory / Sales (days)       101      106      108       91        87      83
                Receivables (days)              19       20       16       18        18      19
                Payables (days)                 72       73       70       71        72      72
                Net Working capital (days)      46       53       57      (21)       23      20


July 22, 2010                                                                               12
ITC|1QFY2011 Result Update


 Research Team Tel: 022 - 4040 3800                    E-mail: research@angeltrade.com                    Website: www.angeltrade.com

 Disclaimer
 This document is solely for the personal information of the recipient, and must not be singularly used as the basis of any investment
 decision. Nothing in this document should be construed as investment or financial advice. Each recipient of this document should make
 such investigations as they deem necessary to arrive at an independent evaluation of an investment in the securities of the companies
 referred to in this document (including the merits and risks involved), and should consult their own advisors to determine the merits and
 risks of such an investment.
 Angel Broking Limited, its affiliates, directors, its proprietary trading and investment businesses may, from time to time, make
 investment decisions that are inconsistent with or contradictory to the recommendations expressed herein. The views contained in this
 document are those of the analyst, and the company may or may not subscribe to all the views expressed within.
 Reports based on technical and derivative analysis center on studying charts of a stock's price movement, outstanding positions and
 trading volume, as opposed to focusing on a company's fundamentals and, as such, may not match with a report on a company's
 fundamentals.
 The information in this document has been printed on the basis of publicly available information, internal data and other reliable
 sources believed to be true, but we do not represent that it is accurate or complete and it should not be relied on as such, as this
 document is for general guidance only. Angel Broking Limited or any of its affiliates/ group companies shall not be in any way
 responsible for any loss or damage that may arise to any person from any inadvertent error in the information contained in this report.
 Angel Broking Limited has not independently verified all the information contained within this document. Accordingly, we cannot testify,
 nor make any representation or warranty, express or implied, to the accuracy, contents or data contained within this document. While
 Angel Broking Limited endeavours to update on a reasonable basis the information discussed in this material, there may be regulatory,
 compliance, or other reasons that prevent us from doing so.
 This document is being supplied to you solely for your information, and its contents, information or data may not be reproduced,
 redistributed or passed on, directly or indirectly.
 Angel Broking Limited and its affiliates may seek to provide or have engaged in providing corporate finance, investment banking or
 other advisory services in a merger or specific transaction to the companies referred to in this report, as on the date of this report or in
 the past.
 Neither Angel Broking Limited, nor its directors, employees or affiliates shall be liable for any loss or damage that may arise from or in
 connection with the use of this information.
 Note: Please refer to the important `Stock Holding Disclosure' report on the Angel website (Research Section). Also, please refer to the
 latest update on respective stocks for the disclosure status in respect of those stocks. Angel Broking Limited and its affiliates may have
 investment positions in the stocks recommended in this report.


 Disclosure of Interest Statement                                                       ITC
 1. Analyst ownership of the stock                                                      No
 2. Angel and its Group companies ownership of the stock                                Yes
 3. Angel and its Group companies' Directors ownership of the stock                     No
 4. Broking relationship with company covered                                           No

 Note: We have not considered any Exposure below Rs 1 lakh for Angel, its Group companies and Directors.


 Ratings (Returns) :             Buy (> 15%)                      Accumulate (5% to 15%)                 Neutral (-5 to 5%)
                                 Reduce (-5% to 15%)              Sell (< -15%)


July 22, 2010                                                                                                                             13

ITC

  • 1.
    ITC|1QFY2011 Result Update July 22, 2010 ITC NEUTRAL CMP Rs298 Performance Highlights Target Price - (Rs cr) 1QFY11 1QFY10 % yoy Angel Est % Diff Investment Period - Revenue 4,816.6 4,147.6 16.1 4,839.6 (0.5) EBITDA 1,606.4 1,337.1 20.1 1,597.1 0.6 Stock Info OPM (%) 33.4 32.2 111 33.0 35 Sector FMCG PAT 1,070.3 878.7 21.8 1,042.5 2.7 Market Cap (Rs cr) 1,13,826 Source: Company, Angel Research Beta 0.8 52 Week High / Low 308/215 ITC posted strong set of numbers for 1QFY2011 in line with expectations. We estimate cigarette volumes declined ~3%, which is likely to pick up in the coming Avg. Daily Volume 498,356 quarters. Other key highlights of the results include: 1) double-digit sales and Face Value (Rs) 1.0 EBIT growth in cigarettes, 2) ~Rs10cr yoy decline in non-cigarette losses but similar increase qoq, 3) 44% yoy jump in agri-business revenues, and 4) 524bp BSE Sensex 18,113 margin expansion in Paperboards. We have marginally tweaked our numbers to Nifty 5,442 account for: 1) higher sales in Agri-business, and 2) higher margins in Reuters Code ITC.BO paperboards. We maintain Neutral view on the stock. Bloomberg Code ITC@IN Agri-business drives top-line, paperboards aid margins: ITC declared a modest top-line growth of 16% yoy to Rs4,816cr (Rs4,148cr) aided by a 12.2% growth in cigarette gross revenues (estimated decline of ~3% in volumes, growth driven by Shareholding Pattern (%) ~15% price hikes) along with strong growth of 44% and 32% in agri-business and non-cigarette FMCG business, respectively. Earnings grew by a robust 22% Promoters - yoy to Rs1,070cr (Rs879cr) largely due to top-line growth, 147bp decline in tax MF /Banks /Indian FIs 42.3 rate and margin expansion. Operating margin expanded 111bp yoy to 33.4% FII /NRIs /OCBs 46.0 (32.2%) due to the 192bp decline in other expenditure aided by 90bp expansion in cigarettes (driven by price hikes), ~Rs10cr yoy decline in non-cigarette FMCG Indian Public /Others 11.7 losses to Rs89cr and 524bp expansion in paperboards margins. Outlook and Valuation: At the CMP of Rs298, the stock is trading at 21.1x Abs. (%) 3m 1yr 3yr FY2012E earnings (~10% discount to other FMCG companies). However, owing to the recent run up in stock price (12% over last 3 months vis-à-vis 3% in Sensex), Sensex 3.1 22.0 16.4 we retain our Neutral rating on the stock, with a revised fair value of Rs310 based ITC 12.8 36.6 92.8 on our SOTP model (in line with its historical P/E multiple of 22x one-yr forward earnings). Key Financials Y/E March (Rs cr) FY2009 FY2010 FY2011E FY2012E Net Sales 15,612 18,153 21,050 23,757 % chg 11.9 16.3 16.0 12.9 Net Profit (Adj) 3,264 4,061 4,803 5,386 % chg 4.6 24.4 18.3 12.2 EBITDA (%) 31.1 33.5 34.7 34.3 EPS (Rs) 8.5 10.6 12.6 14.1 P/E (x) 34.9 28.0 23.7 21.1 Anand Shah P/BV (x) 8.2 8.1 6.9 5.9 022-4040 3800-334 anand.shah@angeltrade.com RoE (%) 25.3 29.2 31.4 30.1 RoCE (%) 31.2 36.8 41.0 39.6 Chitrangda Kapur EV/Sales (x) 6.9 5.8 5.0 4.4 022-4040 3800-323 EV/EBITDA (x) 22.3 17.3 14.5 12.8 chitrangdar.kapur@angeltrade.com Source: Company, Angel Research Please refer to important disclosures at the end of this report 1
  • 2.
    ITC|1QFY2011 Result Update Exhibit 1: Quarterly performance   Y/E March (Rs cr) 1QFY11 1QFY10 % yoy FY2010 FY2009 % chg Net Sales 4,816.6 4,147.6 16.1 18,153.2 15,611.9 16.3 Consumption of RM 1,791.1 1,521.3 17.7 6,971.4 5,957.9 17.0 (% of Sales) 37.2 36.7 38.4 38.2 Staff Costs 341.9 282.2 21.2 1,002.8 890.9 12.6 (% of Sales) 7.1 6.8 5.5 5.7 Other Expenses 1,077.2 1,007.0 7.0 4,105.0 3,904.6 5.1 (% of Sales) 22.4 24.3 22.6 25.0 Total Expenditure 3,210.3 2,810.5 14.2 12,079.2 10,753.4 12.3 Operating Profit 1,606.4 1,337.1 20.1 6,074.0 4,858.5 25.0 OPM (%) 33.4 32.2 33.5 31.1 Interest 5.8 5.8 (0.7) 53.4 18.3 191.3 Depreciation 159.7 151.6 5.3 608.7 549.4 10.8 Other Income 129.2 137.8 (6.3) 603.4 534.9 12.8 PBT (excl. Extr. Items) 1,570.1 1,317.5 19.2 6,015.3 4,825.7 24.7 Extr. Income/(Expense) - - - - PBT (incl. Extr. Items) 1,570.1 1,317.5 19.2 6,015.3 4,825.7 24.7 (% of Sales) 32.6 31.8 33.1 30.9 Provision for Taxation 499.8 438.8 13.9 1,954.3 1,562.2 25.1 (% of PBT) 31.8 33.3 32.5 32.4 Reported PAT 1,070.3 878.7 21.8 4,061.0 3,263.6 24.4 PATM (%) 22.2 21.2 22.4 20.9 Equity shares (cr) 381.8 377.4 381.8 377.4 Adjusted EPS (Rs) 2.8 2.3 20.4 10.6 8.5 23.0 Source: Company, Angel Research Non-cigarette FMCG and agri-business aid top-line growth ITC declared a steady top-line growth of 16% yoy to Rs4,817cr (Rs4,148cr). The cigarette division registered 12.2% growth in gross revenues (12.4% yoy growth in net revenues) on the back of better realisation (price hike of ~15%) and improved product mix. In terms of volumes, we expect ITC registered a ~3% decline in volume for the quarter, which is likely to pick up in coming quarters. Exhibit 2: Steady top-line growth, up 16% yoy Exhibit 3: Volumes decline ~3%, expect up-tick in 2HFY11 10 5,000 30.0 8 8 7 25.0 6 6 4,000 6 20.0 3,000 4 (yoy %) (Rs cr) (%) 15.0 2 2,000 10.0 - 1,000 5.0 (2) (2) - - (4) (3) (3) (3) (3) 1QFY09 3QFY09 1QFY10 3QFY10 1QFY11 1Q09 2Q09 3Q09 4Q09 1Q10 2Q10 3Q10 4Q10 1Q11 Top-line (LHS) YoY growth (RHS) Source: Company, Angel Research Source: Company, Angel Research July 22, 2010 2
  • 3.
    ITC|1QFY2011 Result Update Amongst other segments, agri-business and non-cigarette FMCG business posted strong growth of 44% and 32% yoy respectively, while hotels and paperboards registered modest growth to 21% and 13% yoy, respectively. Exhibit 4: Segmental growth trend (yoy) 100 88 80 60 46 44 34 32 40 23 21 26 14 15 13 14 12 14 19 9 14 12 9 12 13 (%) 20 - (20) (2) (40) (28) (25) (60) (49) Cigarettes Non-Cig FMCG Hotels Paperboards Agri-Business 1QFY10 2QFY10 3QFY10 4QFY10 1QFY11 Source: Company, Angel Research 22% earnings growth aided by cigarettes and paperboards Earnings grew by a robust 22% yoy to Rs1,070cr (Rs879cr) largely on account of steady top-line growth, 147bp yoy decline in tax rate and modest margin expansion. Operating margin expanded 111bp yoy to 33.4% (32.2%) due to 192bp decline in other expenditure aided by 90bp expansion in cigarette EBIT margins (driven by price hikes), ~Rs10cr yoy decline in non-cigarette FMCG losses to Rs89cr and 524bp expansion in paperboards margins. However, losses in non-cigarette FMCG increased sequentially by ~Rs10cr indicating step-up in spends for new launches like skin-care.   Exhibit 5: 20%+ earnings growth rate maintained Exhibit 6: Cigarettes/ Paperboards expand OPM 1,210 30.0 70.0 62.7 63.3 62.8 25.0 58.9 60.4 60.0 59.8 56.9 1,010 60.0 53.8 20.0 810 (yoy %) 15.0 50.0 (Rs cr) (%) 610 10.0 40.0 35.3 35.8 36.6 5.0 32.0 32.2 33.4 410 28.9 29.7 30.5 - 30.0 210 (5.0) 10 (10.0) 20.0 1QFY09 3QFY09 1QFY10 3QFY10 1QFY11 1QFY09 3QFY09 1QFY10 3QFY10 1QFY11 PAT (LHS) YoY growth (RHS) OPM Gross Margin Source: Company, Angel Research Source: Company, Angel Research July 22, 2010 3
  • 4.
    ITC|1QFY2011 Result Update Exhibit 7: Segment-wise Performance Y/E March (Rs cr) 1QFY11 1QFY10 % chg FY2010 FY2009 % chg Cigarettes 4,669.7 4,160.6 12.2 17,283.0 15,115.1 14.3 Others 1,005.6 759.4 32.4 3,641.7 3,014.0 20.8 Hotels 225.1 185.7 21.2 910.8 1,020.3 (10.7) Agri Business 1,349.8 940.6 43.5 3,862.1 3,846.0 0.4 Paperboards & Packg. 829.1 730.6 13.5 3,233.6 2,822.0 14.6 Less: Inter-Seg. Rev. 1,036.5 646.0 60.4 2,671.7 2,673.8 (0.1) Total Gross Income 7,043.0 6,130.9 14.9 26,259.6 23,143.5 13.5 Cigarettes 1,305.0 1,125.4 16.0 4,938.1 4,183.8 18.0 Others (89.3) (99.8) (349.5) (483.5) Hotels 38.5 30.6 25.9 216.6 316.2 (31.5) Agri Business 123.1 99.9 23.2 436.4 256.2 70.3 Paperboards & Packg. 188.5 127.8 47.5 684.3 508.6 34.5 Total PBIT 1,565.8 1,283.9 22.0 5,925.9 4,781.3 23.9 PBIT Margin (%) Cigarettes 27.9 27.0 28.6 27.7 Others (8.9) (13.1) (9.6) (16.0) Hotels 17.1 16.5 23.8 31.0 Agri Business 9.1 10.6 11.3 6.7 Paperboards & Packg. 22.7 17.5 21.2 18.0 Source: Company, Angel Research Cigarette segment registered double-digit sales and EBIT growth ITC’s cigarette division, for the quarter, registered 12.2% growth in gross revenues (12.4% yoy growth in net revenues) on the back of ~15% weighted average price hikes taken across portfolio post excise duty hike of ~17%. In terms of volume, we expect ITC registered a ~3% decline for the quarter, which is likely to pick up in the coming quarters. EBIT margins expanded 90bp to 27.9% (27%) aided by price hikes driving a steady 16% growth in EBIT. We believe the cigarette business is well poised to post double-digit revenue and EBIT growth in FY2011E. We have modeled in a 1.4% volume growth in cigarette volumes for FY2011E (likely to be back-ended in 2HFY2011E). Exhibit 8: Cigarette sales, EBIT grow double-digit Exhibit 9: Volumes decline ~3%, expect up-tick in 2H 5,000 40.0 10 8 8 7 4,000 30.0 6 6 6 3,000 20.0 4 2,000 (Rs cr) (%) (%) 10.0 2 1,000 - - - (2) (1) 1Q09 2Q09 3Q09 4Q09 1Q10 2Q10 3Q10 4Q10 1Q11 (2) (4) (3) (3) (3) 1Q09 2Q09 3Q09 4Q09 1Q10 2Q10 3Q10 4Q10 1Q11 Gross Revenue (LHS) YoY growth (RHS) EBIT Margin (RHS) Source: Company, Angel Research Source: Company, Angel Research July 22, 2010 4
  • 5.
    ITC|1QFY2011 Result Update Non-cigarette FMCG witnessing strong revenue traction ITC’s non-cigarette FMCG business registered a strong uptick in revenue growth to 32% yoy to Rs1,006cr (Rs759cr) driven by the impressive performance from its branded packaged foods (up 34% yoy) and personal care (up 86% yoy). However, while losses reduced by ~Rs10cr yoy to Rs89cr (Rs100cr), it increased by similar amount on a sequential basis indicating step-up in investments to support new launches like skin-care. During the quarter, Sunfeast, Aashirvaad atta and confectioneries grew 43%, 21% and 25%, respectively. ITC made a foray into the fast growing domestic skin-care market with the launch of Vivel Active Fair Cream in June 2010 in select markets and achieved a volume share of 5% in soaps. Going ahead, we expect revenue traction in the segment to continue and losses to reduce, albeit at a slower pace than FY2010, though break-even is likely to be achieved only in FY2013E. Exhibit 10: Revenue growth maintained at 30%+ Exhibit 11: Losses reduce yoy, up qoq by ~Rs10cr 1,200 40.0 - 1,000 35.0 (20) 30.0 800 (40) 25.0 (60) (Rs cr) 600 20.0 (Rs cr) (%) 400 15.0 (80) 10.0 (79) (100) (85) (86) (89) 200 5.0 (100) - - (120) (117) (117) (140) (123) (127) 1Q09 2Q09 3Q09 4Q09 1Q10 2Q10 3Q10 4Q10 1Q11 1Q09 2Q09 3Q09 4Q09 1Q10 2Q10 3Q10 4Q10 1Q11 Gross Revenue (LHS) YoY growth (RHS) Source: Company, Angel Research Source: Company, Angel Research Hotel business on road to recovery ITC’s hotel business registered a robust growth of 21.2% yoy to Rs225cr (Rs186cr) during the quarter. Moreover, EBIT margins expanded by 64bp yoy to 17.1% driving a strong 25.9% yoy growth in EBIT. Construction activity of the new super luxury properties at Chennai and Kolkata are progressing satisfactorily. We believe the hotel business is well on track to post 20% CAGR in revenues during FY2010-12E aided by low base and up-tick in economic activity. Moreover, margins are likely to register significant improvement as average room rate (ARRs) recover. Exhibit 12: Significant traction in revenue Exhibit 13: Stable margins, expect up-tick in 2HFY11E 300 30.0 100 40.0 250 20.0 30.0 80 10.0 20.0 200 10.0 - 60 (Rs cr) (%) 150 - (%) (Rs cr) (10.0) 40 (10.0) 100 (20.0) (20.0) 20 50 (30.0) (30.0) - (40.0) - (40.0) 1Q09 2Q09 3Q09 4Q09 1Q10 2Q10 3Q10 4Q10 1Q11 1Q09 2Q09 3Q09 4Q09 1Q10 2Q10 3Q10 4Q10 1Q11 Gross Revenue (LHS) YoY growth (RHS) EBIT (LHS) EBIT Margin (RHS) Source: Company, Angel Research Source: Company, Angel Research July 22, 2010 5
  • 6.
    ITC|1QFY2011 Result Update Paperboard and packaging surprise on margins front The segment registered a modest growth in revenue of 13.5% yoy (13% at the net level) to Rs829cr (Rs371cr). However, EBIT Margins of the segment registered a significant expansion of 524bp yoy to 22.7% (17.5%) driving a strong 47.5% yoy jump in EBIT aided by a combination of product mix enrichment, higher realisations and enhanced value capture through in-house pulp production. Going forward, we expect the segment to post a modest 16% CAGR in revenues during FY2010-12E driven by commencement of new units and margins to improve by ~100bp from current levels aided largely by better product mix. Exhibit 14: Sales growth stable at ~10-15% Exhibit 15: Sharp up-tick in margins this quarter 250 30.0 1,000 30.0 20.0 20.0 200 800 10.0 10.0 600 150 - - (Rs cr) (%) (Rs cr) (10.0) (10.0) (%) 400 100 (20.0) (20.0) 200 50 (30.0) (30.0) - (40.0) - (40.0) 1Q09 2Q09 3Q09 4Q09 1Q10 2Q10 3Q10 4Q10 1Q11 1Q09 2Q09 3Q09 4Q09 1Q10 2Q10 3Q10 4Q10 1Q11 Gross Revenue (LHS) YoY growth (RHS) EBIT (LHS) EBIT Margin (RHS) Source: Company, Angel Research Source: Company, Angel Research Agri business registers another quarter of strong revenue growth ITC’s agri business registered a strong 44% yoy growth in revenues to Rs1,350cr (Rs941cr), partially aided by low base and driven by increased sales of soya, leaf tobacco and wheat. The business maintained its position as the foremost exporter of leaf tobacco, leveraging the growing demand for Indian tobaccos. However, EBIT margins contracted 150bp yoy to 9.1% resulting in a 23% yoy growth in segmental EBIT largely due to adverse product mix (higher volumes of soya in the quarter). Going ahead, we expect this segment to register 21% CAGR in revenues over FY2010-12E and margins to remain stable at 10% levels owing to management’s focus to shift to higher profitability products and firm leaf tobacco prices. Exhibit 16: Revenue up 44% yoy and 37% qoq Exhibit 17: Margins decline yoy, sharp up-tick qoq 2,000 100.0 200 20.0 80.0 10.0 1,500 60.0 150 - 40.0 (Rs cr) 1,000 20.0 100 (10.0) (%) (Rs cr) (%) - (20.0) 500 (20.0) 50 (30.0) (40.0) - (60.0) - (40.0) 1Q09 2Q09 3Q09 4Q09 1Q10 2Q10 3Q10 4Q10 1Q11 1Q09 2Q09 3Q09 4Q09 1Q10 2Q10 3Q10 4Q10 1Q11 Gross Revenue (LHS) YoY growth (RHS) EBIT (LHS) EBIT Margin (RHS) Source: Company, Angel Research Source: Company, Angel Research July 22, 2010 6
  • 7.
    ITC|1QFY2011 Result Update Investment Rationale Model double-digit sales and EBIT growth in cigarettes: We have modeled in 1.4% volume growth in cigarette volumes for FY2011E (likely to be back-ended in 2HFY2011E) despite ~15% weighted average price hikes, which is likely to fully offset: 1) ~17% excise hike in the Budget, and 2) rise in VAT announced in several states. We believe the cigarette business is well poised to post double- digit sales and EBIT growth in FY2011E. Moreover, we highlight that over the last 12 months, ITC has strengthened its brand portfolio significantly with brands such as Flake Excel and Duke Filter, launched Lucky Strike at the premium end and test-marketed 59mm mid-size filters (micro-filters). Non-cigarette EBIT to log 30% CAGR over FY2010-12E: While cigarettes remain the main profit center, investments in non-cigarette businesses like FMCG, hotels and paperboards have started yielding positive contribution. During FY2010-12E, we expect non-cigarette EBIT to post 30% CAGR aided by: 1) reduction in non-cigarette FMCG losses, 2) improvement in hotel margins aided by higher ARRs, and 3) higher margin in paperboards. Return ratios to improve across segments boosting cash flow generation: Over FY2010-12E, we expect return ratios to improve across segments driven by higher margins (refer Exhibit 20). Moreover, going ahead, we expect capex to plateau from the peak of FY2007-08 driving strong cash flow generation post dividend payout of ~50%. Hence, we expect ITC to achieve strong net cash surplus of Rs~5,800cr (US $125mn) in FY2012E equating to Rs15 per share. Outlook and Valuation We have marginally tweaked our numbers to account for – 1) higher sales in agri-business, and 2) higher margins in paperboards. Exhibit 18: Change in estimates Parameter Old Estimate New Estimate % chg (Rs cr) FY11E FY12E FY11E FY12E FY11E FY12E Revenue 20,827 23,076 21,050 23,757 1.1 2.9 OPM (%) 34.4 34.2 34.7 34.3 29bp 12bp EPS (Rs) 12.5 13.7 12.6 14.1 0.6 3.0 Source: Company, Angel Research At the CMP of Rs298, the stock is trading at 21.1x FY2012E earnings (~10% discount to other FMCG companies). However, owing to the recent run up in the stock price (12% over last the 3 months vis-à-vis 3% in Sensex), we retain our Neutral rating on the stock with a revised fair value of Rs310 based on our SOTP model (in line with its historical P/E multiple of 22x one-yr forward earnings). Exhibit 19: Sum-of-the-parts (SOTP) valuation Segment Parameter Multiple (x) EV (Rs cr) Per Share Value (Rs) Cigarettes EV/EBITDA 13.0 83,349 218 Non-Cigarette FMCG (Others) EV/Sales 2.0 10,352 27 Hotels EV/EBITDA 12.0 5,778 15 Paperboards EV/EBITDA 8.0 9,814 26 Agri-Business EV/EBITDA 5.0 3,075 8 Less: Net Debt/ (Cash) (5,808) (15) Total Equity Value 118,176 310 Source: Company, Angel Research July 22, 2010 7
  • 8.
    ITC|1QFY2011 Result Update Exhibit20: Key Assumptions FY2009 FY2010 FY2011E FY2012E Top-line growth (%) Cigarettes 9.3 14.3 14.3 9.9 Volume growth (%) (2.9) 7.2 1.4 5.2 Realisation growth (%) 12.6 6.7 12.8 4.4 Non-Cigarette FMCG 20.0 20.8 21.2 17.6 Hotels (7.3) (10.7) 20.1 20.0 Paperboards 19.4 14.6 18.6 13.9 Agri-Business (0.6) 0.4 27.6 14.8 PBIT Margin (%) Cigarettes 27.7 28.6 29.1 28.7 Non-Cigarette FMCG (16.0) (9.6) (6.5) (4.5) Hotels 31.0 23.8 26.0 28.5 Paperboards 18.0 21.2 22.0 22.3 Agri-Business 6.7 11.3 10.2 10.0 RoCE (%) Cigarettes 142.5 164.7 177.1 180.5 Non-Cigarette FMCG (23.0) (20.3) (14.6) (10.8) Hotels 14.4 8.8 10.1 11.5 Paperboards 13.5 18.4 20.8 21.8 Agri-Business 24.7 27.6 26.1 25.4 Source: Company, Angel Research July 22, 2010 8
  • 9.
    ITC|1QFY2011 Result Update Exhibit21: Peer Valuation Company Reco Mcap CMP TP* Upside P/E (x) EV/Sales (x) RoE (%) CAGR # (Rs cr) (Rs) (Rs) (%) FY11E FY12E FY11E FY12E FY11E FY12E Sales PAT Asian Paints Neutral 24,137 2,516 2,461 (2.2) 28.2 23.5 3.2 2.7 39.9 38.5 15.5 15.3 Colgate Reduce 11,549 849 798 (6.0) 26.9 23.5 4.9 4.3 117.3 108.8 14.3 7.8 Dabur Reduce 18,013 209 192 (7.9) 30.3 26.0 4.5 3.9 41.5 39.2 16.0 17.4 GSKCHL Reduce 7,538 1,792 1,622 (9.5) 27.5 23.2 3.0 2.5 27.7 27.8 17.8 18.8 HUL Reduce 57,104 262 237 (9.6) 25.9 23.1 2.8 2.5 73.5 72.1 10.8 8.6 ITC Neutral 1,13,826 298 310 4.1 23.7 21.1 5.0 4.4 31.4 30.1 14.4 15.2 Marico Reduce 7,591 125 115 (8.0) 26.9 22.8 2.5 2.2 36.6 32.3 14.4 17.4 Nestle Neutral 28,432 2,949 2,955 0.2 36.2 29.9 4.7 4.0 118.2 118.6 16.5 20.4 Source: Company, Angel Research, Note: #denotes CAGR for FY2010-12E, * In case of Neutral recommendation, TP = Fair value Exhibit 22: Angel v/s Consensus estimates Top-line (Rs cr) FY2011E FY2012E EPS (Rs) FY2011E FY2012E Angel estimates 21,050 23,757 Angel estimates 12.6 14.1 Consensus 21,089 23,996 Consensus 12.5 14.4 Diff (%) (0.2) (1.0) Diff (%) 0.9 (2.0) Source: Company, Angel Research Exhibit 23: Returns - ITC v/s Sensex (Indexed to 100) Exhibit 24: One-yr forward P/E band 250% 350 15x 18x 21x 24x Sensex ITC 300 200% 250 Share Price (Rs) 150% 200 150 100% 100 50% 50 - 0% Jan-06 Jan-07 Jan-08 Jan-09 Jan-10 Jul-05 Oct-05 Jul-06 Oct-06 Jul-07 Oct-07 Jul-08 Oct-08 Jul-09 Oct-09 Jul-10 Apr-05 Apr-06 Apr-07 Apr-08 Apr-09 Apr-10 Oct-07 Jan-08 Oct-08 Jan-09 Oct-09 Jan-10 Apr-07 Apr-08 Apr-09 Apr-10 Jul-07 Jul-08 Jul-09 Jul-10 Source: Company, Angel Research Source: Company, Angel Research Exhibit 25: One-yr forward P/E chart Exhibit 26: One-yr forward Premium v/s Sensex chart 35.0 80% 70% 30.0 60% 25.0 50% 40% 20.0 30% 15.0 20% 10% 10.0 0% 5.0 -10% -20% - -30% Oct-02 Oct-03 Oct-04 Oct-05 Oct-06 Oct-07 Oct-08 Oct-09 Apr-02 Apr-03 Apr-04 Apr-05 Apr-06 Apr-07 Apr-08 Apr-09 Apr-10 Feb-03 May-04 Oct-04 Mar-05 Jan-06 Feb-08 May-09 Oct-09 Mar-10 Apr-02 Aug-05 Nov-06 Apr-07 Sep-02 Jul-03 Dec-03 Jun-06 Sep-07 Jul-08 Dec-08 Source: Company, Angel Research, Note: Red line indicates 5-year average Source: Company, Angel Research, Note: Red line indicates 5-year average July 22, 2010 9
  • 10.
    ITC|1QFY2011 Result Update Profit & Loss Statement Rs crore Y/E March FY2007 FY2008 FY2009 FY2010 FY2011E FY2012E Gross sales 19,300 21,356 23,144 26,260 30,507 34,303 Less: Excise duty 7,136 7,408 7,532 8,106 9,456 10,547 Net Sales 12,164 13,948 15,612 18,153 21,050 23,757 Total operating income 12,164 13,948 15,612 18,153 21,050 23,757 % chg 982.0 14.7 11.9 16.3 16.0 12.9 Total Expenditure 8,208 9,544 10,753 12,079 13,748 15,603 Cost of Materials 5,195 6,017 5,958 6,971 8,020 9,094 Advertising Exp 288 378 502 515 600 713 Personnel 630 733 891 1,003 1,179 1,339 Others 2,095 2,416 3,402 3,590 3,949 4,458 EBITDA 3,956 4,404 4,859 6,074 7,303 8,154 % chg 2176.4 11.3 10.3 25.0 20.2 11.7 (% of Net Sales) 32.5 31.6 31.1 33.5 34.7 34.3 Depreciation& Amortisation 363 438 549 609 665 730 EBIT 3,593 3,965 4,309 5,465 6,638 7,424 % chg 2423.9 10.4 8.7 26.8 21.5 11.8 (% of Net Sales) 29.5 28.4 27.6 30.1 31.5 31.3 Interest & other Charges 3 5 18 53 25 15 Other Income 336 611 535 603 555 630 (% of PBT) 8.6 13.4 11.1 10.0 7.7 7.8 Share in profit of Associates - - - - - - Recurring PBT 3,927 4,572 4,826 6,015 7,168 8,039 % chg 1990.0 16.4 5.6 24.7 19.2 12.2 Extraordinary Expense/(Inc.) 0 0 0 0 0 0 PBT (reported) 3,927 4,572 4,826 6,015 7,168 8,039 Tax 1,227 1,452 1,562 1,954 2,365 2,653 (% of PBT) 31.2 31.8 32.4 32.5 33.0 33.0 PAT (reported) 2,700 3,120 3,264 4,061 4,803 5,386 Add: Share of associates - - - - - - Less: Minority interest (MI) - - - - - - PAT after MI (reported) 2,700 3,120 3,264 4,061 4,803 5,386 ADJ. PAT 2,700 3,120 3,264 4,061 4,803 5,386 % chg 1862.2 15.6 4.6 24.4 18.3 12.2 (% of Net Sales) 22.2 22.4 20.9 22.4 22.8 22.7 Basic EPS (Rs) 7.1 8.2 8.5 10.6 12.6 14.1 Fully Diluted EPS (Rs) 7.1 8.2 8.5 10.6 12.6 14.1 % chg (30.1) 15.6 4.6 24.4 18.3 12.2 July 22, 2010 10
  • 11.
    ITC|1QFY2011 Result Update Balance Sheet Rs crore Y/E March FY2007 FY2008 FY2009 FY2010 FY2011E FY2012E SOURCES OF FUNDS Equity Share Capital 376 377 377 382 382 382 Preference Capital - - - - - - Reserves& Surplus 10,061 11,681 13,358 13,683 16,140 18,845 Shareholders Funds 10,437 12,058 13,735 14,064 16,522 19,227 Minority Interest - - - - - - Total Loans 201 214 178 108 83 58 Deferred Tax Liability 473 545 867 785 785 785 Total Liabilities 11,111 12,817 14,780 14,957 17,389 20,070 APPLICATION OF FUNDS Gross Block 7,134 8,960 10,559 11,968 13,494 15,180 Less: Acc. Depreciation 2,390 2,791 3,287 3,825 4,490 5,220 Net Block 4,745 6,169 7,272 8,142 9,004 9,960 Capital Work-in-Progress 866 1,127 1,214 1,009 1,080 1,214 Goodwill - - - - - - Investments 3,068 2,935 2,838 5,727 5,227 5,977 Current Assets 6,301 7,031 8,172 8,142 8,686 10,463 Cash 900 570 1,031 1,126 727 1,628 Loans & Advances 1,399 1,662 1,860 1,593 1,895 2,186 Other 4,002 4,799 5,280 5,423 6,065 6,650 Current liabilities 3,869 4,444 4,716 8,064 6,607 7,545 Net Current Assets 2,432 2,587 3,456 79 2,079 2,919 Misc Exp - - - - - - Total Assets 11,111 12,817 14,780 14,957 17,389 20,070 Cash Flow Statement Rs crore Y/E March FY2007 FY2008 FY2009 FY2010 FY2011E FY2012E Profit before tax 3,927 4,572 4,826 6,015 7,168 8,039 Depreciation 363 438 549 609 665 730 Change in Working Capital (667) (432) (326) 392 (258) (246) Interest / Dividend (Net) (222) (337) (276) (279) (275) (325) Direct taxes paid 1,227 1,452 1,562 1,954 2,365 2,653 Others (37) (80) 51 105 (35) (27) Cash Flow from Operations 2,137 2,710 3,262 4,888 4,899 5,518 (Inc.)/ Dec. in Fixed Assets (1,739) (2,242) (1,686) (1,204) (1,597) (1,821) (Inc.)/ Dec. in Investments 435 172 144 (2,889) 500 (750) Cash Flow from Investing (1,304) (2,071) (1,542) (4,093) (1,097) (2,571) Issue of Equity 42 45 45 721 0 0 Inc./(Dec.) in loans 81 14 (37) (70) (25) (25) Dividend Paid (Incl. Tax) 1,135 1,365 1,543 1,630 4,452 2,345 Interest / Dividend (Net) (222) (337) (276) (279) (275) (325) Cash Flow from Financing (789) (969) (1,259) (700) (4,202) (2,045) Inc./(Dec.) in Cash 44 (330) 461 95 (399) 901 Opening Cash balances 856 900 570 1,031 1,126 727 Closing Cash balances 900 570 1,031 1,126 727 1,628 July 22, 2010 11
  • 12.
    ITC|1QFY2011 Result Update Key Ratios Y/E March FY2007 FY2008 FY2009 FY2010 FY2011E FY2012E Valuation Ratio (x) P/E (on FDEPS) 42.1 36.5 34.9 28.0 23.7 21.1 P/CEPS 36.6 31.6 29.5 24.4 20.8 18.6 P/BV 10.7 9.3 8.2 8.1 6.9 5.9 Dividend yield (%) 1.0 1.2 1.2 3.4 1.8 2.0 EV/Sales 8.9 7.8 6.9 5.8 5.0 4.4 EV/EBITDA 27.4 24.7 22.3 17.3 14.5 12.8 EV / Total Assets 9.8 8.5 7.3 7.0 6.1 5.2 Per Share Data (Rs) EPS (Basic) 7.1 8.2 8.5 10.6 12.6 14.1 EPS (fully diluted) 7.1 8.2 8.5 10.6 12.6 14.1 Cash EPS 8.1 9.4 10.1 12.2 14.3 16.0 DPS 3.1 3.5 3.7 10.0 5.3 6.0 Book Value 27.7 32.0 36.4 36.8 43.3 50.4 Returns (%) RoCE 34.9 33.1 31.2 36.8 41.0 39.6 Angel RoIC (Pre-tax) 51.0 43.2 38.8 50.2 57.7 54.2 RoE 27.7 27.7 25.3 29.2 31.4 30.1 Turnover ratios (x) Asset Turnover 1.8 1.7 1.6 1.6 1.7 1.7 Inventory / Sales (days) 101 106 108 91 87 83 Receivables (days) 19 20 16 18 18 19 Payables (days) 72 73 70 71 72 72 Net Working capital (days) 46 53 57 (21) 23 20 July 22, 2010 12
  • 13.
    ITC|1QFY2011 Result Update Research Team Tel: 022 - 4040 3800 E-mail: research@angeltrade.com Website: www.angeltrade.com Disclaimer This document is solely for the personal information of the recipient, and must not be singularly used as the basis of any investment decision. Nothing in this document should be construed as investment or financial advice. Each recipient of this document should make such investigations as they deem necessary to arrive at an independent evaluation of an investment in the securities of the companies referred to in this document (including the merits and risks involved), and should consult their own advisors to determine the merits and risks of such an investment. Angel Broking Limited, its affiliates, directors, its proprietary trading and investment businesses may, from time to time, make investment decisions that are inconsistent with or contradictory to the recommendations expressed herein. The views contained in this document are those of the analyst, and the company may or may not subscribe to all the views expressed within. Reports based on technical and derivative analysis center on studying charts of a stock's price movement, outstanding positions and trading volume, as opposed to focusing on a company's fundamentals and, as such, may not match with a report on a company's fundamentals. The information in this document has been printed on the basis of publicly available information, internal data and other reliable sources believed to be true, but we do not represent that it is accurate or complete and it should not be relied on as such, as this document is for general guidance only. Angel Broking Limited or any of its affiliates/ group companies shall not be in any way responsible for any loss or damage that may arise to any person from any inadvertent error in the information contained in this report. Angel Broking Limited has not independently verified all the information contained within this document. Accordingly, we cannot testify, nor make any representation or warranty, express or implied, to the accuracy, contents or data contained within this document. While Angel Broking Limited endeavours to update on a reasonable basis the information discussed in this material, there may be regulatory, compliance, or other reasons that prevent us from doing so. This document is being supplied to you solely for your information, and its contents, information or data may not be reproduced, redistributed or passed on, directly or indirectly. Angel Broking Limited and its affiliates may seek to provide or have engaged in providing corporate finance, investment banking or other advisory services in a merger or specific transaction to the companies referred to in this report, as on the date of this report or in the past. Neither Angel Broking Limited, nor its directors, employees or affiliates shall be liable for any loss or damage that may arise from or in connection with the use of this information. Note: Please refer to the important `Stock Holding Disclosure' report on the Angel website (Research Section). Also, please refer to the latest update on respective stocks for the disclosure status in respect of those stocks. Angel Broking Limited and its affiliates may have investment positions in the stocks recommended in this report. Disclosure of Interest Statement ITC 1. Analyst ownership of the stock No 2. Angel and its Group companies ownership of the stock Yes 3. Angel and its Group companies' Directors ownership of the stock No 4. Broking relationship with company covered No Note: We have not considered any Exposure below Rs 1 lakh for Angel, its Group companies and Directors. Ratings (Returns) : Buy (> 15%) Accumulate (5% to 15%) Neutral (-5 to 5%) Reduce (-5% to 15%) Sell (< -15%) July 22, 2010 13