SlideShare a Scribd company logo
Company Update | Shipping
                                                                                                                          April 28, 2010


 GE Shipping                                                                                 BUY
                                                                                             CMP                                  Rs331
 Anchoring Offshore                                                                          Target Price                         Rs396

 GE Shipping (Gesco) has emerged almost unscathed from the downturn of the                   Investment Period             12 months
 shipping cycle on account of timely purchase and sale of assets and sound mix of
                                                                                             Stock Info
 time spot ratio. Accordingly, with the bottoming out of the freight rates and asset
 prices, we expect Gesco to register 49.3% CAGR in Net Profit over CY2010-12E.               Sector                              Shipping

 Further, the company plans to list its wholly-owned offshore subsidiary, Greatship          Market Cap (Rs cr)                    5,048
 Limited (GIL) by end FY2011E, which we believe will unlock value for the                    Beta                                    0.9
 shareholders. On NAV basis, the Shipping business fetches Rs263/share (10%                  52 Week High / Low                  340/201
 discount to NAV), while we have valued the Offshore business at 6.5x FY2012E
                                                                                             Avg Daily Volume                    203,318
 EV/EBIDTA in line with its global peers and fetches Rs133/share. Based on our
                                                                                             Face Value (Rs)                          10
 Target Price of Rs396 the implied EV/ EBITDA, P/BV, P/E multiple works out to
                                                                                             BSE Sensex                           17,745
 5.7x, 0.9x, and 5.7x respectively, on FY2012E basis. Thus, on account of trading
 at a significant discount to its global peers, we recommend a Buy on stock.                 Nifty                                 5,322
                                                                                             Reuters Code                        GESC.BO
 Tanker freight rates bottoming out: The International Energy Agency (IEA) estimates
                                                                                             Bloomberg Code                 GESCO@IN
 global oil demand to register 1.5% CAGR over CY2009-11E increasing from
 2.6mbd to 87.5mbd as against the decline of 1.5% in CY2009. As per Clarksons,
                                                                                             Shareholding Pattern (%)
 13% and 14% of the existing capacity (fleet) of crude and product tankers will be
 added in CY2010. However, accelerated phase out of single hull tankers, which               Promoters                              30.0
 account for 12% of the world's existing tanker fleet, will relieve supply-side pressures    MF / Banks / Indian FIs                21.1
 and keep the freight rates at current sustainable levels over the near to medium            FII / NRIs / OCBs                      21.8
 term. Gesco will be a key beneficiary of higher tanker freight rates as it derives          Indian Public / Others                 27.1
 around 46% of its Consolidated Revenues from the Tanker Segment.

 GIL IPO to unlock value: The company intends to list its 100% subsidiary, GIL by            Abs. (%)          3m         1yr        3yr
 end FY2011E through fresh equity issuance. We believe this will unlock potential            Sensex              5.7    56.6        24.7
 value of the Offshore business, which globally trades at higher multiples than the
                                                                                             Gesco             10.6     57.5        35.9
 Shipping business due to better stability and high visibility in Earnings.


 Key Financials (Consolidated)
 Y/E March (Rs cr)              FY2009         FY2010E            FY2011E    FY2012E
 Net Sales                         3,801           2,840            3,013       3,873
 % chg                              21.4           (25.3)             6.1         28.5
     Profit
 Net Profit                        1,418             475             687        1,059
 % chg                              (2.4)          (66.5)            44.5         54.2
 FDEPS (Rs)                         93.1             31.2            45.1         69.5
 EBITDA Margin (%)                  41.6             23.6            32.7         37.2
 P/E (x)                              3.6            10.6             7.3          4.8      Param Desai
 RoE (%)                            29.7              8.8            11.9         16.5      +91 22 4040 3800 Ext: 310
 RoCE (%)                           14.5              2.5             5.0          8.7      Email: paramv.desai@angeltrade.com

 P/BV (x)                             1.0             0.9             0.8          0.7
 EV/Sales (x)                         1.9             2.4             2.2          1.8      Mihir Salot
                                                                                            +91 22 4040 3800 Ext: 307
 EV/EBITDA (x)                        4.5            10.3             6.9          5.0
                                                                                            Email: mihirr.salot@angeltrade.com
 Source: Company, Angel Research, Price as on April 26, 2010


Please refer to important disclosures at the end of this report
GE Shipping | Company Update


                 Valuation
                 Shipping Business valued at Rs263/share

                 The Shipping business is cyclical in nature. Hence, it is difficult to predict the Earnings
                 given volatility in the freight rates. Hence, we have valued Gesco on the sum-of-the-
                 parts methodology. We have valued the Shipping business on NAV basis taking into
                 account three parameters, viz, size, age and type (ie., whether single or double hull).
                 We have assigned 10% discount to NAV on a conservative basis though we believe
                 the asset prices have bottomed out. Further, we believe that the decline in NAV through
                 the reduction in asset prices would be mitigated by an increase in tonnage. We have
                 thus arrived at an NAV of Rs263/share (10% discount to NAV) for the Shipping Division.

                 Exhibit 1: Shipping Division Valuation
                  Particulars                                                             Value ( Rs cr)
                  Tanker Segment - A                                                              3,108
                  Dry Bulk Segment - B                                                              649
                  NAV- discounted @ 10% (A + B)
                  NAV                                                                             3,757
                  Less Debt                                                                       3,487
                  Add Cash                                                                        3,214
                  Add Advances                                                                      525
                  Total                                                                           4,009
                  NAV/share (Rs)
                  NAV/share                                                                         263
                 Source: Company, Angel Research

                 Offshore business valued at Rs133/share
                 Gesco intends to add another eight offshore vessels over the next two years, which
                 would spur Revenue growth. In our view, the listing could unlock the potential value
                 of the Offshore business, which globally trades at higher multiples than the Shipping
                 business due to better stability and high visibility in Earnings. Moreover, we believe
                 that the company might further expand capacity with better capital structure post
                 listing of Offshore Division, which would enable it to acquire assets, especially new
                 rigs. Consequently, this would further spur Revenue and Earnings growth while
                 providing Earnings visibility. We have valued the Off-shore Division at 6.5x EV/EBIDTA
                 in line with the global peers. Consequently, the Offshore Division fetches
                 Rs133/share.
                 Exhibit 2: Offshore Division Valuation
                  Particulars                                                              Value (Rs cr)
                  FY2012E EBIDTA                                                                    593
                  Target multiple -EV/EBIDTA (x)                                                     6.5
                  EV                                                                              3,856
                  Less Debt                                                                       2,099
                  Add Cash                                                                          264
                  Target Mkt cap                                                                  2,021
                  Value (Rs/share)                                                                  133
                 Source: Company, Angel Research

                 Trading at discount to Peers
                 Based on our Target Price of Rs396, the implied EV/ EBITDA, P/BV, P/E multiple
                 works out to 5.7x, 0.8x, and 5.7x respectively, on FY2012E basis. Thus, Gesco is
                 trading at a significant discount to its global peers.
April 28, 2010                                                                                             2
GE Shipping | Company Update


Exhibit 3: Global Peer Valuation
                                 Market Cap                P/E (x)             P/B (x)         EV/EBITDA (x)
                                                                                               EV/EBITDA              EV/Sales (x)                  RoE (%)
Tankers                              USD Mn     CY10E         CY11E        CY10E    CY11E      CY10E    CY11E       CY10E      CY11E      CY10E        CY11E

Teekay                                   526      15.1           12.0        1.7         1.9    11.2        9.9       6.3          6.3      14.2         16.8

Frontline                              2,833      15.2           14.8        3.5         3.5     9.6        9.7       5.1          5.1      22.4         22.9

Overseas Shipholding                   1,538      98.9           24.6        0.8         0.8    12.0        9.2       2.5          2.5        0.6          3.3

Ship Finance International             1,594        8.8              9.3     1.7         1.7     8.1        7.2       9.1          9.1      27.5         20.4

Tsakos Energy                            569      19.1           10.2        0.6         0.6     9.8        8.5       4.3          4.3        4.6          4.6

Average                                           31.4           14.2        1.7         1.7    10.1        8.9       5.5          5.5      13.9         13.6

Dry Bulk

China Cosco Holding                  17,042       47.2           25.7        2.6         2.4    15.6       14.3       1.7          1.7        2.8          6.0

China Shipping Development             5,536      17.6           12.7        1.6         1.4    11.2        8.5       3.2          3.2        9.1        10.9

Stx Pan Ocean                          2,490      26.7           10.9        1.2         1.1    16.5        9.1       0.6          0.6        4.9          9.6

Cosco Shipping                         1,841      29.3           14.8        2.6         2.3    13.1        9.7       1.9          1.9        7.9        15.1

Pacific Basin                          1,483      14.9           12.7        1.0         1.0     8.1        7.1       1.5          1.5        6.9          8.0

Diana Shipping                         1,258        9.8          10.3        1.1         1.0     7.0        7.1       5.0          5.0      11.1           9.5

Average                                           24.3           14.5        1.7         1.5    11.9        9.3       2.3          2.3       7.1           9.9

Offshore

Transocean                           30,134       10.0               8.5     1.3         1.2     7.3        6.6       3.4          3.4      13.2         15.1

Diamond Offshore                     11,901       10.3           10.0        3.0         2.8     6.0        5.8       3.3          3.3      30.8         31.3

Nabors Industries                      6,436      21.3           13.6        1.2         1.1     6.8        5.7       2.1          2.1        5.2          8.2

Pride International                    5,864      18.4           10.1        1.3         1.1    11.3        6.6       3.0          3.0        6.9        11.9

Rowan Companies                        3,700      13.2           16.3        1.1         1.0     6.4        6.9       2.1          2.1        8.8          7.6

Aban Offshore*                         1,198      11.9               5.7     2.1         1.6    10.4        7.8       4.8          4.8      20.9         32.2

China Oilfield Services                8,824      12.3           10.9        1.7         1.5    10.3        9.0       4.0          4.0      15.3         15.5

Average                                           14.0           10.7        1.7         1.5     8.4        6.9       3.2          3.2      14.5         17.4

 GE Shipping*                        1,149         7.3        4.8        0.8             0.7     6.9        5.0       2.2          1.8      11.9         16.5
Source: Bloomberg, Angel Research; Note: * Y/E March; Prices as on April 26, 2010


                                                    Exhibit 4: Gesco’s 1yr forward P/BV
                                                           1.8

                                                           1.6

                                                           1.4

                                                           1.2                                                              Trading at discount to its
                                                                                                                               four year average
                                                             1
                                                     (x)


                                                           0.8

                                                           0.6

                                                           0.4

                                                           0.2

                                                             0
                                                             April-06              April-07            April-08              April-09                 April-10
                                                    Source: Bloomberg, Angel Research


April 28, 2010                                                                                                                                                3
GE Shipping | Company Update


                 Exhibit 5: GE Shipping Fleet Details
                  Sr no.    Vessels           Name                Dwt    Hull   Age          Market
                                                                                      Value (US $mn)

                            Crude Carriers
                  1         Suezmax           Jag Lalit       158,344     DH      5            61.0
                  2         Suezmax           Jag Lok         158,280     DH      5            61.0
                  3         Suezmax           Jag Laskhya     152,485     SH     21              8.0
                  4         Suezmax           Jag Lateef      147,092     DH     10            45.0
                  5         Suezmax           Jag Lakshita    147,092     DH     10            45.0
                  6         Aframax           Jag Lyall       110,531     DH      4            51.0
                  7         Aframax           Jag Lamha        98,214     SH     23              7.5
                  8         Aframax           Jag Laxmi       105,051     DH     11            15.0
                  9         Aframax           Jag Leela       105,148     DH     11            15.0
                  10        Aframax           Jag Lata        105,716     DH      7            35.0
                  11        Aframax           Jag Lavanya     105,010     DH      6            35.0
                            Product Tankers
                                    Tankers
                  12        LR1               Jag Amisha       74,868     DH     1             45.0
                  13        LR1               Jag Aparna       74,868     DH     1             45.0
                  14        LR1               Jag Aabha        74,868     DH     2             45.0
                  15        LR1               Jag Aanchal      74,868     DH     2             45.0
                  16        MR                Jag Pranam       50,600     SH     26              4.0
                  17        MR                Jag Pavitra      50,600     SH     25              4.0
                  18        MR                Jag Pahel        46,319     DH     6             25.0
                  19        MR                Jag Pankhi       46,345     DH     7             25.0
                  20        MR                Jag Pradip       45,684     DH     14              5.0
                  21        MR                Jag Pratap       45,683     DH     15              5.0
                  22        MR                Jag Prakash      47,848     DH     3             35.0
                  23        MR                Jag Prerana      46,348     DH     3             35.0
                  24        MR                Jag Pushpa       47,400     DH     3             35.0
                  25        MR                Jag Padma        47,000     DH     14            25.0
                  26        GP                Jag Preeti       29,139     DH     29              3.0
                  27        GP                Jag Pari         29,139     DH     28              3.0
                  28        GP                Jag Palak        27,402     SH     25              3.0
                  29        GP                Jag Pragati      27,400     SH     25              3.0
                  30        GP                Jag Parwar       29,998     SH     22              3.0
                  31        Gas Carriers      Jag Viraj        17,577            19              4.5
                            Bulk Carriers
                  32        Supramax          Jag Rahul        52,364     SH     7             35.0
                  33        Supramax          Jag Ratan        52,180     SH     9             35.0
                  34        Capesize          Jag Arjun       164,796     SH     14            32.0
                  35        Panamax           Jag Arnav        71,122     SH     15            25.0
                  36        Handymax          Jag Ravi         45,342     SH     13            20.0
                  37        Handysize         Jag Vikram       27,463     SH     30            15.0
                            Total                            2,740,184                          938

                 Source: Company, Angel Research


April 28, 2010                                                                                         4
GE Shipping | Company Update


                                         Investment Arguments
                                         Tanker freight rates bottoming out
                                         The International Energy Agency (IEA) estimates global oil demand to post 1.5%
                                         CAGR over CY2009-11E increasing from 2.6mbd to 87.5mbd as against the decline
                                         of 1.5% in CY2009. As per Clarksons, 13% and 14% of the current existing capacity
                                         (fleet) of crude and product tankers will be added in CY2010. However, accelerated
                                         phase out of single hull tankers, which currently account for 12% of the world's existing
                                         tanker fleet, will relieve supply side pressures and keep freight rates at the current
                                         sustainable levels over the near to medium term.
                                         Tanker freight rates hinge on Oil consumption and New deliveries
                                         The world economy, oil consumption, floating storage, slippages & scrapping and
                                         delivery of new buildings are some of the important factors that impact the demand
                                         for tanker fleets.
                                         Exhibit 6: Drivers of Tanker Fleet


                                                                                   Global
                                                                                  Economy


                                                                  Scrapping
                                                                                                        New
                                                                      &
                                                                                                      Deliveries
                                                                  Slippages        Demand
                                                                                     for
                                                                                 Tanker Fleet


                                                                          Oil                   Floating
                                                                        Demand                  Storage


                                         Source: Angel Research

                                         Demand for oil will drive freight rates

As per IEA forecasts, crude oil demand   Crude oil production in the last few years has been driven by consumption in the
should grow by 1.7% in CY2010E to        non-OECD countries (developing nations) owing to the greater energy requirements
86.3mbd and 1.6% in C2011E to            in these faster growing nations, and is likely to keep demand high in the long term.
87.5mbd as against the decline of        As per IEA, all incremental demand is expected to be derived from the non-OECD
1.5% in CY2009                           countries, which will overtake the OECD nations and are expected to account for
                                         51% of the world's oil demand by 2014 from current levels of 46%. In the last decade,
                                         China's crude oil consumption almost doubled and currently the country consumes
                                         10.0% of the total world crude consumption. As per IEA forecasts, crude oil demand
                                         should grow by 1.6% in CY2010E to 86.3m bbls/per day and 1.4% in C2011E to
                                         87.5mbd as against the decline of 1.5% in CY2009.

                                         Exhibit 7: Demand for oil
                                          Demand Scenario (m bbls/day)            2008 2009 2010 2011 2012 2013 2014
                                          OECD                                      47.6        45.5       45.5    45.4   45.2    45    44.8
                                          Non-OECD                                  38.6        39.3       40.8    42.1   43.4   44.8   46.0
                                          World                                    86.2         84.9       86.3    87.5   88.7   89.8   90.9
                                          yoy chg (%)                                           (1.5)       1.6     1.4    1.4    1.2    1.2
                                          Global GDP (yoy %chg)                       2.9       (1.2)       3.1     4.2    4.4    4.5    4.5
                                         Source: IEA


April 28, 2010                                                                                                                             5
GE Shipping | Company Update


                                            Slippages and Scrapping key to Tanker freight rates

We expect a major portion of the            The sharp drop in sea-borne oil trade during the global economic crisis along with
single-hull
single-hull tankers (55mn dwt), ie. 12%     7% growth in fleet should have led to a decline in the rates for tankers in most part of
of the world tanker fleet, to get           CY2009. But, it did not happen because 20mn dwt of the fleet or 5% were used as oil
removed from active trading in              storage vessels. In CY2009, 9mn dwt or 18% of the scheduled deliveries were not
CY2010 in line with the IMO standards       delivered. The total Tanker Order Book size currently stands at 30.7% (134.1mn dwt)
                                            of the existing fleet of which 14.6% (64mn dwt) is expected to come up in 2010. We
                                            expect actual deliveries to be significantly lower than 64mn dwt on account of slippages
                                            and scrapping. A major portion of the single-hull tankers will be removed from active
                                            trading (55mn dwt) ie. 12% of the world tanker fleet in 2010 in line with the IMO
                                            standards. Hence, we expect net addition of moderate 7-8% of tanker fleet, which
                                            should keep the freight rates firm in the near term and gradually move up from
                                            2HFY2011E onwards.

Exhibit 8: Slippages to be a decisive factor
         Product
 Crude & Product Carriers (mn dwt)            VLCC         Suezmax      Aframax        Panamax          MR         GP        Total

 Order Book as on Jan 1, 2009                     20.8        10.9          11.9             4.1       10.6        2.1       60.5
 Actual Deliveries CY2009                         16.7         7.1          10.5             2.8        7.2        1.4       45.9
 Slippages/ Cancellations
 mn dwt                                            4.1         3.8            1.4            1.3        3.4        0.7       14.6
 % of Order Book as on Jan 1, 2009                19.7        34.9          11.8           31.7        32.1       33.3       24.1
Source: Company, Clarksons


Exhibit 9: Single hull scrapping crucial                             Exhibit 10: Scrapping Details
 Particulars (mn dwt)                CY2010E             CY2011E      Category            Fleet size            Scrapping

 Existing fleet as on Jan 1, 2010         437.5            471.5      (mn dwt)            01.02.10     CY08     CY09      2010 YTD

 Add New deliveries in CY2010               64              48.2      Crude Carriers          313.3       1.3      5.1          1.2
 Less Scrapping                             15                25      Product Carriers        125.8       1.5      3.3          0.7
 Less Slippages                             15                 0     Source: Company, Clarksons

 Fleet as at Y/E Dec                      471.5            494.7                                          12% of World
 Net Fleet Addition (%)                     7.8              4.9                                           tanker fleet
                                                                                                            single hull
Source: BRS, Angel Research

                                            Increase in Tonnage Miles

                                            Tonnage carried per dead weight tonne (DWT) has declined due to faster growth in
                                            global tonnage as against growth in total cargo. However, tonnage miles per DWT
                                            have been increasing, which signifies that ships are carrying similar cargo over longer
                                            distances now. We believe that tonnage miles have further potential to increase as
                                            patterns of trade movement between countries are changing and there are more
                                            shipments to the Asian countries such as China and India, which involve longer
                                            distances. There is an additional global refinery capacity of 8.7mb/d of which 75% is
                                            expected to come from Asia over 2008-2014E. Growth continues to be dominated by
                                            China                                                                                at
                                            2.9mb/d, Other Asia at 2.1mb/d and the Middle East at 1.5mb/d. Thus, higher
                                            crude volume will move from the Atlantic to the Pacific Basin with products moving
                                            the other way. This is a positive for the long haul tanker tonne-mile demand.


April 28, 2010                                                                                                                       6
GE Shipping | Company Update


                                                                                                                                           Correlation with Tanker Indices

                                                                                                                                           The Baltic Dirty Tanker and Clean Index has risen by around 100% from the bottom in
                                                                                                                                           April 2009, but still lower by around 55% from the peak. On the other hand, Gesco’s
                                                                                                                                           stock price has risen by 75% during the same period. Given IEA forecast of oil
                                                                                                                                           consumption, IMO regulation of scrapping single hull vessels by CY2010 and
                                                                                                                                           slippages, the positive trend in freight rates could well be captured by the indices and
                                                                                                                                           have a bearing on Gesco’s stock price going forward. We expect the tanker rates to
                                                                                                                                           remain firm in the near term and rise from 2HFY2011E onwards.

Exhibit 11: Gesco share price v/s Crude tanker index                                                                                                                                                            Exhibit 12: Gesco share price v/s Product tanker index
300                                                                                                                                                                                                               300

250                                                                                                                                                                                                               250

200                                                                                                                                                                                                               200

150                                                                                                                                                                                                               150

100                                                                                                                                                                                                               100

 50                                                                                                                                                                                                                     50

  0                                                                                                                                                                                                                      0
               Jan-07

                        Mar-07

                                 May-07

                                          Jul-07


                                                                     Jan-08

                                                                              Mar-08

                                                                                       May-08

                                                                                                Jul-08


                                                                                                                             Jan-09

                                                                                                                                      Mar-09

                                                                                                                                               May-09

                                                                                                                                                        Jul-09


                                                                                                                                                                                            Jan-10

                                                                                                                                                                                                     Mar-10
      Nov-06


                                                   Sep-07

                                                            Nov-07


                                                                                                           Sep-08

                                                                                                                    Nov-08


                                                                                                                                                                   Sep-09

                                                                                                                                                                                 Nov-09


                                                                                                                                                                                                                                                   Mar-07


                                                                                                                                                                                                                                                                        Jul-07

                                                                                                                                                                                                                                                                                 Sep-07


                                                                                                                                                                                                                                                                                                                    Mar-08


                                                                                                                                                                                                                                                                                                                                          Jul-08

                                                                                                                                                                                                                                                                                                                                                            Sep-08


                                                                                                                                                                                                                                                                                                                                                                                          Mar-09


                                                                                                                                                                                                                                                                                                                                                                                                                    Jul-09

                                                                                                                                                                                                                                                                                                                                                                                                                             Sep-09


                                                                                                                                                                                                                                                                                                                                                                                                                                                               Mar-10
                                                                                                                                                                                                                             Nov-06

                                                                                                                                                                                                                                      Jan-07


                                                                                                                                                                                                                                                                                            Nov-07

                                                                                                                                                                                                                                                                                                          Jan-08


                                                                                                                                                                                                                                                                                                                                                                        Nov-08

                                                                                                                                                                                                                                                                                                                                                                                 Jan-09


                                                                                                                                                                                                                                                                                                                                                                                                                                      Nov-09

                                                                                                                                                                                                                                                                                                                                                                                                                                                  Jan-10
                                                                                                                                                                                                                                                               May-07


                                                                                                                                                                                                                                                                                                                               May-08


                                                                                                                                                                                                                                                                                                                                                                                                        May-09
                                                               GE Shipping                               Baltic Dirty Tanker Index                                                                                                                                                             GE Shipping                                          Baltic Clean Tanker Index

Source: Bloomberg, Angel Research                                                                                                                                                                               Source: Bloomberg, Angel Research


                                                                                                                                           Dry Bulk Segment hinges on China's consumption and New Deliveries

The volumes of new building deliveries,                                                                                                    The Baltic Dry Index (BDI) rebounded by an impressive 288% yoy in CY2009 fuelled
China's economic growth and the trend                                                                                                      by low commodity prices, deferred new buildings, back loaded order book and Chinese
in the global market prices of iron ore                                                                                                    demand much to a positive surprise. Going forward, volumes of new building
and coal will determine the demand                                                                                                         deliveries, China's economic growth and the trend in the global market prices of iron
for dry bulk fleet                                                                                                                         ore and coal will determine the demand for dry bulk fleet. We believe that the freight
                                                                                                                                           rates for the Dry Bulk Segment will remain under pressure in the near term unless
                                                                                                                                           construction related activity progresses at a faster pace in China, and higher slippages
                                                                                                                                           leading to substantial decrease in supply.

                                                                                                                                           Exhibit 13: Gesco share price v/s BDI
                                                                                                                                               300

                                                                                                                                               250

                                                                                                                                               200

                                                                                                                                               150

                                                                                                                                               100

                                                                                                                                                50

                                                                                                                                                    0
                                                                                                                                                                                          Mar-07


                                                                                                                                                                                                               Jul-07

                                                                                                                                                                                                                             Sep-07


                                                                                                                                                                                                                                                                        Mar-08


                                                                                                                                                                                                                                                                                                     Jul-08

                                                                                                                                                                                                                                                                                                                   Sep-08


                                                                                                                                                                                                                                                                                                                                                                     Mar-09


                                                                                                                                                                                                                                                                                                                                                                                               Jul-09

                                                                                                                                                                                                                                                                                                                                                                                                                 Sep-09


                                                                                                                                                                                                                                                                                                                                                                                                                                                           Mar-10
                                                                                                                                                          Nov-06

                                                                                                                                                                            Jan-07


                                                                                                                                                                                                      May-07


                                                                                                                                                                                                                                          Nov-07

                                                                                                                                                                                                                                                            Jan-08


                                                                                                                                                                                                                                                                                   May-08


                                                                                                                                                                                                                                                                                                                                 Nov-08

                                                                                                                                                                                                                                                                                                                                                   Jan-09


                                                                                                                                                                                                                                                                                                                                                                                 May-09


                                                                                                                                                                                                                                                                                                                                                                                                                             Nov-09

                                                                                                                                                                                                                                                                                                                                                                                                                                         Jan-10


                                                                                                                                                                                                                                                              GE Shipping                                                    Baltic Dry Index
                                                                                                                                           Source: Bloomberg, Angel Research


April 28, 2010                                                                                                                                                                                                                                                                                                                                                                                                                                                      7
GE Shipping | Company Update


                                           High iron ore inventory could exert pressure on Freight rates
High levels of iron ore inventory could    The Dry Bulk Segment accounts for 66% of the total cargo volume transported by sea.
exert presure on freight rates unless      The five principal commodities in this segment are iron ore, grain, coal,
construction related activity progresses   bauxite/alumina and phosphate, where iron ore and coal account for 40% of the
at a faster pace in China                  total dry bulk commodity of which China accounts for a substantial share. In CY2008,
                                           out of the 823mn tonnes of sea-borne iron ore trade, China's imports accounted for
                                           roughly 53% of the same. In CY2009, China's total dry bulk imports increased by
                                           44%, with its iron ore imports growing from 444mn tonnes to 628mn tonnes and
                                           coal imports increasing from 40mn tonnes to 122mn tonnes during the period.
                                           Correspondingly, dry bulk imports fell by around 300mn tonnes for the rest of the
                                           world with Japan registering a fall of 80mn tonnes (17%), while European demand
                                           contracted by nearly 100mn tonnes (23%) for same period. The substantial increase
                                           in Chinese imports was supported by a couple of factors such as massive economic
                                           stimulus package, which created strong growth in demand for steel and energy, and
                                           low prices of raw materials, which provided great incentive to secure large volumes
                                           at bargain prices from the international market. This resulted in high inventory levels,
                                           which could impact Chinese imports in CY2010 and exert pressure on the freight
                                           rates unless construction related activity progresses at a faster pace in China.

                                           Exhibit 14: Increasing Iron Ore inventory remains a concern
                                                         80
                                                                                                    75       75       74
                                                         75
                                                                           71                                                                                                                72
                                                                                    70                                             70
                                                               69                                                                                                                70
                                                         70                                                                                             67              68
                                           (mn tonnes)


                                                                                                                                               67

                                                         65

                                                         60

                                                         55

                                                         50
                                                               Apr-09


                                                                                    Jun-09


                                                                                                    Jul-09


                                                                                                                                                                        Jan-10
                                                                           May-09


                                                                                                             Aug-09


                                                                                                                         Sep-09


                                                                                                                                               Nov-09


                                                                                                                                                        Dec-09


                                                                                                                                                                                 Feb-10


                                                                                                                                                                                                 Mar-10
                                                                                                                                   Oct-09


                                           Source: Bloomberg, Angel Research


                                           More cancellations in the pipeline
The total Dry Bulk Order Book currently    The cancelled tonnage for 2009 represents only around 10% of the ships actually
stands at approx 58.5% of the existing     delivered, for 2010 deliveries (which now include many vessels postponed from 2009),
fleet, which could in crease supply side   the total percentage only rises to 12.5%. We expect more cancellations to come to
pressures                                  light in the current year as private deals struck between ship-owners and shipbuilding
                                           partners emerge, unlike deferments that kept the market healthy in CY2009.

                                           Exhibit 15: Bulk Orders cancelled this far per Delivery Year
                                                         160
                                                                                                                 12.5%
                                                         140

                                                         120                                                                            8.3%
                                                         100
                                           (mn dwt)


                                                          80
                                                                                             9.7%
                                                          60                                                                                                     2.4%

                                                          40            0.9%
                                                          20                                                                                                                              2.6%

                                                           0
                                                                    CY08                 CY09                     CY10                  CY11                 CY12                     CY13

                                                                                                             On Order             Cancelled
                                           Source: BRS, Angel Research

April 28, 2010                                                                                                                                                                                            8
GE Shipping | Company Update


                                                                             Favourable time spot mix reduces volatility

In FY2010, major portion of revenue                                          Gesco has maintained a good mix between time and spot deployment to maximize
was in favour of time charter owing to                                       earnings and at the same time mitigated risks arising out of freight rate volatility. In
high volatility in freight                                                   FY2010 major portion of revenue was in favor of time charter owing to high amount
                                                                             of volatility in freight. The management has indicated to continue trend over next few
                                                                             quarters in favor of time charters as uncertainty still prevails in freights. In 3QFY2010,
                                                                             the management had covered 60% and 40% of operating days for tanker and dry
                                                                             bulk segment respectively.

Exhibit 16: Mix of time and voyage charter for Tanker and Dry Bulk Segments
                                                 Tanker                                                                                                          Dry Bulk
            100                                                                                                      100
             90                                                                                                        90
                                                                                                                                                                   28               26           26
             80                                    42                                                                  80             45             42
                                                                   49                                                                                                                                           46
             70          58          58                                             58            60                   70
             60                                                                                                        60
                                                                                                          (%)
 (%)


             50                                                                                                        50
             40                                                                                                        40
                                                                                                                                                                   72               74           74
             30                                    58                                                                  30             55             58
                                                                   51                                                                                                                                           54
             20          42          42                                             42            40                   20
             10                                                                                                        10
              0                                                                                                            0
                     FY07          FY08           FY09           1QFY10        2QFY10        3QFY10                                   FY07      FY08              FY09          1QFY10       2QFY10        3QFY10
                                                        Spot     Time                                                                                                   Spot    Time

Source: Company, Angel Research

                                                                             Second-hand prices to remain firm

We expect second-hand asset prices to                                        The number of second-hand tanker sales fell from about 300 in 2008 to about 170
pick up post 2HFY2011E                                                       in 2009. The average value for double-hull tanker vessels fell by 25% during CY2009
                                                                             or about 50% since the peak mid-2008. For 2010, we expect fewer transactions at
                                                                             least through the first half of CY2010 due to buyers betting on deteriorating market
                                                                             conditions. Later in 2010, we expect some owners to start struggling with too much
                                                                             debt and not enough revenue, which will kick off industry consolidation and
                                                                             restructuring on a larger scale. Consequently, we expect second-hand asset prices to
                                                                             pick up post 2HFY2011E.

Exhibit 17: Five-year Tanker and Dry Bulk asset prices fell by 25% and 65% yoy respectively, in CY2009
                                                 Tanker                                                                                                     Bulk Carriers
            160                                                                                                      160

            140                                                                                                      140

            120                                                                                                      120

            100                                                                                                      100
 (US $mn)


                                                                                                          (US $mn)


            80                                                                                                       80

            60                                                                                                       60

            40                                                                                                       40

            20                                                                                                       20

             0                                                                                                        0
                  CY00    CY01   CY02     CY03   CY04     CY05    CY06      CY07    CY08   CY09   CY10E                        CY00    CY01   CY02        CY03   CY04    CY05      CY06   CY07    CY08   CY09    CY10E

                                  MR Product      Aframax         Suezmax          VLcc                                                          Handymax                Panamax           capesize

Source: RS Platou, Angel Research


April 28, 2010                                                                                                                                                                                                           9
GE Shipping | Company Update


                                            Relatively younger fleet

The average age of GE Shipping's fleet      The average age of GE Shipping's fleet is around 10.9 years, which is relatively young
is around 10.9 years, which is relatively   given that most vessels have a life of 25 years. The company has applied depreciation
young given that most vessels have a        on an accelerated basis for the vessels that will need to be phased out by FY2010 as
life of 25 years                            per the MARPOL regulations. In the Offshore Segment, offshore assets such as platform
                                            supply vessels and anchor handling tugs are relatively young and hence, the company
                                            could earn better rates on such assets.

                                            Exhibit 18: Gesco current fleet and average age
                                             20                                                  19                                                          19.0

                                             18
                                             16
                                                                                                                            13.6
                                             14
                                             12                11                         10.6
                                                       10.1
                                             10
                                               8
                                                                                                                                   6
                                               6
                                               4
                                               2                                                                                                                       1

                                               0
                                                     Crude Carriers                     Product tankers                    Bulk carriers                    Gas Carriers
                                                                                                 Age Profile (years)           Number of Vessels

                                            Source: Company, Angel Research


                                            Offshore business gaining momentum

Gesco's Offshore Division Revenues are      Gesco's Offshore Division Revenues are expected to increase from 6.6% in FY2009 to
expected to increase from 6.6% in           38.3% in FY2012E driven by the addition of eight new Offshore Supply Vessels (OSV).
FY2009 to 38.3% in FY2012E driven           Going ahead, this would further diversify the company’s Revenue stream as well as
by the addition of eight new OSVs           lower Earnings volatility. On the other hand, enhanced capex by the oil & gas
                                            companies, which is expected to increase by 10% CAGR over the next two years, will
                                            strengthen the offshore freight rates. Further, with the Offshore Division stabilising,
                                            we expect Gesco’s Offshore EBIT Margins to improve from current levels of 21% to
                                            30% in FY2012E.

Exhibit 19: Offshore Operating Days to drive Revenues                 Exhibit 20: Share of Offshore Revenues increasing
         9,000
                                                                                1,600                                                                                        45
                                                                                                                                                                     38.3
         8,000                                         7,700
                                                                                1,400                                                                                        40
         7,000                                                                                                                                      34.1
                                                                                                                                       28.7                                  35
                                            6,222                               1,200
         6,000                    5,402                                                                                                                                      30
                                                                                1,000
                                                                                                                                                                             25
                                                                      (Rs cr)


         5,000
(Days)


                                                                                                                                                                                  (%)


                                                                                 800
                                                                                                                                                                             20
         4,000           3,390                                                   600
                                                                                                                                                                             15
         3,000                                                                   400                                 6.6                                                     10
         2,000                                                                   200                    3.4
                 1,226                                                                                                                                                       5
                                                                                           1.0
         1,000                                                                     0                                                                                         0
                                                                                          FY07           FY08           FY09         FY10E          FY11E            FY12E
            -
                                                                                                      Offshore revenue (LHS)       % of consolidated Revenue (RHS)
                 FY08    FY09     FY10E     FY11E      FY12E

Source: Company, Angel Research                                       Source: Company, Angel Research


April 28, 2010                                                                                                                                                                   10
GE Shipping | Company Update


                                           Ageing fleets and higher exploration to drive Offshore vessel market

Around 48% of the AHTSV and 65% of         Around 48% of the Anchor Handling Tug Supply Vessels (AHTSV) and 65% of the
the OSV fleet is more than 25 years        Offshore Vessels (OSV) fleet is more than 25 years old and is due for immediate
old and is due for immediate               replacement. This is expected to keep the freight rates firm. The search for new
replacement, which will keep the freight   hydrocarbon reserves has pushed the boundaries of technology, to facilitate new
rates firm                                 discoveries in deeper water and harsher environment. As per the Ocean Shipping
                                           Consultants (OSC), in a Base Case scenario, offshore oil production is forecast to
                                           increase from an estimated 25m bbls/day in 2007 to 30m bbls/day by 2010 and to
                                           42m bbls/day by 2020. This equates to a rise in output of approximately 62%.
                                           Consequently, the AHTS fleet is forecast to increase from the current 1,448 vessels to
                                           approximately 1,850 vessels by 2015, and potentially to over 2,000 vessels by 2020.
                                           In case of the Platform Supply Vessel (PSV) fleet, it is expected to increase from 457
                                           vessels to 760 vessels by 2015, and to 840 vessels by 2020. Going ahead, we continue
                                           to remain optimistic about the offshore support vessel market.

                                           Exhibit 21: Vessel-wise age profile
                                                 60

                                                 50

                                                 40
                                           (%)


                                                 30

                                                 20

                                                 10

                                                 0
                                                         <5          5-10    10-15       15-20      20-25
                                                                                                      -        25-30       > 30
                                                                     AHTS       OSV         PSV       AHT        MSV
                                           Source: BRS, Angel Research


                                           Focus on E&P activity to rebound

The global offshore spend is set to        Decline in oil and gas reserves, high energy security concerns on consumer countries
              CAGR
increase at a CA GR of 10.3% over          agenda, development and drilling activity in mid-to-deep water is expected to increase
CY2009-13E on the back of the global       the focus on E&P activity by the oil majors. Further, the high oil prices will also press
recovery and higher oil prices             the need for reserve accretion, which will increase focus on exploration efforts. As per
                                           Douglas-Westwood (D-W), spend on offshore exploration activities registered a CAGR
                                           of 14.6% during CY2004-08. However, following the global slowdown, the E&P
                                           activities were curtailed globally during the two years, but is estimated to witness
                                           strong rebound aided by global recovery and higher oil prices. D-W estimates the
                                           global offshore spend to register a CAGR of 10.3% over CY2009-13E.


April 28, 2010                                                                                                                    11
GE Shipping | Company Update


                 Exhibit 22: Global Offshore Spend
                            400

                            350                                                                    335
                                                                                           293
                            300                                                    268
                                                    230     242            235
                            250                                    226


                 (US $bn)
                            200               185
                                        160
                                  140
                            150

                            100

                            50

                             0
                            CY04    CY05    CY06    CY07    CY08   CY09   CY10E   CY11E   CY12E   CY13E
                 Source: Douglas-Westwood, Angel Research

                 Exploring Rig Segment
                 The demand for offshore rigs is dependent on crude oil E&P activity. In India, seven
                 bidding rounds of the New Exploration licensing Policy (NELP) this far awarded 203
                 blocks, of which 71 oil and gas discoveries have already been made in 19 exploration
                 blocks. The NELP-VIII round launched recently along with the fourth round for Coal
                 Bed Methane blocks (CBM-IV) offers the highest ever number of 70 oil and gas
                 exploration blocks and 10 blocks under CBM-IV. The NELP-VIII would offer 24 deep
                 water blocks, 28 shallow water blocks and 18 on-land blocks resulting in substantial
                 scope for the vessels catering to the Offshore Segment.

                 GIL owns a 350ft jack-up rig, which has been chartered to ONGC for five years for
                 US $164,000/day. It has also leased a jack-up rig from Mercator Lines and chartered
                 the same for three years.

                 GIL IPO will unlock value
                 Gesco proposes to list its 100% subsidiary, GIL, by end FY2011E through fresh equity
                 issuance. In our view, the listing could unlock the potential value of the Offshore
                 business, which globally trades at higher multiples than the Shipping business due to
                 better stability and high visibility in Earnings. Moreover, we believe that the Division
                 might further expand capacity on better capital structure post the listing, which would
                 enable it to acquire assets especially new rigs. Consequently, this would spur Revenue
                 and Earnings growth. We have valued Gesco's Offshore business at 6.5x FY2012E
                 EV/EBIDTA in line with the global peers and fetches Rs133/share or Rs2,021cr.


April 28, 2010                                                                                        12
GE Shipping | Company Update


                                     Financial Outlook
                                     New vessels and higher freight rates to drive revenues

We expect consolidated Revenues to   We expect the company's Shipping Segment Revenues to register 8.0% CAGR over
     CAGR
post CAGR of 16.8% over FY2010-12E   FY2010-12E to Rs2,360cr driven by addition of five new vessels in the Dry Bulk Segment
to Rs3,874cr                         in FY2011E and sustainable freight rates on account of slippages and removal of
                                     single hull tankers. We expect the Offshore Segment to register 34.8% CAGR in Revenue
                                     to Rs1,483cr during the mentioned period driven by induction of the eight new OSVs
                                     and higher freight rates following heightened E&P activity. Consequently, consolidated
                                     Revenues are expected to post CAGR of 16.8% over FY2010-12E to Rs3,874cr.

                                     Exhibit 23: Revenue Trend
                                               4,500                                                                                                      50
                                                                                  44.5
                                               4,000                                                                                                      40
                                               3,500                                                                                                      30
                                                                                                                                              28.5
                                               3,000                                             21.4                                                     20
                                               2,500
                                     (Rs cr)


                                                                                                                                                                 (%)
                                                                                                                                                          10
                                               2,000            6.4                                                          6.1
                                                                                                                                                          0
                                               1,500
                                                                                                                                                          (10)
                                               1,000

                                                   500                                                                                                    (20)
                                                                                                            -25.3
                                                    0                                                                                                     (30)
                                                            FY07               FY08         FY09        FY10E            FY11E           FY12E
                                                                Tanker (LHS)          Dry Bulk (LHS)    Offshore (LHS)             chg yoy (RHS)

                                     Source: Company, Angel Research

                                     Offshore Segment to drive Operating Margins

We expect core EBITD A Margins to
               EBITDA                We expect core EBITDA Margins to improve by 1,360bp to 37.2% over FY2010-12E
improve by 1,360bp to 37.2% over     on the back of stabilisation of the company's Offshore business and increase in
FY2010-12E                           Revenues. Our day rate forecasts have been fairly conservative over FY2010-12E,
                                     and growth in the Offshore business has been driven more by an increase in Operating
                                     days rather than an increase in Day rates.

                                     Exhibit 24: EBITDA Trend
                                        (%)
                                        60

                                                         49.3
                                        50
                                                                          44.3
                                                                                             41.6
                                        40                                                                                                         37.2
                                                                                                                             32.7
                                        30
                                                                                                          23.6

                                        20


                                        10


                                               0
                                                         FY07            FY08               FY09         FY10E              FY11E                  FY12E

                                     Source: Company, Angel Research


April 28, 2010                                                                                                                                                   13
GE shipping  company update-28-04-10

More Related Content

What's hot

Coal india offer for sale-141010
Coal india offer for sale-141010Coal india offer for sale-141010
Coal india offer for sale-141010Angel Broking
 
Indraprastha Gas Ltd.- Company Update-June 22, 2010
Indraprastha Gas Ltd.- Company Update-June 22, 2010Indraprastha Gas Ltd.- Company Update-June 22, 2010
Indraprastha Gas Ltd.- Company Update-June 22, 2010Angel Broking
 
Indraprastha Gas Ltd.- Company Update-June 22, 2010
Indraprastha Gas Ltd.- Company Update-June 22, 2010Indraprastha Gas Ltd.- Company Update-June 22, 2010
Indraprastha Gas Ltd.- Company Update-June 22, 2010Angel Broking
 
Nestle 1QCY2010 Result Update
Nestle 1QCY2010 Result UpdateNestle 1QCY2010 Result Update
Nestle 1QCY2010 Result UpdateAngel Broking
 
Crompton greaves ru4 qfy2010-180510
Crompton greaves ru4 qfy2010-180510Crompton greaves ru4 qfy2010-180510
Crompton greaves ru4 qfy2010-180510Angel Broking
 
Polyplex Corporation
Polyplex CorporationPolyplex Corporation
Polyplex CorporationAngel Broking
 
Shoppers stop result update 4 qfy2010 040510
Shoppers stop result update 4 qfy2010 040510Shoppers stop result update 4 qfy2010 040510
Shoppers stop result update 4 qfy2010 040510Angel Broking
 
Investment Idea - BPCL : Recommended as "Sell"
Investment Idea  - BPCL : Recommended as "Sell"Investment Idea  - BPCL : Recommended as "Sell"
Investment Idea - BPCL : Recommended as "Sell"
Fullerton Securities
 
Investment Idea - POLYPLEX CORPORATION LTD - "BUY"
Investment Idea - POLYPLEX CORPORATION LTD - "BUY"Investment Idea - POLYPLEX CORPORATION LTD - "BUY"
Investment Idea - POLYPLEX CORPORATION LTD - "BUY"
Fullerton Securities
 
Concor Result Update
Concor Result UpdateConcor Result Update
Concor Result UpdateAngel Broking
 
All cargo result update 1 qcy2010 050510
All cargo result update 1 qcy2010 050510All cargo result update 1 qcy2010 050510
All cargo result update 1 qcy2010 050510Angel Broking
 
Electrosteel castings
Electrosteel castingsElectrosteel castings
Electrosteel castingsAngel Broking
 
Bayer India- Result Update
Bayer India- Result UpdateBayer India- Result Update
Bayer India- Result UpdateAngel Broking
 

What's hot (20)

Coal india offer for sale-141010
Coal india offer for sale-141010Coal india offer for sale-141010
Coal india offer for sale-141010
 
HCC
HCCHCC
HCC
 
Indraprastha Gas Ltd.- Company Update-June 22, 2010
Indraprastha Gas Ltd.- Company Update-June 22, 2010Indraprastha Gas Ltd.- Company Update-June 22, 2010
Indraprastha Gas Ltd.- Company Update-June 22, 2010
 
Indraprastha Gas Ltd.- Company Update-June 22, 2010
Indraprastha Gas Ltd.- Company Update-June 22, 2010Indraprastha Gas Ltd.- Company Update-June 22, 2010
Indraprastha Gas Ltd.- Company Update-June 22, 2010
 
Nestle 1QCY2010 Result Update
Nestle 1QCY2010 Result UpdateNestle 1QCY2010 Result Update
Nestle 1QCY2010 Result Update
 
Crompton greaves ru4 qfy2010-180510
Crompton greaves ru4 qfy2010-180510Crompton greaves ru4 qfy2010-180510
Crompton greaves ru4 qfy2010-180510
 
Spicejet IC -030510
Spicejet IC -030510Spicejet IC -030510
Spicejet IC -030510
 
Kesoram Rayons
Kesoram RayonsKesoram Rayons
Kesoram Rayons
 
RIL Result Update
RIL Result UpdateRIL Result Update
RIL Result Update
 
Polyplex Corporation
Polyplex CorporationPolyplex Corporation
Polyplex Corporation
 
Shoppers stop result update 4 qfy2010 040510
Shoppers stop result update 4 qfy2010 040510Shoppers stop result update 4 qfy2010 040510
Shoppers stop result update 4 qfy2010 040510
 
NMDC
NMDCNMDC
NMDC
 
Investment Idea - BPCL : Recommended as "Sell"
Investment Idea  - BPCL : Recommended as "Sell"Investment Idea  - BPCL : Recommended as "Sell"
Investment Idea - BPCL : Recommended as "Sell"
 
Investment Idea - POLYPLEX CORPORATION LTD - "BUY"
Investment Idea - POLYPLEX CORPORATION LTD - "BUY"Investment Idea - POLYPLEX CORPORATION LTD - "BUY"
Investment Idea - POLYPLEX CORPORATION LTD - "BUY"
 
Concor Result Update
Concor Result UpdateConcor Result Update
Concor Result Update
 
Colgate Palmolive
Colgate PalmoliveColgate Palmolive
Colgate Palmolive
 
All cargo result update 1 qcy2010 050510
All cargo result update 1 qcy2010 050510All cargo result update 1 qcy2010 050510
All cargo result update 1 qcy2010 050510
 
Aurobindo Pharma
Aurobindo Pharma Aurobindo Pharma
Aurobindo Pharma
 
Electrosteel castings
Electrosteel castingsElectrosteel castings
Electrosteel castings
 
Bayer India- Result Update
Bayer India- Result UpdateBayer India- Result Update
Bayer India- Result Update
 

Viewers also liked

Market Outlook - September 15, 2010
Market Outlook - September 15, 2010Market Outlook - September 15, 2010
Market Outlook - September 15, 2010Angel Broking
 
Technical Report- June 22, 2010
Technical Report- June 22, 2010Technical Report- June 22, 2010
Technical Report- June 22, 2010Angel Broking
 
Tech report 05.10.2010
Tech report 05.10.2010Tech report 05.10.2010
Tech report 05.10.2010Angel Broking
 
Derivatives Report 31 Mar
Derivatives Report 31 MarDerivatives Report 31 Mar
Derivatives Report 31 MarAngel Broking
 
Technical Report - August 4,2010
Technical Report - August 4,2010Technical Report - August 4,2010
Technical Report - August 4,2010Angel Broking
 
Prestige Estates Projects - IPO note
Prestige Estates Projects - IPO notePrestige Estates Projects - IPO note
Prestige Estates Projects - IPO noteAngel Broking
 
Mid- Cap Steel - Sector Report
Mid- Cap Steel - Sector ReportMid- Cap Steel - Sector Report
Mid- Cap Steel - Sector ReportAngel Broking
 
Market outlook 28 04-10
Market outlook 28 04-10Market outlook 28 04-10
Market outlook 28 04-10Angel Broking
 
Market outlook 17 08-10
Market outlook 17 08-10Market outlook 17 08-10
Market outlook 17 08-10Angel Broking
 
Technical report - August 20, 2010
Technical report - August 20, 2010Technical report - August 20, 2010
Technical report - August 20, 2010Angel Broking
 

Viewers also liked (15)

Market Outlook - September 15, 2010
Market Outlook - September 15, 2010Market Outlook - September 15, 2010
Market Outlook - September 15, 2010
 
Sun TV
Sun TVSun TV
Sun TV
 
Technical Report- June 22, 2010
Technical Report- June 22, 2010Technical Report- June 22, 2010
Technical Report- June 22, 2010
 
Tech report 05.10.2010
Tech report 05.10.2010Tech report 05.10.2010
Tech report 05.10.2010
 
Derivatives Report 31 Mar
Derivatives Report 31 MarDerivatives Report 31 Mar
Derivatives Report 31 Mar
 
Technical Report - August 4,2010
Technical Report - August 4,2010Technical Report - August 4,2010
Technical Report - August 4,2010
 
Prestige Estates Projects - IPO note
Prestige Estates Projects - IPO notePrestige Estates Projects - IPO note
Prestige Estates Projects - IPO note
 
JK Tyre
JK TyreJK Tyre
JK Tyre
 
Mid- Cap Steel - Sector Report
Mid- Cap Steel - Sector ReportMid- Cap Steel - Sector Report
Mid- Cap Steel - Sector Report
 
Bank of India
Bank of India Bank of India
Bank of India
 
Market outlook 28 04-10
Market outlook 28 04-10Market outlook 28 04-10
Market outlook 28 04-10
 
Market outlook 17 08-10
Market outlook 17 08-10Market outlook 17 08-10
Market outlook 17 08-10
 
JK Lakshmi
JK LakshmiJK Lakshmi
JK Lakshmi
 
Technical report - August 20, 2010
Technical report - August 20, 2010Technical report - August 20, 2010
Technical report - August 20, 2010
 
Cairn India
Cairn IndiaCairn India
Cairn India
 

Similar to GE shipping company update-28-04-10

Bajaj auto ru4 qfy2010-140510
Bajaj auto ru4 qfy2010-140510Bajaj auto ru4 qfy2010-140510
Bajaj auto ru4 qfy2010-140510Angel Broking
 
Concor ru2 qfy2011-201010
Concor ru2 qfy2011-201010Concor ru2 qfy2011-201010
Concor ru2 qfy2011-201010Angel Broking
 
Crompton greaves ru4 qfy2010-180510
Crompton greaves ru4 qfy2010-180510Crompton greaves ru4 qfy2010-180510
Crompton greaves ru4 qfy2010-180510Angel Broking
 
Concor -Result Update
Concor -Result UpdateConcor -Result Update
Concor -Result UpdateAngel Broking
 
Igl ru4 qfy2010-260510
Igl ru4 qfy2010-260510Igl ru4 qfy2010-260510
Igl ru4 qfy2010-260510Angel Broking
 
Spice jet ru4qfy2010-030610
Spice jet  ru4qfy2010-030610Spice jet  ru4qfy2010-030610
Spice jet ru4qfy2010-030610Angel Broking
 
Grasim Result Update 4qfy2010 - 210510
Grasim Result Update 4qfy2010 - 210510Grasim Result Update 4qfy2010 - 210510
Grasim Result Update 4qfy2010 - 210510Angel Broking
 
Grasim ru4 qfy2010-210510
Grasim ru4 qfy2010-210510Grasim ru4 qfy2010-210510
Grasim ru4 qfy2010-210510Angel Broking
 
Cccl ru4 qfy2010-100510
Cccl  ru4 qfy2010-100510Cccl  ru4 qfy2010-100510
Cccl ru4 qfy2010-100510Angel Broking
 

Similar to GE shipping company update-28-04-10 (20)

GSPL
GSPLGSPL
GSPL
 
GSPL
GSPLGSPL
GSPL
 
GSPL
GSPLGSPL
GSPL
 
Bajaj auto ru4 qfy2010-140510
Bajaj auto ru4 qfy2010-140510Bajaj auto ru4 qfy2010-140510
Bajaj auto ru4 qfy2010-140510
 
Concor ru2 qfy2011-201010
Concor ru2 qfy2011-201010Concor ru2 qfy2011-201010
Concor ru2 qfy2011-201010
 
Crompton greaves ru4 qfy2010-180510
Crompton greaves ru4 qfy2010-180510Crompton greaves ru4 qfy2010-180510
Crompton greaves ru4 qfy2010-180510
 
Concor -Result Update
Concor -Result UpdateConcor -Result Update
Concor -Result Update
 
Igl ru4 qfy2010-260510
Igl ru4 qfy2010-260510Igl ru4 qfy2010-260510
Igl ru4 qfy2010-260510
 
Spice jet ru4qfy2010-030610
Spice jet  ru4qfy2010-030610Spice jet  ru4qfy2010-030610
Spice jet ru4qfy2010-030610
 
Blue Star
Blue StarBlue Star
Blue Star
 
Gujarat Gas
Gujarat GasGujarat Gas
Gujarat Gas
 
Grasim Result Update 4qfy2010 - 210510
Grasim Result Update 4qfy2010 - 210510Grasim Result Update 4qfy2010 - 210510
Grasim Result Update 4qfy2010 - 210510
 
Grasim ru4 qfy2010-210510
Grasim ru4 qfy2010-210510Grasim ru4 qfy2010-210510
Grasim ru4 qfy2010-210510
 
Fag y2010-220410
Fag y2010-220410Fag y2010-220410
Fag y2010-220410
 
SpiceJet
SpiceJetSpiceJet
SpiceJet
 
Exide
Exide Exide
Exide
 
Allcargo
AllcargoAllcargo
Allcargo
 
CCCl
CCClCCCl
CCCl
 
ONGC
ONGCONGC
ONGC
 
Cccl ru4 qfy2010-100510
Cccl  ru4 qfy2010-100510Cccl  ru4 qfy2010-100510
Cccl ru4 qfy2010-100510
 

More from Angel Broking

Market outlook 110612
Market outlook 110612Market outlook 110612
Market outlook 110612Angel Broking
 
Axis%20 bank ru1qfy2012-220711
Axis%20 bank ru1qfy2012-220711Axis%20 bank ru1qfy2012-220711
Axis%20 bank ru1qfy2012-220711Angel Broking
 
Derivative report 19th July 2011
Derivative report 19th July 2011Derivative report 19th July 2011
Derivative report 19th July 2011Angel Broking
 
Market outlook 19th July 2011
Market outlook 19th July 2011Market outlook 19th July 2011
Market outlook 19th July 2011Angel Broking
 
Weekly Report 18th July 2011
Weekly Report 18th July 2011Weekly Report 18th July 2011
Weekly Report 18th July 2011Angel Broking
 
Derivative Report 18th July 2011
Derivative Report 18th July 2011Derivative Report 18th July 2011
Derivative Report 18th July 2011Angel Broking
 
Technical Report 18th July 2011
Technical Report 18th July 2011Technical Report 18th July 2011
Technical Report 18th July 2011Angel Broking
 
Market Outlook 18th July 2011
Market Outlook 18th July 2011Market Outlook 18th July 2011
Market Outlook 18th July 2011Angel Broking
 
Bajaj auto Result Updated
Bajaj auto Result UpdatedBajaj auto Result Updated
Bajaj auto Result UpdatedAngel Broking
 
Tata consultancy services
Tata consultancy services Tata consultancy services
Tata consultancy services Angel Broking
 
Derivatives Report 15th July 2011
Derivatives Report 15th July 2011Derivatives Report 15th July 2011
Derivatives Report 15th July 2011Angel Broking
 
Technical Report 15th July 2011
Technical Report 15th July 2011Technical Report 15th July 2011
Technical Report 15th July 2011Angel Broking
 
Infosys Result Updated
Infosys Result UpdatedInfosys Result Updated
Infosys Result UpdatedAngel Broking
 
Derivative Report 13th July 2011
Derivative Report 13th July 2011Derivative Report 13th July 2011
Derivative Report 13th July 2011Angel Broking
 
Technical Report 13th July 2011
Technical Report 13th July 2011Technical Report 13th July 2011
Technical Report 13th July 2011Angel Broking
 

More from Angel Broking (20)

Market outlook 110612
Market outlook 110612Market outlook 110612
Market outlook 110612
 
Axis%20 bank ru1qfy2012-220711
Axis%20 bank ru1qfy2012-220711Axis%20 bank ru1qfy2012-220711
Axis%20 bank ru1qfy2012-220711
 
Persistent systems
Persistent systemsPersistent systems
Persistent systems
 
Ht media
Ht mediaHt media
Ht media
 
Derivative report 19th July 2011
Derivative report 19th July 2011Derivative report 19th July 2011
Derivative report 19th July 2011
 
Market outlook 19th July 2011
Market outlook 19th July 2011Market outlook 19th July 2011
Market outlook 19th July 2011
 
Telecom sector
Telecom sectorTelecom sector
Telecom sector
 
Weekly Report 18th July 2011
Weekly Report 18th July 2011Weekly Report 18th July 2011
Weekly Report 18th July 2011
 
Derivative Report 18th July 2011
Derivative Report 18th July 2011Derivative Report 18th July 2011
Derivative Report 18th July 2011
 
Technical Report 18th July 2011
Technical Report 18th July 2011Technical Report 18th July 2011
Technical Report 18th July 2011
 
Market Outlook 18th July 2011
Market Outlook 18th July 2011Market Outlook 18th July 2011
Market Outlook 18th July 2011
 
South Indian Bank
 South Indian Bank South Indian Bank
South Indian Bank
 
Bajaj auto Result Updated
Bajaj auto Result UpdatedBajaj auto Result Updated
Bajaj auto Result Updated
 
Tata consultancy services
Tata consultancy services Tata consultancy services
Tata consultancy services
 
Fc4 e63c4d01
Fc4 e63c4d01Fc4 e63c4d01
Fc4 e63c4d01
 
Derivatives Report 15th July 2011
Derivatives Report 15th July 2011Derivatives Report 15th July 2011
Derivatives Report 15th July 2011
 
Technical Report 15th July 2011
Technical Report 15th July 2011Technical Report 15th July 2011
Technical Report 15th July 2011
 
Infosys Result Updated
Infosys Result UpdatedInfosys Result Updated
Infosys Result Updated
 
Derivative Report 13th July 2011
Derivative Report 13th July 2011Derivative Report 13th July 2011
Derivative Report 13th July 2011
 
Technical Report 13th July 2011
Technical Report 13th July 2011Technical Report 13th July 2011
Technical Report 13th July 2011
 

GE shipping company update-28-04-10

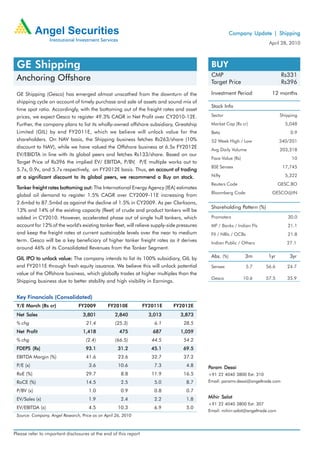
  • 1. Company Update | Shipping April 28, 2010 GE Shipping BUY CMP Rs331 Anchoring Offshore Target Price Rs396 GE Shipping (Gesco) has emerged almost unscathed from the downturn of the Investment Period 12 months shipping cycle on account of timely purchase and sale of assets and sound mix of Stock Info time spot ratio. Accordingly, with the bottoming out of the freight rates and asset prices, we expect Gesco to register 49.3% CAGR in Net Profit over CY2010-12E. Sector Shipping Further, the company plans to list its wholly-owned offshore subsidiary, Greatship Market Cap (Rs cr) 5,048 Limited (GIL) by end FY2011E, which we believe will unlock value for the Beta 0.9 shareholders. On NAV basis, the Shipping business fetches Rs263/share (10% 52 Week High / Low 340/201 discount to NAV), while we have valued the Offshore business at 6.5x FY2012E Avg Daily Volume 203,318 EV/EBIDTA in line with its global peers and fetches Rs133/share. Based on our Face Value (Rs) 10 Target Price of Rs396 the implied EV/ EBITDA, P/BV, P/E multiple works out to BSE Sensex 17,745 5.7x, 0.9x, and 5.7x respectively, on FY2012E basis. Thus, on account of trading at a significant discount to its global peers, we recommend a Buy on stock. Nifty 5,322 Reuters Code GESC.BO Tanker freight rates bottoming out: The International Energy Agency (IEA) estimates Bloomberg Code GESCO@IN global oil demand to register 1.5% CAGR over CY2009-11E increasing from 2.6mbd to 87.5mbd as against the decline of 1.5% in CY2009. As per Clarksons, Shareholding Pattern (%) 13% and 14% of the existing capacity (fleet) of crude and product tankers will be added in CY2010. However, accelerated phase out of single hull tankers, which Promoters 30.0 account for 12% of the world's existing tanker fleet, will relieve supply-side pressures MF / Banks / Indian FIs 21.1 and keep the freight rates at current sustainable levels over the near to medium FII / NRIs / OCBs 21.8 term. Gesco will be a key beneficiary of higher tanker freight rates as it derives Indian Public / Others 27.1 around 46% of its Consolidated Revenues from the Tanker Segment. GIL IPO to unlock value: The company intends to list its 100% subsidiary, GIL by Abs. (%) 3m 1yr 3yr end FY2011E through fresh equity issuance. We believe this will unlock potential Sensex 5.7 56.6 24.7 value of the Offshore business, which globally trades at higher multiples than the Gesco 10.6 57.5 35.9 Shipping business due to better stability and high visibility in Earnings. Key Financials (Consolidated) Y/E March (Rs cr) FY2009 FY2010E FY2011E FY2012E Net Sales 3,801 2,840 3,013 3,873 % chg 21.4 (25.3) 6.1 28.5 Profit Net Profit 1,418 475 687 1,059 % chg (2.4) (66.5) 44.5 54.2 FDEPS (Rs) 93.1 31.2 45.1 69.5 EBITDA Margin (%) 41.6 23.6 32.7 37.2 P/E (x) 3.6 10.6 7.3 4.8 Param Desai RoE (%) 29.7 8.8 11.9 16.5 +91 22 4040 3800 Ext: 310 RoCE (%) 14.5 2.5 5.0 8.7 Email: paramv.desai@angeltrade.com P/BV (x) 1.0 0.9 0.8 0.7 EV/Sales (x) 1.9 2.4 2.2 1.8 Mihir Salot +91 22 4040 3800 Ext: 307 EV/EBITDA (x) 4.5 10.3 6.9 5.0 Email: mihirr.salot@angeltrade.com Source: Company, Angel Research, Price as on April 26, 2010 Please refer to important disclosures at the end of this report
  • 2. GE Shipping | Company Update Valuation Shipping Business valued at Rs263/share The Shipping business is cyclical in nature. Hence, it is difficult to predict the Earnings given volatility in the freight rates. Hence, we have valued Gesco on the sum-of-the- parts methodology. We have valued the Shipping business on NAV basis taking into account three parameters, viz, size, age and type (ie., whether single or double hull). We have assigned 10% discount to NAV on a conservative basis though we believe the asset prices have bottomed out. Further, we believe that the decline in NAV through the reduction in asset prices would be mitigated by an increase in tonnage. We have thus arrived at an NAV of Rs263/share (10% discount to NAV) for the Shipping Division. Exhibit 1: Shipping Division Valuation Particulars Value ( Rs cr) Tanker Segment - A 3,108 Dry Bulk Segment - B 649 NAV- discounted @ 10% (A + B) NAV 3,757 Less Debt 3,487 Add Cash 3,214 Add Advances 525 Total 4,009 NAV/share (Rs) NAV/share 263 Source: Company, Angel Research Offshore business valued at Rs133/share Gesco intends to add another eight offshore vessels over the next two years, which would spur Revenue growth. In our view, the listing could unlock the potential value of the Offshore business, which globally trades at higher multiples than the Shipping business due to better stability and high visibility in Earnings. Moreover, we believe that the company might further expand capacity with better capital structure post listing of Offshore Division, which would enable it to acquire assets, especially new rigs. Consequently, this would further spur Revenue and Earnings growth while providing Earnings visibility. We have valued the Off-shore Division at 6.5x EV/EBIDTA in line with the global peers. Consequently, the Offshore Division fetches Rs133/share. Exhibit 2: Offshore Division Valuation Particulars Value (Rs cr) FY2012E EBIDTA 593 Target multiple -EV/EBIDTA (x) 6.5 EV 3,856 Less Debt 2,099 Add Cash 264 Target Mkt cap 2,021 Value (Rs/share) 133 Source: Company, Angel Research Trading at discount to Peers Based on our Target Price of Rs396, the implied EV/ EBITDA, P/BV, P/E multiple works out to 5.7x, 0.8x, and 5.7x respectively, on FY2012E basis. Thus, Gesco is trading at a significant discount to its global peers. April 28, 2010 2
  • 3. GE Shipping | Company Update Exhibit 3: Global Peer Valuation Market Cap P/E (x) P/B (x) EV/EBITDA (x) EV/EBITDA EV/Sales (x) RoE (%) Tankers USD Mn CY10E CY11E CY10E CY11E CY10E CY11E CY10E CY11E CY10E CY11E Teekay 526 15.1 12.0 1.7 1.9 11.2 9.9 6.3 6.3 14.2 16.8 Frontline 2,833 15.2 14.8 3.5 3.5 9.6 9.7 5.1 5.1 22.4 22.9 Overseas Shipholding 1,538 98.9 24.6 0.8 0.8 12.0 9.2 2.5 2.5 0.6 3.3 Ship Finance International 1,594 8.8 9.3 1.7 1.7 8.1 7.2 9.1 9.1 27.5 20.4 Tsakos Energy 569 19.1 10.2 0.6 0.6 9.8 8.5 4.3 4.3 4.6 4.6 Average 31.4 14.2 1.7 1.7 10.1 8.9 5.5 5.5 13.9 13.6 Dry Bulk China Cosco Holding 17,042 47.2 25.7 2.6 2.4 15.6 14.3 1.7 1.7 2.8 6.0 China Shipping Development 5,536 17.6 12.7 1.6 1.4 11.2 8.5 3.2 3.2 9.1 10.9 Stx Pan Ocean 2,490 26.7 10.9 1.2 1.1 16.5 9.1 0.6 0.6 4.9 9.6 Cosco Shipping 1,841 29.3 14.8 2.6 2.3 13.1 9.7 1.9 1.9 7.9 15.1 Pacific Basin 1,483 14.9 12.7 1.0 1.0 8.1 7.1 1.5 1.5 6.9 8.0 Diana Shipping 1,258 9.8 10.3 1.1 1.0 7.0 7.1 5.0 5.0 11.1 9.5 Average 24.3 14.5 1.7 1.5 11.9 9.3 2.3 2.3 7.1 9.9 Offshore Transocean 30,134 10.0 8.5 1.3 1.2 7.3 6.6 3.4 3.4 13.2 15.1 Diamond Offshore 11,901 10.3 10.0 3.0 2.8 6.0 5.8 3.3 3.3 30.8 31.3 Nabors Industries 6,436 21.3 13.6 1.2 1.1 6.8 5.7 2.1 2.1 5.2 8.2 Pride International 5,864 18.4 10.1 1.3 1.1 11.3 6.6 3.0 3.0 6.9 11.9 Rowan Companies 3,700 13.2 16.3 1.1 1.0 6.4 6.9 2.1 2.1 8.8 7.6 Aban Offshore* 1,198 11.9 5.7 2.1 1.6 10.4 7.8 4.8 4.8 20.9 32.2 China Oilfield Services 8,824 12.3 10.9 1.7 1.5 10.3 9.0 4.0 4.0 15.3 15.5 Average 14.0 10.7 1.7 1.5 8.4 6.9 3.2 3.2 14.5 17.4 GE Shipping* 1,149 7.3 4.8 0.8 0.7 6.9 5.0 2.2 1.8 11.9 16.5 Source: Bloomberg, Angel Research; Note: * Y/E March; Prices as on April 26, 2010 Exhibit 4: Gesco’s 1yr forward P/BV 1.8 1.6 1.4 1.2 Trading at discount to its four year average 1 (x) 0.8 0.6 0.4 0.2 0 April-06 April-07 April-08 April-09 April-10 Source: Bloomberg, Angel Research April 28, 2010 3
  • 4. GE Shipping | Company Update Exhibit 5: GE Shipping Fleet Details Sr no. Vessels Name Dwt Hull Age Market Value (US $mn) Crude Carriers 1 Suezmax Jag Lalit 158,344 DH 5 61.0 2 Suezmax Jag Lok 158,280 DH 5 61.0 3 Suezmax Jag Laskhya 152,485 SH 21 8.0 4 Suezmax Jag Lateef 147,092 DH 10 45.0 5 Suezmax Jag Lakshita 147,092 DH 10 45.0 6 Aframax Jag Lyall 110,531 DH 4 51.0 7 Aframax Jag Lamha 98,214 SH 23 7.5 8 Aframax Jag Laxmi 105,051 DH 11 15.0 9 Aframax Jag Leela 105,148 DH 11 15.0 10 Aframax Jag Lata 105,716 DH 7 35.0 11 Aframax Jag Lavanya 105,010 DH 6 35.0 Product Tankers Tankers 12 LR1 Jag Amisha 74,868 DH 1 45.0 13 LR1 Jag Aparna 74,868 DH 1 45.0 14 LR1 Jag Aabha 74,868 DH 2 45.0 15 LR1 Jag Aanchal 74,868 DH 2 45.0 16 MR Jag Pranam 50,600 SH 26 4.0 17 MR Jag Pavitra 50,600 SH 25 4.0 18 MR Jag Pahel 46,319 DH 6 25.0 19 MR Jag Pankhi 46,345 DH 7 25.0 20 MR Jag Pradip 45,684 DH 14 5.0 21 MR Jag Pratap 45,683 DH 15 5.0 22 MR Jag Prakash 47,848 DH 3 35.0 23 MR Jag Prerana 46,348 DH 3 35.0 24 MR Jag Pushpa 47,400 DH 3 35.0 25 MR Jag Padma 47,000 DH 14 25.0 26 GP Jag Preeti 29,139 DH 29 3.0 27 GP Jag Pari 29,139 DH 28 3.0 28 GP Jag Palak 27,402 SH 25 3.0 29 GP Jag Pragati 27,400 SH 25 3.0 30 GP Jag Parwar 29,998 SH 22 3.0 31 Gas Carriers Jag Viraj 17,577 19 4.5 Bulk Carriers 32 Supramax Jag Rahul 52,364 SH 7 35.0 33 Supramax Jag Ratan 52,180 SH 9 35.0 34 Capesize Jag Arjun 164,796 SH 14 32.0 35 Panamax Jag Arnav 71,122 SH 15 25.0 36 Handymax Jag Ravi 45,342 SH 13 20.0 37 Handysize Jag Vikram 27,463 SH 30 15.0 Total 2,740,184 938 Source: Company, Angel Research April 28, 2010 4
  • 5. GE Shipping | Company Update Investment Arguments Tanker freight rates bottoming out The International Energy Agency (IEA) estimates global oil demand to post 1.5% CAGR over CY2009-11E increasing from 2.6mbd to 87.5mbd as against the decline of 1.5% in CY2009. As per Clarksons, 13% and 14% of the current existing capacity (fleet) of crude and product tankers will be added in CY2010. However, accelerated phase out of single hull tankers, which currently account for 12% of the world's existing tanker fleet, will relieve supply side pressures and keep freight rates at the current sustainable levels over the near to medium term. Tanker freight rates hinge on Oil consumption and New deliveries The world economy, oil consumption, floating storage, slippages & scrapping and delivery of new buildings are some of the important factors that impact the demand for tanker fleets. Exhibit 6: Drivers of Tanker Fleet Global Economy Scrapping New & Deliveries Slippages Demand for Tanker Fleet Oil Floating Demand Storage Source: Angel Research Demand for oil will drive freight rates As per IEA forecasts, crude oil demand Crude oil production in the last few years has been driven by consumption in the should grow by 1.7% in CY2010E to non-OECD countries (developing nations) owing to the greater energy requirements 86.3mbd and 1.6% in C2011E to in these faster growing nations, and is likely to keep demand high in the long term. 87.5mbd as against the decline of As per IEA, all incremental demand is expected to be derived from the non-OECD 1.5% in CY2009 countries, which will overtake the OECD nations and are expected to account for 51% of the world's oil demand by 2014 from current levels of 46%. In the last decade, China's crude oil consumption almost doubled and currently the country consumes 10.0% of the total world crude consumption. As per IEA forecasts, crude oil demand should grow by 1.6% in CY2010E to 86.3m bbls/per day and 1.4% in C2011E to 87.5mbd as against the decline of 1.5% in CY2009. Exhibit 7: Demand for oil Demand Scenario (m bbls/day) 2008 2009 2010 2011 2012 2013 2014 OECD 47.6 45.5 45.5 45.4 45.2 45 44.8 Non-OECD 38.6 39.3 40.8 42.1 43.4 44.8 46.0 World 86.2 84.9 86.3 87.5 88.7 89.8 90.9 yoy chg (%) (1.5) 1.6 1.4 1.4 1.2 1.2 Global GDP (yoy %chg) 2.9 (1.2) 3.1 4.2 4.4 4.5 4.5 Source: IEA April 28, 2010 5
  • 6. GE Shipping | Company Update Slippages and Scrapping key to Tanker freight rates We expect a major portion of the The sharp drop in sea-borne oil trade during the global economic crisis along with single-hull single-hull tankers (55mn dwt), ie. 12% 7% growth in fleet should have led to a decline in the rates for tankers in most part of of the world tanker fleet, to get CY2009. But, it did not happen because 20mn dwt of the fleet or 5% were used as oil removed from active trading in storage vessels. In CY2009, 9mn dwt or 18% of the scheduled deliveries were not CY2010 in line with the IMO standards delivered. The total Tanker Order Book size currently stands at 30.7% (134.1mn dwt) of the existing fleet of which 14.6% (64mn dwt) is expected to come up in 2010. We expect actual deliveries to be significantly lower than 64mn dwt on account of slippages and scrapping. A major portion of the single-hull tankers will be removed from active trading (55mn dwt) ie. 12% of the world tanker fleet in 2010 in line with the IMO standards. Hence, we expect net addition of moderate 7-8% of tanker fleet, which should keep the freight rates firm in the near term and gradually move up from 2HFY2011E onwards. Exhibit 8: Slippages to be a decisive factor Product Crude & Product Carriers (mn dwt) VLCC Suezmax Aframax Panamax MR GP Total Order Book as on Jan 1, 2009 20.8 10.9 11.9 4.1 10.6 2.1 60.5 Actual Deliveries CY2009 16.7 7.1 10.5 2.8 7.2 1.4 45.9 Slippages/ Cancellations mn dwt 4.1 3.8 1.4 1.3 3.4 0.7 14.6 % of Order Book as on Jan 1, 2009 19.7 34.9 11.8 31.7 32.1 33.3 24.1 Source: Company, Clarksons Exhibit 9: Single hull scrapping crucial Exhibit 10: Scrapping Details Particulars (mn dwt) CY2010E CY2011E Category Fleet size Scrapping Existing fleet as on Jan 1, 2010 437.5 471.5 (mn dwt) 01.02.10 CY08 CY09 2010 YTD Add New deliveries in CY2010 64 48.2 Crude Carriers 313.3 1.3 5.1 1.2 Less Scrapping 15 25 Product Carriers 125.8 1.5 3.3 0.7 Less Slippages 15 0 Source: Company, Clarksons Fleet as at Y/E Dec 471.5 494.7 12% of World Net Fleet Addition (%) 7.8 4.9 tanker fleet single hull Source: BRS, Angel Research Increase in Tonnage Miles Tonnage carried per dead weight tonne (DWT) has declined due to faster growth in global tonnage as against growth in total cargo. However, tonnage miles per DWT have been increasing, which signifies that ships are carrying similar cargo over longer distances now. We believe that tonnage miles have further potential to increase as patterns of trade movement between countries are changing and there are more shipments to the Asian countries such as China and India, which involve longer distances. There is an additional global refinery capacity of 8.7mb/d of which 75% is expected to come from Asia over 2008-2014E. Growth continues to be dominated by China at 2.9mb/d, Other Asia at 2.1mb/d and the Middle East at 1.5mb/d. Thus, higher crude volume will move from the Atlantic to the Pacific Basin with products moving the other way. This is a positive for the long haul tanker tonne-mile demand. April 28, 2010 6
  • 7. GE Shipping | Company Update Correlation with Tanker Indices The Baltic Dirty Tanker and Clean Index has risen by around 100% from the bottom in April 2009, but still lower by around 55% from the peak. On the other hand, Gesco’s stock price has risen by 75% during the same period. Given IEA forecast of oil consumption, IMO regulation of scrapping single hull vessels by CY2010 and slippages, the positive trend in freight rates could well be captured by the indices and have a bearing on Gesco’s stock price going forward. We expect the tanker rates to remain firm in the near term and rise from 2HFY2011E onwards. Exhibit 11: Gesco share price v/s Crude tanker index Exhibit 12: Gesco share price v/s Product tanker index 300 300 250 250 200 200 150 150 100 100 50 50 0 0 Jan-07 Mar-07 May-07 Jul-07 Jan-08 Mar-08 May-08 Jul-08 Jan-09 Mar-09 May-09 Jul-09 Jan-10 Mar-10 Nov-06 Sep-07 Nov-07 Sep-08 Nov-08 Sep-09 Nov-09 Mar-07 Jul-07 Sep-07 Mar-08 Jul-08 Sep-08 Mar-09 Jul-09 Sep-09 Mar-10 Nov-06 Jan-07 Nov-07 Jan-08 Nov-08 Jan-09 Nov-09 Jan-10 May-07 May-08 May-09 GE Shipping Baltic Dirty Tanker Index GE Shipping Baltic Clean Tanker Index Source: Bloomberg, Angel Research Source: Bloomberg, Angel Research Dry Bulk Segment hinges on China's consumption and New Deliveries The volumes of new building deliveries, The Baltic Dry Index (BDI) rebounded by an impressive 288% yoy in CY2009 fuelled China's economic growth and the trend by low commodity prices, deferred new buildings, back loaded order book and Chinese in the global market prices of iron ore demand much to a positive surprise. Going forward, volumes of new building and coal will determine the demand deliveries, China's economic growth and the trend in the global market prices of iron for dry bulk fleet ore and coal will determine the demand for dry bulk fleet. We believe that the freight rates for the Dry Bulk Segment will remain under pressure in the near term unless construction related activity progresses at a faster pace in China, and higher slippages leading to substantial decrease in supply. Exhibit 13: Gesco share price v/s BDI 300 250 200 150 100 50 0 Mar-07 Jul-07 Sep-07 Mar-08 Jul-08 Sep-08 Mar-09 Jul-09 Sep-09 Mar-10 Nov-06 Jan-07 May-07 Nov-07 Jan-08 May-08 Nov-08 Jan-09 May-09 Nov-09 Jan-10 GE Shipping Baltic Dry Index Source: Bloomberg, Angel Research April 28, 2010 7
  • 8. GE Shipping | Company Update High iron ore inventory could exert pressure on Freight rates High levels of iron ore inventory could The Dry Bulk Segment accounts for 66% of the total cargo volume transported by sea. exert presure on freight rates unless The five principal commodities in this segment are iron ore, grain, coal, construction related activity progresses bauxite/alumina and phosphate, where iron ore and coal account for 40% of the at a faster pace in China total dry bulk commodity of which China accounts for a substantial share. In CY2008, out of the 823mn tonnes of sea-borne iron ore trade, China's imports accounted for roughly 53% of the same. In CY2009, China's total dry bulk imports increased by 44%, with its iron ore imports growing from 444mn tonnes to 628mn tonnes and coal imports increasing from 40mn tonnes to 122mn tonnes during the period. Correspondingly, dry bulk imports fell by around 300mn tonnes for the rest of the world with Japan registering a fall of 80mn tonnes (17%), while European demand contracted by nearly 100mn tonnes (23%) for same period. The substantial increase in Chinese imports was supported by a couple of factors such as massive economic stimulus package, which created strong growth in demand for steel and energy, and low prices of raw materials, which provided great incentive to secure large volumes at bargain prices from the international market. This resulted in high inventory levels, which could impact Chinese imports in CY2010 and exert pressure on the freight rates unless construction related activity progresses at a faster pace in China. Exhibit 14: Increasing Iron Ore inventory remains a concern 80 75 75 74 75 71 72 70 70 69 70 70 67 68 (mn tonnes) 67 65 60 55 50 Apr-09 Jun-09 Jul-09 Jan-10 May-09 Aug-09 Sep-09 Nov-09 Dec-09 Feb-10 Mar-10 Oct-09 Source: Bloomberg, Angel Research More cancellations in the pipeline The total Dry Bulk Order Book currently The cancelled tonnage for 2009 represents only around 10% of the ships actually stands at approx 58.5% of the existing delivered, for 2010 deliveries (which now include many vessels postponed from 2009), fleet, which could in crease supply side the total percentage only rises to 12.5%. We expect more cancellations to come to pressures light in the current year as private deals struck between ship-owners and shipbuilding partners emerge, unlike deferments that kept the market healthy in CY2009. Exhibit 15: Bulk Orders cancelled this far per Delivery Year 160 12.5% 140 120 8.3% 100 (mn dwt) 80 9.7% 60 2.4% 40 0.9% 20 2.6% 0 CY08 CY09 CY10 CY11 CY12 CY13 On Order Cancelled Source: BRS, Angel Research April 28, 2010 8
  • 9. GE Shipping | Company Update Favourable time spot mix reduces volatility In FY2010, major portion of revenue Gesco has maintained a good mix between time and spot deployment to maximize was in favour of time charter owing to earnings and at the same time mitigated risks arising out of freight rate volatility. In high volatility in freight FY2010 major portion of revenue was in favor of time charter owing to high amount of volatility in freight. The management has indicated to continue trend over next few quarters in favor of time charters as uncertainty still prevails in freights. In 3QFY2010, the management had covered 60% and 40% of operating days for tanker and dry bulk segment respectively. Exhibit 16: Mix of time and voyage charter for Tanker and Dry Bulk Segments Tanker Dry Bulk 100 100 90 90 28 26 26 80 42 80 45 42 49 46 70 58 58 58 60 70 60 60 (%) (%) 50 50 40 40 72 74 74 30 58 30 55 58 51 54 20 42 42 42 40 20 10 10 0 0 FY07 FY08 FY09 1QFY10 2QFY10 3QFY10 FY07 FY08 FY09 1QFY10 2QFY10 3QFY10 Spot Time Spot Time Source: Company, Angel Research Second-hand prices to remain firm We expect second-hand asset prices to The number of second-hand tanker sales fell from about 300 in 2008 to about 170 pick up post 2HFY2011E in 2009. The average value for double-hull tanker vessels fell by 25% during CY2009 or about 50% since the peak mid-2008. For 2010, we expect fewer transactions at least through the first half of CY2010 due to buyers betting on deteriorating market conditions. Later in 2010, we expect some owners to start struggling with too much debt and not enough revenue, which will kick off industry consolidation and restructuring on a larger scale. Consequently, we expect second-hand asset prices to pick up post 2HFY2011E. Exhibit 17: Five-year Tanker and Dry Bulk asset prices fell by 25% and 65% yoy respectively, in CY2009 Tanker Bulk Carriers 160 160 140 140 120 120 100 100 (US $mn) (US $mn) 80 80 60 60 40 40 20 20 0 0 CY00 CY01 CY02 CY03 CY04 CY05 CY06 CY07 CY08 CY09 CY10E CY00 CY01 CY02 CY03 CY04 CY05 CY06 CY07 CY08 CY09 CY10E MR Product Aframax Suezmax VLcc Handymax Panamax capesize Source: RS Platou, Angel Research April 28, 2010 9
  • 10. GE Shipping | Company Update Relatively younger fleet The average age of GE Shipping's fleet The average age of GE Shipping's fleet is around 10.9 years, which is relatively young is around 10.9 years, which is relatively given that most vessels have a life of 25 years. The company has applied depreciation young given that most vessels have a on an accelerated basis for the vessels that will need to be phased out by FY2010 as life of 25 years per the MARPOL regulations. In the Offshore Segment, offshore assets such as platform supply vessels and anchor handling tugs are relatively young and hence, the company could earn better rates on such assets. Exhibit 18: Gesco current fleet and average age 20 19 19.0 18 16 13.6 14 12 11 10.6 10.1 10 8 6 6 4 2 1 0 Crude Carriers Product tankers Bulk carriers Gas Carriers Age Profile (years) Number of Vessels Source: Company, Angel Research Offshore business gaining momentum Gesco's Offshore Division Revenues are Gesco's Offshore Division Revenues are expected to increase from 6.6% in FY2009 to expected to increase from 6.6% in 38.3% in FY2012E driven by the addition of eight new Offshore Supply Vessels (OSV). FY2009 to 38.3% in FY2012E driven Going ahead, this would further diversify the company’s Revenue stream as well as by the addition of eight new OSVs lower Earnings volatility. On the other hand, enhanced capex by the oil & gas companies, which is expected to increase by 10% CAGR over the next two years, will strengthen the offshore freight rates. Further, with the Offshore Division stabilising, we expect Gesco’s Offshore EBIT Margins to improve from current levels of 21% to 30% in FY2012E. Exhibit 19: Offshore Operating Days to drive Revenues Exhibit 20: Share of Offshore Revenues increasing 9,000 1,600 45 38.3 8,000 7,700 1,400 40 7,000 34.1 28.7 35 6,222 1,200 6,000 5,402 30 1,000 25 (Rs cr) 5,000 (Days) (%) 800 20 4,000 3,390 600 15 3,000 400 6.6 10 2,000 200 3.4 1,226 5 1.0 1,000 0 0 FY07 FY08 FY09 FY10E FY11E FY12E - Offshore revenue (LHS) % of consolidated Revenue (RHS) FY08 FY09 FY10E FY11E FY12E Source: Company, Angel Research Source: Company, Angel Research April 28, 2010 10
  • 11. GE Shipping | Company Update Ageing fleets and higher exploration to drive Offshore vessel market Around 48% of the AHTSV and 65% of Around 48% of the Anchor Handling Tug Supply Vessels (AHTSV) and 65% of the the OSV fleet is more than 25 years Offshore Vessels (OSV) fleet is more than 25 years old and is due for immediate old and is due for immediate replacement. This is expected to keep the freight rates firm. The search for new replacement, which will keep the freight hydrocarbon reserves has pushed the boundaries of technology, to facilitate new rates firm discoveries in deeper water and harsher environment. As per the Ocean Shipping Consultants (OSC), in a Base Case scenario, offshore oil production is forecast to increase from an estimated 25m bbls/day in 2007 to 30m bbls/day by 2010 and to 42m bbls/day by 2020. This equates to a rise in output of approximately 62%. Consequently, the AHTS fleet is forecast to increase from the current 1,448 vessels to approximately 1,850 vessels by 2015, and potentially to over 2,000 vessels by 2020. In case of the Platform Supply Vessel (PSV) fleet, it is expected to increase from 457 vessels to 760 vessels by 2015, and to 840 vessels by 2020. Going ahead, we continue to remain optimistic about the offshore support vessel market. Exhibit 21: Vessel-wise age profile 60 50 40 (%) 30 20 10 0 <5 5-10 10-15 15-20 20-25 - 25-30 > 30 AHTS OSV PSV AHT MSV Source: BRS, Angel Research Focus on E&P activity to rebound The global offshore spend is set to Decline in oil and gas reserves, high energy security concerns on consumer countries CAGR increase at a CA GR of 10.3% over agenda, development and drilling activity in mid-to-deep water is expected to increase CY2009-13E on the back of the global the focus on E&P activity by the oil majors. Further, the high oil prices will also press recovery and higher oil prices the need for reserve accretion, which will increase focus on exploration efforts. As per Douglas-Westwood (D-W), spend on offshore exploration activities registered a CAGR of 14.6% during CY2004-08. However, following the global slowdown, the E&P activities were curtailed globally during the two years, but is estimated to witness strong rebound aided by global recovery and higher oil prices. D-W estimates the global offshore spend to register a CAGR of 10.3% over CY2009-13E. April 28, 2010 11
  • 12. GE Shipping | Company Update Exhibit 22: Global Offshore Spend 400 350 335 293 300 268 230 242 235 250 226 (US $bn) 200 185 160 140 150 100 50 0 CY04 CY05 CY06 CY07 CY08 CY09 CY10E CY11E CY12E CY13E Source: Douglas-Westwood, Angel Research Exploring Rig Segment The demand for offshore rigs is dependent on crude oil E&P activity. In India, seven bidding rounds of the New Exploration licensing Policy (NELP) this far awarded 203 blocks, of which 71 oil and gas discoveries have already been made in 19 exploration blocks. The NELP-VIII round launched recently along with the fourth round for Coal Bed Methane blocks (CBM-IV) offers the highest ever number of 70 oil and gas exploration blocks and 10 blocks under CBM-IV. The NELP-VIII would offer 24 deep water blocks, 28 shallow water blocks and 18 on-land blocks resulting in substantial scope for the vessels catering to the Offshore Segment. GIL owns a 350ft jack-up rig, which has been chartered to ONGC for five years for US $164,000/day. It has also leased a jack-up rig from Mercator Lines and chartered the same for three years. GIL IPO will unlock value Gesco proposes to list its 100% subsidiary, GIL, by end FY2011E through fresh equity issuance. In our view, the listing could unlock the potential value of the Offshore business, which globally trades at higher multiples than the Shipping business due to better stability and high visibility in Earnings. Moreover, we believe that the Division might further expand capacity on better capital structure post the listing, which would enable it to acquire assets especially new rigs. Consequently, this would spur Revenue and Earnings growth. We have valued Gesco's Offshore business at 6.5x FY2012E EV/EBIDTA in line with the global peers and fetches Rs133/share or Rs2,021cr. April 28, 2010 12
  • 13. GE Shipping | Company Update Financial Outlook New vessels and higher freight rates to drive revenues We expect consolidated Revenues to We expect the company's Shipping Segment Revenues to register 8.0% CAGR over CAGR post CAGR of 16.8% over FY2010-12E FY2010-12E to Rs2,360cr driven by addition of five new vessels in the Dry Bulk Segment to Rs3,874cr in FY2011E and sustainable freight rates on account of slippages and removal of single hull tankers. We expect the Offshore Segment to register 34.8% CAGR in Revenue to Rs1,483cr during the mentioned period driven by induction of the eight new OSVs and higher freight rates following heightened E&P activity. Consequently, consolidated Revenues are expected to post CAGR of 16.8% over FY2010-12E to Rs3,874cr. Exhibit 23: Revenue Trend 4,500 50 44.5 4,000 40 3,500 30 28.5 3,000 21.4 20 2,500 (Rs cr) (%) 10 2,000 6.4 6.1 0 1,500 (10) 1,000 500 (20) -25.3 0 (30) FY07 FY08 FY09 FY10E FY11E FY12E Tanker (LHS) Dry Bulk (LHS) Offshore (LHS) chg yoy (RHS) Source: Company, Angel Research Offshore Segment to drive Operating Margins We expect core EBITD A Margins to EBITDA We expect core EBITDA Margins to improve by 1,360bp to 37.2% over FY2010-12E improve by 1,360bp to 37.2% over on the back of stabilisation of the company's Offshore business and increase in FY2010-12E Revenues. Our day rate forecasts have been fairly conservative over FY2010-12E, and growth in the Offshore business has been driven more by an increase in Operating days rather than an increase in Day rates. Exhibit 24: EBITDA Trend (%) 60 49.3 50 44.3 41.6 40 37.2 32.7 30 23.6 20 10 0 FY07 FY08 FY09 FY10E FY11E FY12E Source: Company, Angel Research April 28, 2010 13