Download to read offline
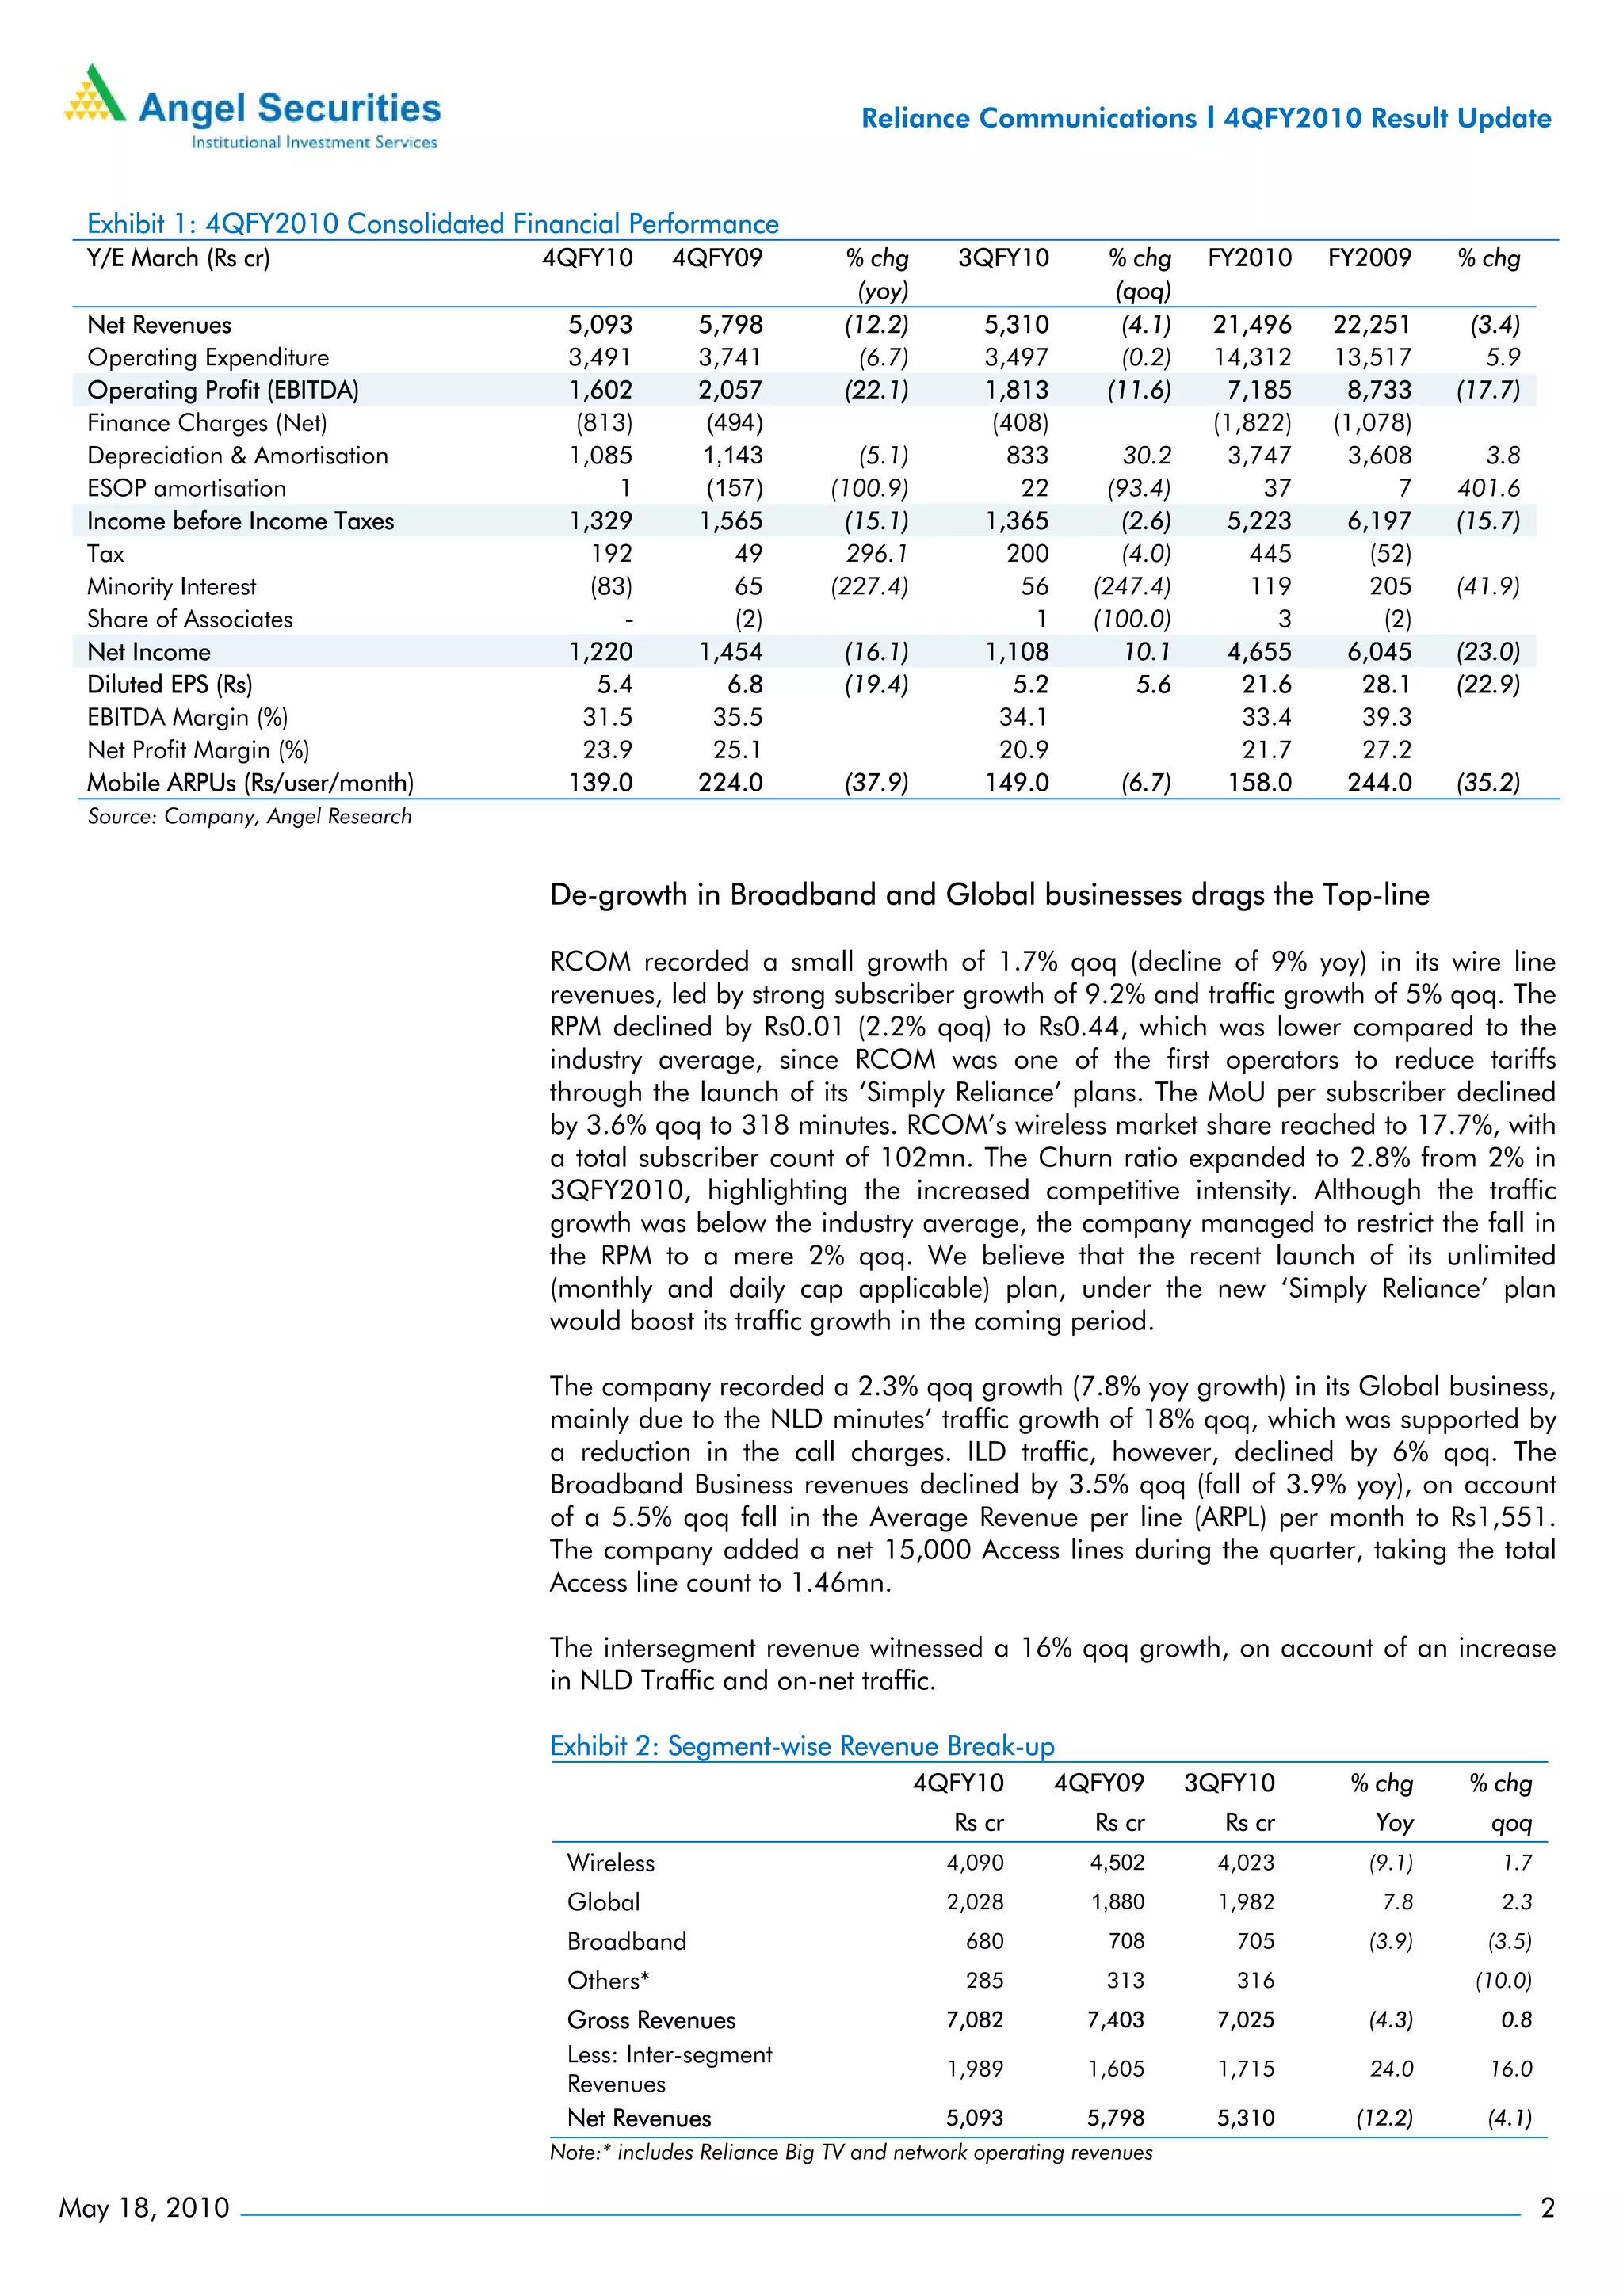

Reliance Communication's quarterly performance failed to meet expectations, with wireless revenue growing only 1.7% compared to the industry average. While the company surpassed 100 million subscribers, its broadband and global business segments saw declines. Profits grew 10.1% due to higher interest earned, but margins fell due to higher network and access costs. Going forward, profitability is expected to come under pressure from increased leverage for capex spending and acquiring 3G licenses.


