Downloaded 142 times


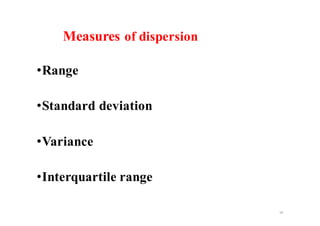

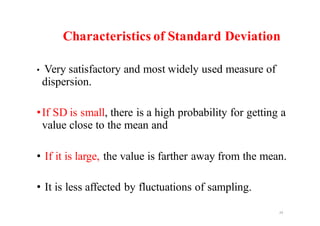

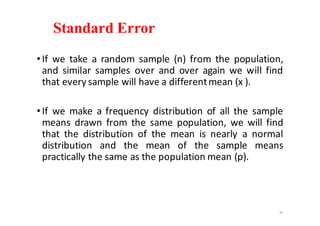
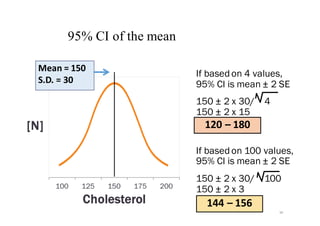
![Standard Deviation (SD) – for ‘Normal
distribution’
2.5 3.5 4.5
Birth Weight
[N]
29
Mean Birth-wt = 3.5 kg
Std Dev. = 1.0 kg
Mean ±1 SD
3.5 ±1kg
2.5 – 4.5 kg = 68%
Mean ± 2 SD
3.5 ±2 kg
1.5 – 5.5 kg = 95%
3.5
1.5 5.5
(kg)](https://image.slidesharecdn.com/summarizingdata-180731084658/85/Summarizing-data-29-320.jpg)
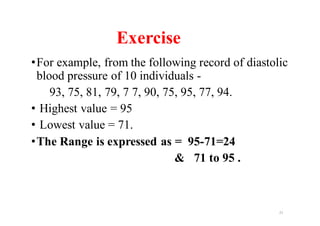
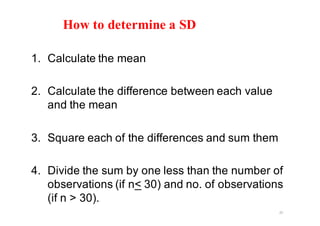
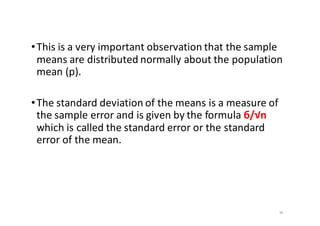
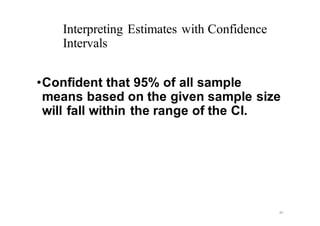
![Percentiles - for
non-normally distributed data
32
50 60 70 80 90 100 110 120
Diastolic BP
[N]
25% 25% 25% 25%
25th %-ile 50th %-ile
Ð Ï
75th %-ile
Ï
50th percentile is the
MEDIAN.
The 25th to the 75th
percentile is the
INTERQUARTILE
RANGE (IQR).
….% of data that fall below a specific value](https://image.slidesharecdn.com/summarizingdata-180731084658/85/Summarizing-data-32-320.jpg)
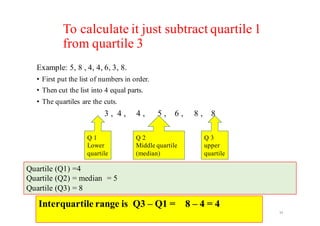
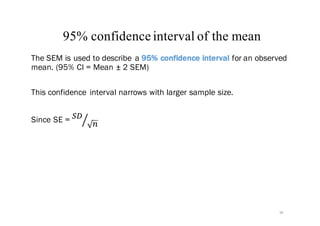
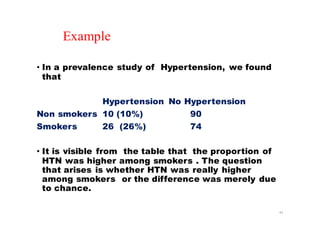
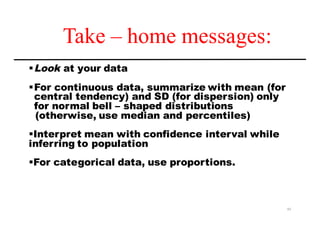


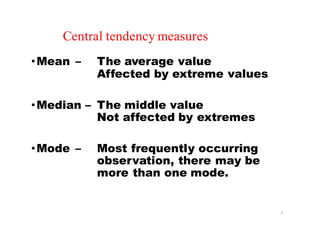
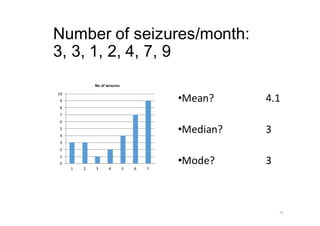
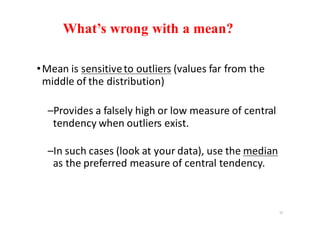
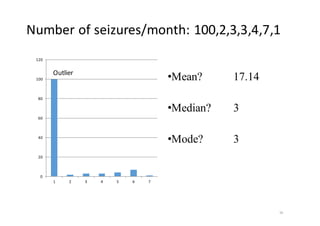
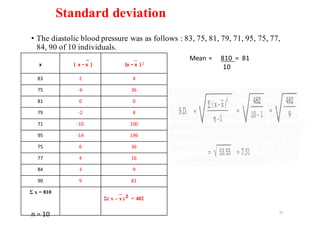
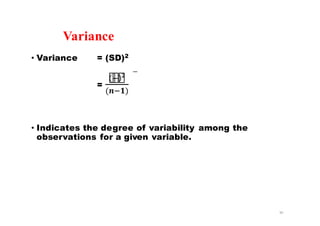
This document discusses various methods for summarizing data, including measures of central tendency, dispersion, and categorical data. It describes the mean, median, and mode as measures of central tendency, and how the mean can be affected by outliers while the median is not. Measures of dispersion mentioned include range, standard deviation, variance, and interquartile range. The document also discusses percentiles, standard error, and 95% confidence intervals. Key takeaways are to select appropriate summaries based on the data type and distribution.


![PERI-PROSTHETIC FRACTURE NAIL-PLATE CONSTRUCT [NPC].pptx](https://cdn.slidesharecdn.com/ss_thumbnails/drarunkumardrmohamedashrafperiprostheticfrasturenail-plateconstructnpc-260209164459-7e9d15a1-thumbnail.jpg?width=640&height=640&fit=bounds)