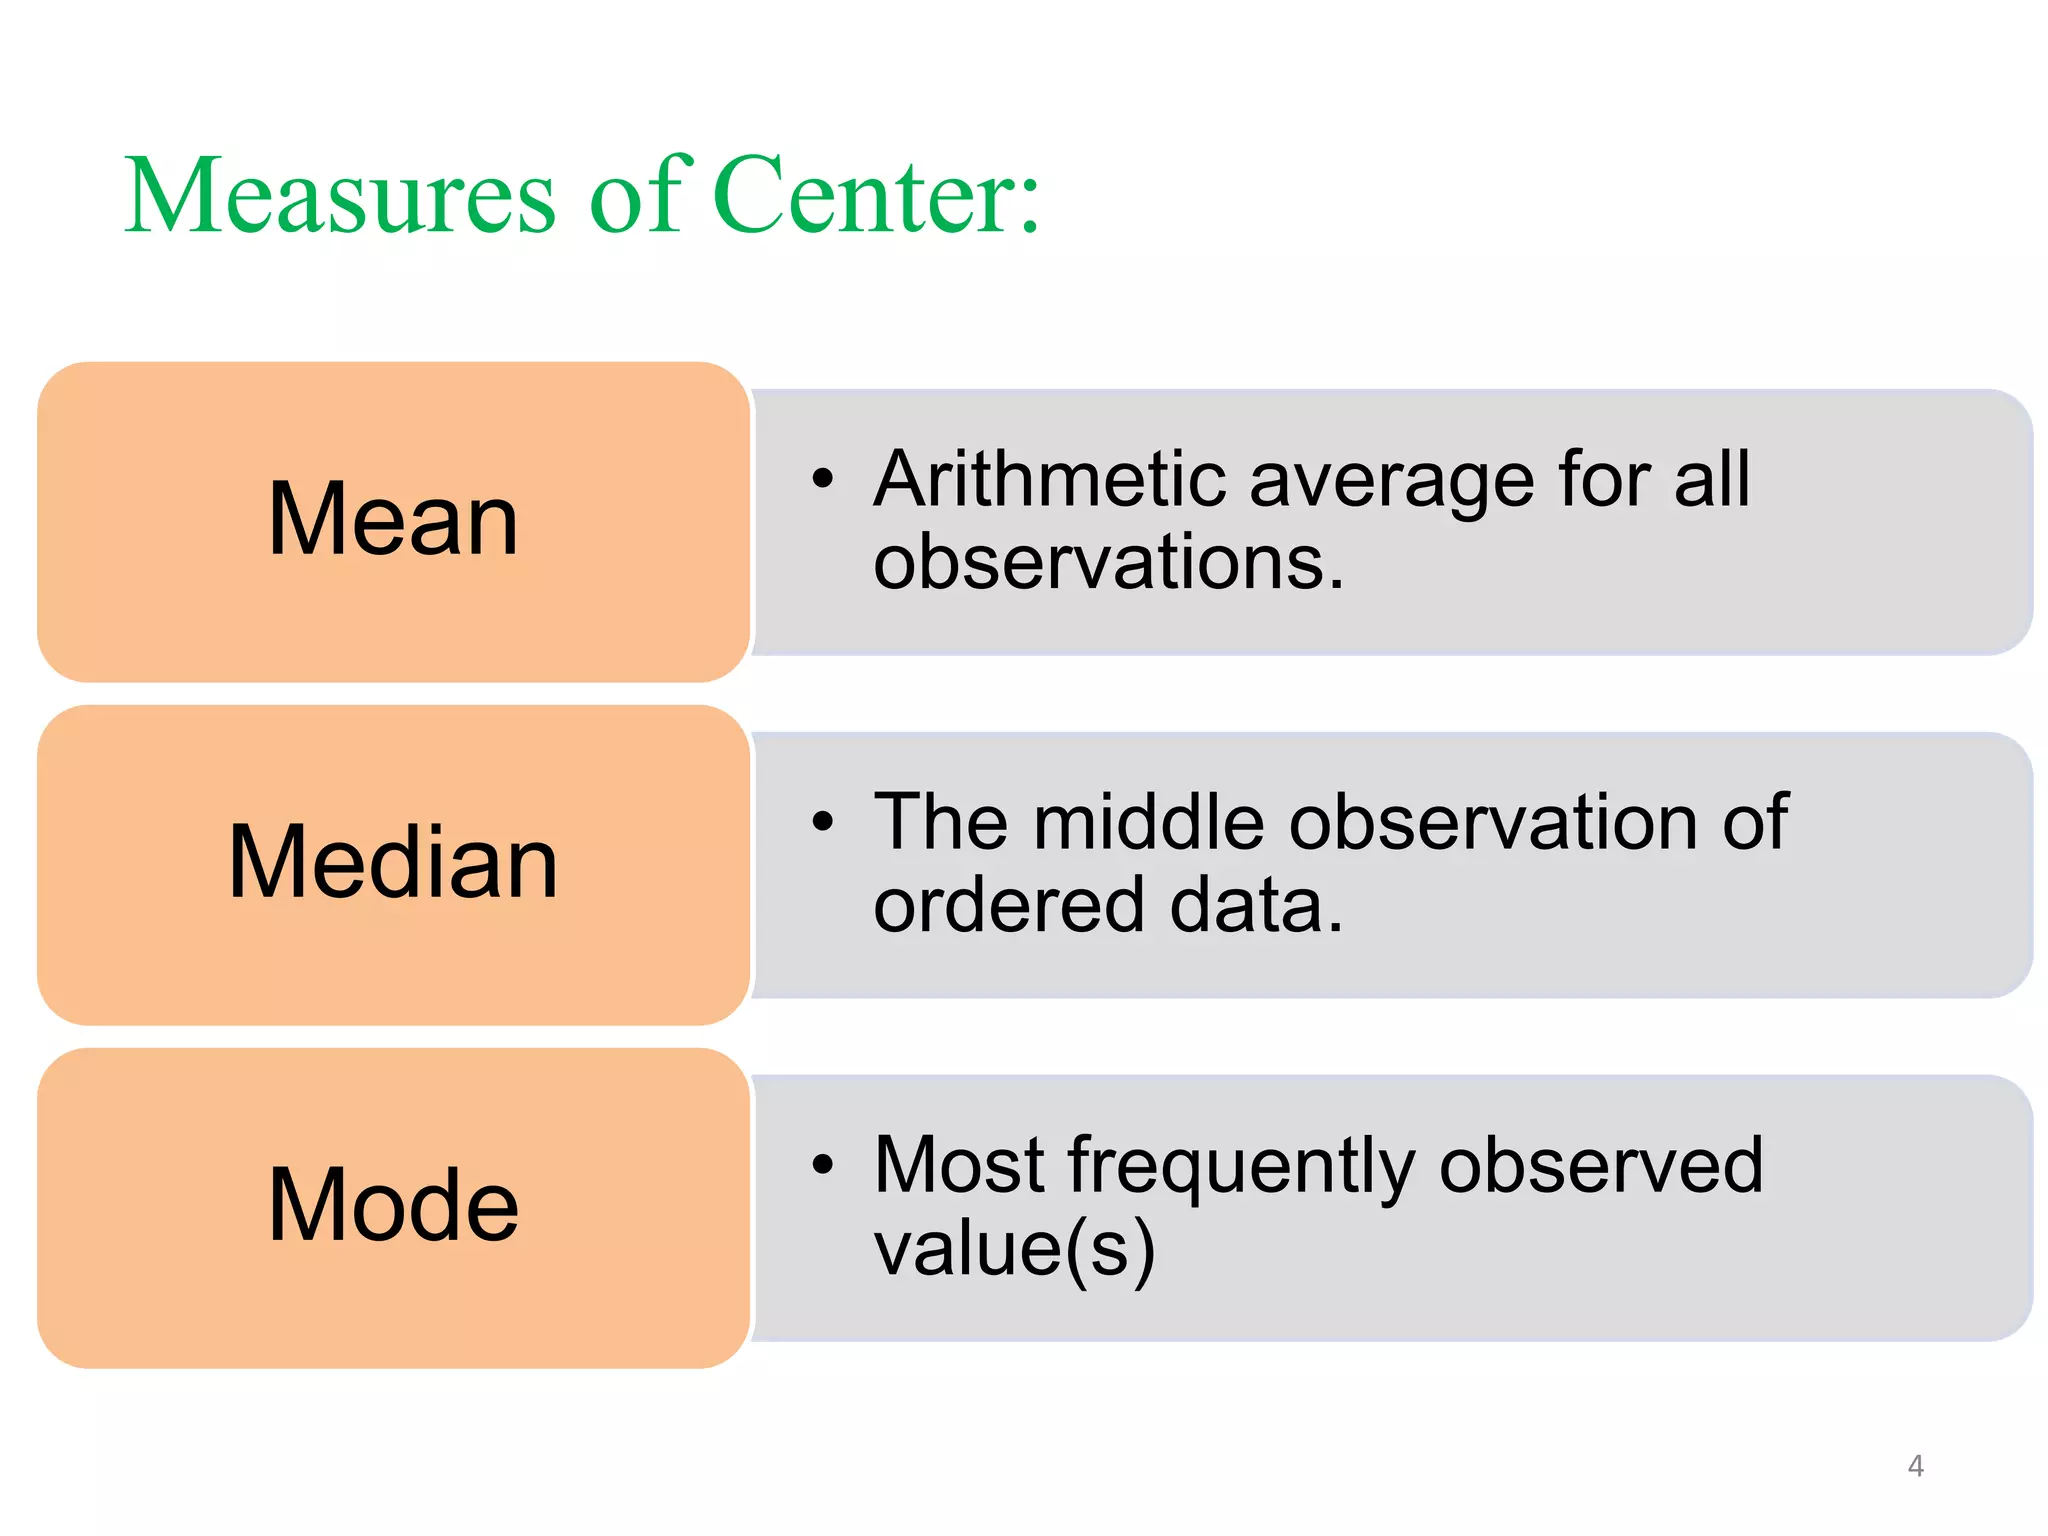
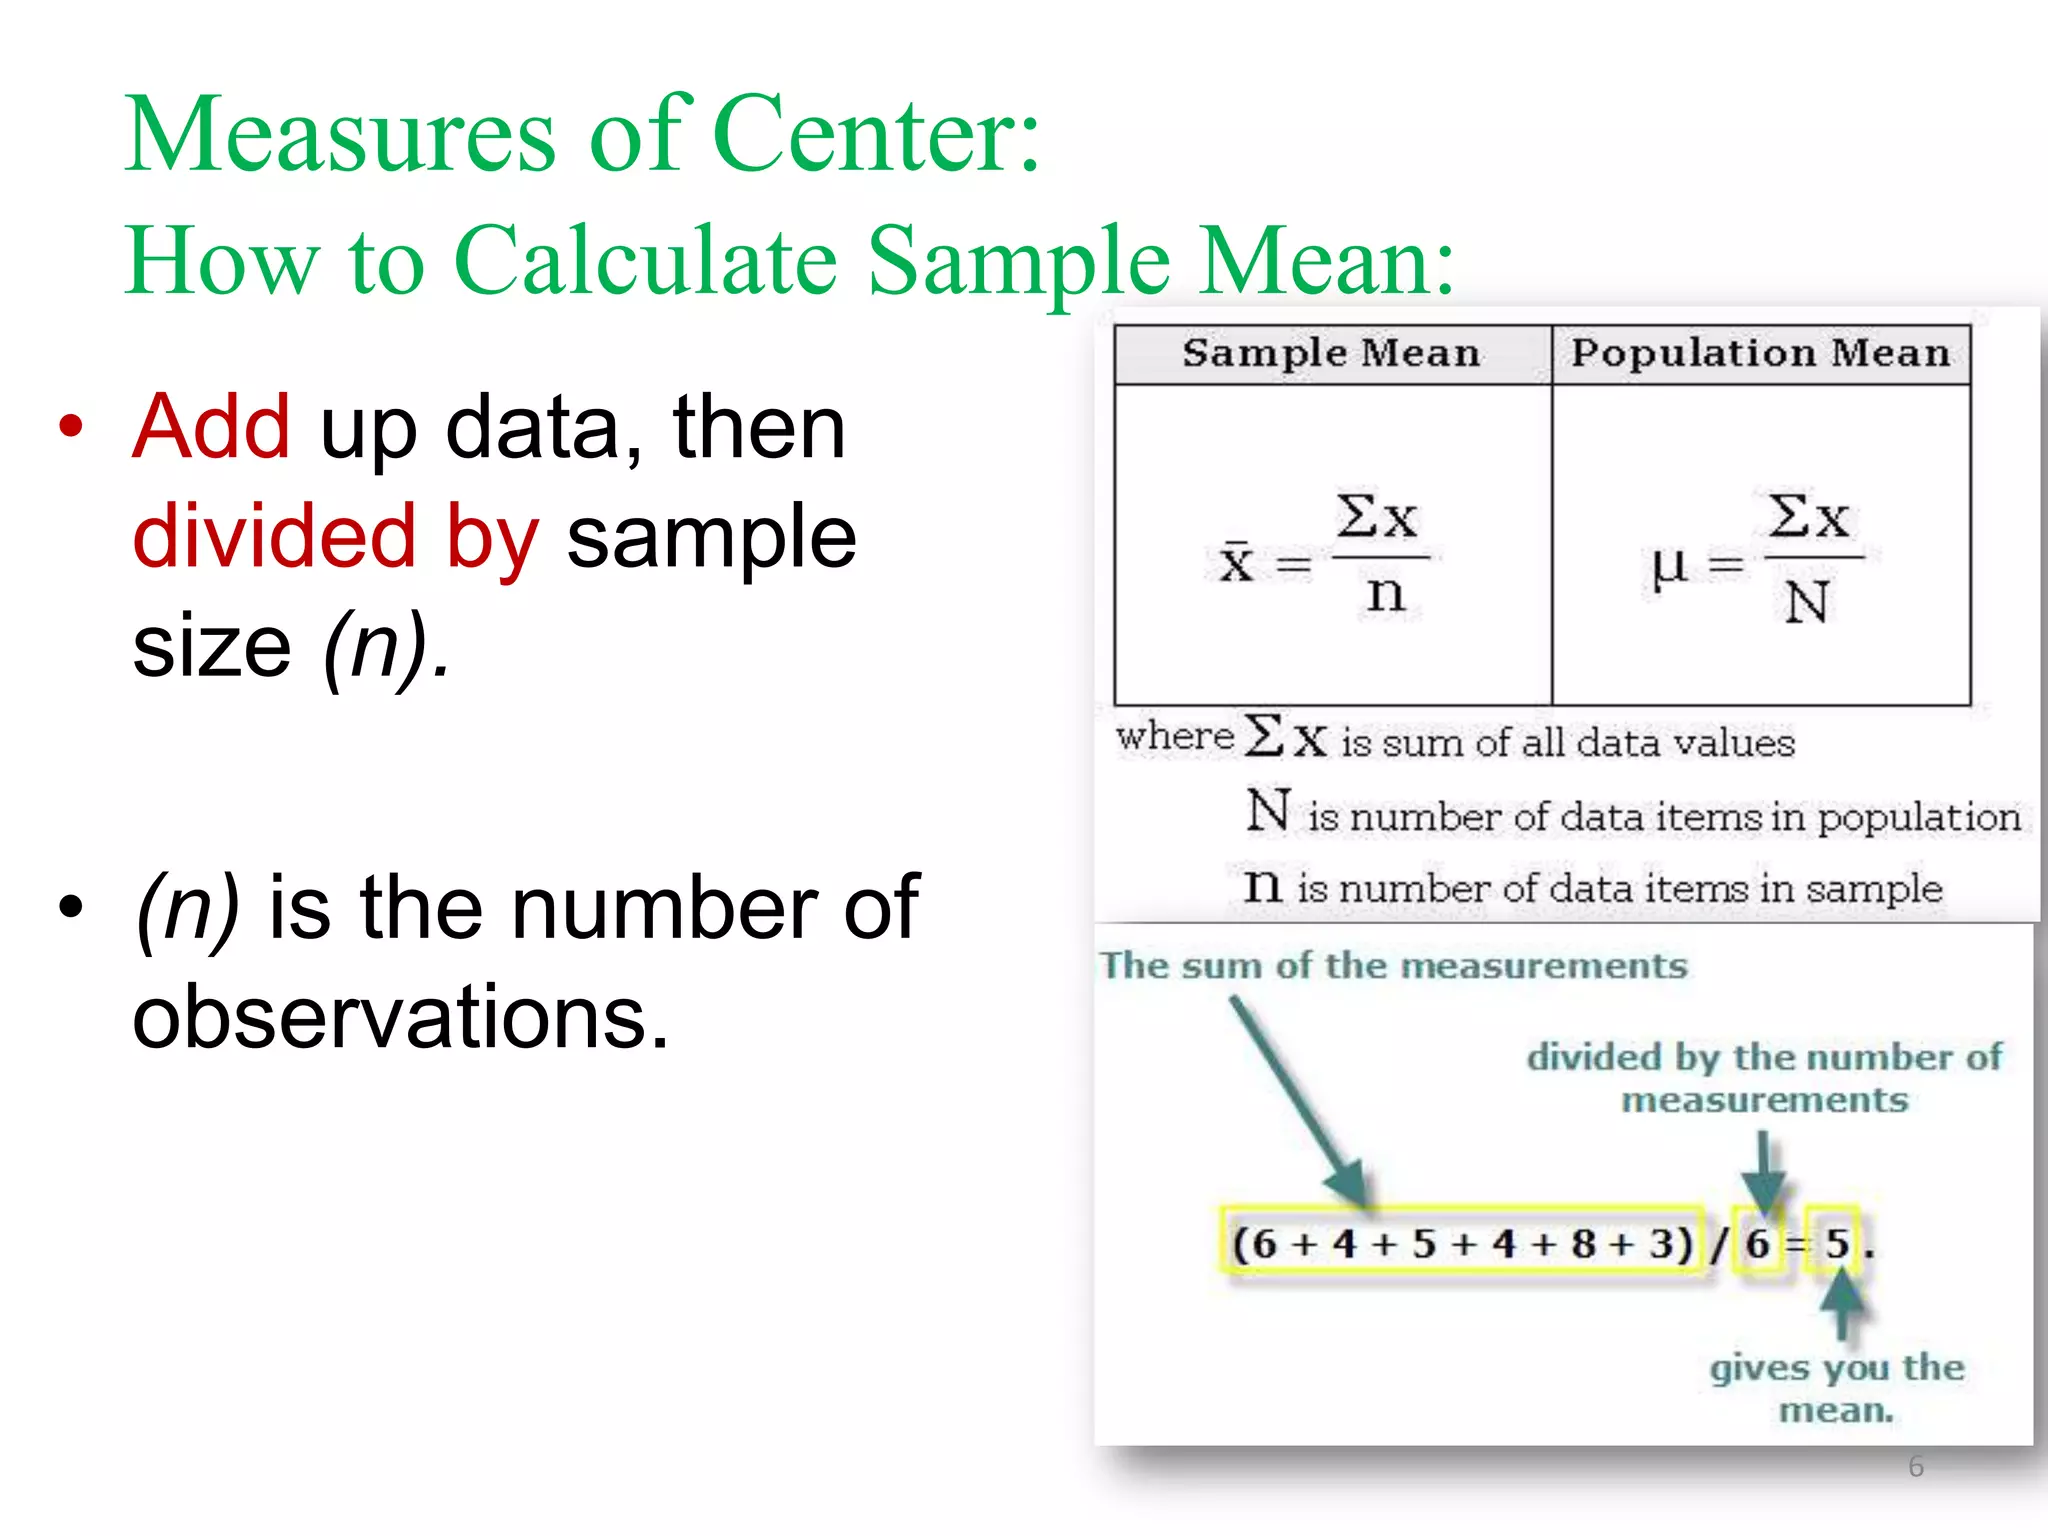
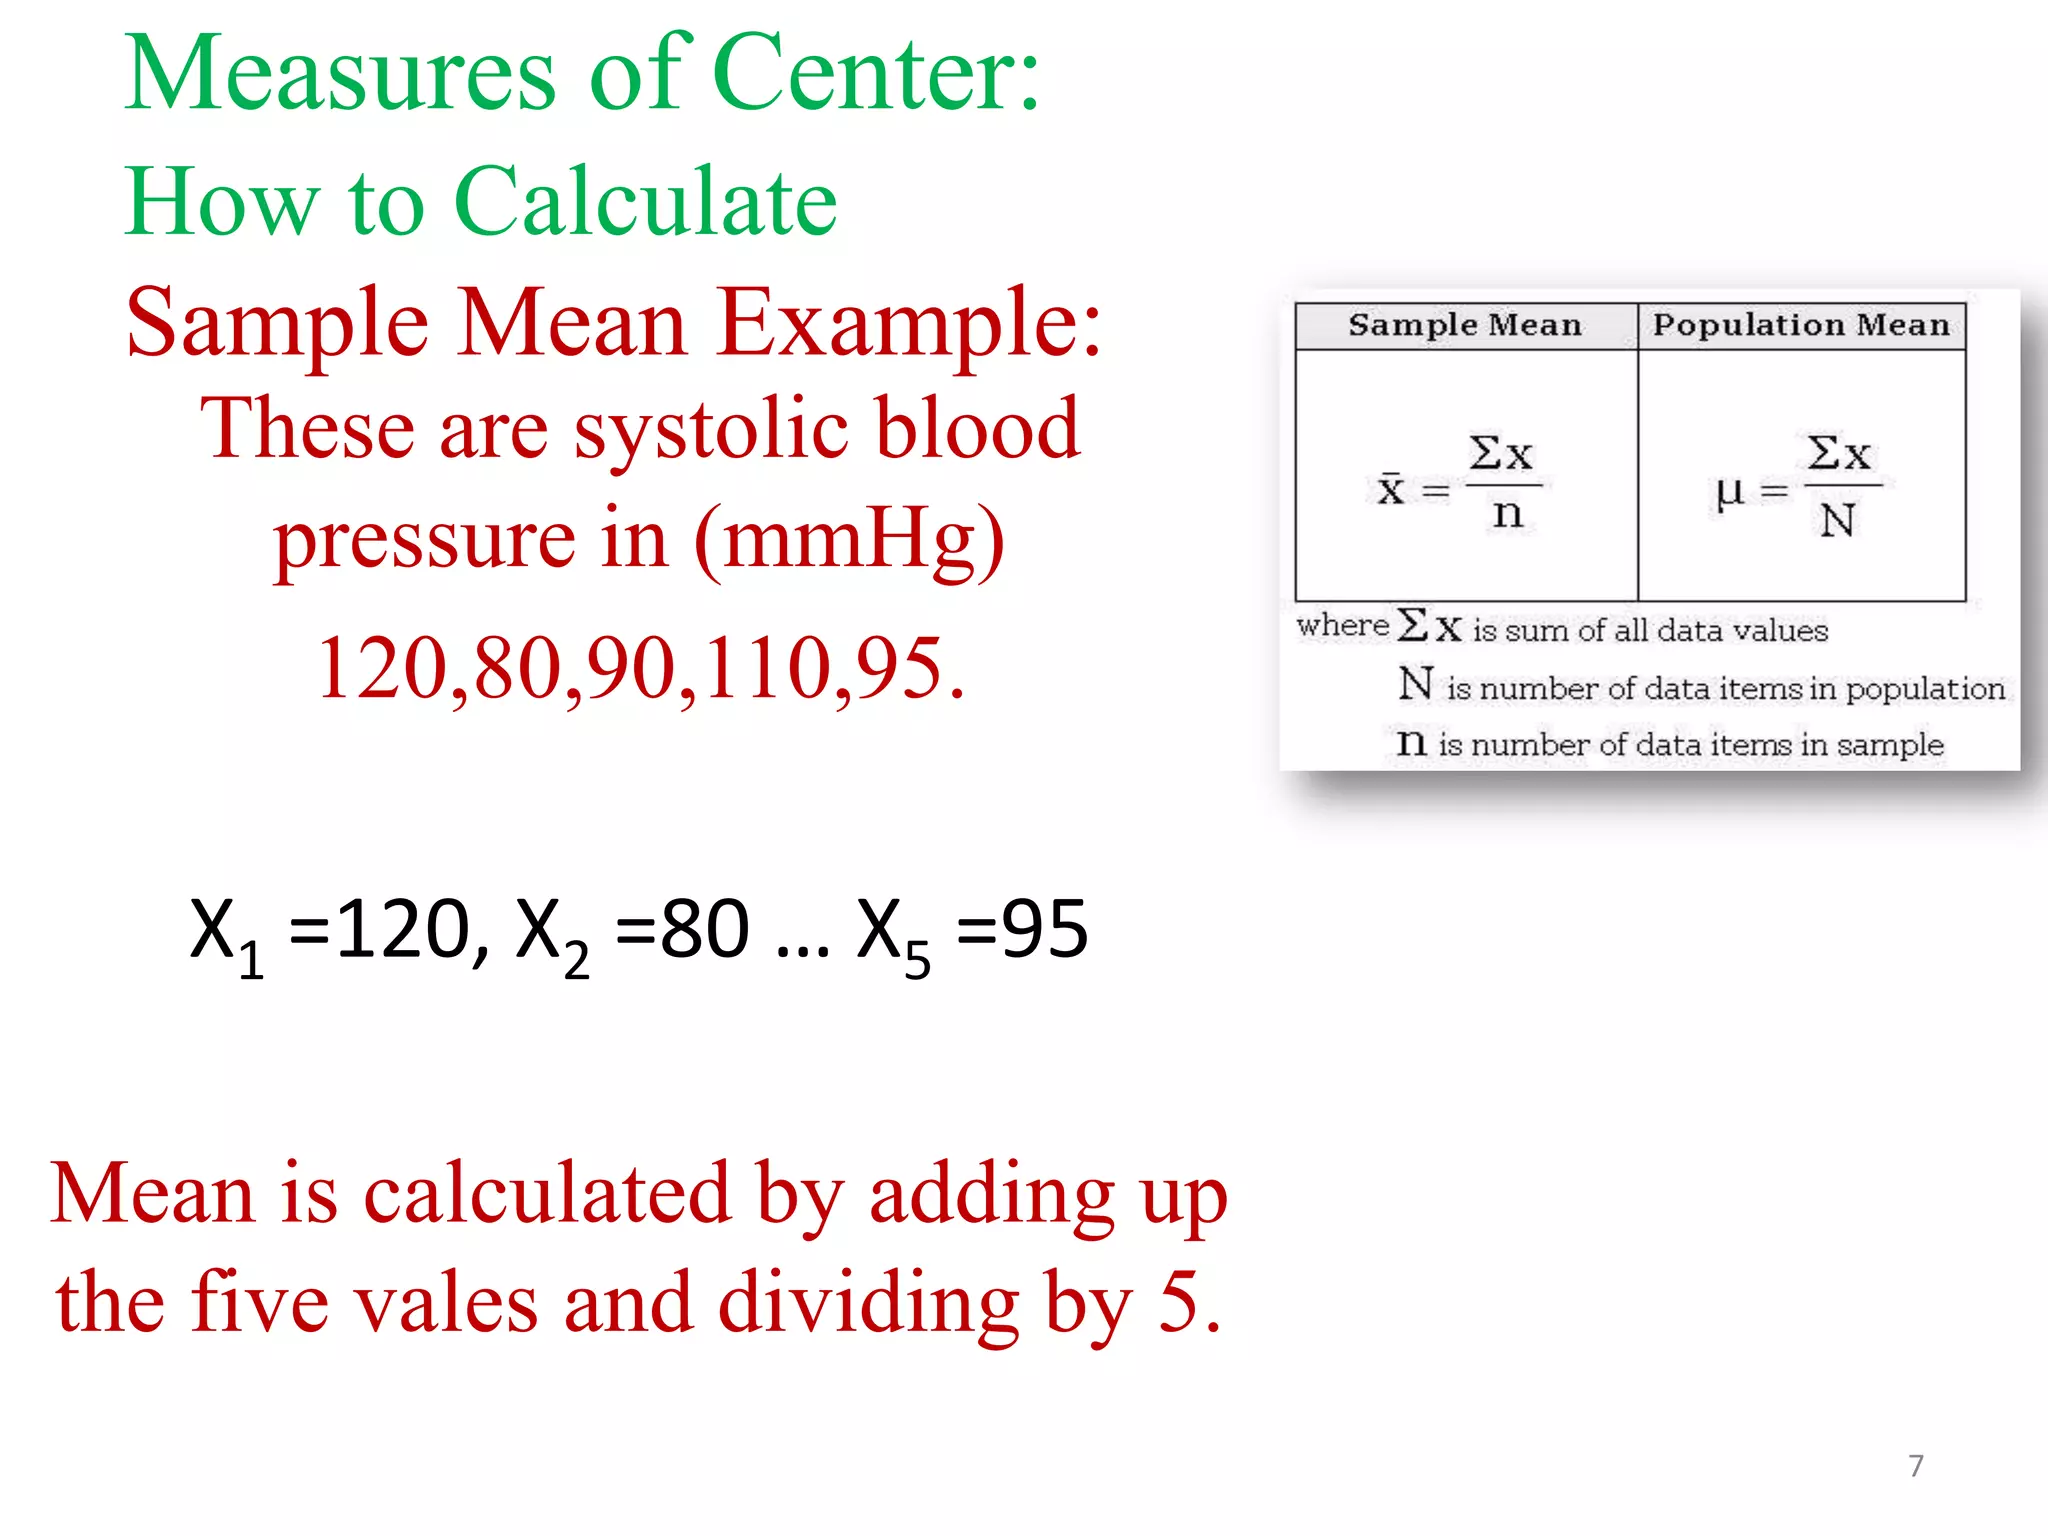
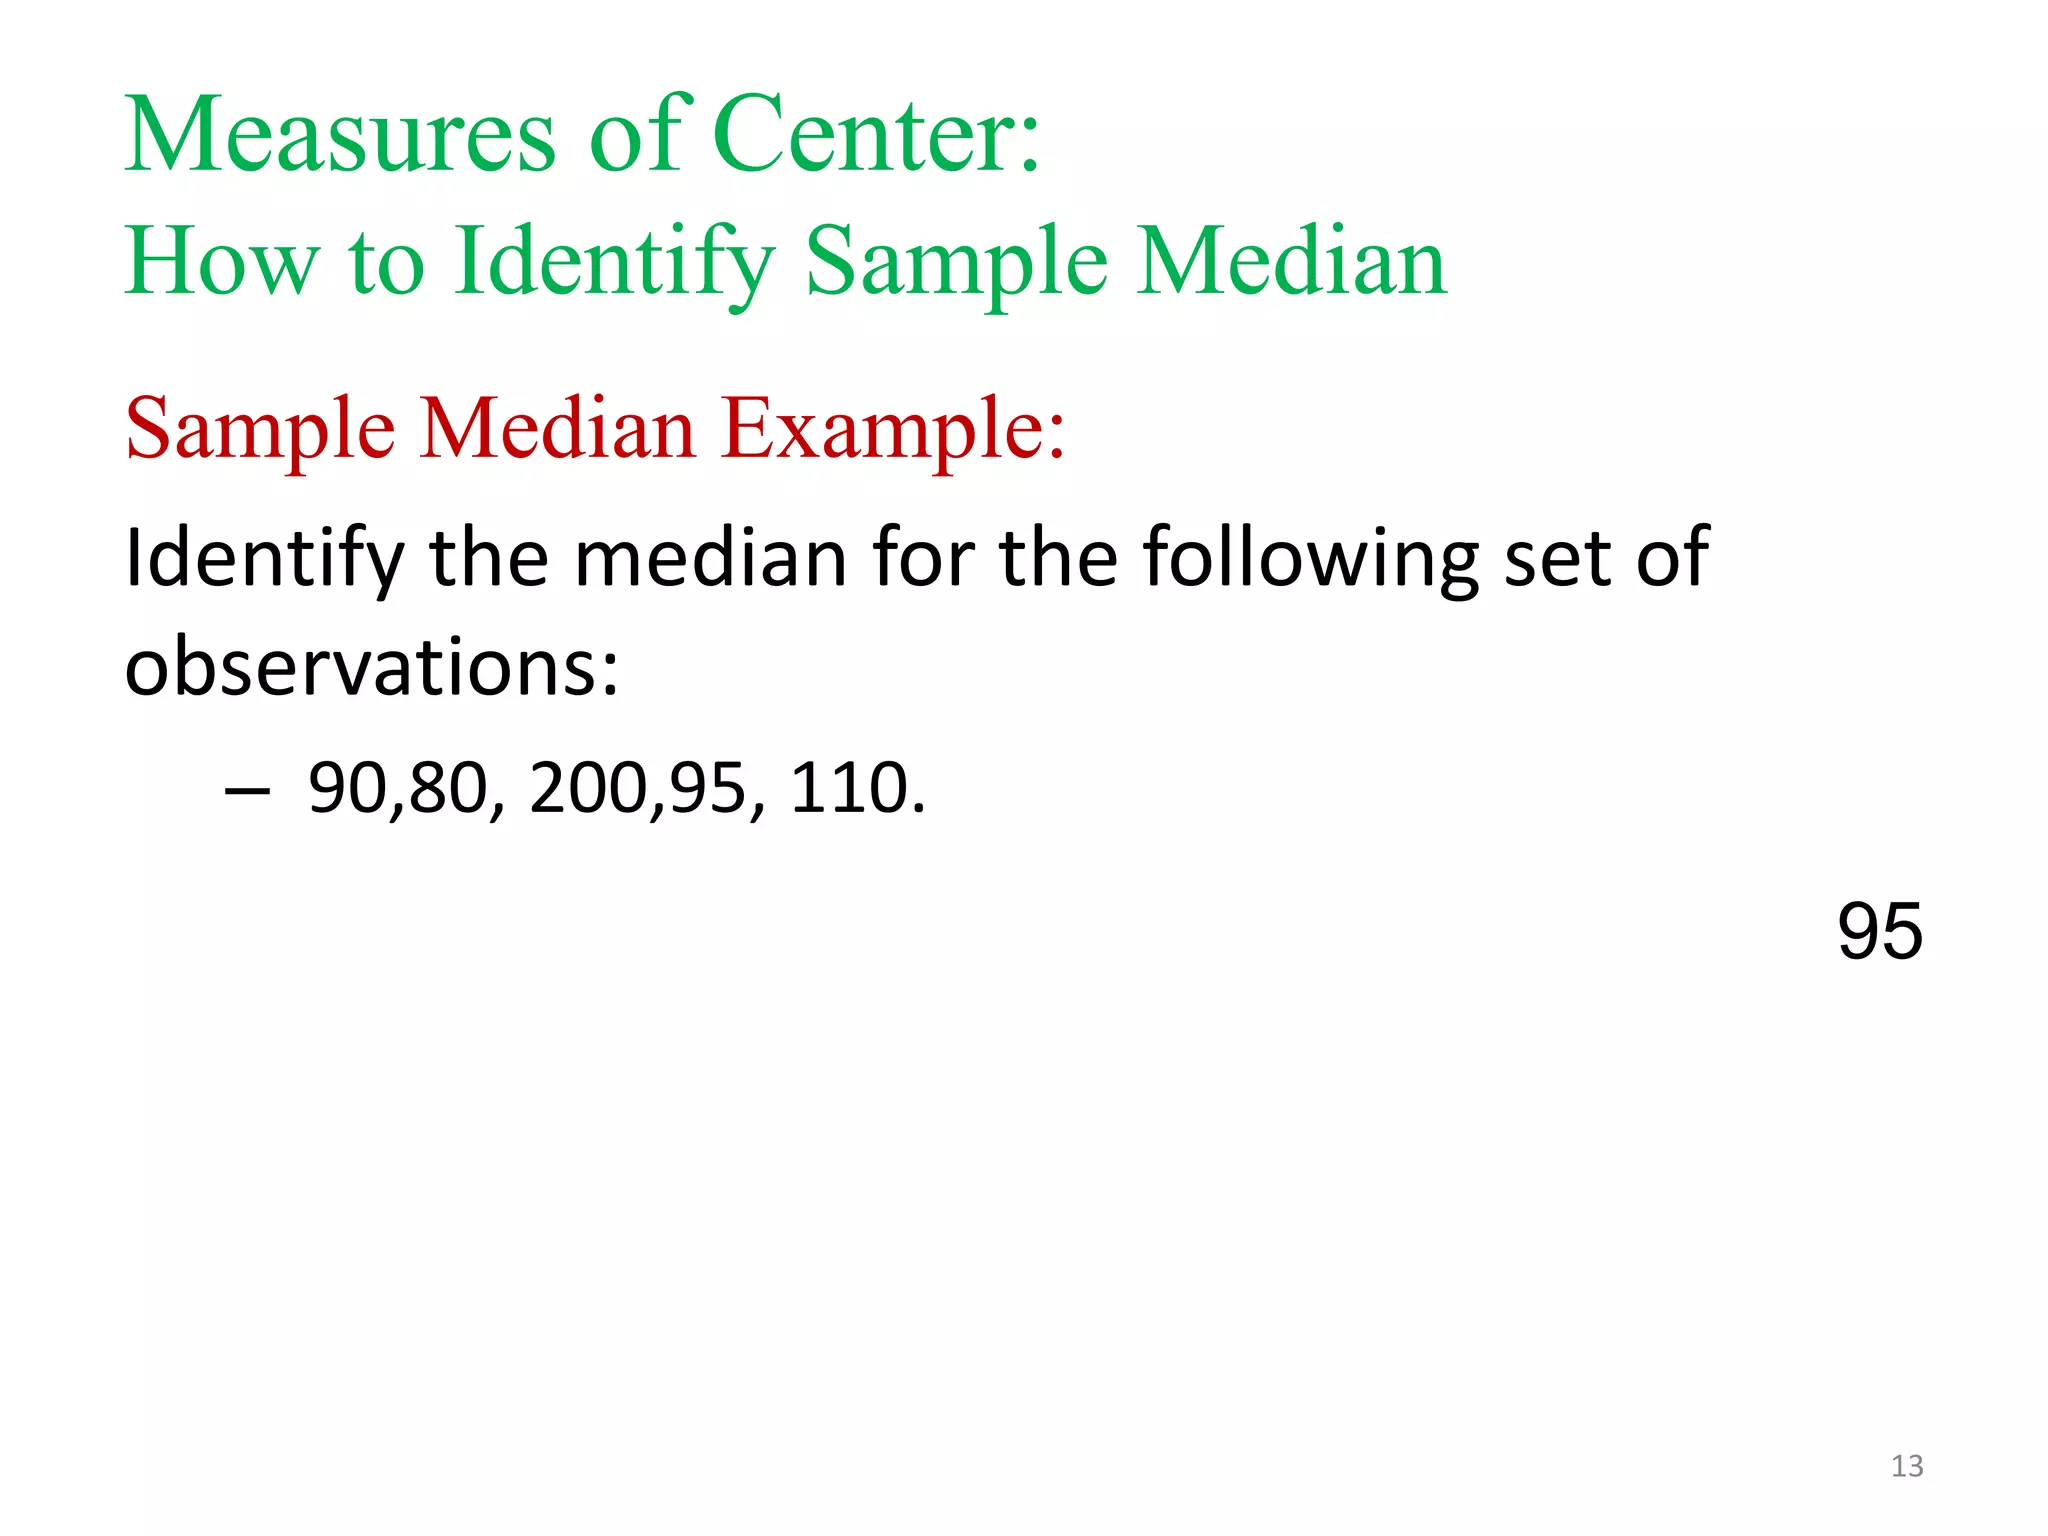
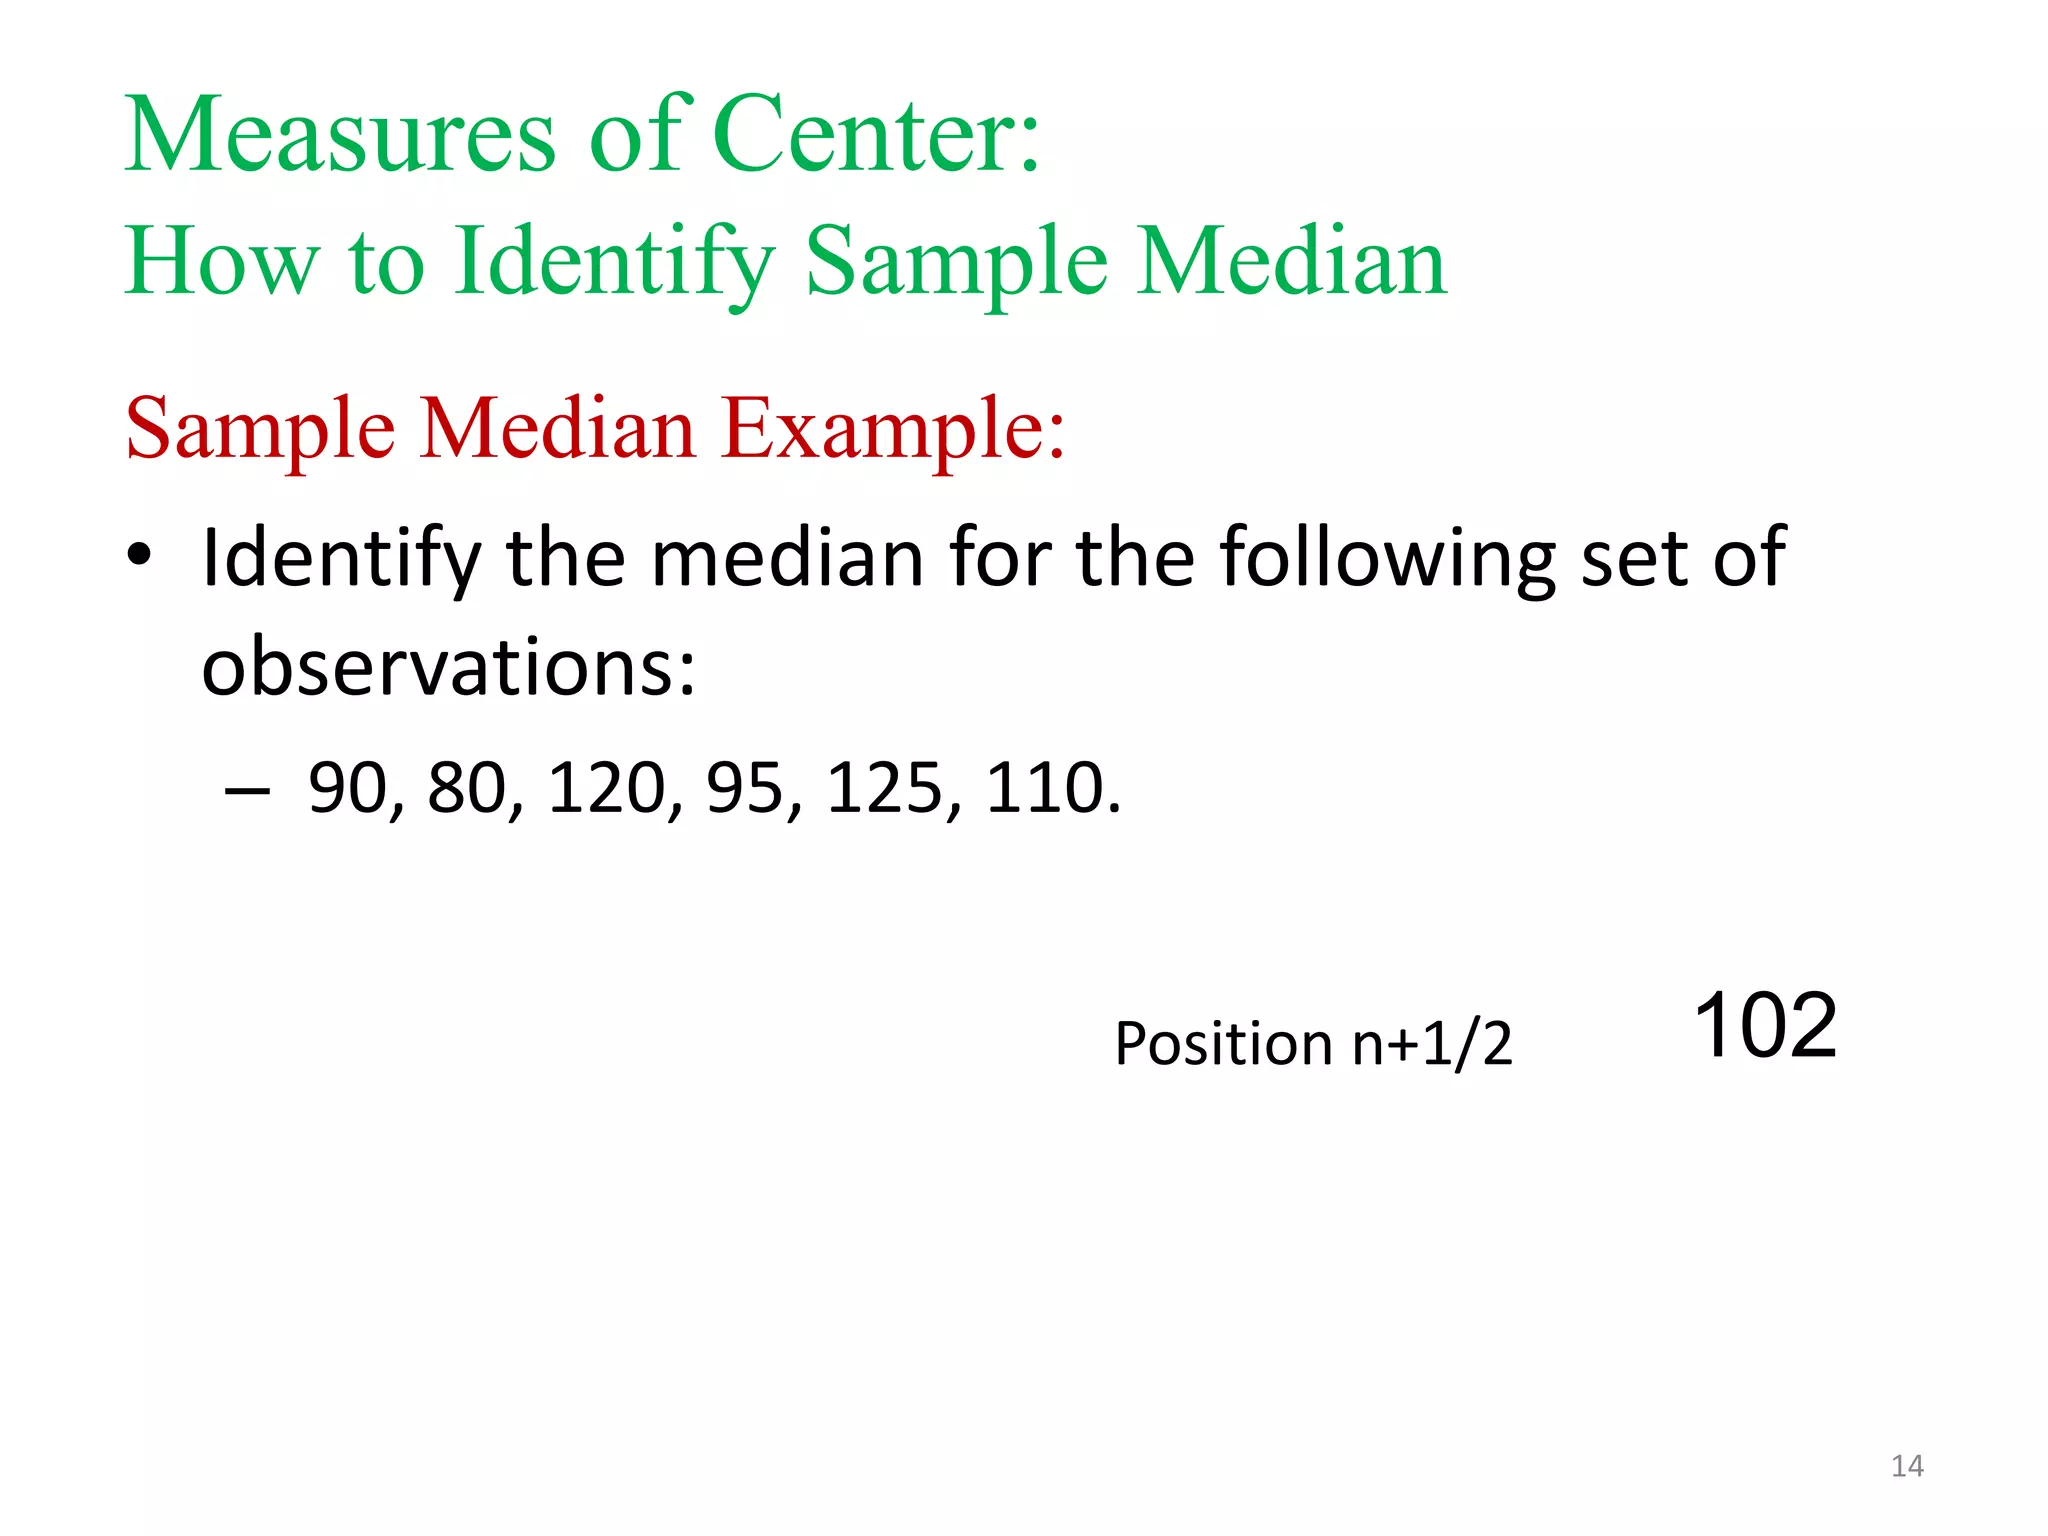
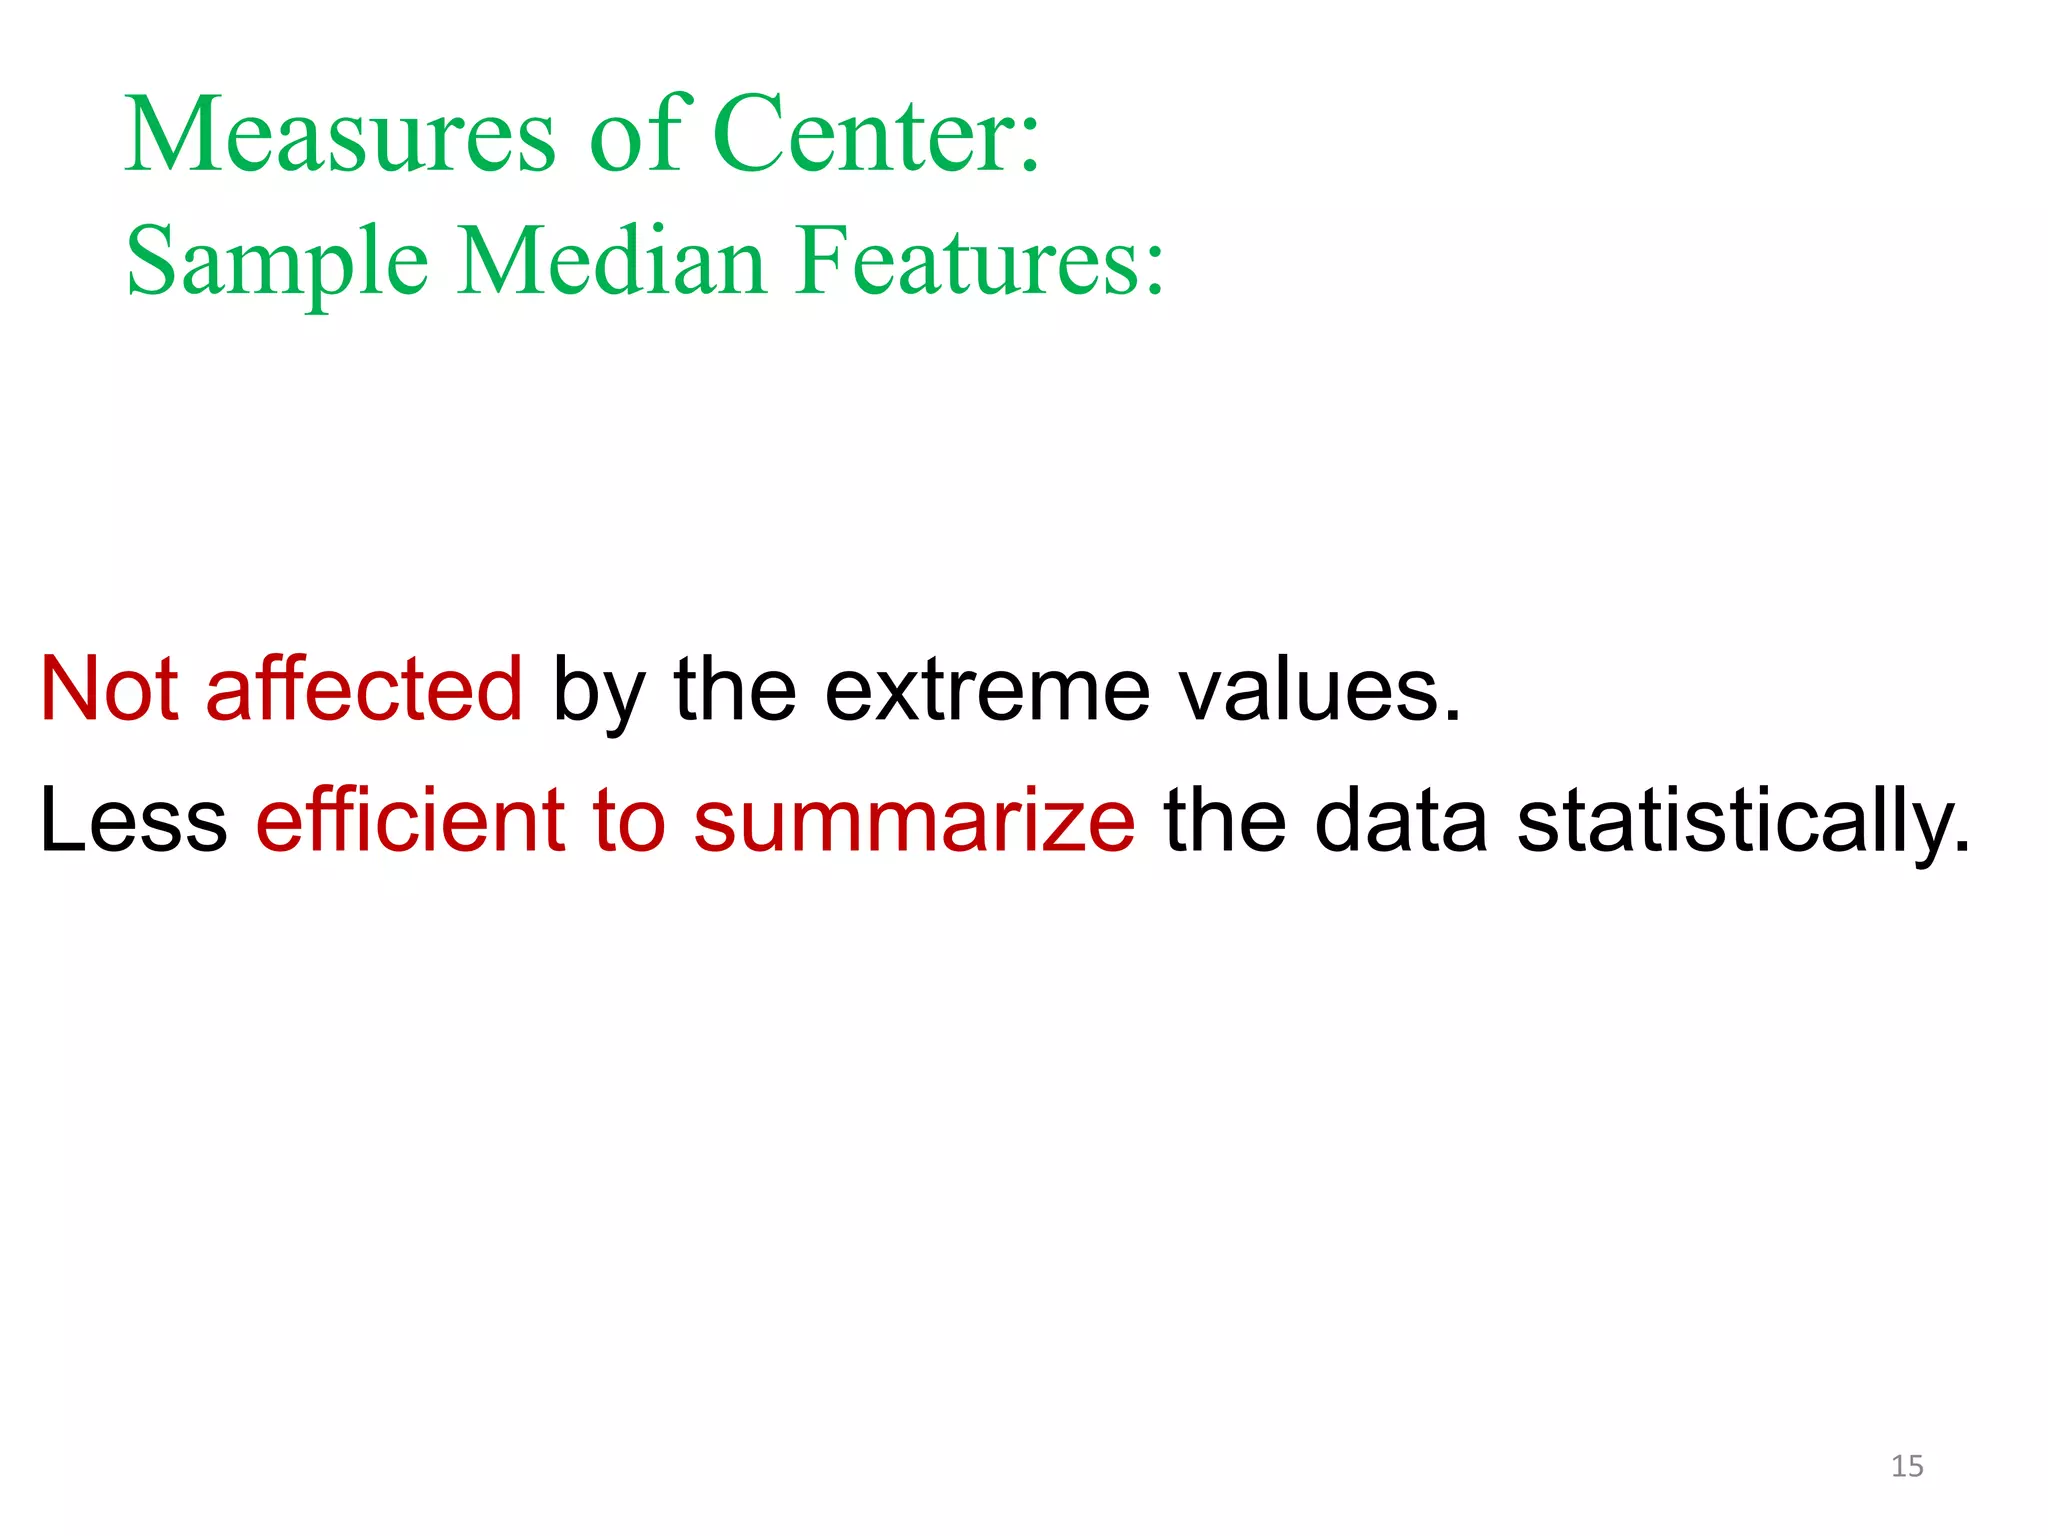
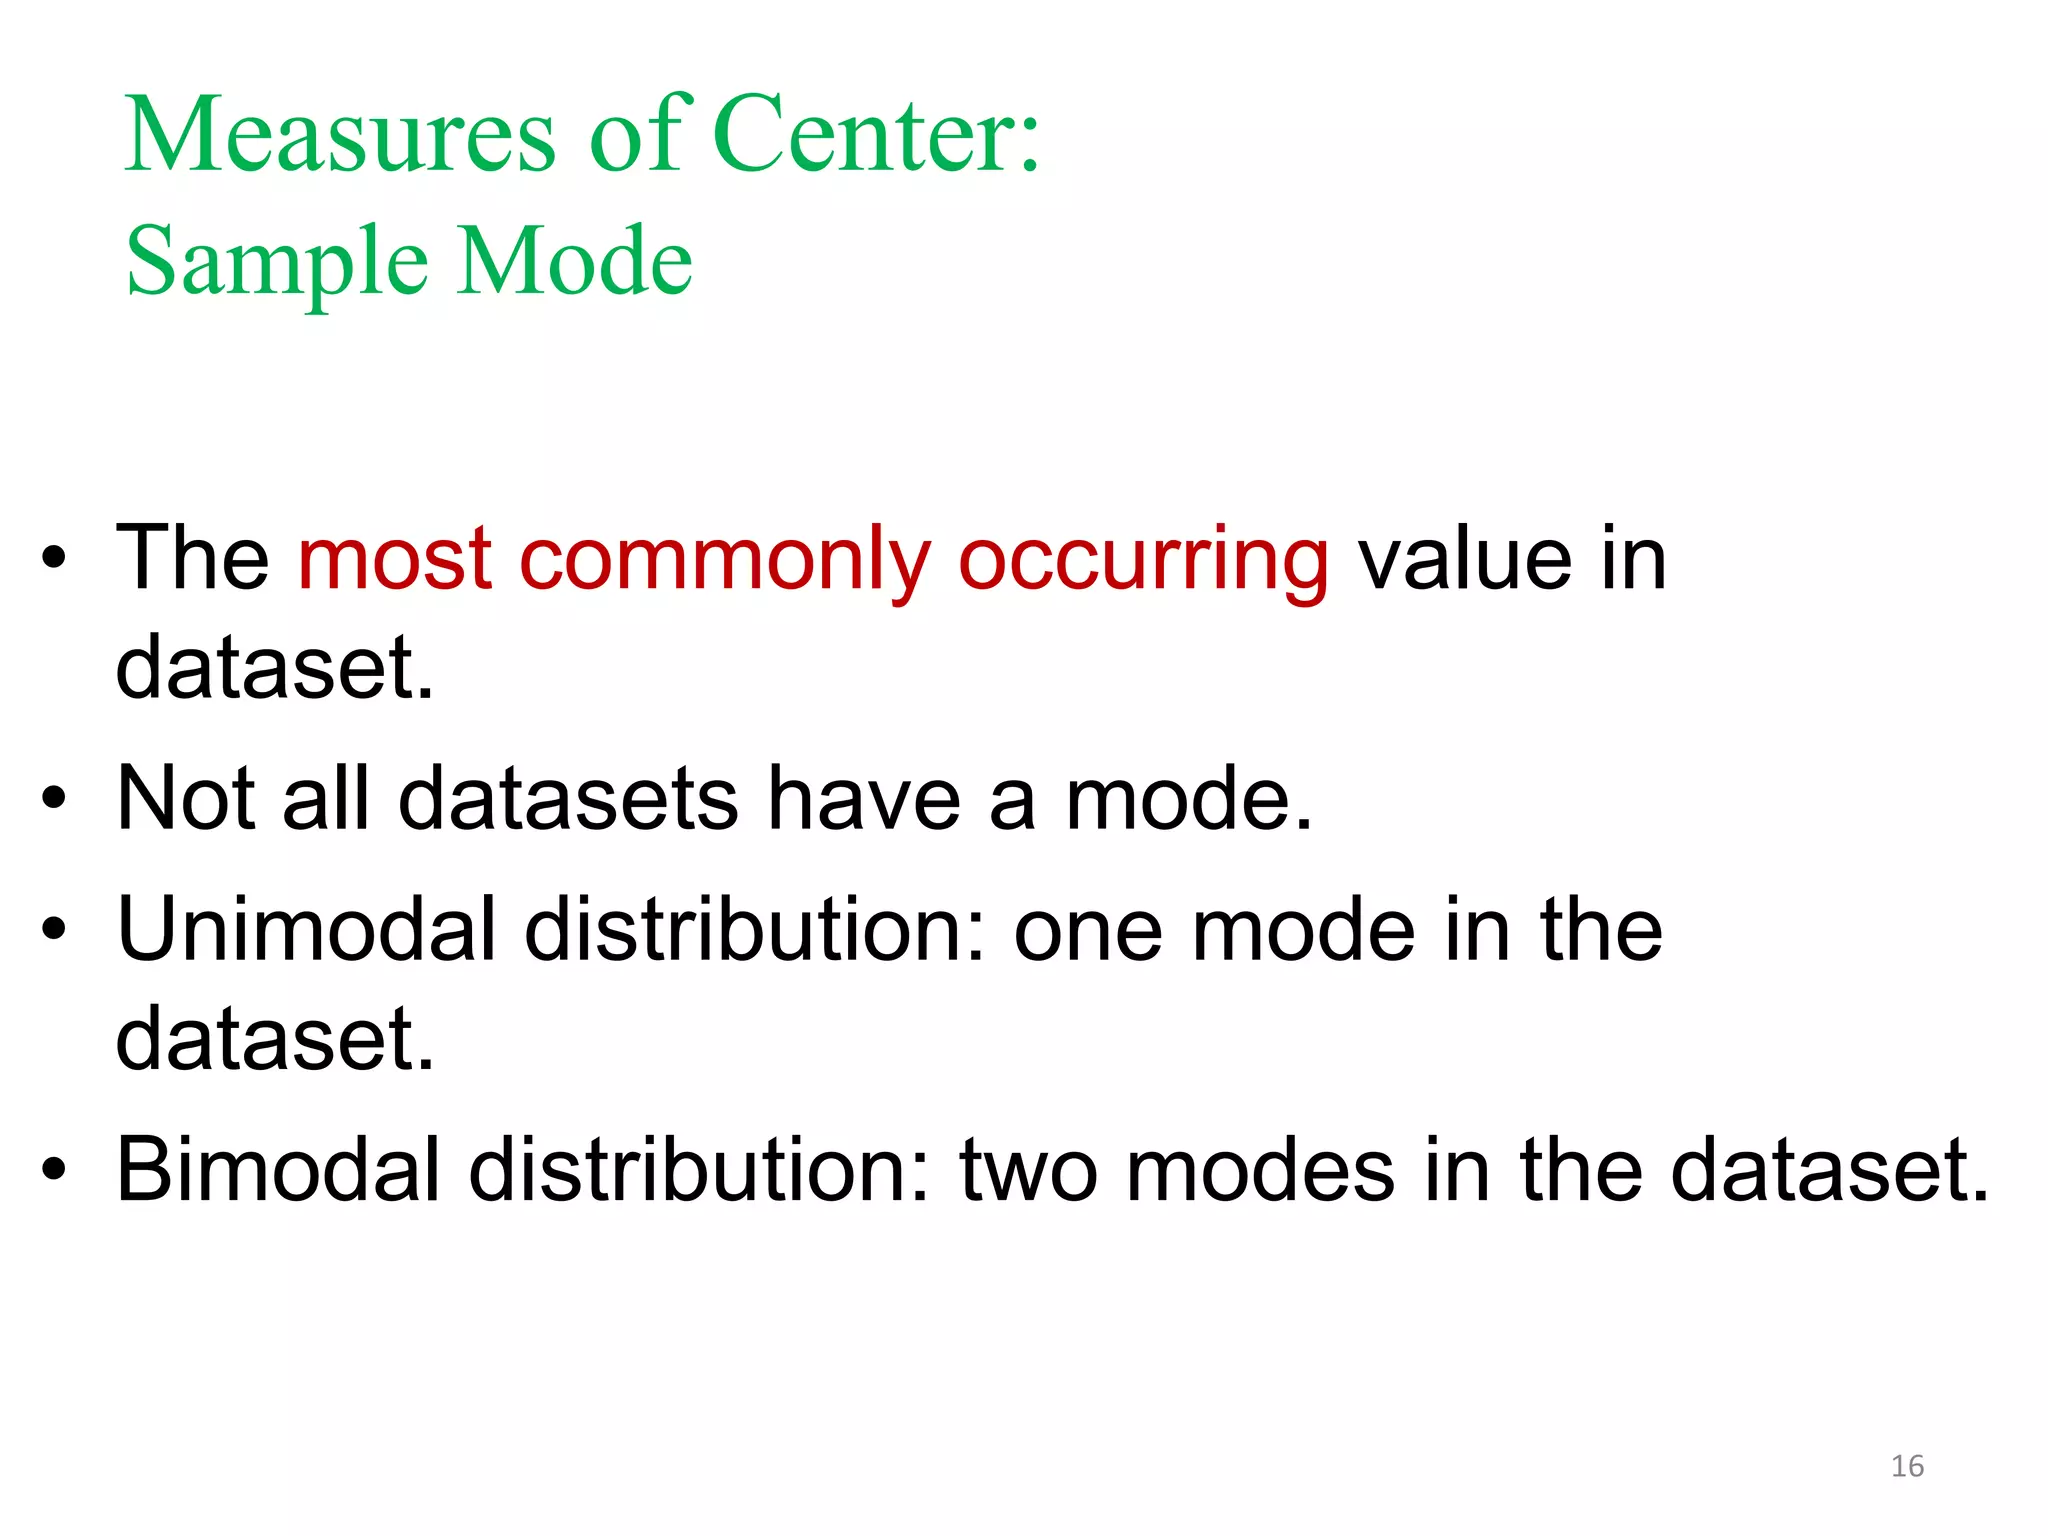
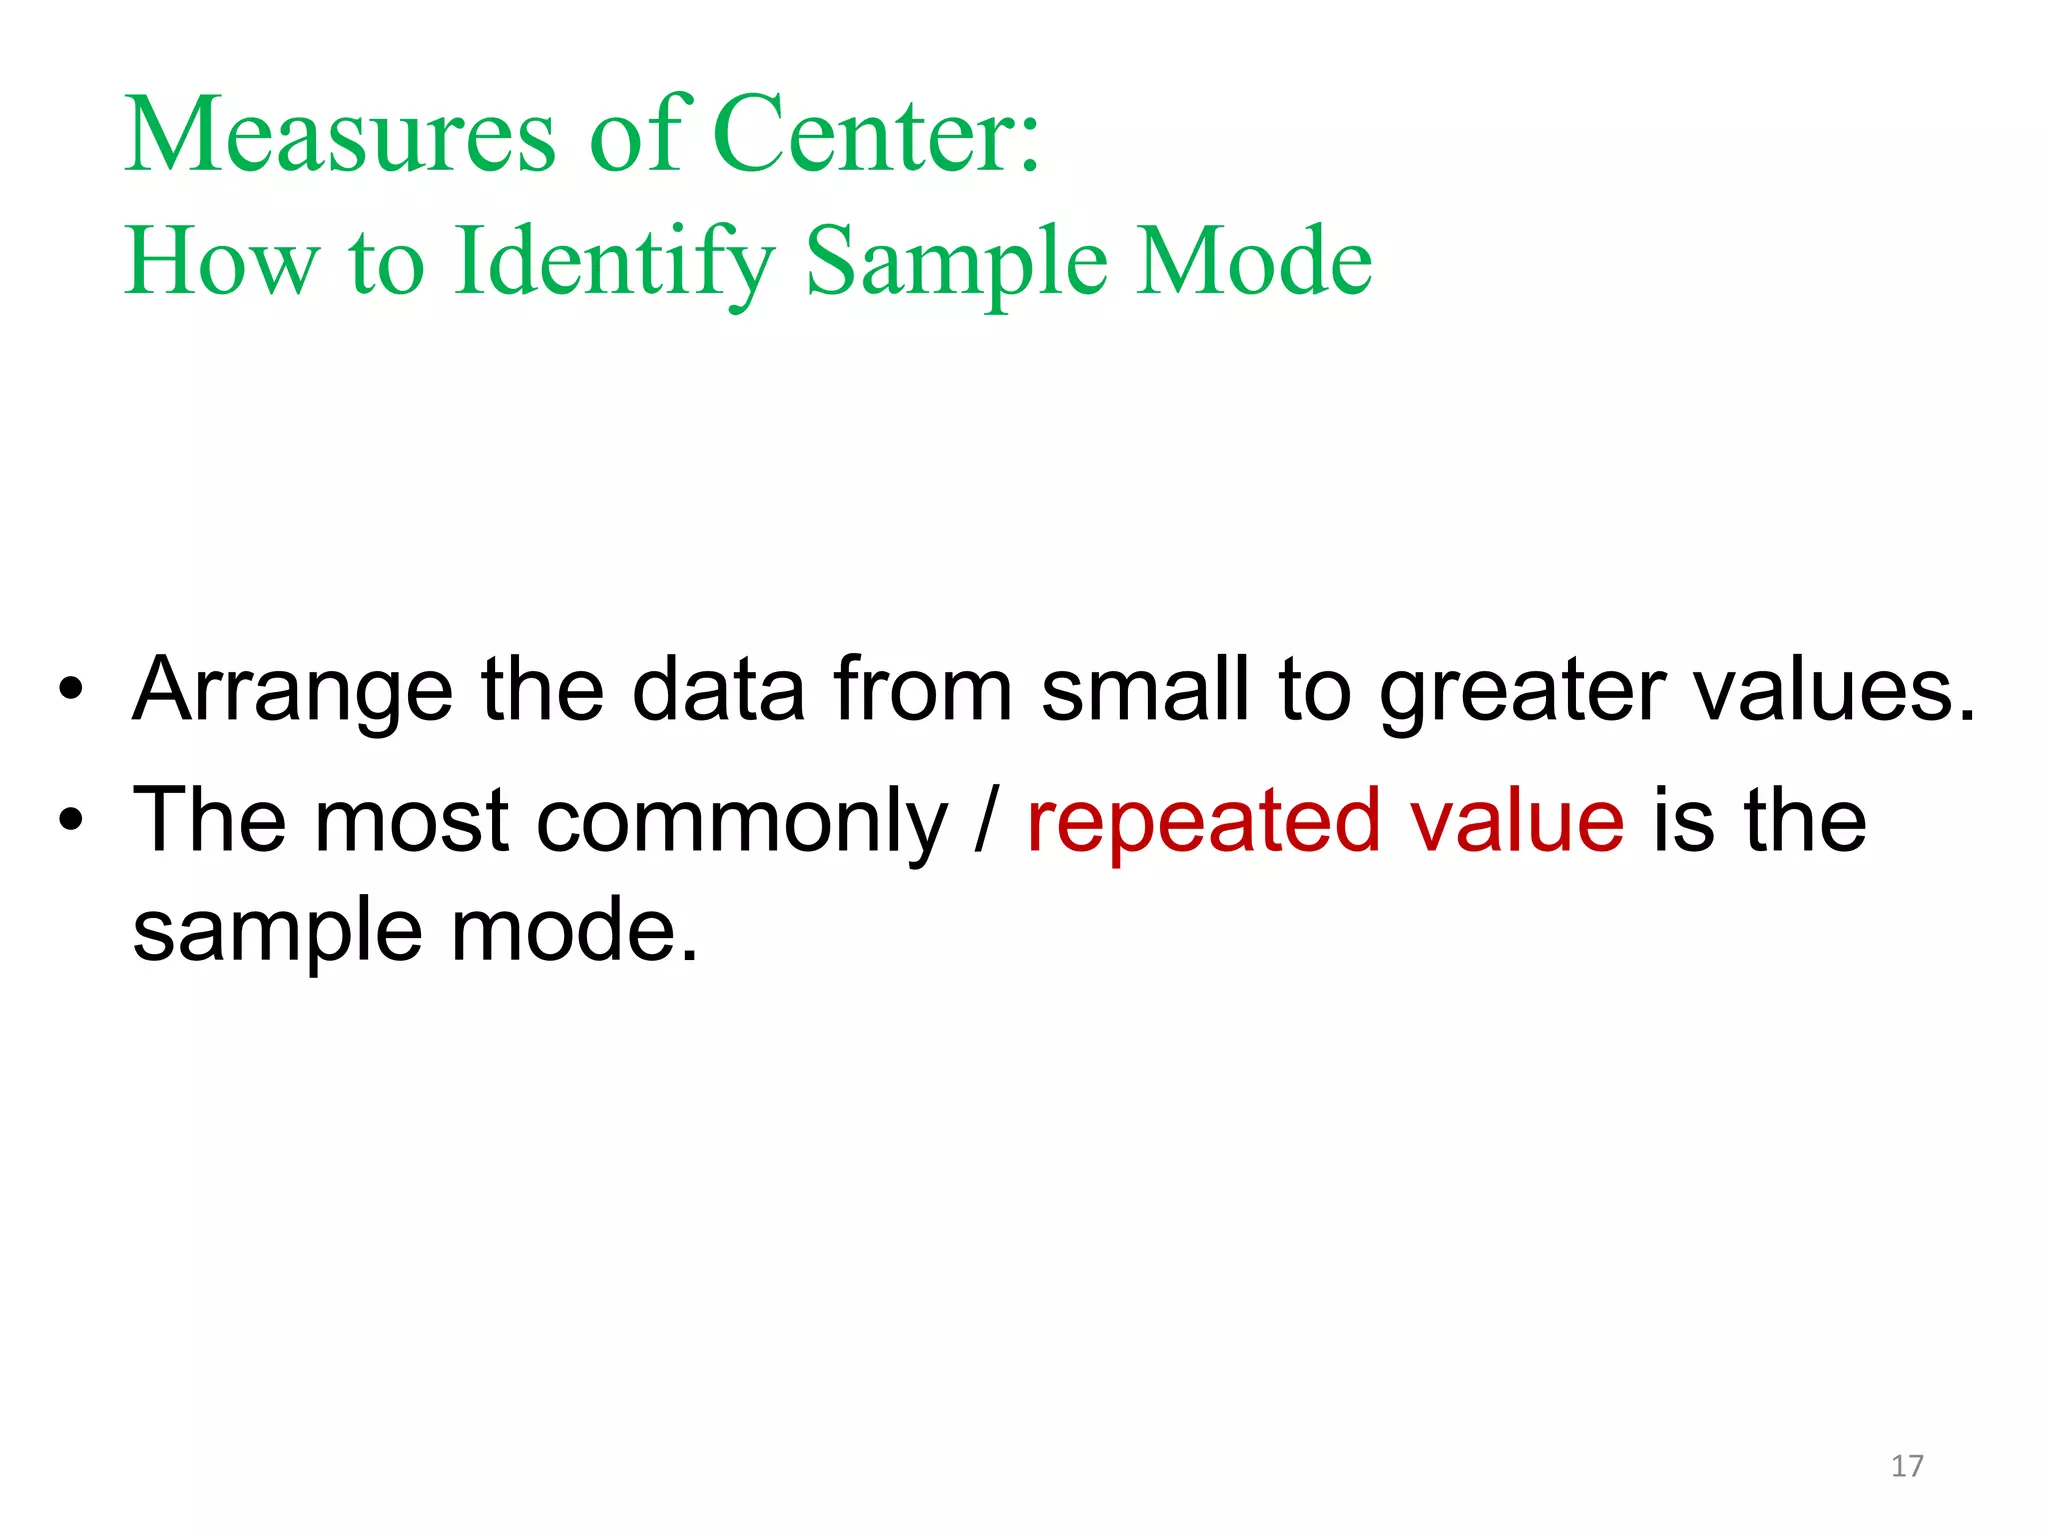
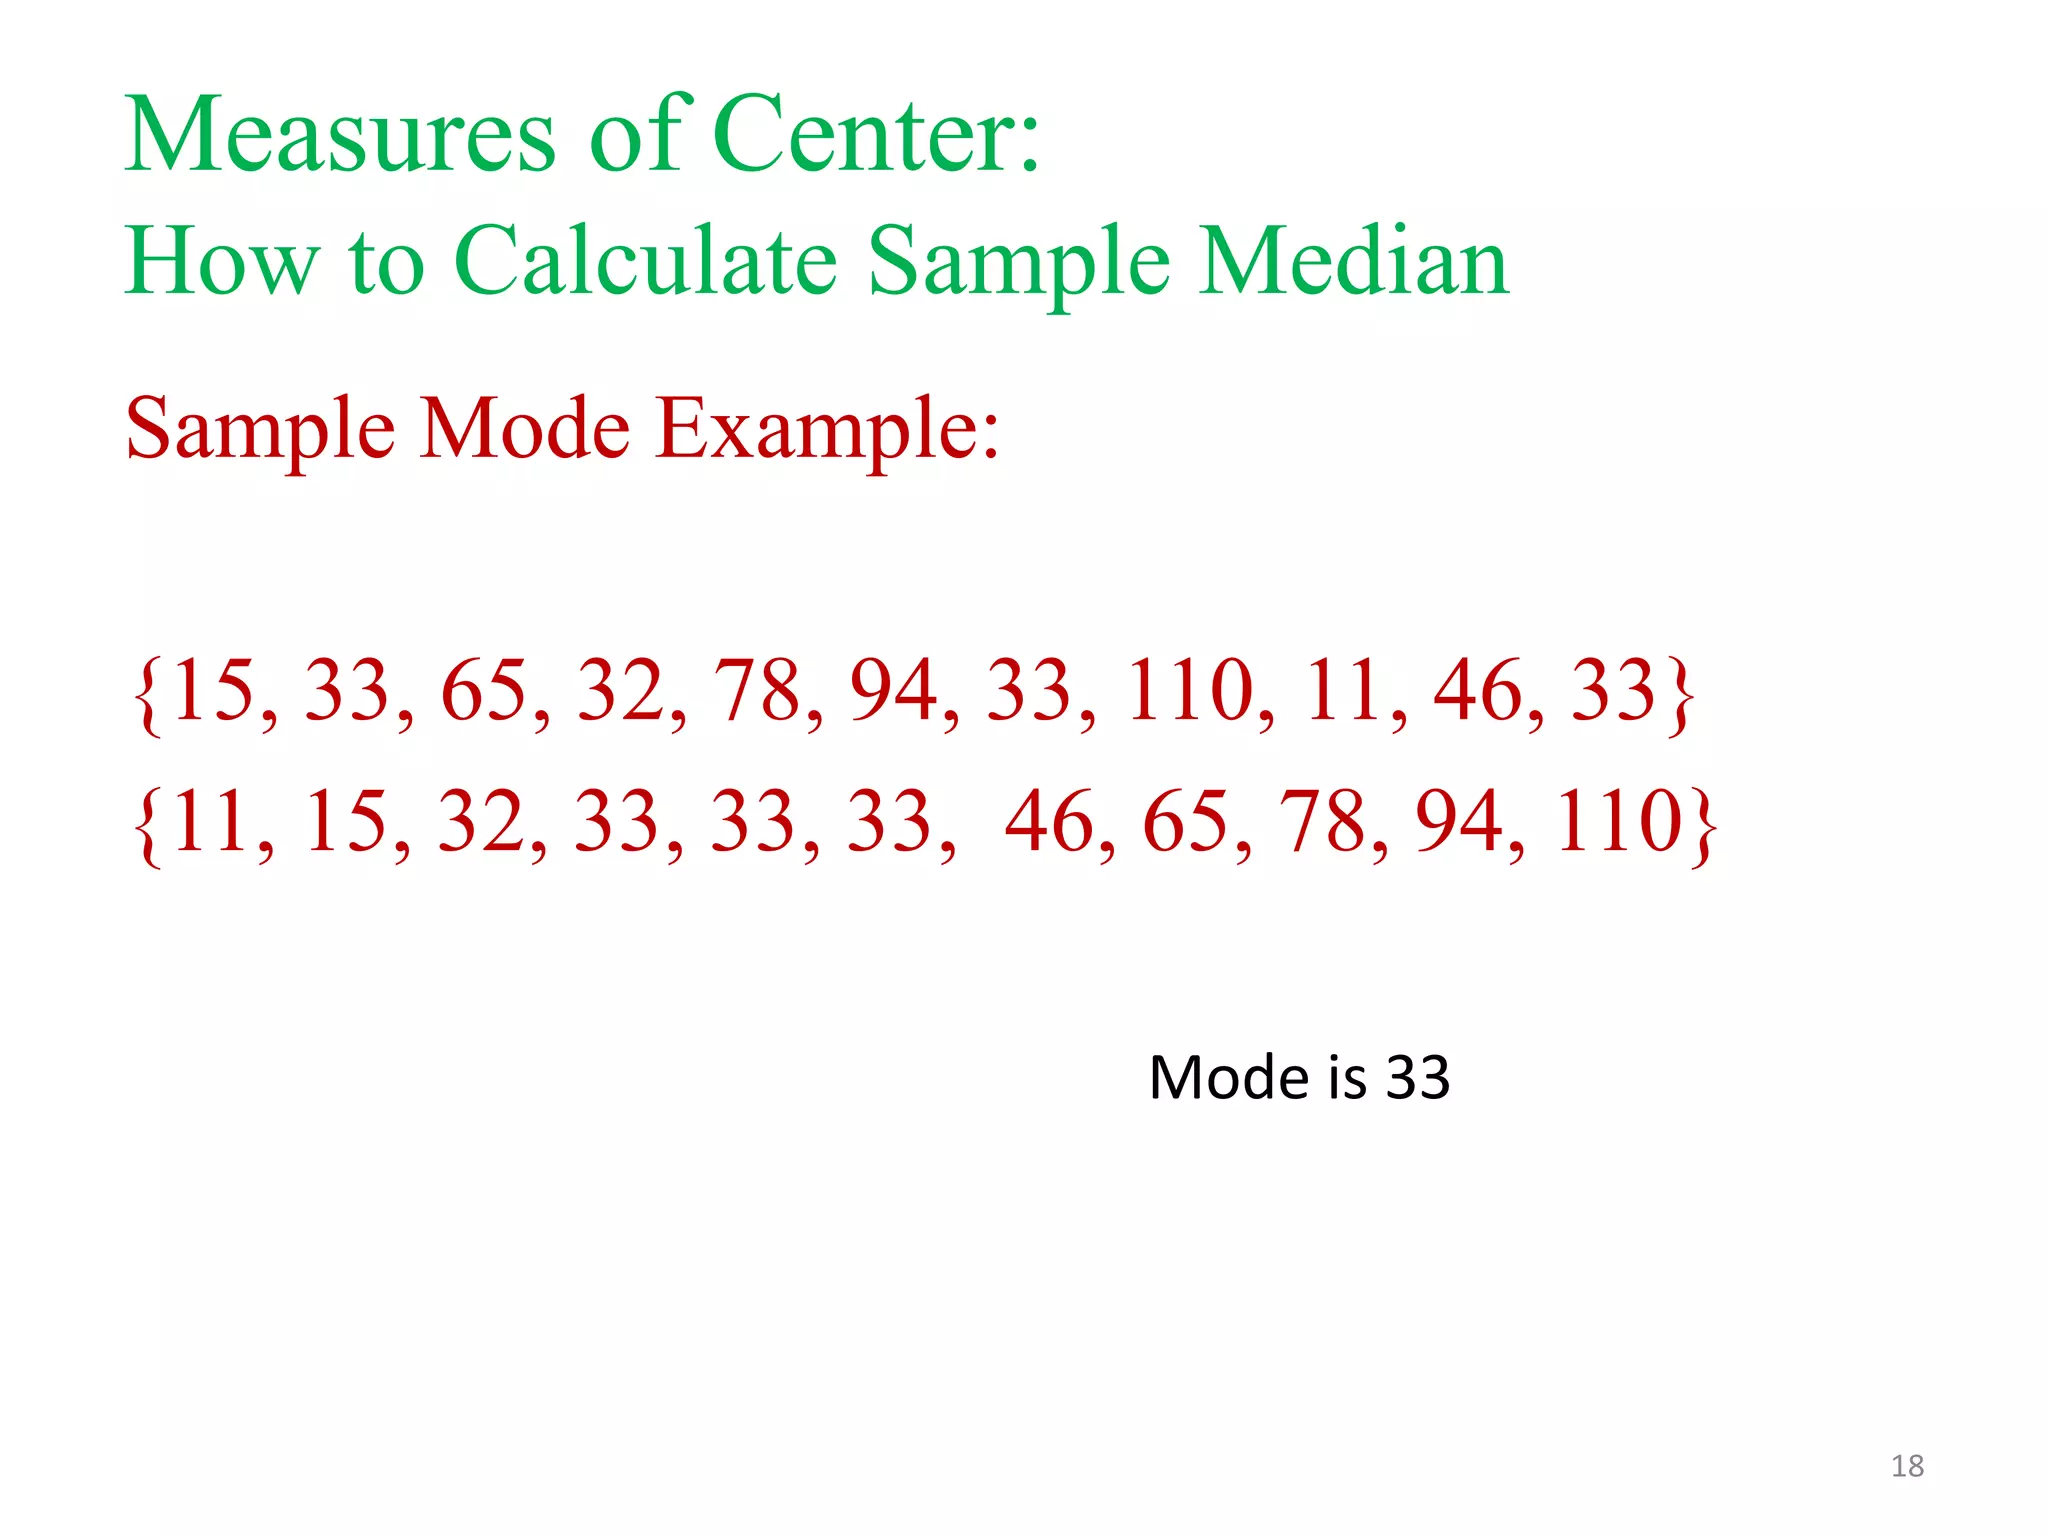
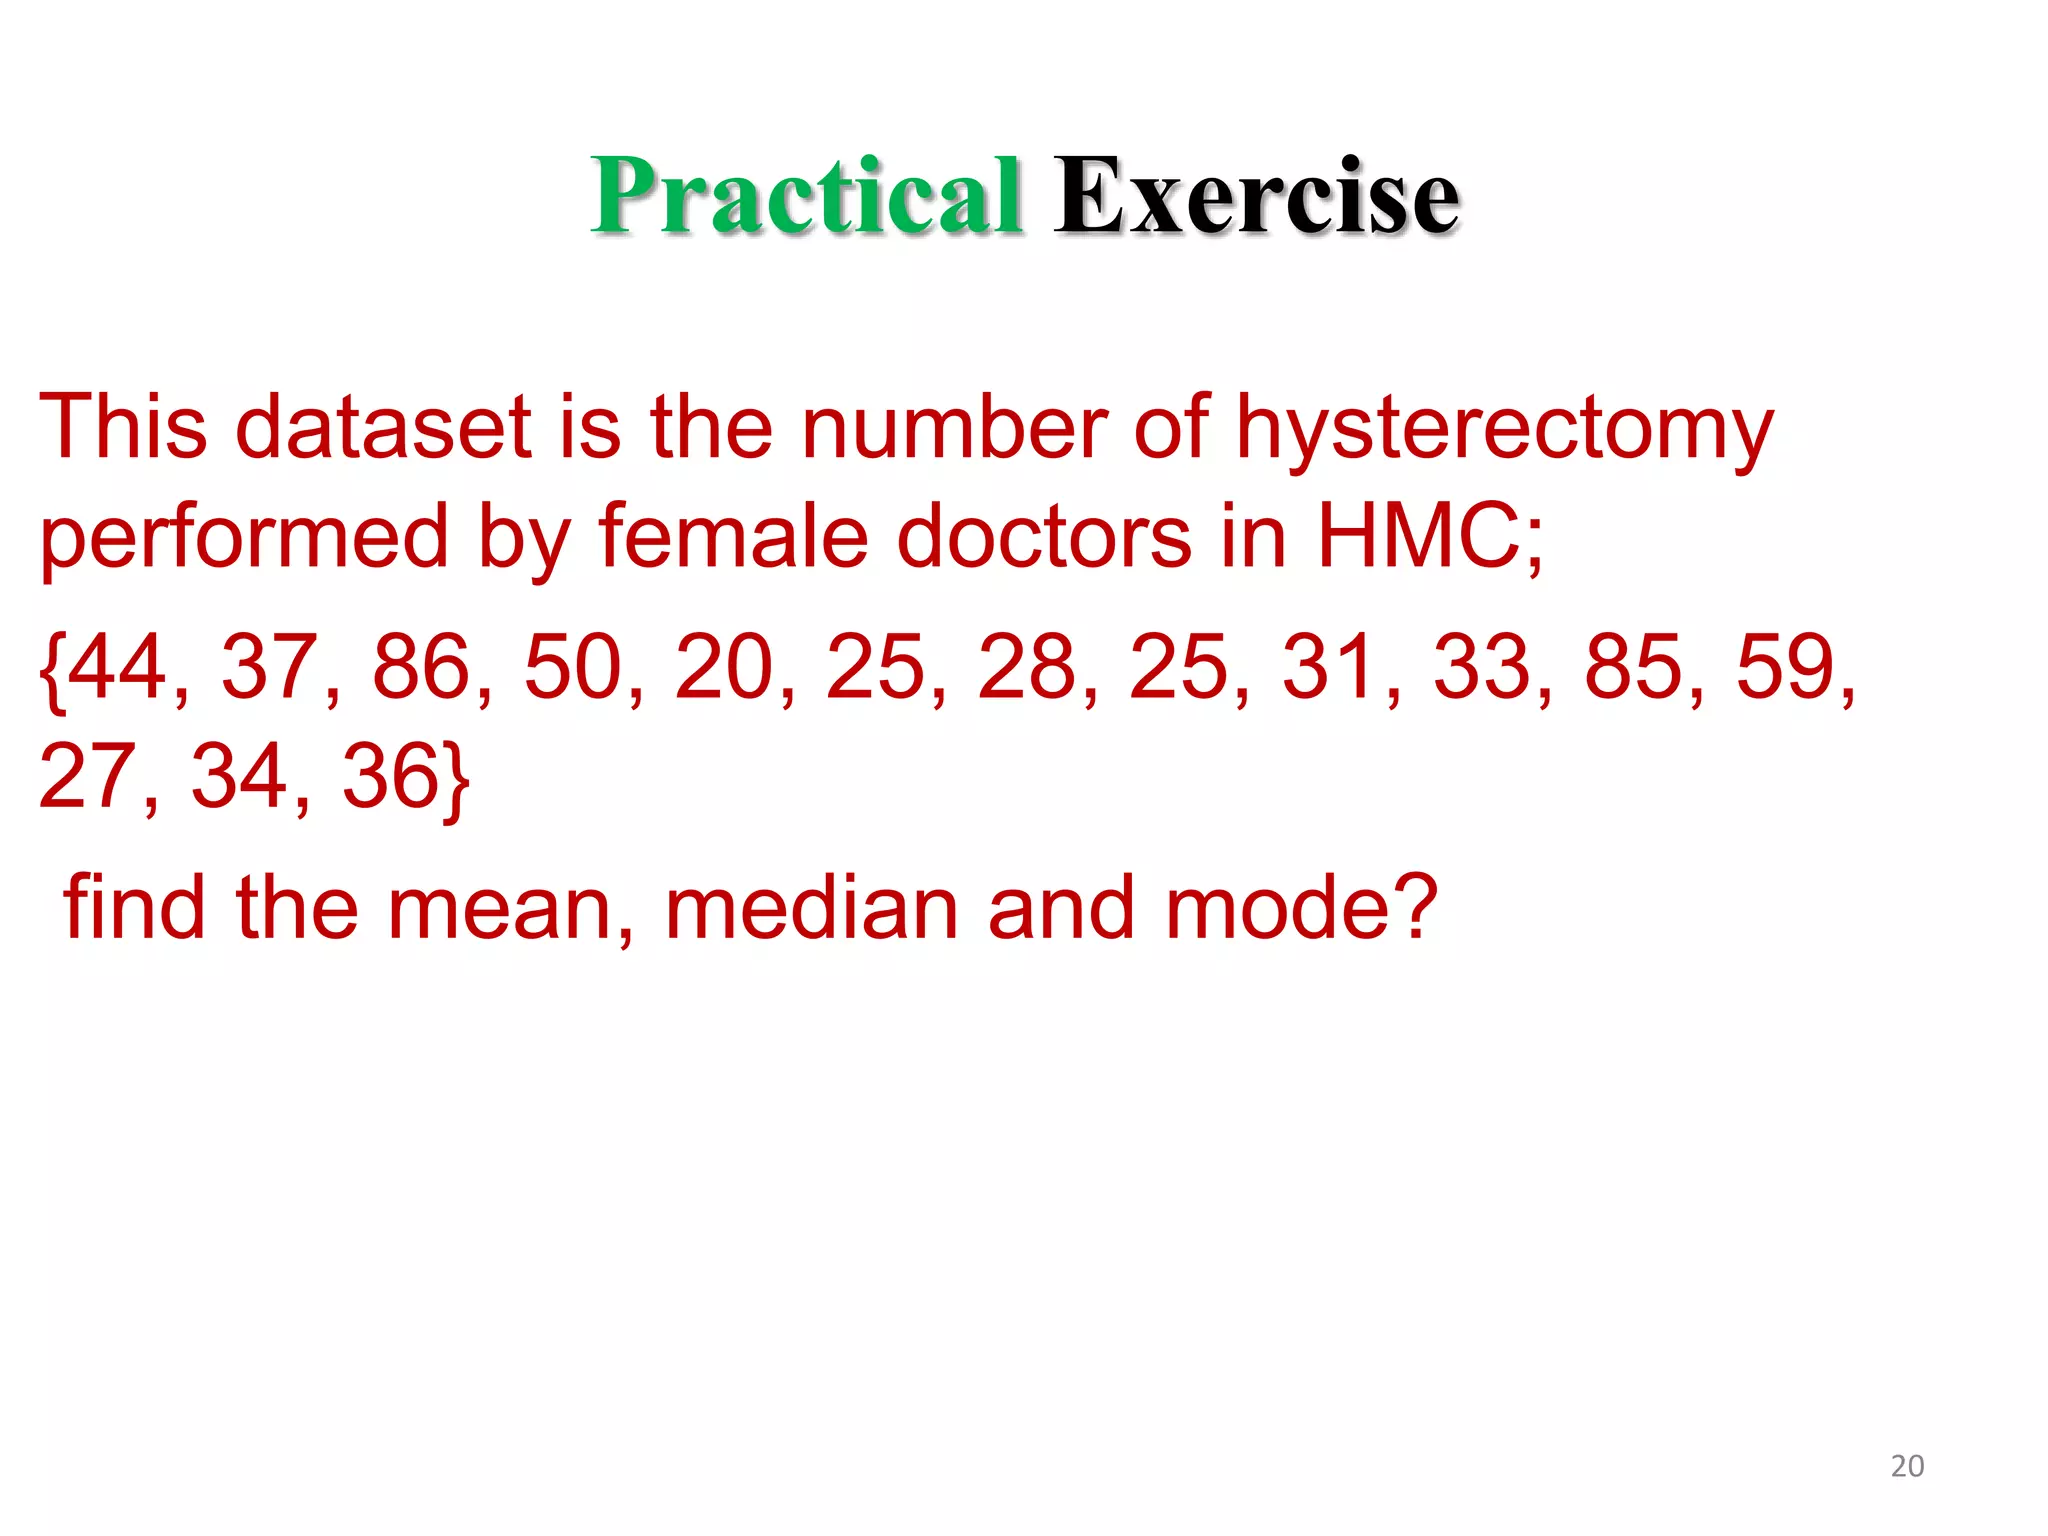
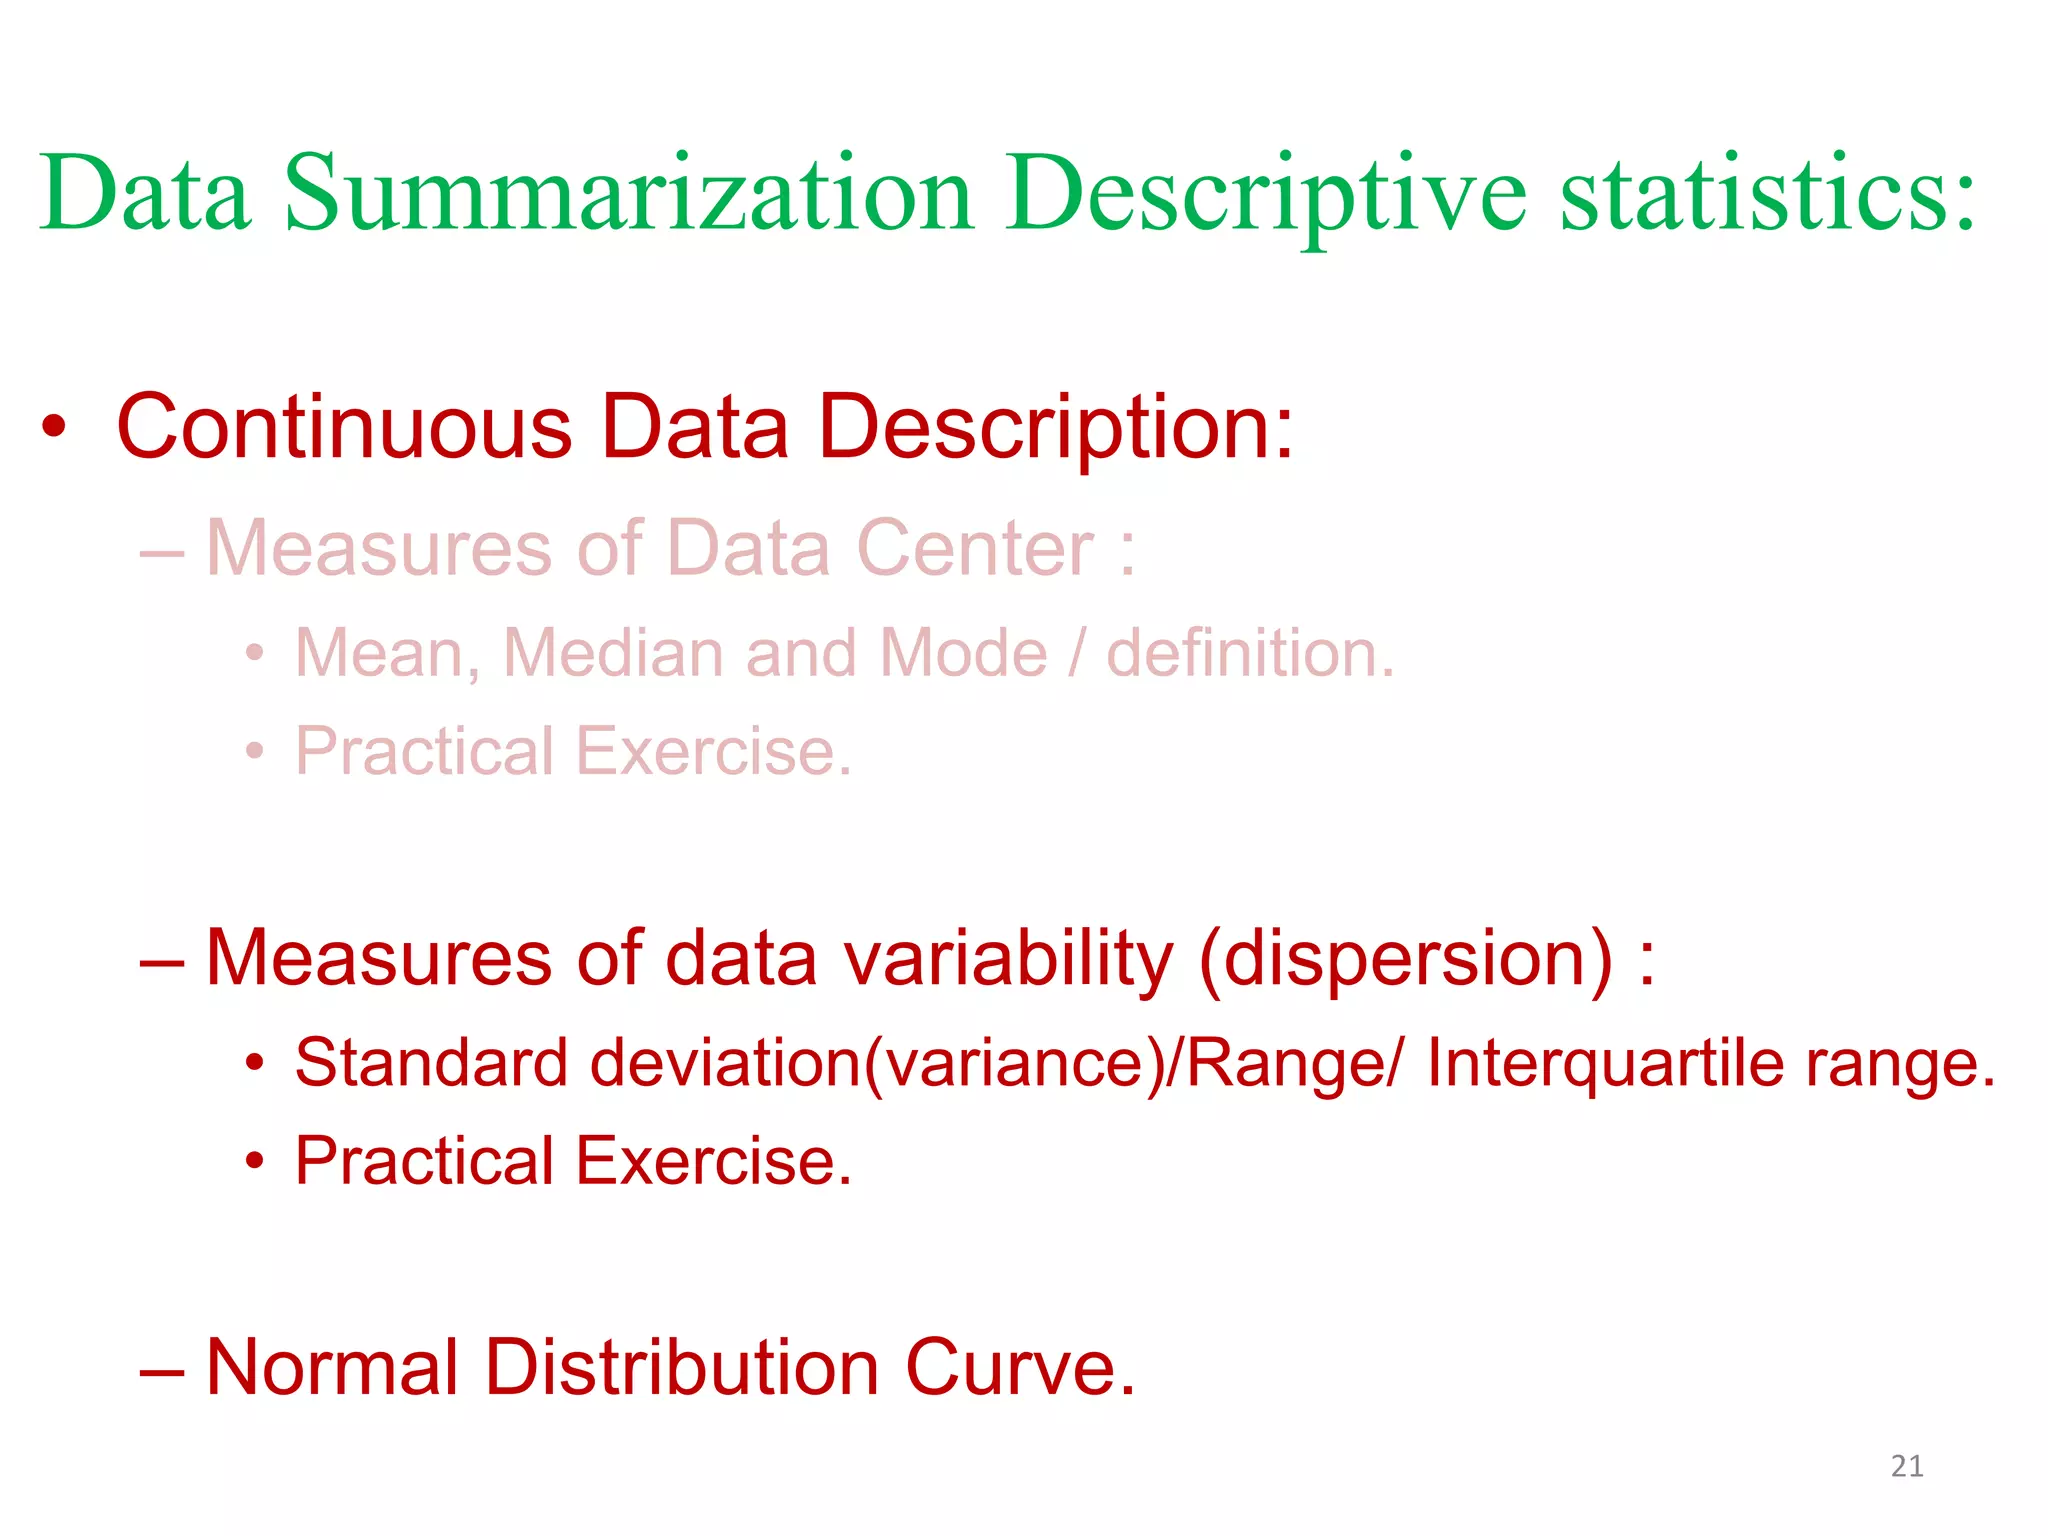
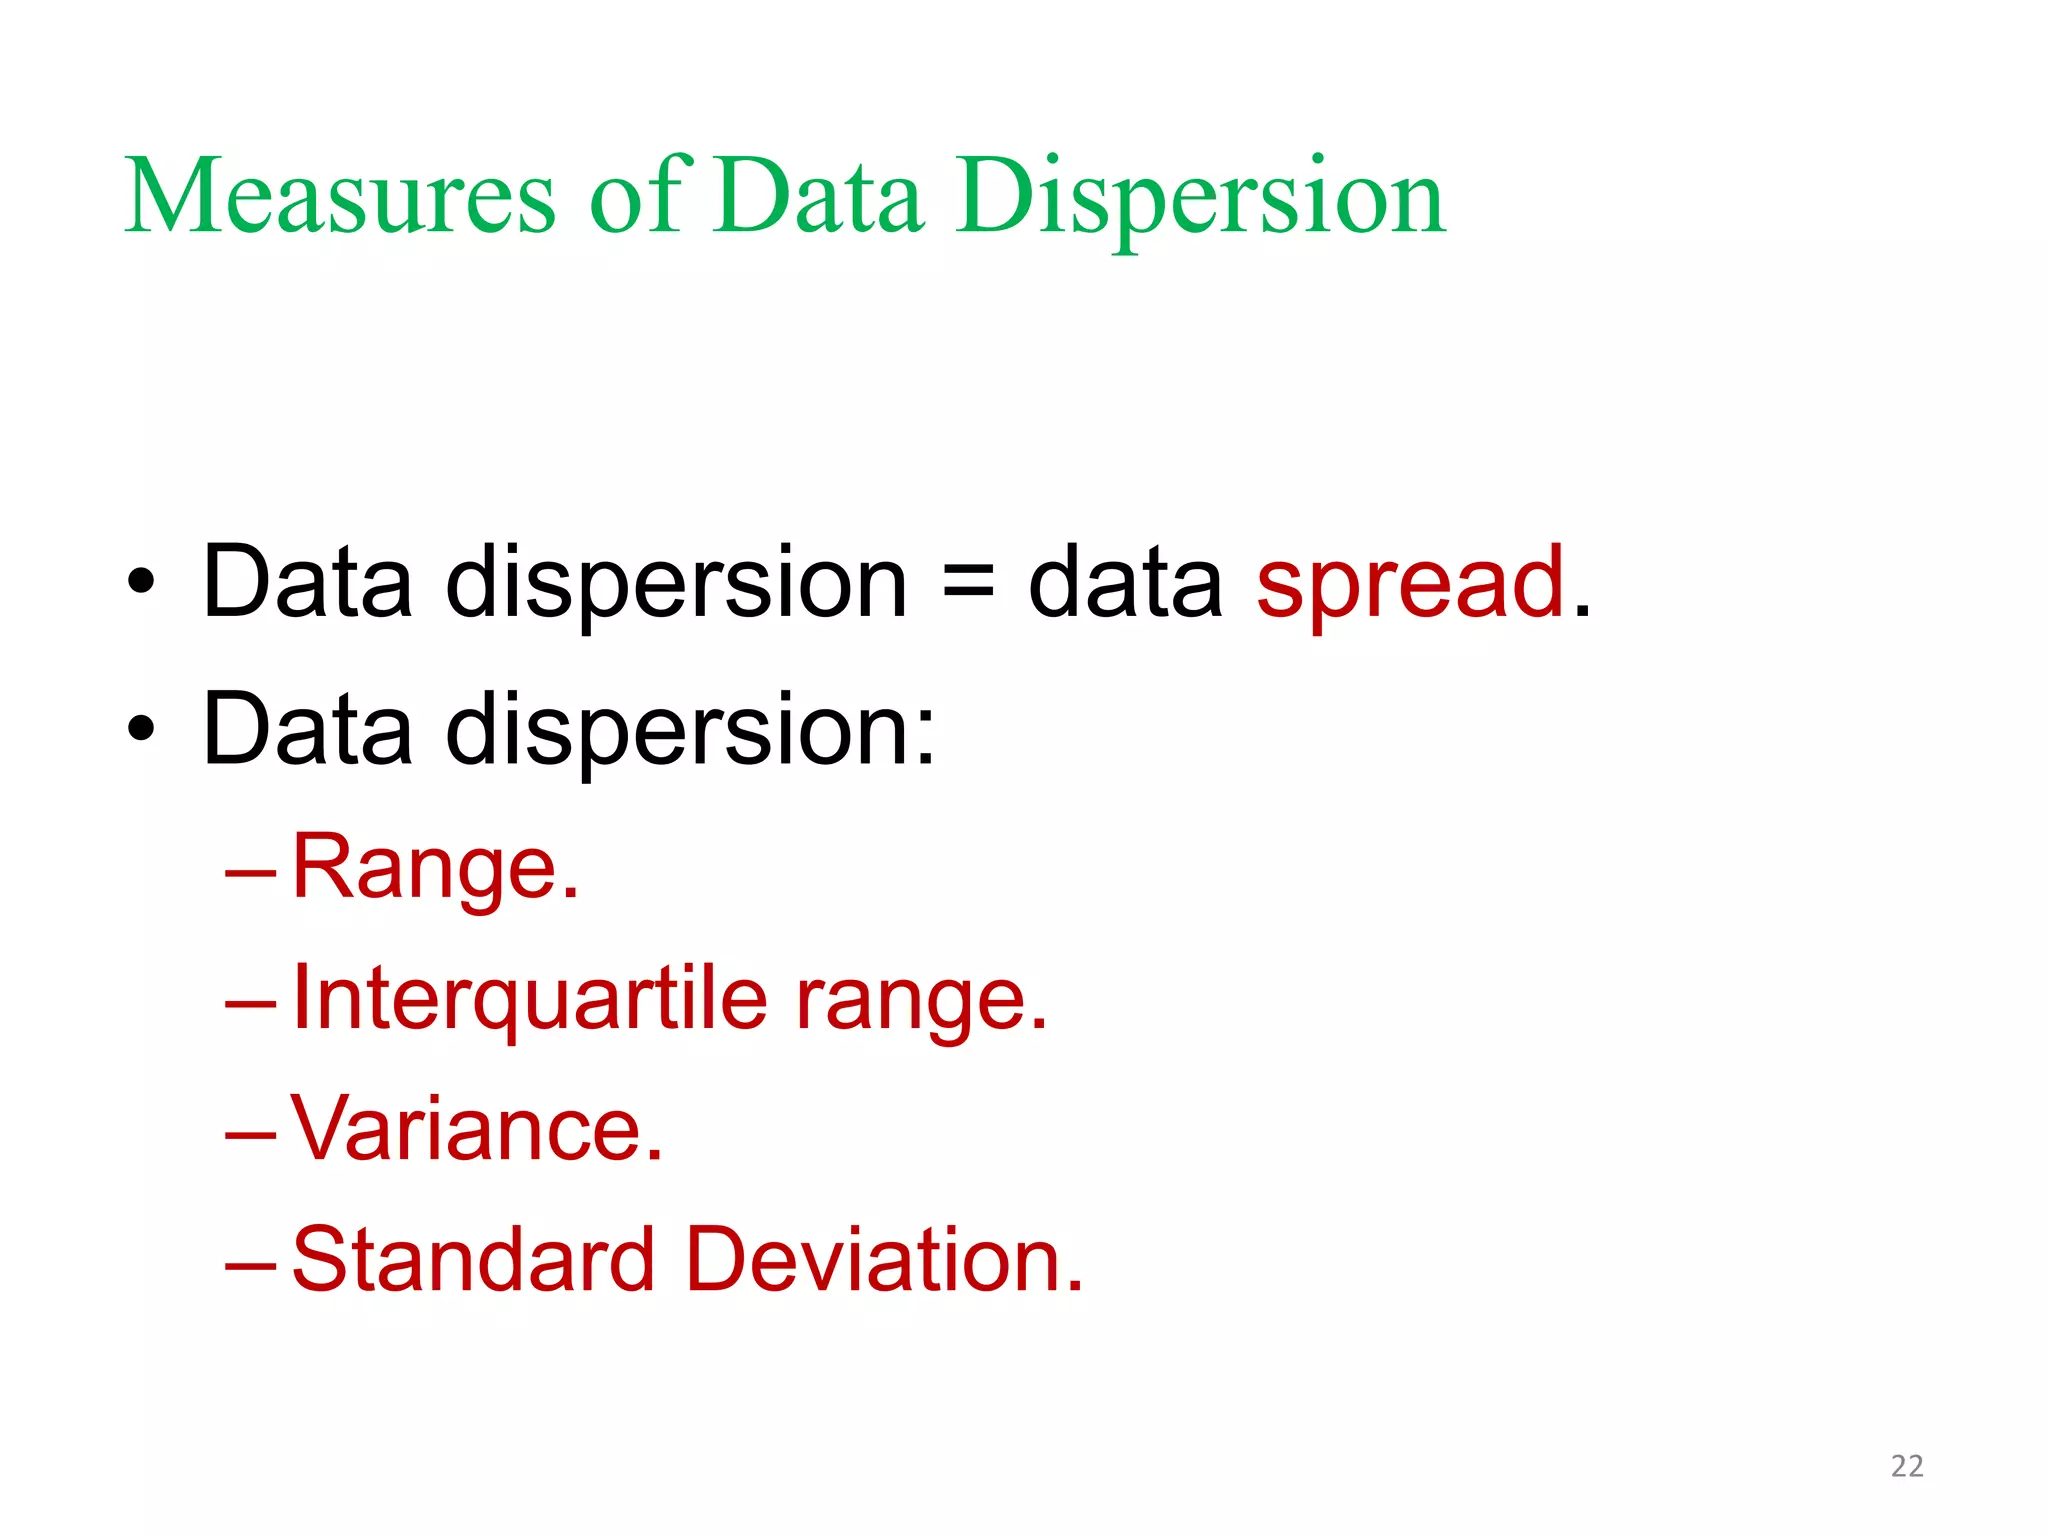
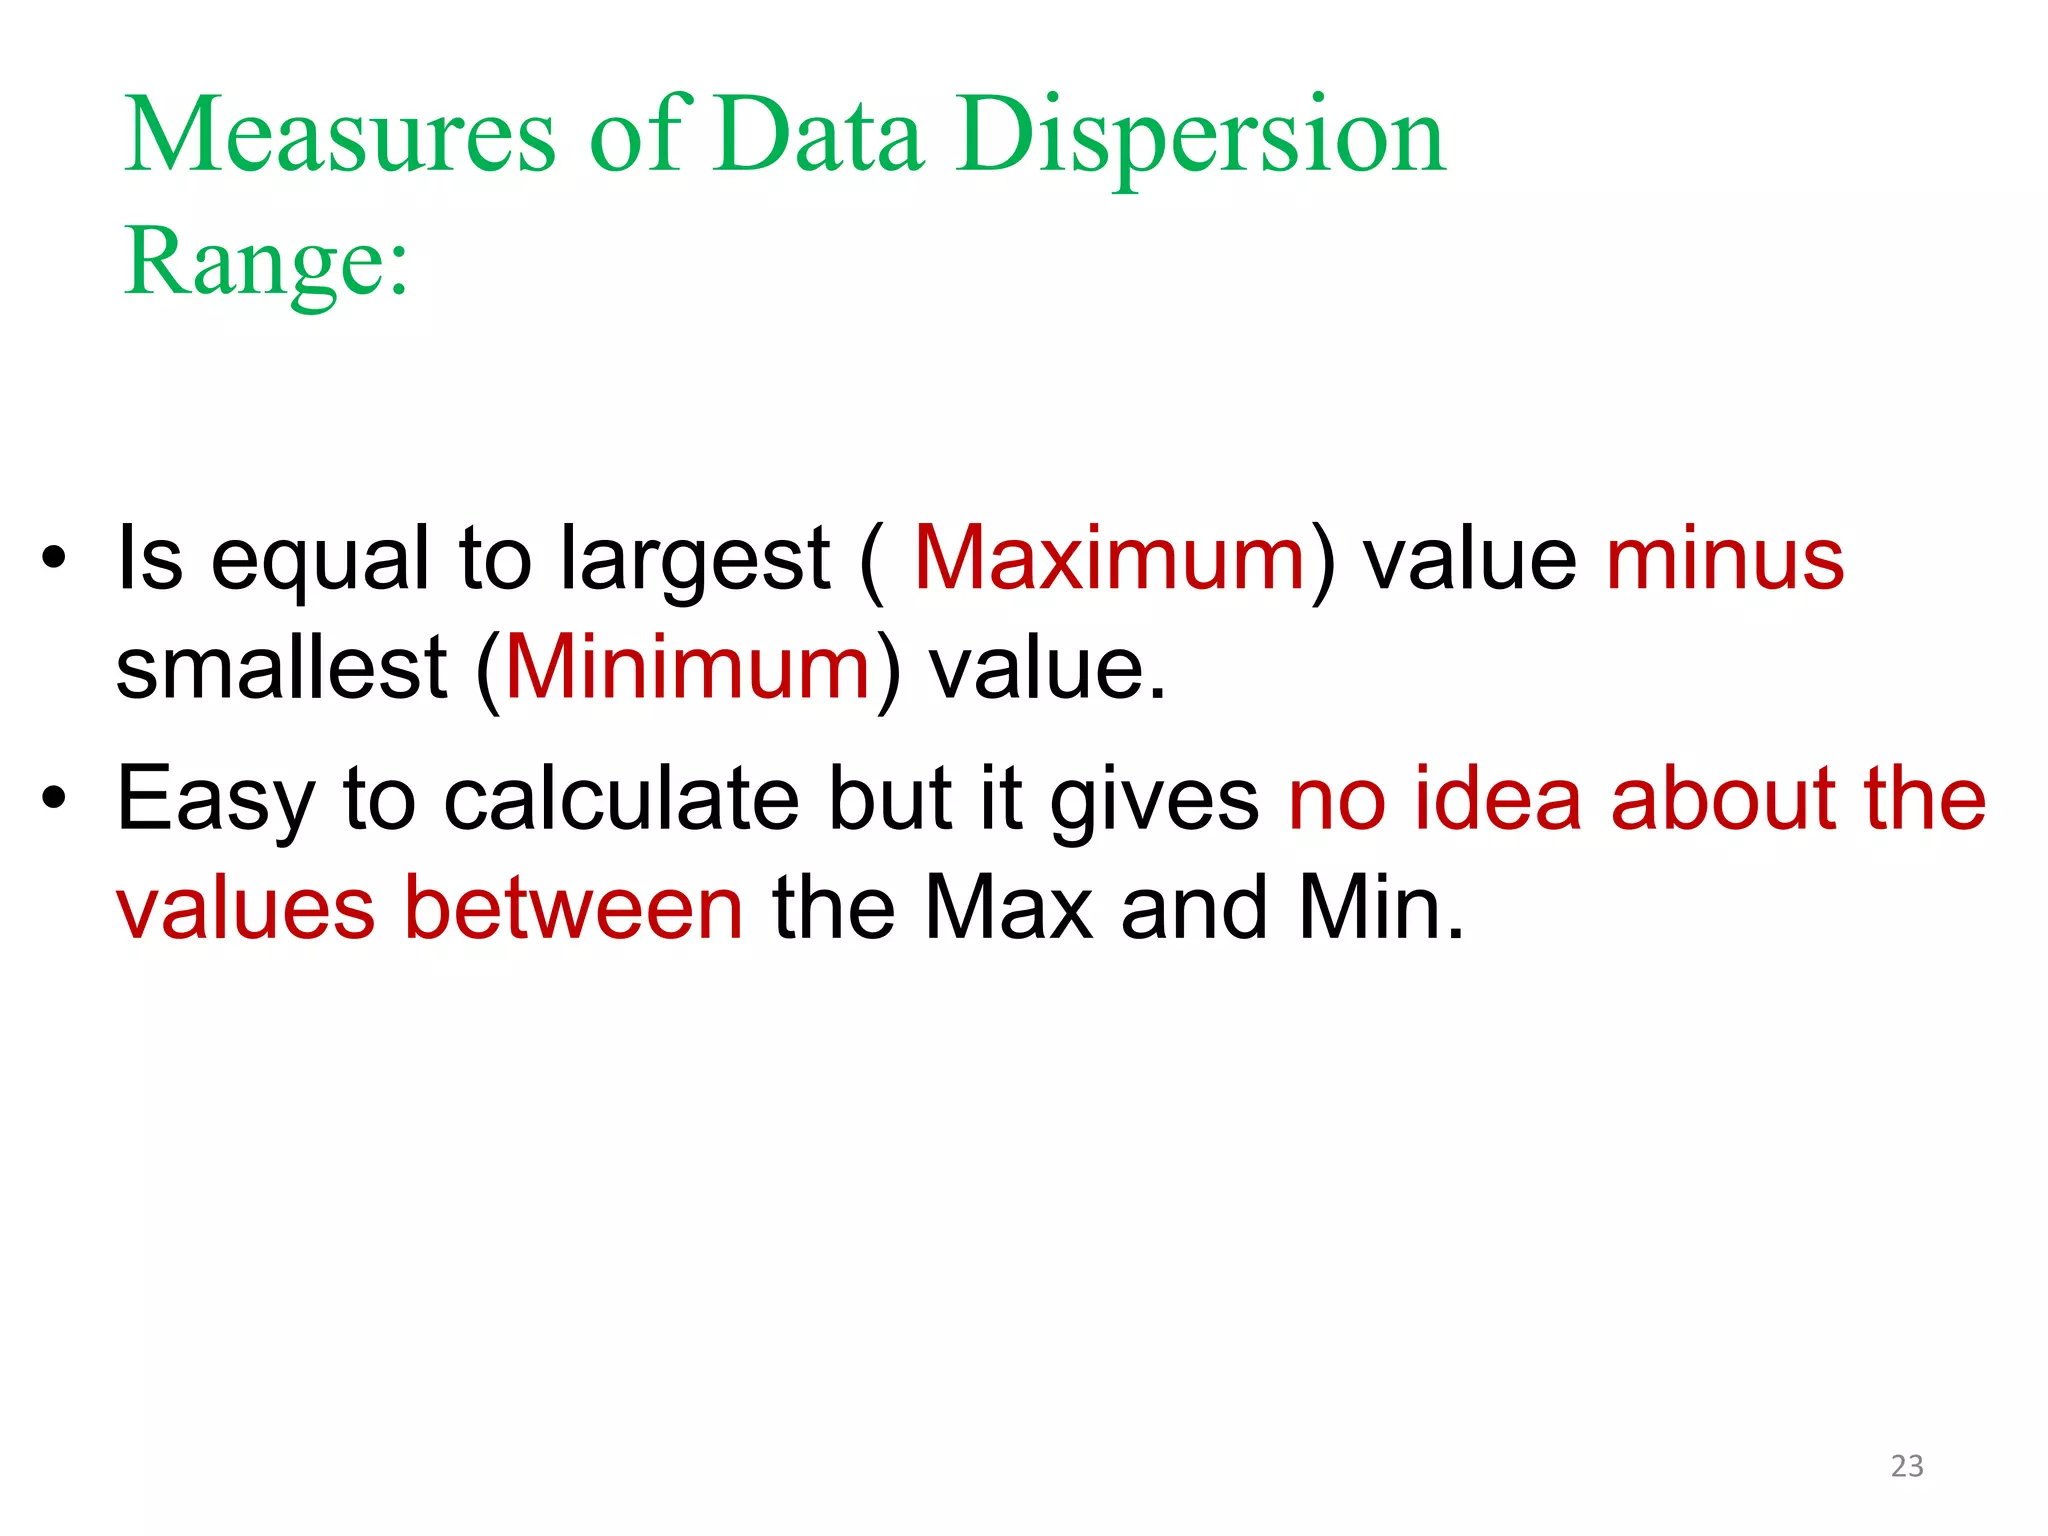
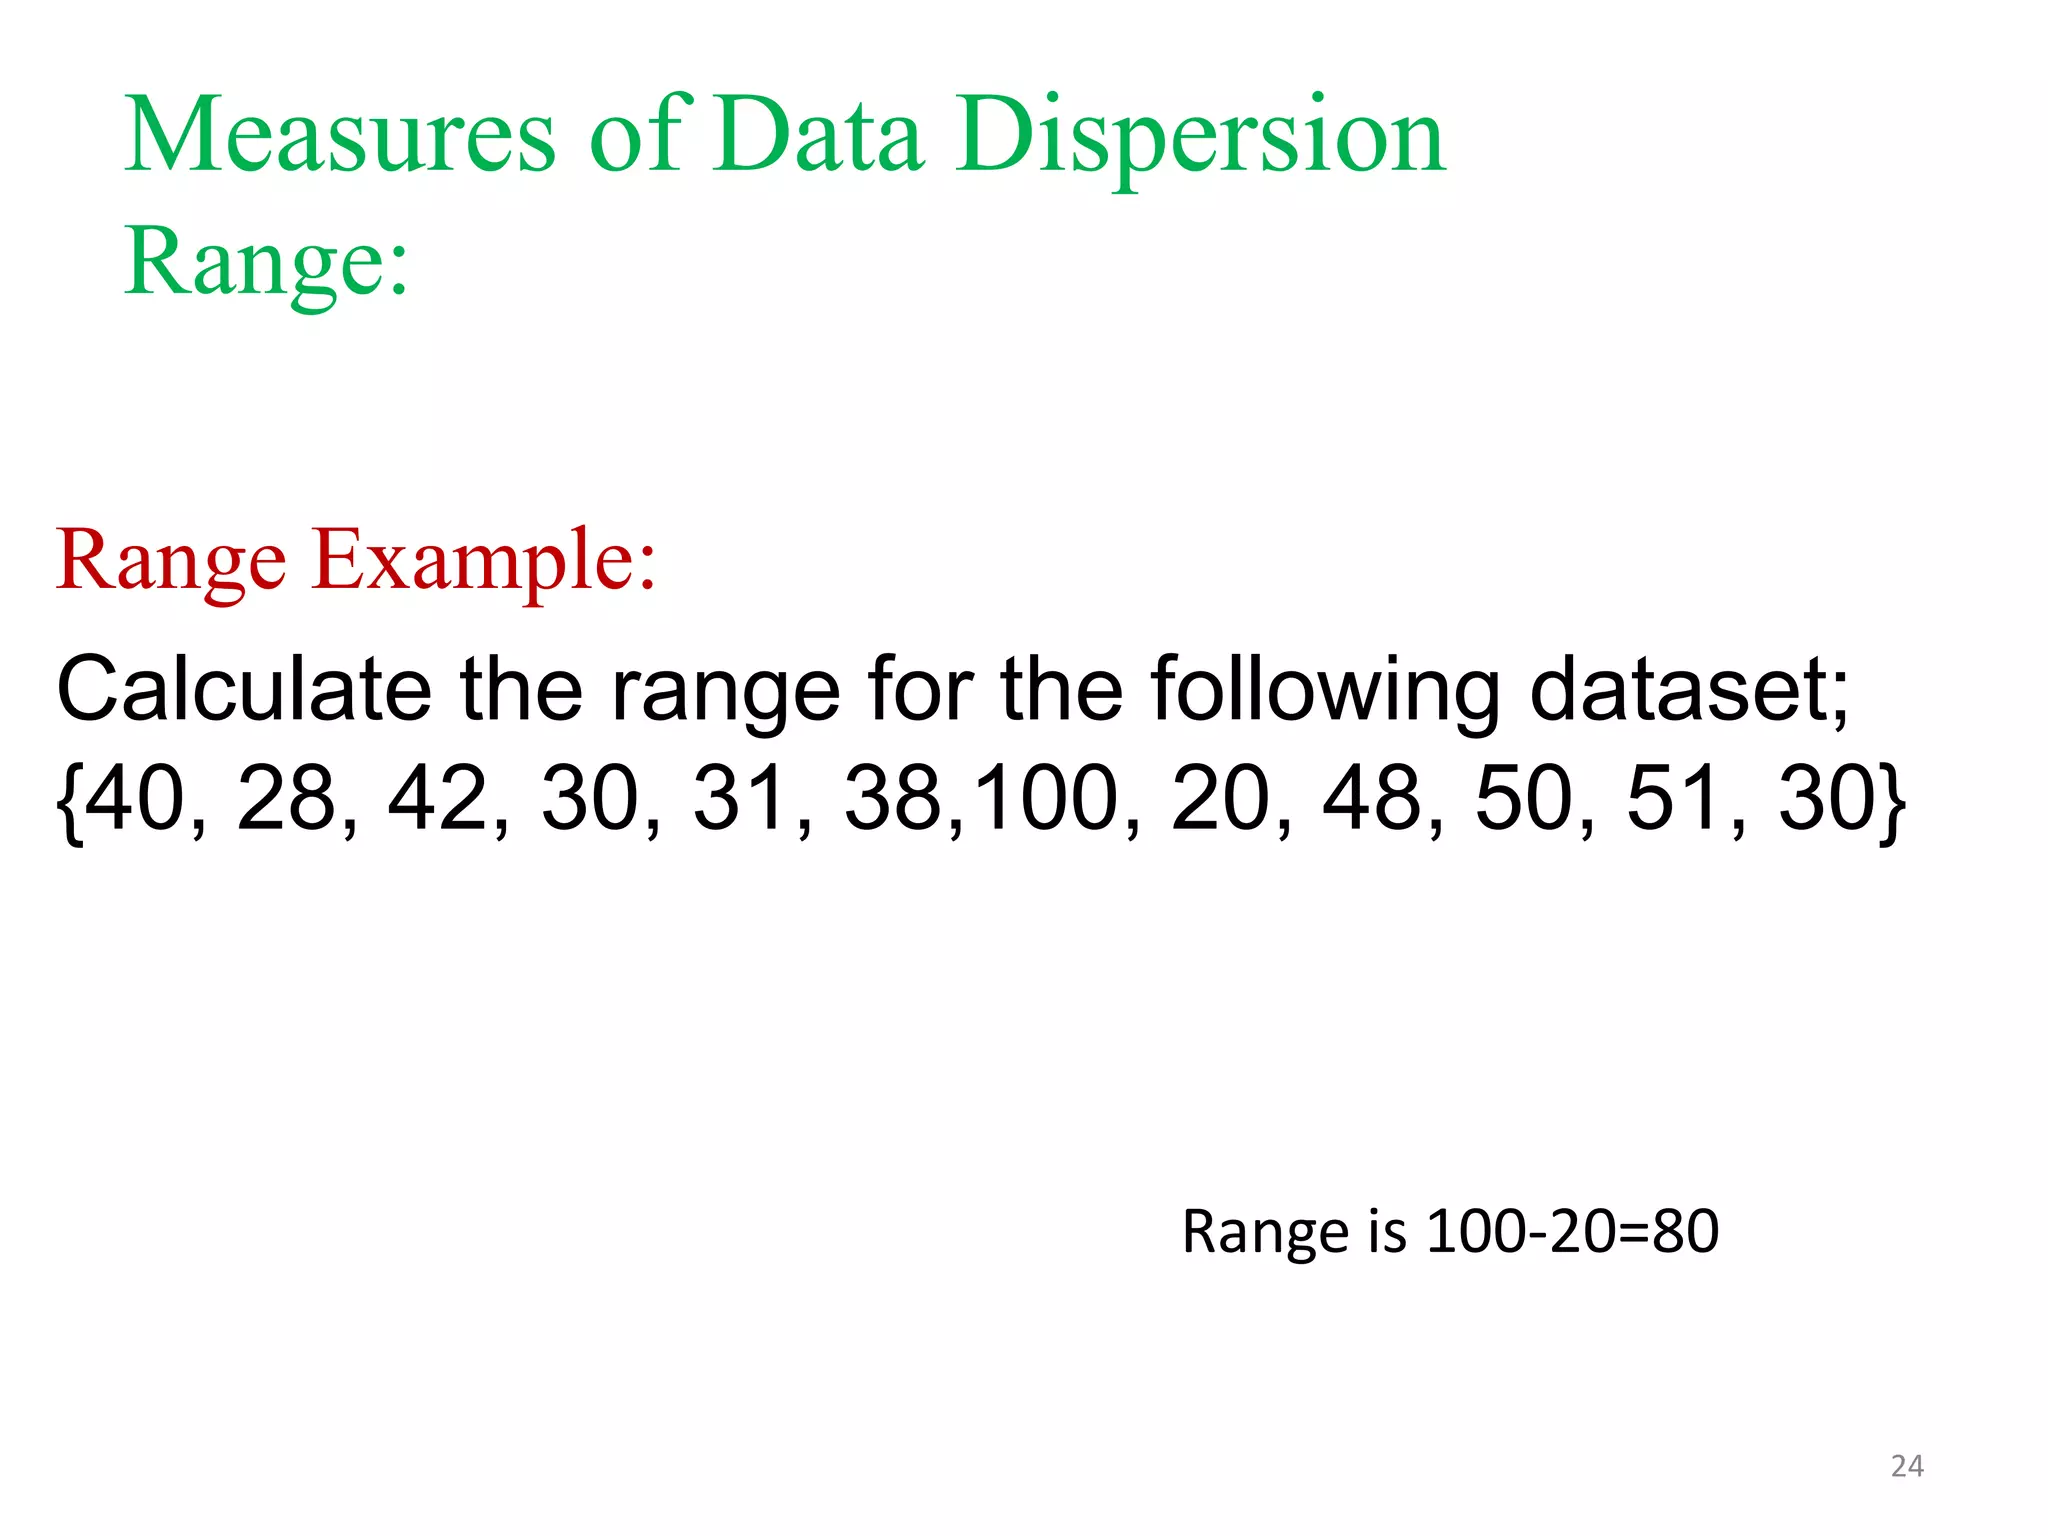
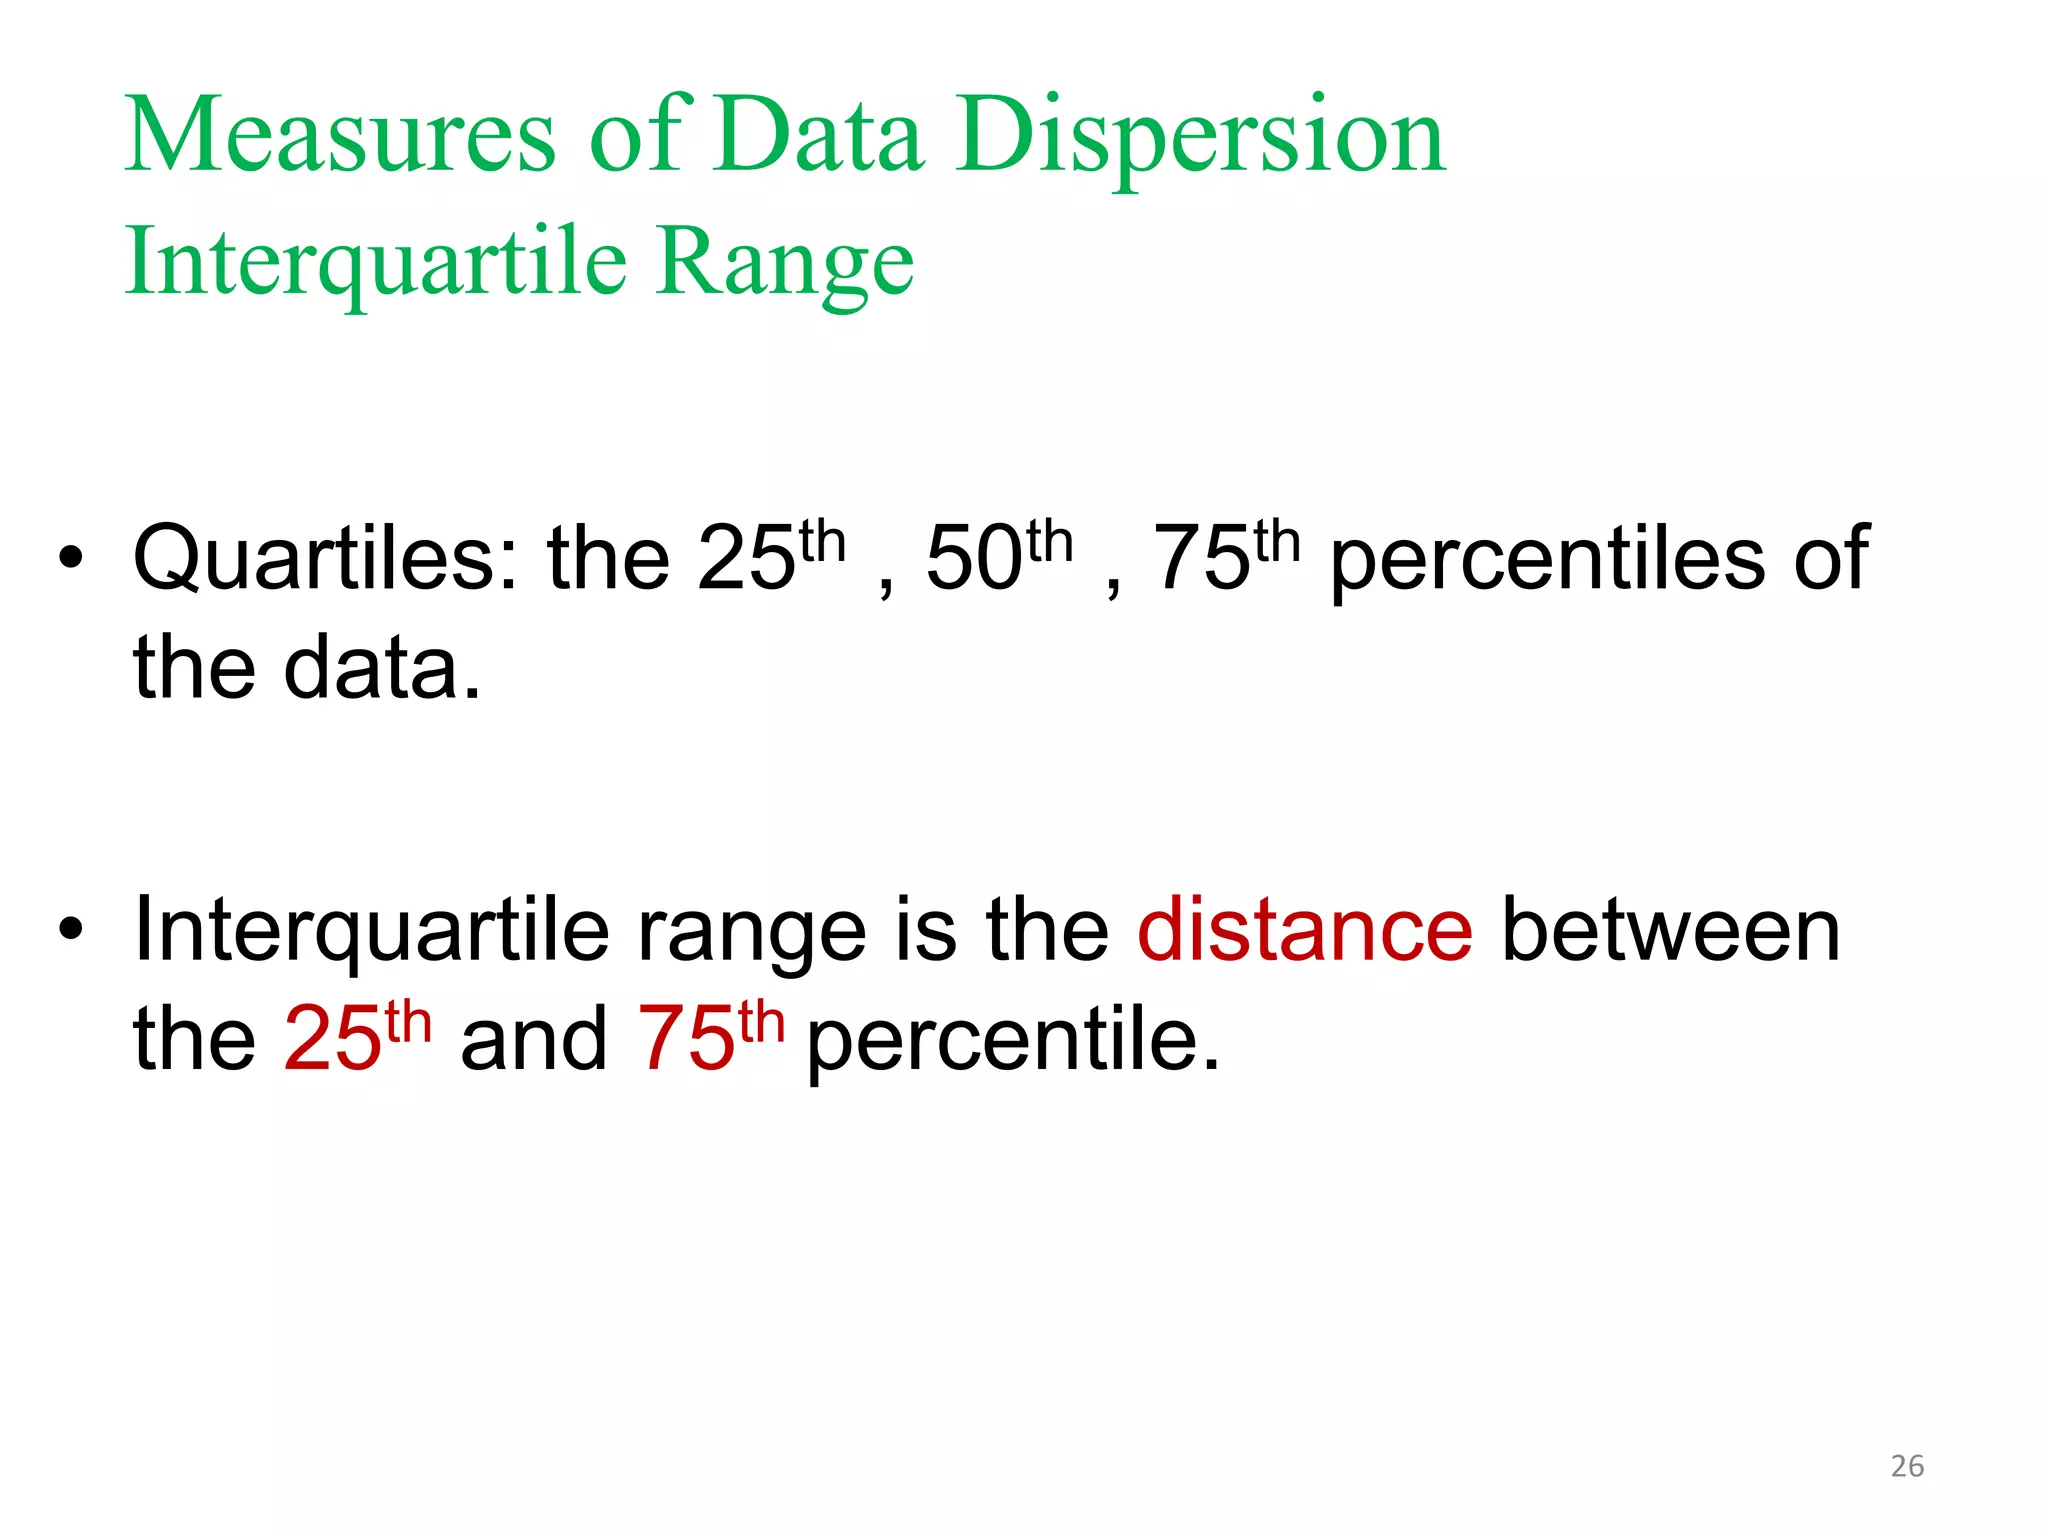
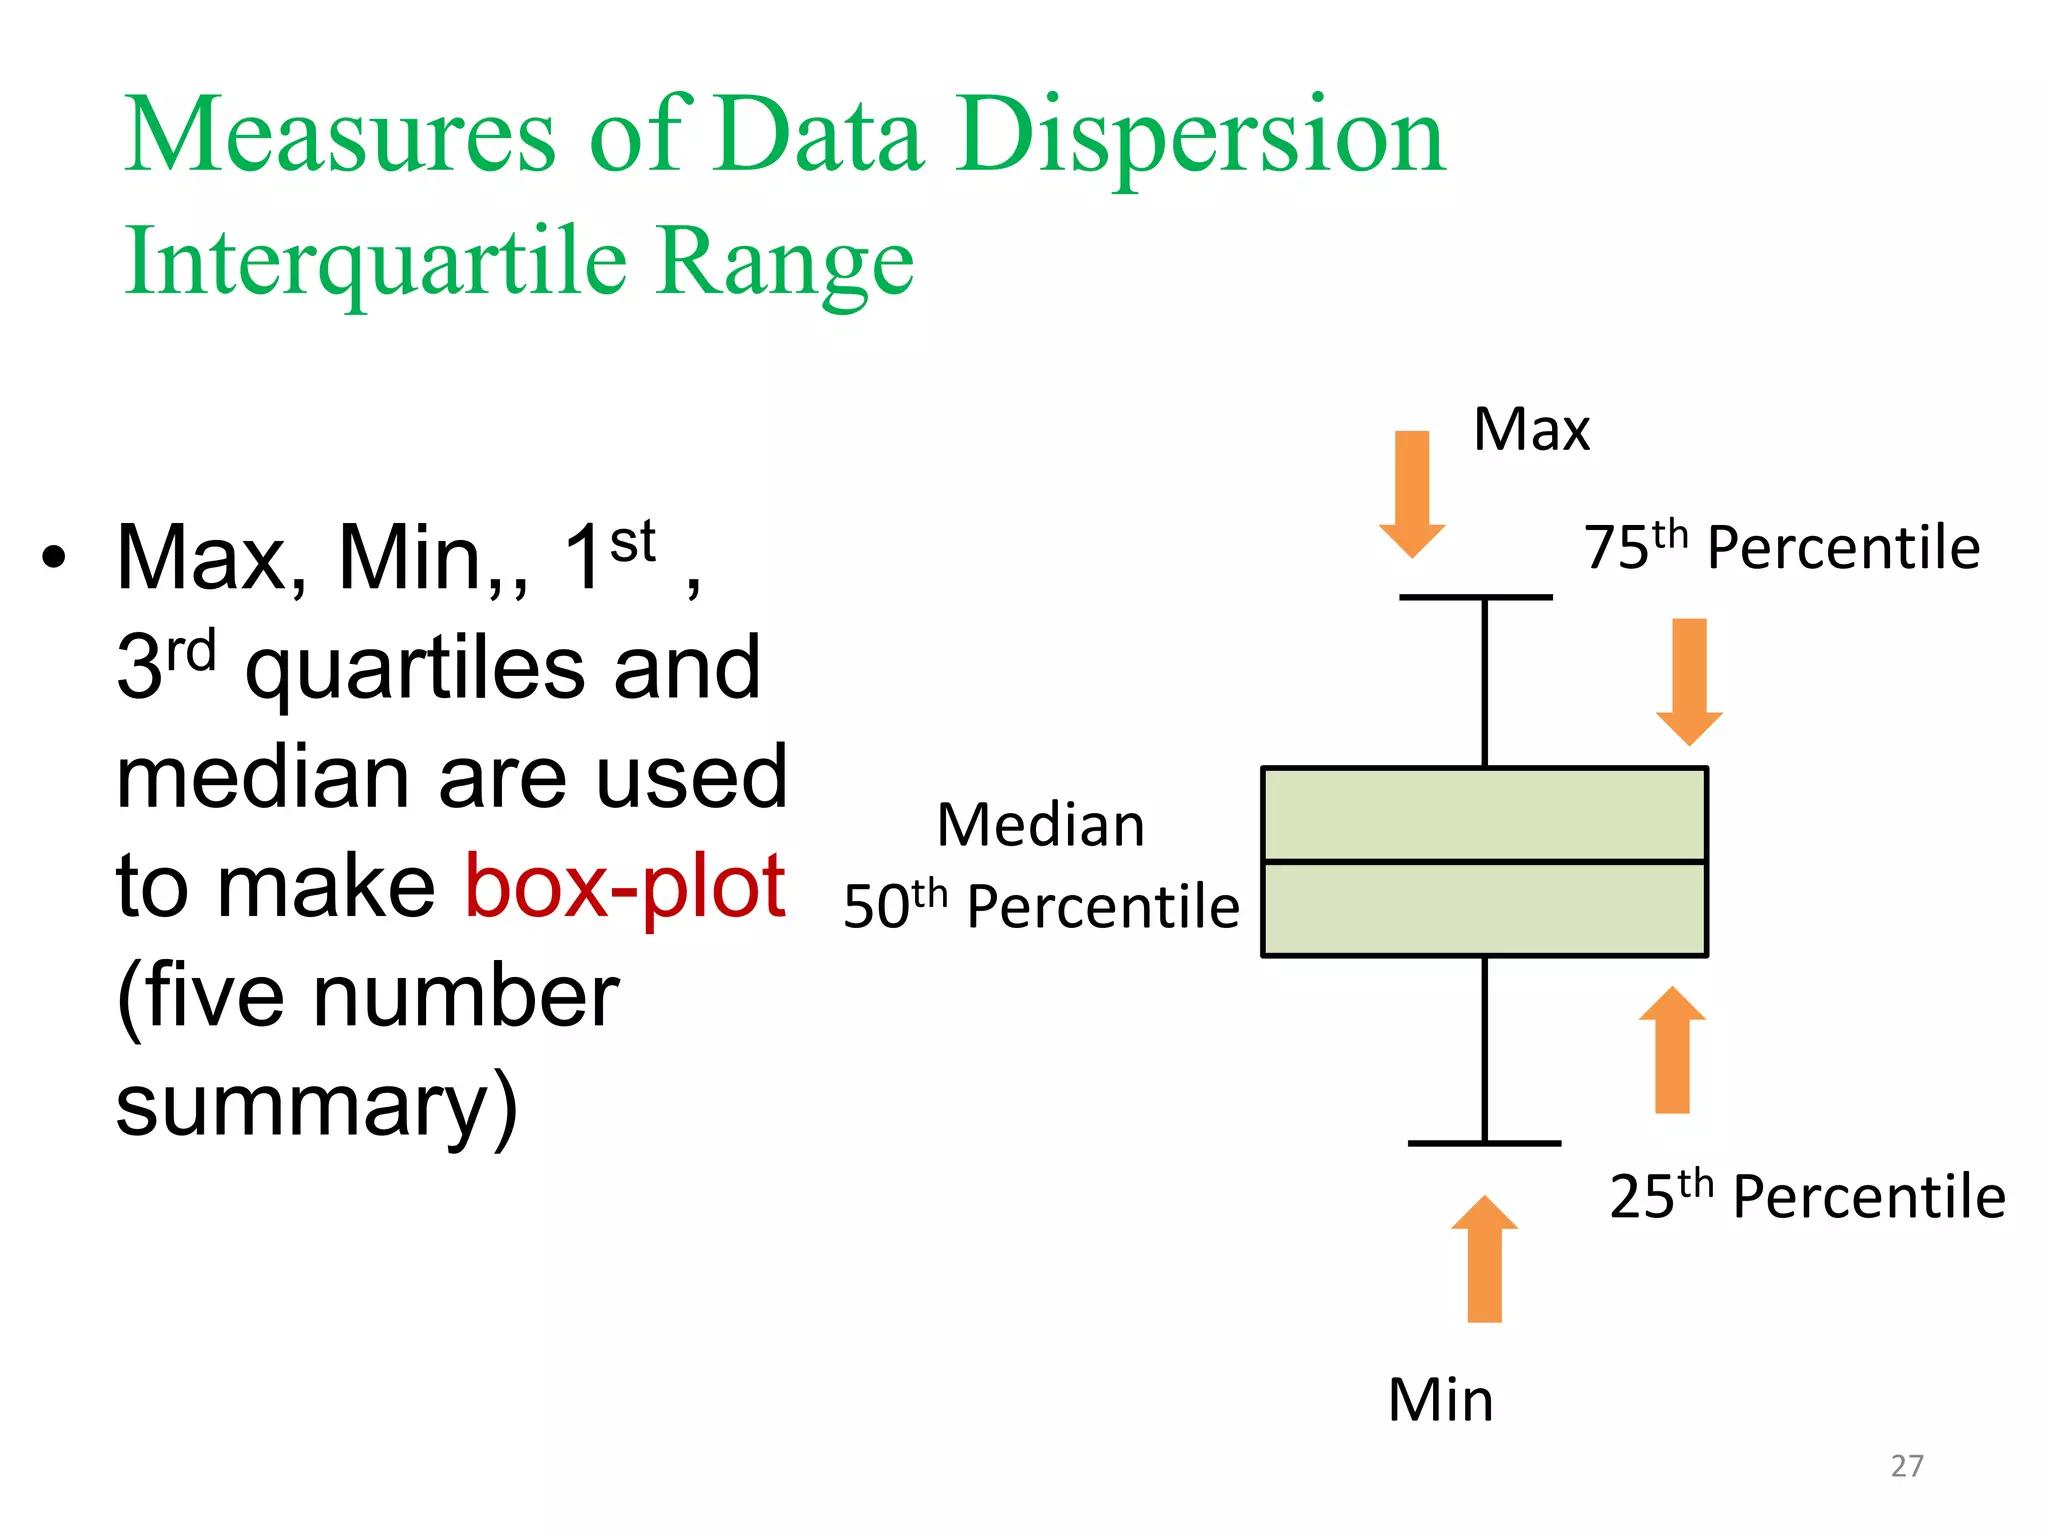
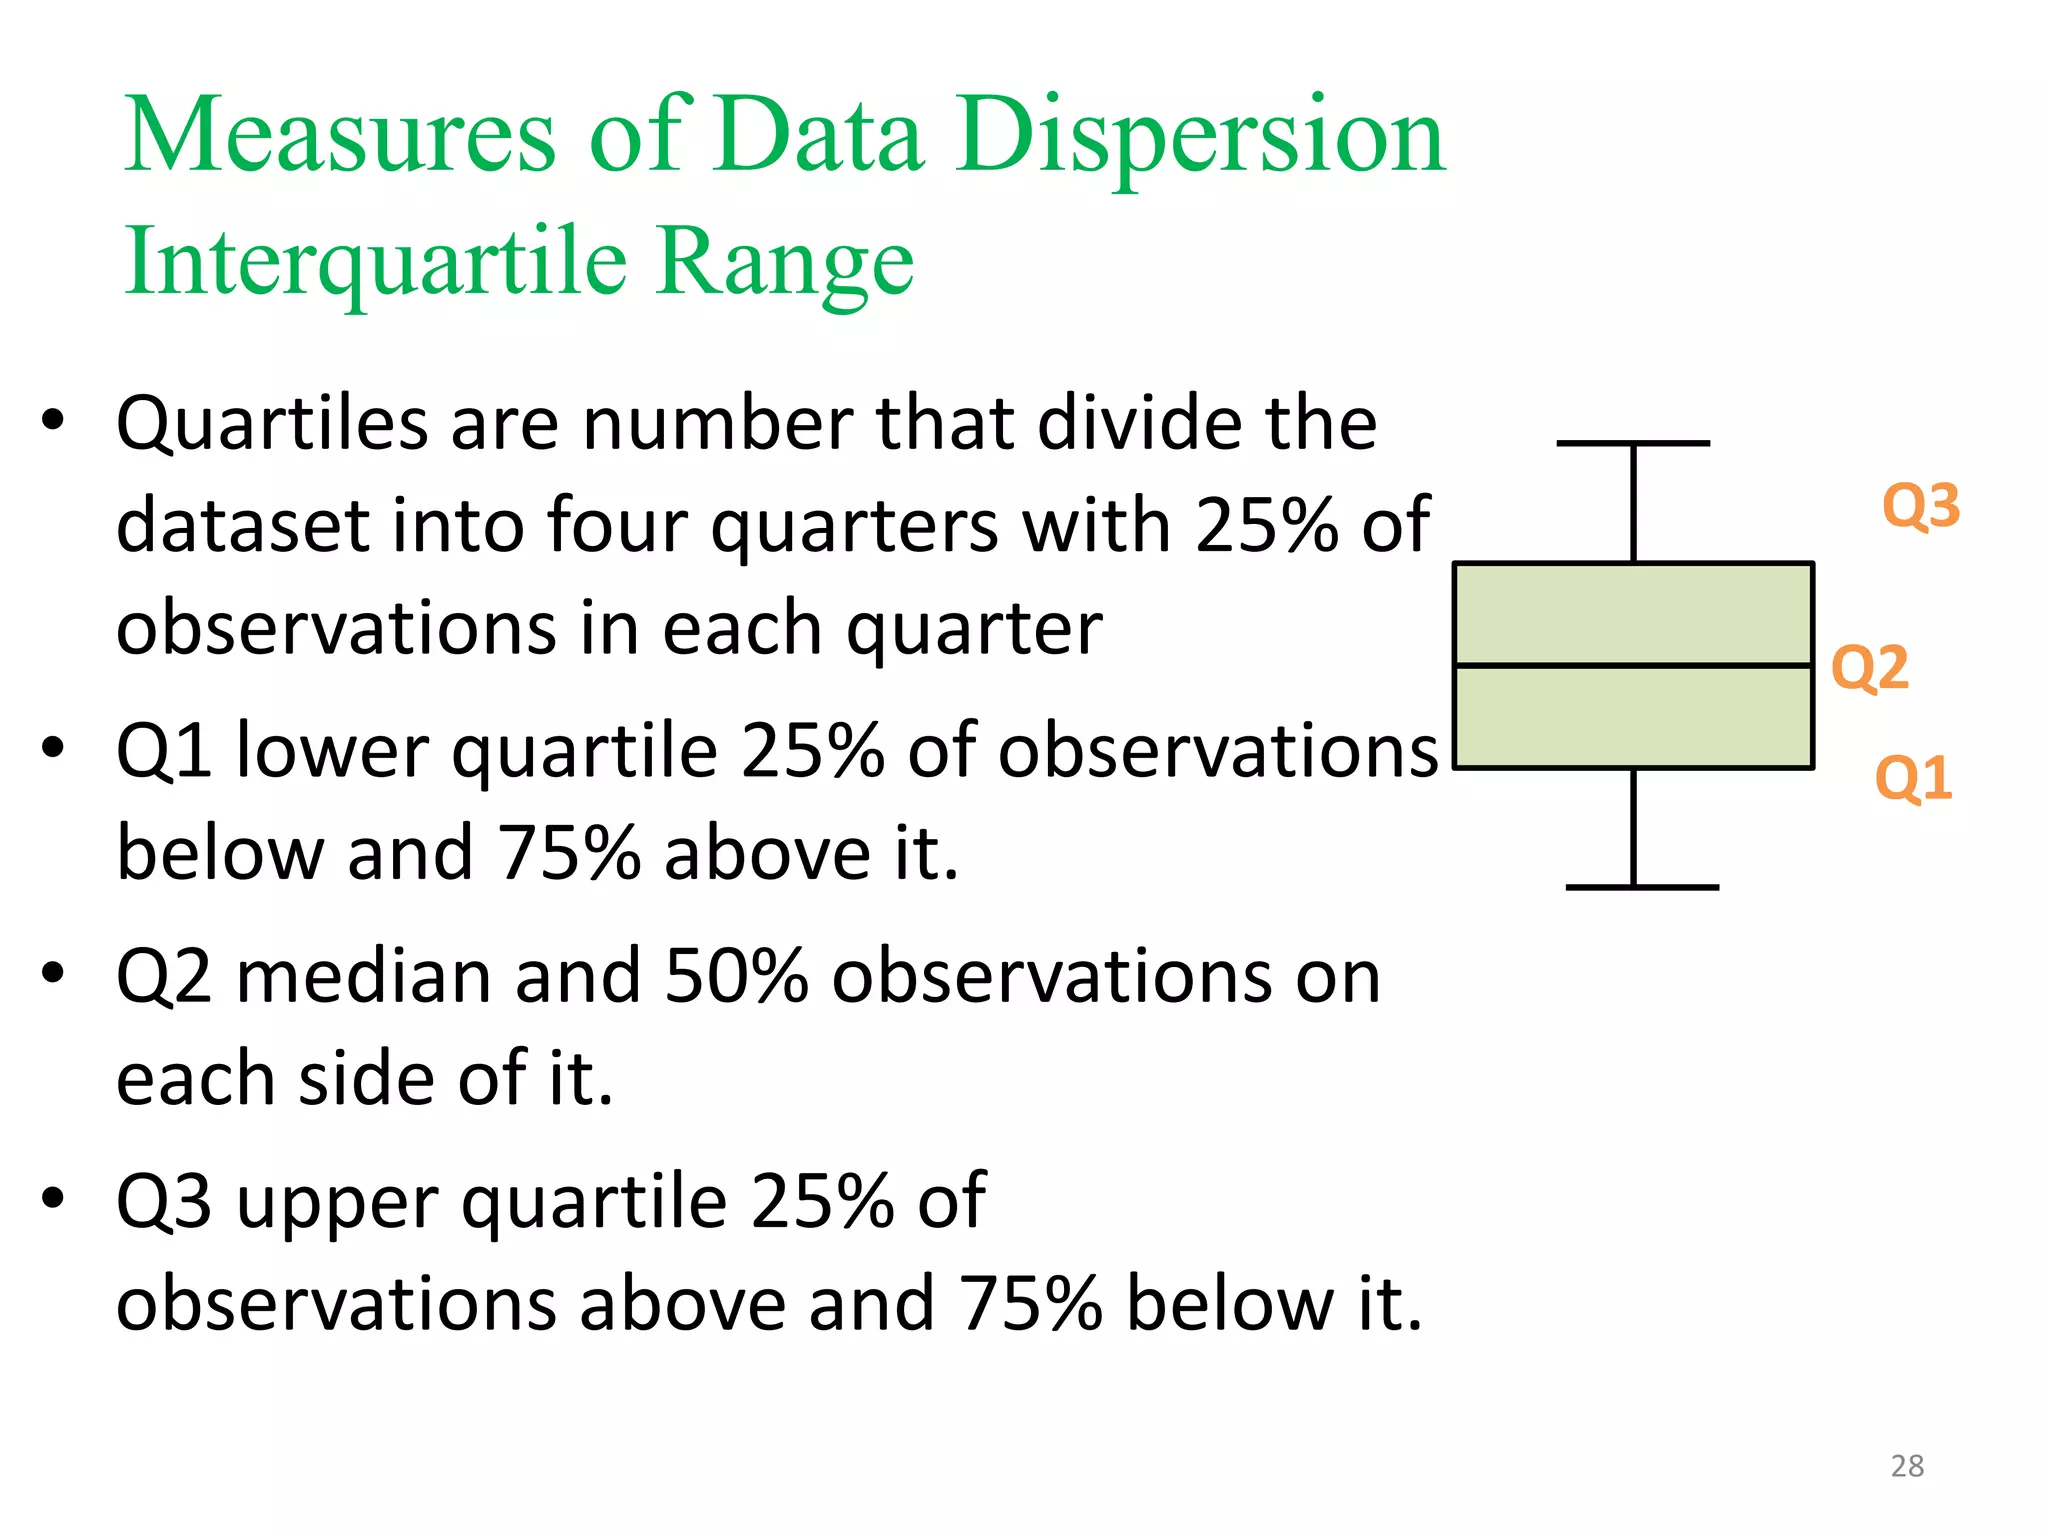
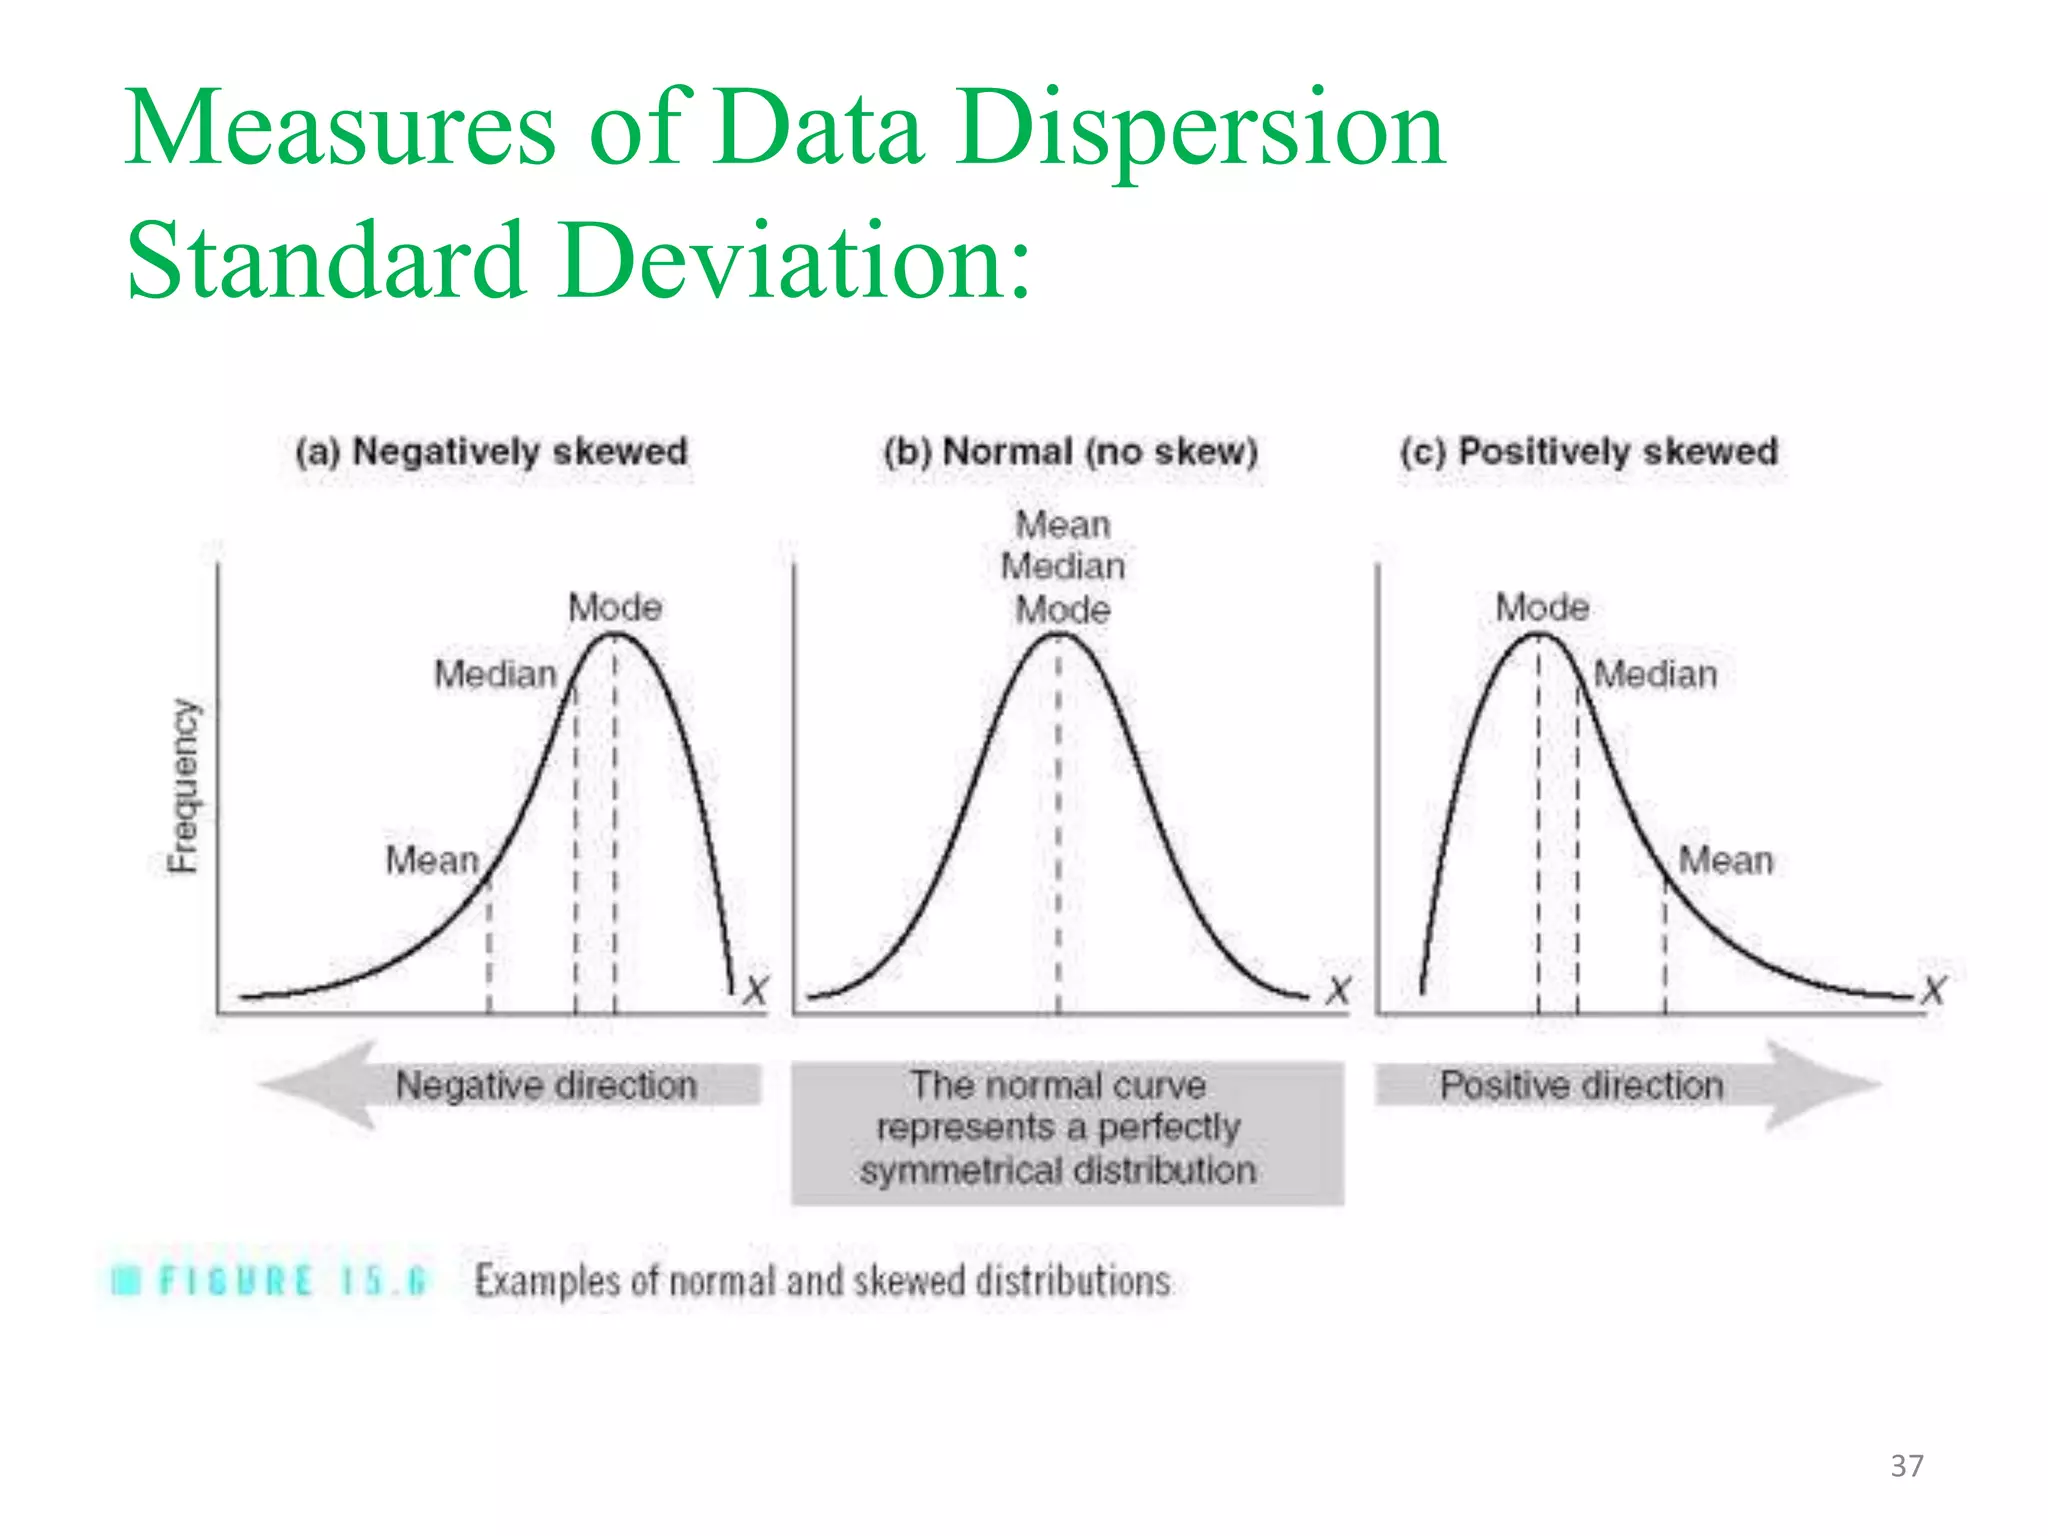
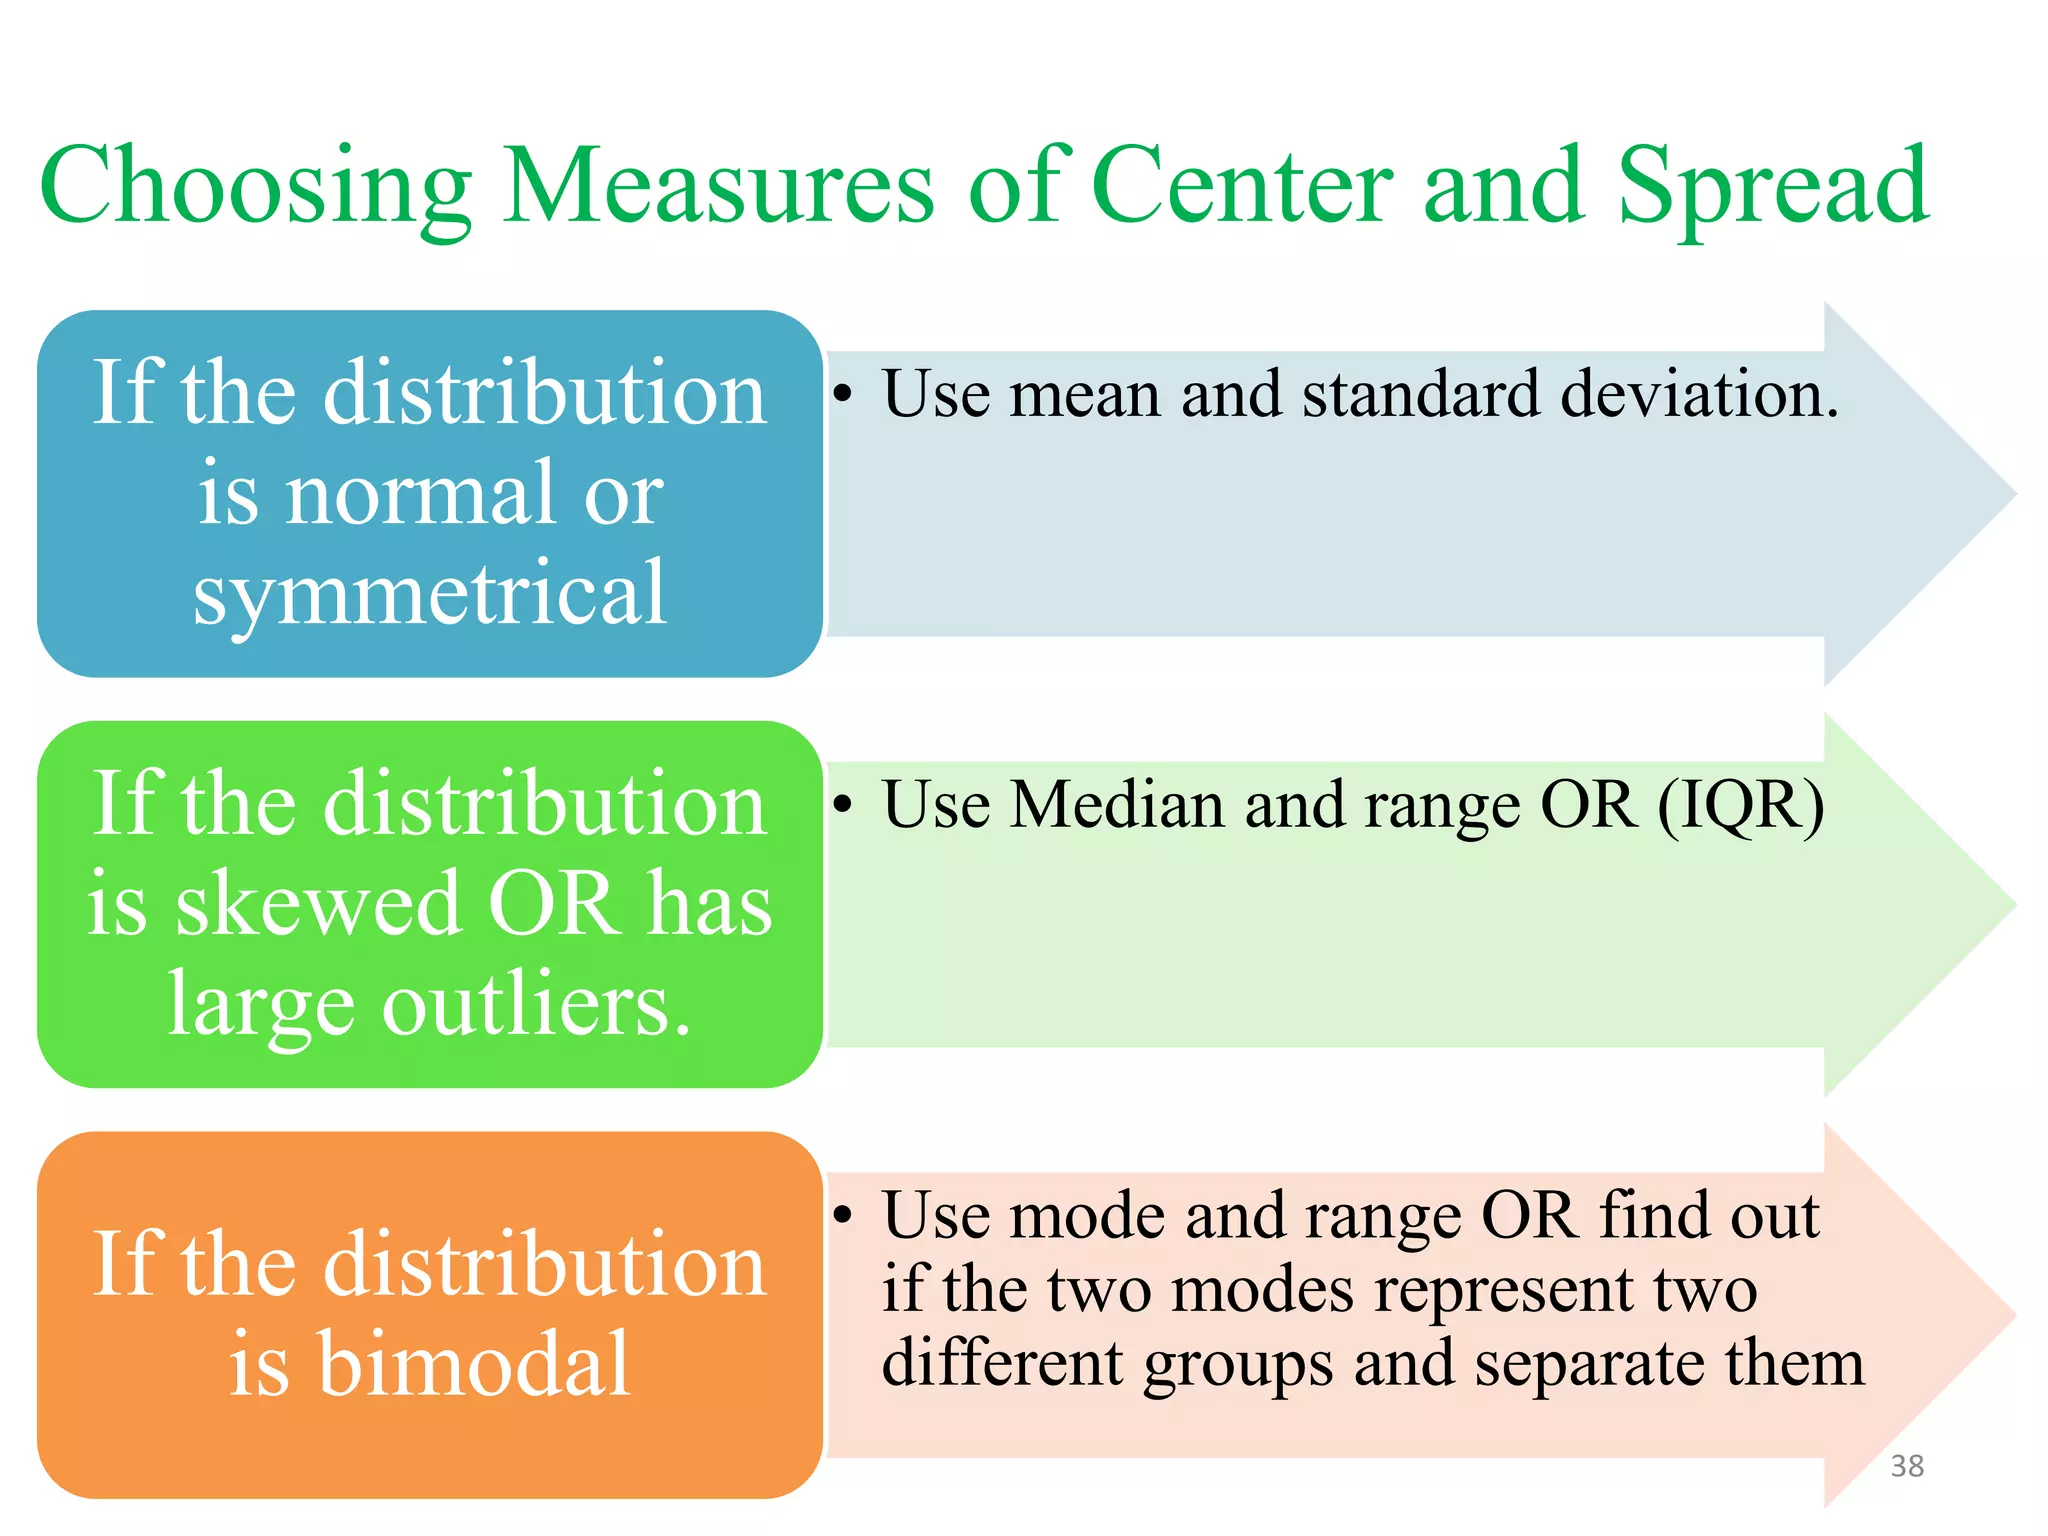
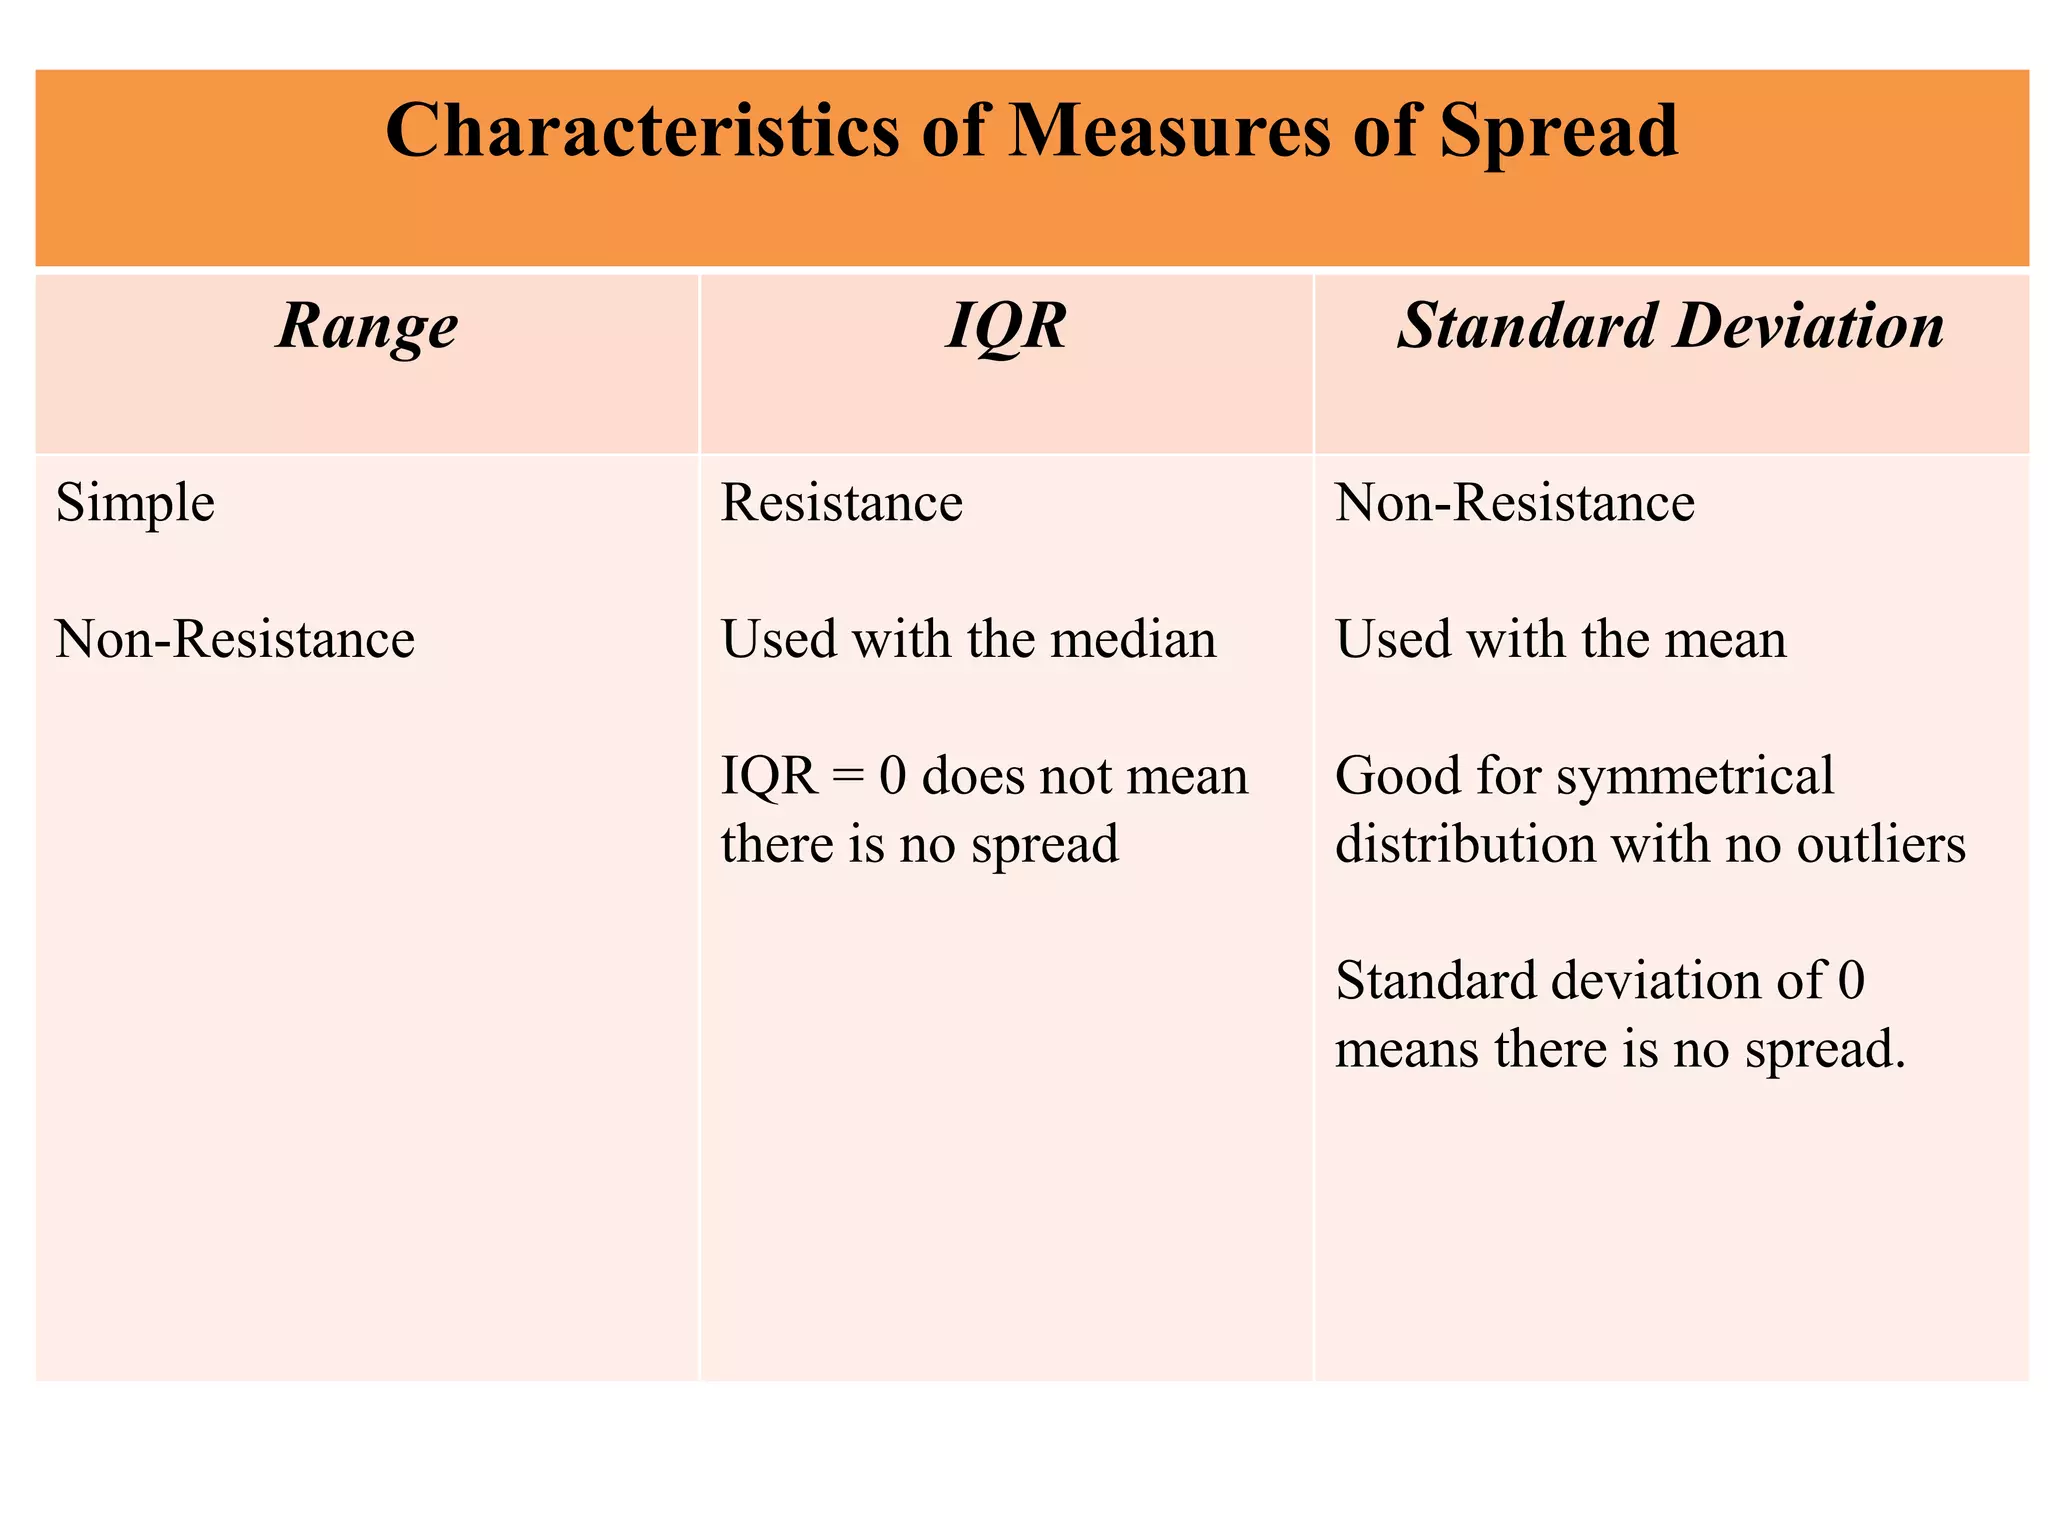
Prepared By: Dr.Anees AlSaadi
Community Medicine Department
December 2013
1
Data Summarization Descriptive statistics:
• Continuous Data Description:
– Measures of Data Center :
• Mean, Median and Mode / definition.
• Practical Exercise.

– Measures of data variability:
• Standard deviation(variance)/ Range.
• Practical Exercise.

– Normal Distribution Curve.
2
Measures of Center:
• Synonyms:
– Measure of central tendency.
– Measures of location.

• Identification of the center of the distribution
of observations OR the middle or average or
typical value.
3
Measures of Center:
Mean

• Arithmetic average for all
observations.

Median

• The middle observation of
ordered data.

Mode

• Most frequently observed
value(s)
4
Measures of Center:
Sample Mean:
• The most commonly used
measure of location.
• Called Arithmetic average.

5
Measures of Center:
How to Calculate Sample Mean:
• Add up data, then
divided by sample
size (n).
• (n) is the number of
observations.

6
Measures of Center:
How to Calculate
Sample Mean Example:
These are systolic blood
pressure in (mmHg)
120,80,90,110,95.
X1 =120, X2 =80 … X5 =95
Mean is calculated by adding up
the five vales and dividing by 5.
7
Measures of Center:
How to Calculate Sample Mean
‾

X= 120+80+90+110+95/5= 99mmHg.

8
Measures of Center:
Sample Mean Example:
Calculate the sample mean for number of open heart
surgeries done by 7 cardiothoracic surgeons in
Hamad hospital during last moth. Where, Dr.A did 4,
Dr.B 3, Dr.C 6, Dr.D 5, Dr. E 4, Dr. F 3 and Dr.G 5.

4.28 surgeries.
9
Measures of Center:
Sample Mean Example:

The most important feature of the mean is
sensitivity to the extreme values (outlier)

10
Measures of Center:
Sample Median

Is the middle number also called 50th
percentile.

11
Measures of Center:
How to Identify Sample Median

• Order observations from smallest to largest.
• Find the observation in the middle of the data.
• Median is the observation in the middle.

12
Measures of Center:
How to Identify Sample Median
Sample Median Example:
Identify the median for the following set of
observations:
– 90,80, 200,95, 110.
95

13
Measures of Center:
How to Identify Sample Median
Sample Median Example:
• Identify the median for the following set of
observations:
– 90, 80, 120, 95, 125, 110.
Position n+1/2

102

14
Measures of Center:
Sample Median Features:

Not affected by the extreme values.
Less efficient to summarize the data statistically.

15
Measures of Center:
Sample Mode
• The most commonly occurring value in
dataset.
• Not all datasets have a mode.
• Unimodal distribution: one mode in the
dataset.
• Bimodal distribution: two modes in the dataset.

16
Measures of Center:
How to Identify Sample Mode

• Arrange the data from small to greater values.
• The most commonly / repeated value is the
sample mode.

17
Measures of Center:
How to Calculate Sample Median
Sample Mode Example:
{15, 33, 65, 32, 78, 94, 33, 110, 11, 46, 33}
{11, 15, 32, 33, 33, 33, 46, 65, 78, 94, 110}
Mode is 33

18
Measures of Center:
Sample Mode Feature

Not affected by the extreme values.
Less efficient to summarize the data statistically.

19
Practical Exercise
This dataset is the number of hysterectomy
performed by female doctors in HMC;
{44, 37, 86, 50, 20, 25, 28, 25, 31, 33, 85, 59,
27, 34, 36}
find the mean, median and mode?

20
Data Summarization Descriptive statistics:
• Continuous Data Description:
– Measures of Data Center :
• Mean, Median and Mode / definition.
• Practical Exercise.

– Measures of data variability (dispersion) :
• Standard deviation(variance)/Range/ Interquartile range.
• Practical Exercise.

– Normal Distribution Curve.
21
Measures of Data Dispersion
• Data dispersion = data spread.
• Data dispersion:
– Range.
– Interquartile range.
– Variance.
– Standard Deviation.
22
Measures of Data Dispersion
Range:
• Is equal to largest ( Maximum) value minus
smallest (Minimum) value.
• Easy to calculate but it gives no idea about the
values between the Max and Min.

23
Measures of Data Dispersion
Range:
Range Example:
Calculate the range for the following dataset;
{40, 28, 42, 30, 31, 38,100, 20, 48, 50, 51, 30}

Range is 100-20=80

24
Measures of Data Dispersion
Range Feature:

Range is affected by the extreme of values.

25
Measures of Data Dispersion
Interquartile Range
• Quartiles: the 25th , 50th , 75th percentiles of
the data.
• Interquartile range is the distance between
the 25th and 75th percentile.

26
Measures of Data Dispersion
Interquartile Range
Max

• Max, Min,, 1st ,
3rd quartiles and
median are used
to make box-plot
(five number
summary)

75th Percentile

Median
50th Percentile

25th Percentile
Min
27
Measures of Data Dispersion
Interquartile Range
• Quartiles are number that divide the
dataset into four quarters with 25% of
observations in each quarter
• Q1 lower quartile 25% of observations
below and 75% above it.
• Q2 median and 50% observations on
each side of it.
• Q3 upper quartile 25% of
observations above and 75% below it.

Q3
Q2
Q1

28
Measures of Data Dispersion
How to Find Interquartile Range
• Arrange the data from the smallest to the
largest.
• Divide the data into two parts.
• Define Q1 as the median of the lower half of
the data.
• Define Q3 as the median of the lower half of
the data.
• Interquartile range is the Q3-Q1.
29
Measures of Data Dispersion
How to Find Interquartile Range
Interquartile Range Example:
{20, 28, 30, 30, 31, 38, 40, 42, 48, 50, 51, 100}
{20, 28, 30, 30, 31, 38, 40, 42, 48, 50, 51, 100}
Q1=25th percentile= 30
Q3=75th percentile= 49
Interquartile Range (IQR)= Q3-Q1=19
30
Practical Exercise

31
Measures of Data Dispersion
Variance:
• Is the averaged squared deviation from the mean.
• The units of measurement are those of the original
data squared.
• Variance: S2 or ϭ2
32
Measures of Data Dispersion
Variance:

33
Measures of Data Dispersion
Standard Deviation:
• Is the square root of the variance (S or ϭ)

34
Practical Exercise

35
Measures of Data Dispersion
Standard Deviation:
• Best used when mean is used as measure of center.
• Standard Deviation = 0 indicates no spread all the
data have the same value.
• Is affected by extreme observations.
36
Measures of Data Dispersion
Standard Deviation:

37
Choosing Measures of Center and Spread
If the distribution
is normal or
symmetrical

• Use mean and standard deviation.

If the distribution
is skewed OR has
large outliers.

• Use Median and range OR (IQR)

If the distribution
is bimodal

• Use mode and range OR find out
if the two modes represent two
different groups and separate them
38
Characteristics of Measures of Spread
Range

IQR

Standard Deviation

Simple

Resistance

Non-Resistance

Non-Resistance

Used with the median

Used with the mean

IQR = 0 does not mean
there is no spread

Good for symmetrical
distribution with no outliers
Standard deviation of 0
means there is no spread.
Practical Exercise

40
41

Dscriptive statistics

  • 1.
    Prepared By: Dr.AneesAlSaadi Community Medicine Department December 2013 1
  • 2.
    Data Summarization Descriptivestatistics: • Continuous Data Description: – Measures of Data Center : • Mean, Median and Mode / definition. • Practical Exercise. – Measures of data variability: • Standard deviation(variance)/ Range. • Practical Exercise. – Normal Distribution Curve. 2
  • 3.
    Measures of Center: •Synonyms: – Measure of central tendency. – Measures of location. • Identification of the center of the distribution of observations OR the middle or average or typical value. 3
  • 4.
    Measures of Center: Mean •Arithmetic average for all observations. Median • The middle observation of ordered data. Mode • Most frequently observed value(s) 4
  • 5.
    Measures of Center: SampleMean: • The most commonly used measure of location. • Called Arithmetic average. 5
  • 6.
    Measures of Center: Howto Calculate Sample Mean: • Add up data, then divided by sample size (n). • (n) is the number of observations. 6
  • 7.
    Measures of Center: Howto Calculate Sample Mean Example: These are systolic blood pressure in (mmHg) 120,80,90,110,95. X1 =120, X2 =80 … X5 =95 Mean is calculated by adding up the five vales and dividing by 5. 7
  • 8.
    Measures of Center: Howto Calculate Sample Mean ‾ X= 120+80+90+110+95/5= 99mmHg. 8
  • 9.
    Measures of Center: SampleMean Example: Calculate the sample mean for number of open heart surgeries done by 7 cardiothoracic surgeons in Hamad hospital during last moth. Where, Dr.A did 4, Dr.B 3, Dr.C 6, Dr.D 5, Dr. E 4, Dr. F 3 and Dr.G 5. 4.28 surgeries. 9
  • 10.
    Measures of Center: SampleMean Example: The most important feature of the mean is sensitivity to the extreme values (outlier) 10
  • 11.
    Measures of Center: SampleMedian Is the middle number also called 50th percentile. 11
  • 12.
    Measures of Center: Howto Identify Sample Median • Order observations from smallest to largest. • Find the observation in the middle of the data. • Median is the observation in the middle. 12
  • 13.
    Measures of Center: Howto Identify Sample Median Sample Median Example: Identify the median for the following set of observations: – 90,80, 200,95, 110. 95 13
  • 14.
    Measures of Center: Howto Identify Sample Median Sample Median Example: • Identify the median for the following set of observations: – 90, 80, 120, 95, 125, 110. Position n+1/2 102 14
  • 15.
    Measures of Center: SampleMedian Features: Not affected by the extreme values. Less efficient to summarize the data statistically. 15
  • 16.
    Measures of Center: SampleMode • The most commonly occurring value in dataset. • Not all datasets have a mode. • Unimodal distribution: one mode in the dataset. • Bimodal distribution: two modes in the dataset. 16
  • 17.
    Measures of Center: Howto Identify Sample Mode • Arrange the data from small to greater values. • The most commonly / repeated value is the sample mode. 17
  • 18.
    Measures of Center: Howto Calculate Sample Median Sample Mode Example: {15, 33, 65, 32, 78, 94, 33, 110, 11, 46, 33} {11, 15, 32, 33, 33, 33, 46, 65, 78, 94, 110} Mode is 33 18
  • 19.
    Measures of Center: SampleMode Feature Not affected by the extreme values. Less efficient to summarize the data statistically. 19
  • 20.
    Practical Exercise This datasetis the number of hysterectomy performed by female doctors in HMC; {44, 37, 86, 50, 20, 25, 28, 25, 31, 33, 85, 59, 27, 34, 36} find the mean, median and mode? 20
  • 21.
    Data Summarization Descriptivestatistics: • Continuous Data Description: – Measures of Data Center : • Mean, Median and Mode / definition. • Practical Exercise. – Measures of data variability (dispersion) : • Standard deviation(variance)/Range/ Interquartile range. • Practical Exercise. – Normal Distribution Curve. 21
  • 22.
    Measures of DataDispersion • Data dispersion = data spread. • Data dispersion: – Range. – Interquartile range. – Variance. – Standard Deviation. 22
  • 23.
    Measures of DataDispersion Range: • Is equal to largest ( Maximum) value minus smallest (Minimum) value. • Easy to calculate but it gives no idea about the values between the Max and Min. 23
  • 24.
    Measures of DataDispersion Range: Range Example: Calculate the range for the following dataset; {40, 28, 42, 30, 31, 38,100, 20, 48, 50, 51, 30} Range is 100-20=80 24
  • 25.
    Measures of DataDispersion Range Feature: Range is affected by the extreme of values. 25
  • 26.
    Measures of DataDispersion Interquartile Range • Quartiles: the 25th , 50th , 75th percentiles of the data. • Interquartile range is the distance between the 25th and 75th percentile. 26
  • 27.
    Measures of DataDispersion Interquartile Range Max • Max, Min,, 1st , 3rd quartiles and median are used to make box-plot (five number summary) 75th Percentile Median 50th Percentile 25th Percentile Min 27
  • 28.
    Measures of DataDispersion Interquartile Range • Quartiles are number that divide the dataset into four quarters with 25% of observations in each quarter • Q1 lower quartile 25% of observations below and 75% above it. • Q2 median and 50% observations on each side of it. • Q3 upper quartile 25% of observations above and 75% below it. Q3 Q2 Q1 28
  • 29.
    Measures of DataDispersion How to Find Interquartile Range • Arrange the data from the smallest to the largest. • Divide the data into two parts. • Define Q1 as the median of the lower half of the data. • Define Q3 as the median of the lower half of the data. • Interquartile range is the Q3-Q1. 29
  • 30.
    Measures of DataDispersion How to Find Interquartile Range Interquartile Range Example: {20, 28, 30, 30, 31, 38, 40, 42, 48, 50, 51, 100} {20, 28, 30, 30, 31, 38, 40, 42, 48, 50, 51, 100} Q1=25th percentile= 30 Q3=75th percentile= 49 Interquartile Range (IQR)= Q3-Q1=19 30
  • 31.
  • 32.
    Measures of DataDispersion Variance: • Is the averaged squared deviation from the mean. • The units of measurement are those of the original data squared. • Variance: S2 or ϭ2 32
  • 33.
    Measures of DataDispersion Variance: 33
  • 34.
    Measures of DataDispersion Standard Deviation: • Is the square root of the variance (S or ϭ) 34
  • 35.
  • 36.
    Measures of DataDispersion Standard Deviation: • Best used when mean is used as measure of center. • Standard Deviation = 0 indicates no spread all the data have the same value. • Is affected by extreme observations. 36
  • 37.
    Measures of DataDispersion Standard Deviation: 37
  • 38.
    Choosing Measures ofCenter and Spread If the distribution is normal or symmetrical • Use mean and standard deviation. If the distribution is skewed OR has large outliers. • Use Median and range OR (IQR) If the distribution is bimodal • Use mode and range OR find out if the two modes represent two different groups and separate them 38
  • 39.
    Characteristics of Measuresof Spread Range IQR Standard Deviation Simple Resistance Non-Resistance Non-Resistance Used with the median Used with the mean IQR = 0 does not mean there is no spread Good for symmetrical distribution with no outliers Standard deviation of 0 means there is no spread.
  • 40.
  • 41.