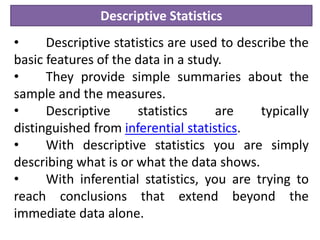
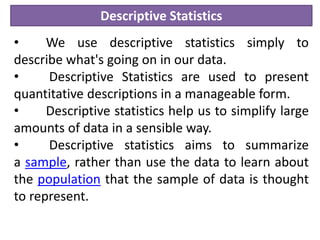
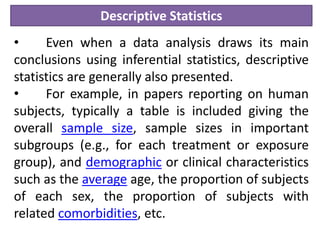
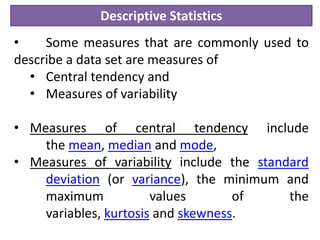
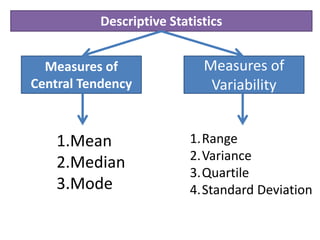
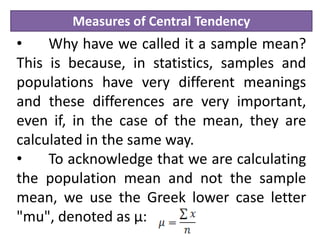
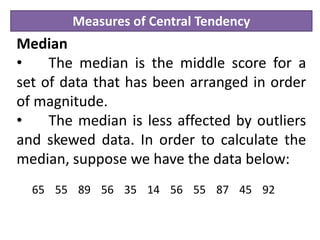
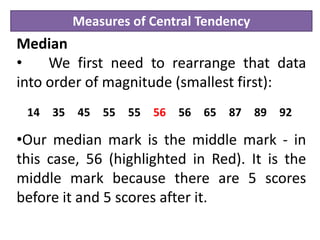
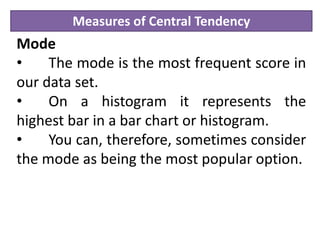
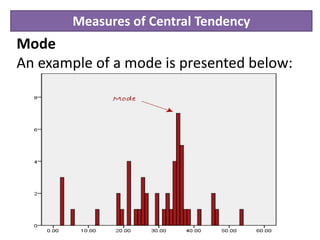
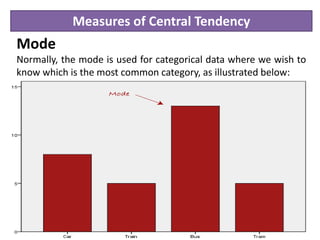
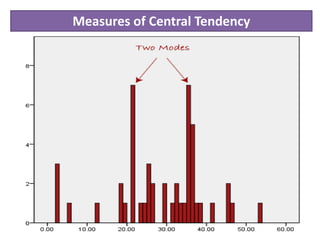
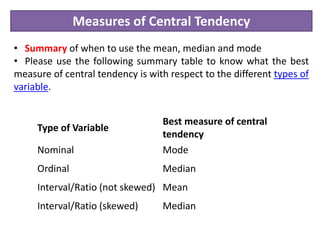
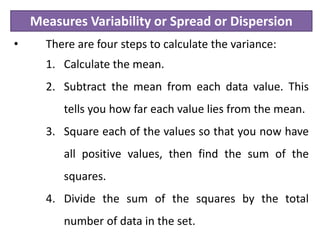
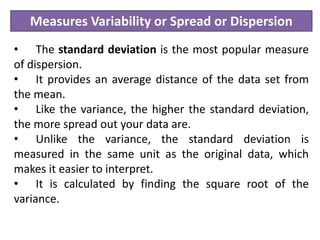
Descriptive statistics are used to describe and summarize the basic features of data through measures of central tendency like the mean, median, and mode, and measures of variability like range, variance and standard deviation. The mean is the average value and is best for continuous, non-skewed data. The median is less affected by outliers and is best for skewed or ordinal data. The mode is the most frequent value and is used for categorical data. Measures of variability describe how spread out the data is, with higher values indicating more dispersion.
Descriptive statistics are methods of describing the characteristics of a data set. It includes calculating things such as the average of the data, its spread and the shape it produces.
Lecture on Introduction to Descriptive Statistics - Part 1 and Part 2. These slides were presented during a lecture at the Colombo Institute of Research and Psychology.
this session differentiates between univariate, bivariate, and multivariate analysis. it covers practical assessment of table of critical values and understanding of the degree of freedom
Analysis of data is a process of inspecting, cleaning, transforming, and modeling data with the goal of discovering useful information, suggesting conclusions, and supporting decision-making.
Descriptive statistics are used to describe the basic features of the data in a study. They provide simple summaries about the sample and the measures. Together with simple graphics analysis, they form the basis of virtually every quantitative analysis of data.
Model Attribute Check Company Auto PropertyCeline George
In Odoo, the multi-company feature allows you to manage multiple companies within a single Odoo database instance. Each company can have its own configurations while still sharing common resources such as products, customers, and suppliers.
2024.06.01 Introducing a competency framework for languag learning materials ...Sandy Millin
http://sandymillin.wordpress.com/iateflwebinar2024
Published classroom materials form the basis of syllabuses, drive teacher professional development, and have a potentially huge influence on learners, teachers and education systems. All teachers also create their own materials, whether a few sentences on a blackboard, a highly-structured fully-realised online course, or anything in between. Despite this, the knowledge and skills needed to create effective language learning materials are rarely part of teacher training, and are mostly learnt by trial and error.
Knowledge and skills frameworks, generally called competency frameworks, for ELT teachers, trainers and managers have existed for a few years now. However, until I created one for my MA dissertation, there wasn’t one drawing together what we need to know and do to be able to effectively produce language learning materials.
This webinar will introduce you to my framework, highlighting the key competencies I identified from my research. It will also show how anybody involved in language teaching (any language, not just English!), teacher training, managing schools or developing language learning materials can benefit from using the framework.
Unit 8 - Information and Communication Technology (Paper I).pdfThiyagu K
This slides describes the basic concepts of ICT, basics of Email, Emerging Technology and Digital Initiatives in Education. This presentations aligns with the UGC Paper I syllabus.
The Art Pastor's Guide to Sabbath | Steve ThomasonSteve Thomason
What is the purpose of the Sabbath Law in the Torah. It is interesting to compare how the context of the law shifts from Exodus to Deuteronomy. Who gets to rest, and why?
Synthetic Fiber Construction in lab .pptxPavel ( NSTU)
Synthetic fiber production is a fascinating and complex field that blends chemistry, engineering, and environmental science. By understanding these aspects, students can gain a comprehensive view of synthetic fiber production, its impact on society and the environment, and the potential for future innovations. Synthetic fibers play a crucial role in modern society, impacting various aspects of daily life, industry, and the environment. ynthetic fibers are integral to modern life, offering a range of benefits from cost-effectiveness and versatility to innovative applications and performance characteristics. While they pose environmental challenges, ongoing research and development aim to create more sustainable and eco-friendly alternatives. Understanding the importance of synthetic fibers helps in appreciating their role in the economy, industry, and daily life, while also emphasizing the need for sustainable practices and innovation.
Students, digital devices and success - Andreas Schleicher - 27 May 2024..pptxEduSkills OECD
Andreas Schleicher presents at the OECD webinar ‘Digital devices in schools: detrimental distraction or secret to success?’ on 27 May 2024. The presentation was based on findings from PISA 2022 results and the webinar helped launch the PISA in Focus ‘Managing screen time: How to protect and equip students against distraction’ https://www.oecd-ilibrary.org/education/managing-screen-time_7c225af4-en and the OECD Education Policy Perspective ‘Students, digital devices and success’ can be found here - https://oe.cd/il/5yV
How to Split Bills in the Odoo 17 POS ModuleCeline George
Bills have a main role in point of sale procedure. It will help to track sales, handling payments and giving receipts to customers. Bill splitting also has an important role in POS. For example, If some friends come together for dinner and if they want to divide the bill then it is possible by POS bill splitting. This slide will show how to split bills in odoo 17 POS.
2. Descriptive Statistics
• Descriptive statistics are used to describe the
basic features of the data in a study.
• They provide simple summaries about the
sample and the measures.
• Descriptive statistics are typically
distinguished from inferential statistics.
• With descriptive statistics you are simply
describing what is or what the data shows.
• With inferential statistics, you are trying to
reach conclusions that extend beyond the
immediate data alone.
3. Descriptive Statistics
• We use descriptive statistics simply to
describe what's going on in our data.
• Descriptive Statistics are used to present
quantitative descriptions in a manageable form.
• Descriptive statistics help us to simplify large
amounts of data in a sensible way.
• Descriptive statistics aims to summarize
a sample, rather than use the data to learn about
the population that the sample of data is thought
to represent.
4. Descriptive Statistics
• Even when a data analysis draws its main
conclusions using inferential statistics, descriptive
statistics are generally also presented.
• For example, in papers reporting on human
subjects, typically a table is included giving the
overall sample size, sample sizes in important
subgroups (e.g., for each treatment or exposure
group), and demographic or clinical characteristics
such as the average age, the proportion of subjects
of each sex, the proportion of subjects with
related comorbidities, etc.
5. Descriptive Statistics
• Some measures that are commonly used to
describe a data set are measures of
• Central tendency and
• Measures of variability
• Measures of central tendency include
the mean, median and mode,
• Measures of variability include the standard
deviation (or variance), the minimum and
maximum values of the
variables, kurtosis and skewness.
7. Measures of Central Tendency
Introduction
• A measure of central tendency is a single
value that attempts to describe a set of data by
identifying the central position within that set of
data.
• Measures of central tendency are
sometimes called measures of central location.
• They are also called summary statistics.
8. Measures of Central Tendency
Introduction
• The mean (often called the average) is most
likely the measure of central tendency that you
are most familiar with, but there are others, such
as the median and the mode.
• The mean, median and mode are all valid
measures of central tendency, but under different
conditions, some measures of central tendency
become more appropriate to use than others.
9. Measures of Central Tendency
Mean (Arithmetic)
• The mean (or average) is the most
popular and well known measure of central
tendency.
• It can be used with both discrete and
continuous data, although its use is most
often with continuous data.
• The mean is equal to the sum of all the
values in the data set divided by the number
of values in the data set.
10. Measures of Central Tendency
Mean (Arithmetic)
• If we have n values in a data set and
they have values x1, x2, ..., xn, the sample
mean, usually denoted by (pronounced x
bar), is:
11. Measures of Central Tendency
Mean (Arithmetic)
• This formula is usually written in a
slightly different manner using the Greek
capitol letter, , pronounced "sigma",
which means "sum of...":
12. Measures of Central Tendency
• Why have we called it a sample mean?
This is because, in statistics, samples and
populations have very different meanings
and these differences are very important,
even if, in the case of the mean, they are
calculated in the same way.
• To acknowledge that we are calculating
the population mean and not the sample
mean, we use the Greek lower case letter
"mu", denoted as µ:
13. Measures of Central Tendency
Median
• The median is the middle score for a
set of data that has been arranged in order
of magnitude.
• The median is less affected by outliers
and skewed data. In order to calculate the
median, suppose we have the data below:
65 55 89 56 35 14 56 55 87 45 92
14. Measures of Central Tendency
Median
• We first need to rearrange that data
into order of magnitude (smallest first):
•Our median mark is the middle mark - in
this case, 56 (highlighted in Red). It is the
middle mark because there are 5 scores
before it and 5 scores after it.
14 35 45 55 55 56 56 65 87 89 92
15. Measures of Central Tendency
Mode
• The mode is the most frequent score in
our data set.
• On a histogram it represents the
highest bar in a bar chart or histogram.
• You can, therefore, sometimes consider
the mode as being the most popular option.
17. Measures of Central Tendency
Mode
Normally, the mode is used for categorical data where we wish to
know which is the most common category, as illustrated below:
18. Measures of Central Tendency
Mode
• We are now stuck as to which mode best describes the
central tendency of the data.
• This is particularly problematic when we have continuous
data because we are more likely not to have any one value that is
more frequent than the other.
• For example, consider measuring 30 peoples' weight (to
the nearest 0.1 kg). How likely is it that we will find two or more
people with exactly the same weight (e.g., 67.4 kg)? The answer, is
probably very unlikely - many people might be close, but with such
a small sample (30 people) and a large range of possible weights,
you are unlikely to find two people with exactly the same weight;
that is, to the nearest 0.1 kg. This is why the mode is very rarely
used with continuous data.
20. Measures of Central Tendency
• Summary of when to use the mean, median and mode
• Please use the following summary table to know what the best
measure of central tendency is with respect to the different types of
variable.
Type of Variable
Best measure of central
tendency
Nominal Mode
Ordinal Median
Interval/Ratio (not skewed) Mean
Interval/Ratio (skewed) Median
21. Measures Variability or Spread or Dispersion
• These are ways of summarizing a group of data by
describing how spread out the scores are.
• For example, the mean score of our 100 students may
be 65 out of 100. However, not all students will have
scored 65 marks. Rather, their scores will be spread out.
• Some will be lower and others higher.
• Measures of spread help us to summarize how spread
out these scores are.
• To describe this spread, a number of statistics are
available to us, including the range, quartiles, absolute
deviation, variance and standard deviation.
22. Measures Variability or Spread or Dispersion
• Variability is the extent to which data points in a
statistical distribution or data set diverge from the
average, or mean, value as well as the extent to which
these data points differ from each other.
23. Measures Variability or Spread or Dispersion
• The simplest measure of dispersion is the range.
• This tells us how spread out our data is.
• In order to calculate the range, you subtract the
smallest number from the largest number. Just like the
mean, the range is very sensitive to outliers.
• The variance is a measure of the average distance
that a set of data lies from its mean.
• The variance is not a stand-alone statistic.
• It is typically used in order to calculate other
statistics, such as the standard deviation.
• The higher the variance, the more spread out your
data are.
24. Measures Variability or Spread or Dispersion
• There are four steps to calculate the variance:
1. Calculate the mean.
2. Subtract the mean from each data value. This
tells you how far each value lies from the mean.
3. Square each of the values so that you now have
all positive values, then find the sum of the
squares.
4. Divide the sum of the squares by the total
number of data in the set.
25. Measures Variability or Spread or Dispersion
• The standard deviation is the most popular measure
of dispersion.
• It provides an average distance of the data set from
the mean.
• Like the variance, the higher the standard deviation,
the more spread out your data are.
• Unlike the variance, the standard deviation is
measured in the same unit as the original data, which
makes it easier to interpret.
• It is calculated by finding the square root of the
variance.