Downloaded 157 times
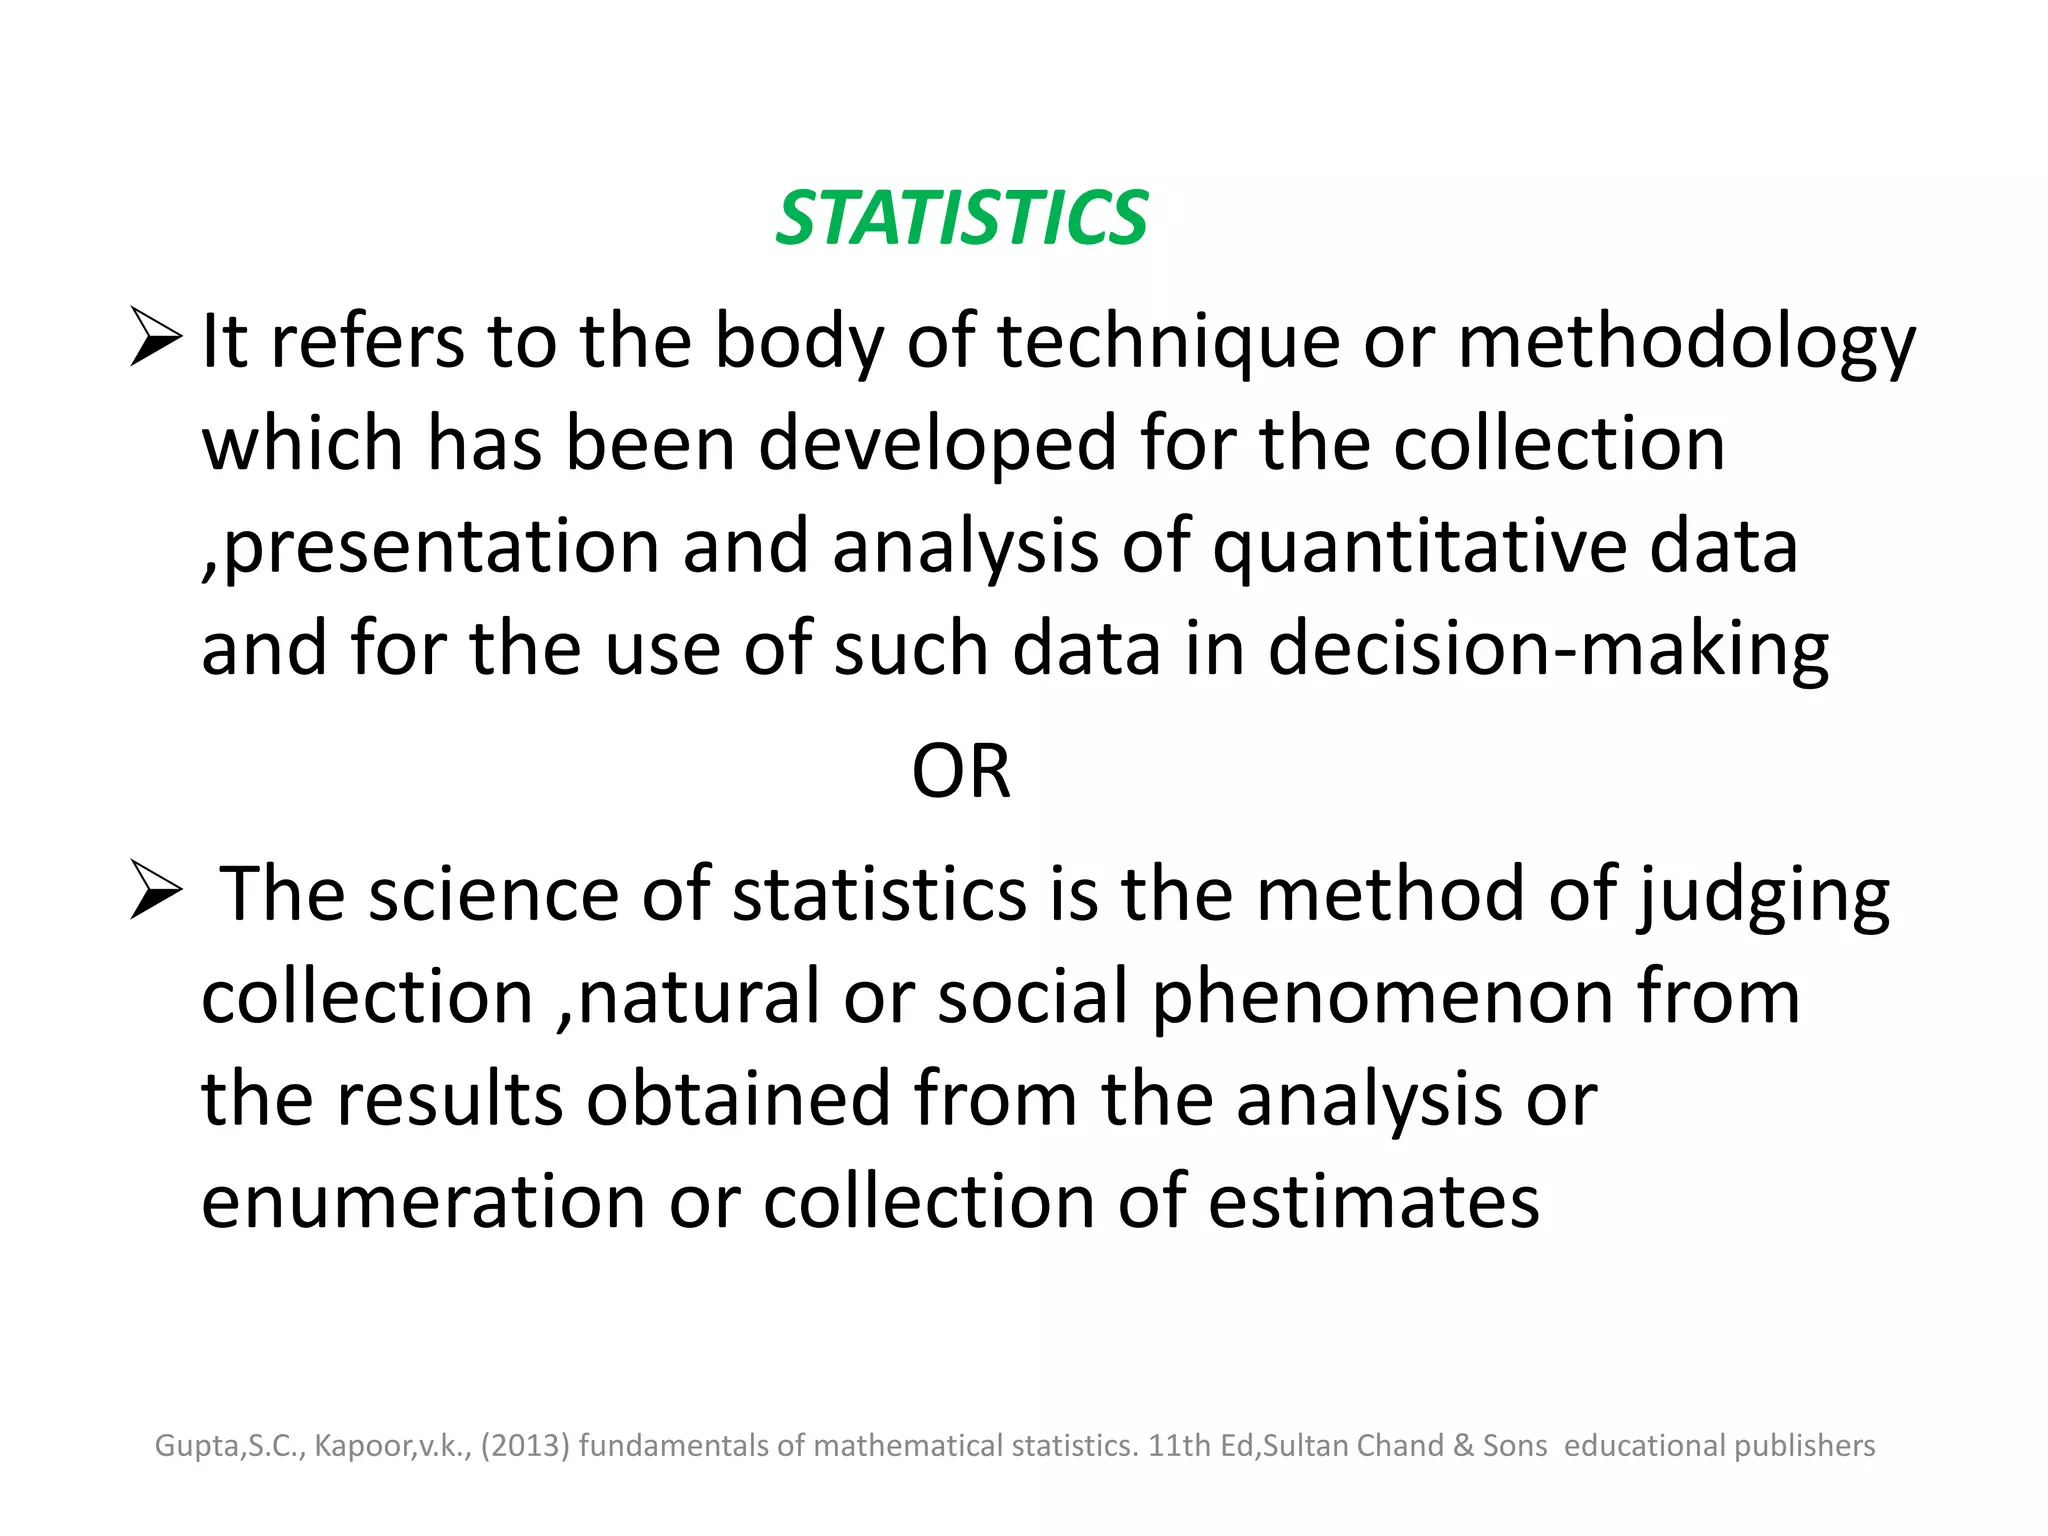
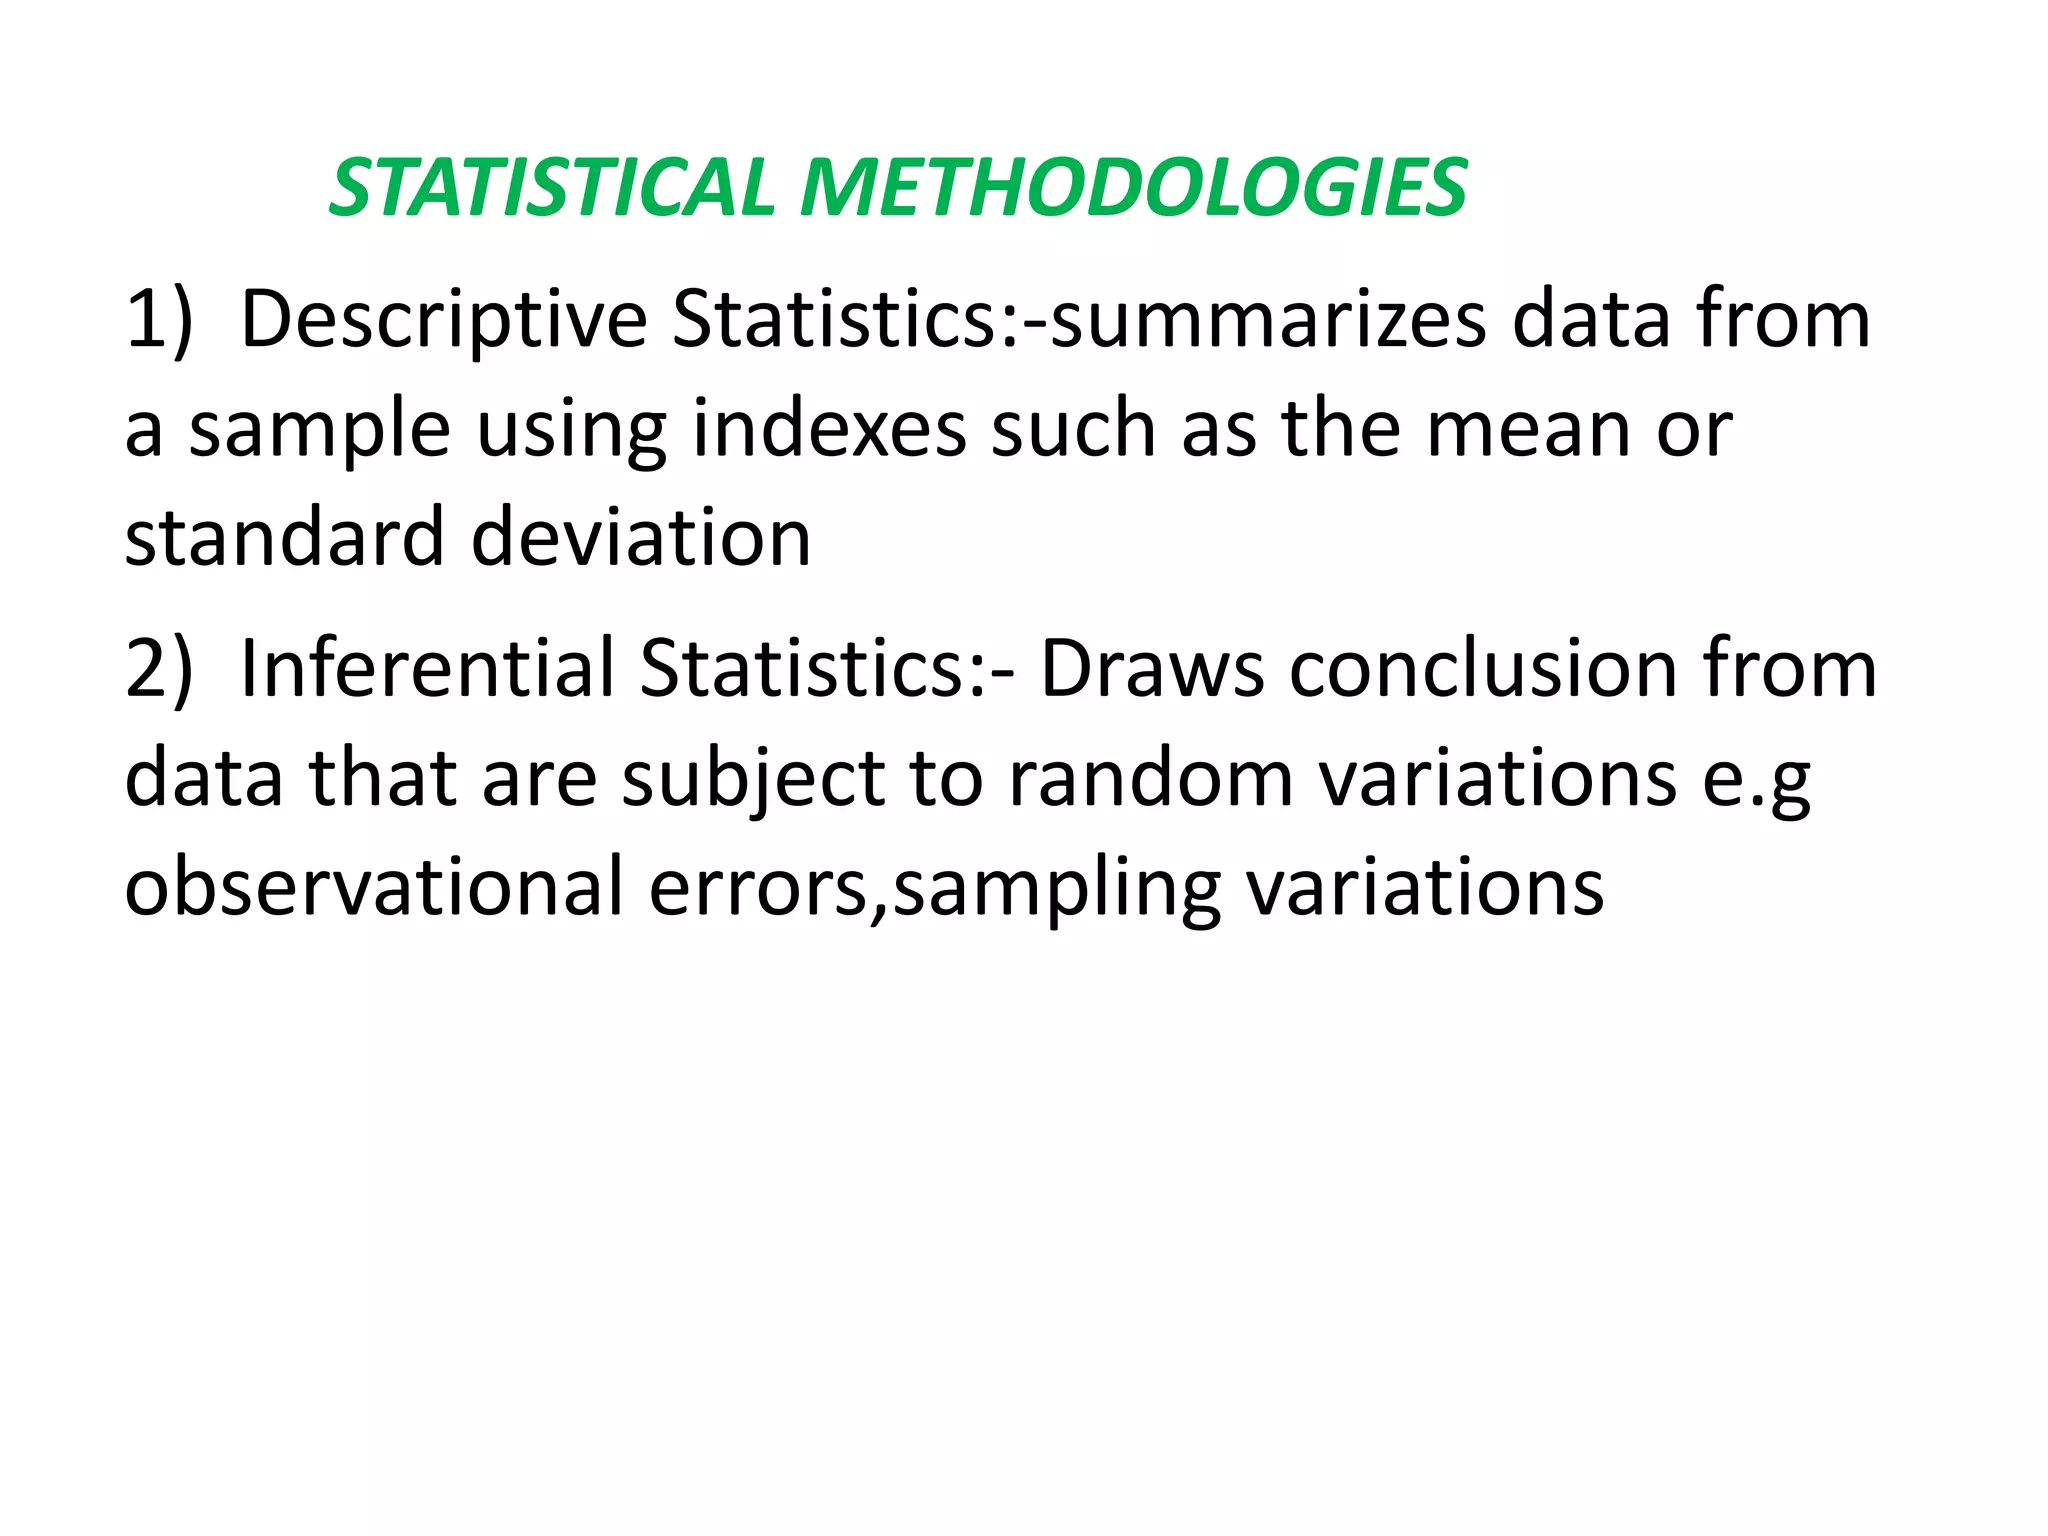
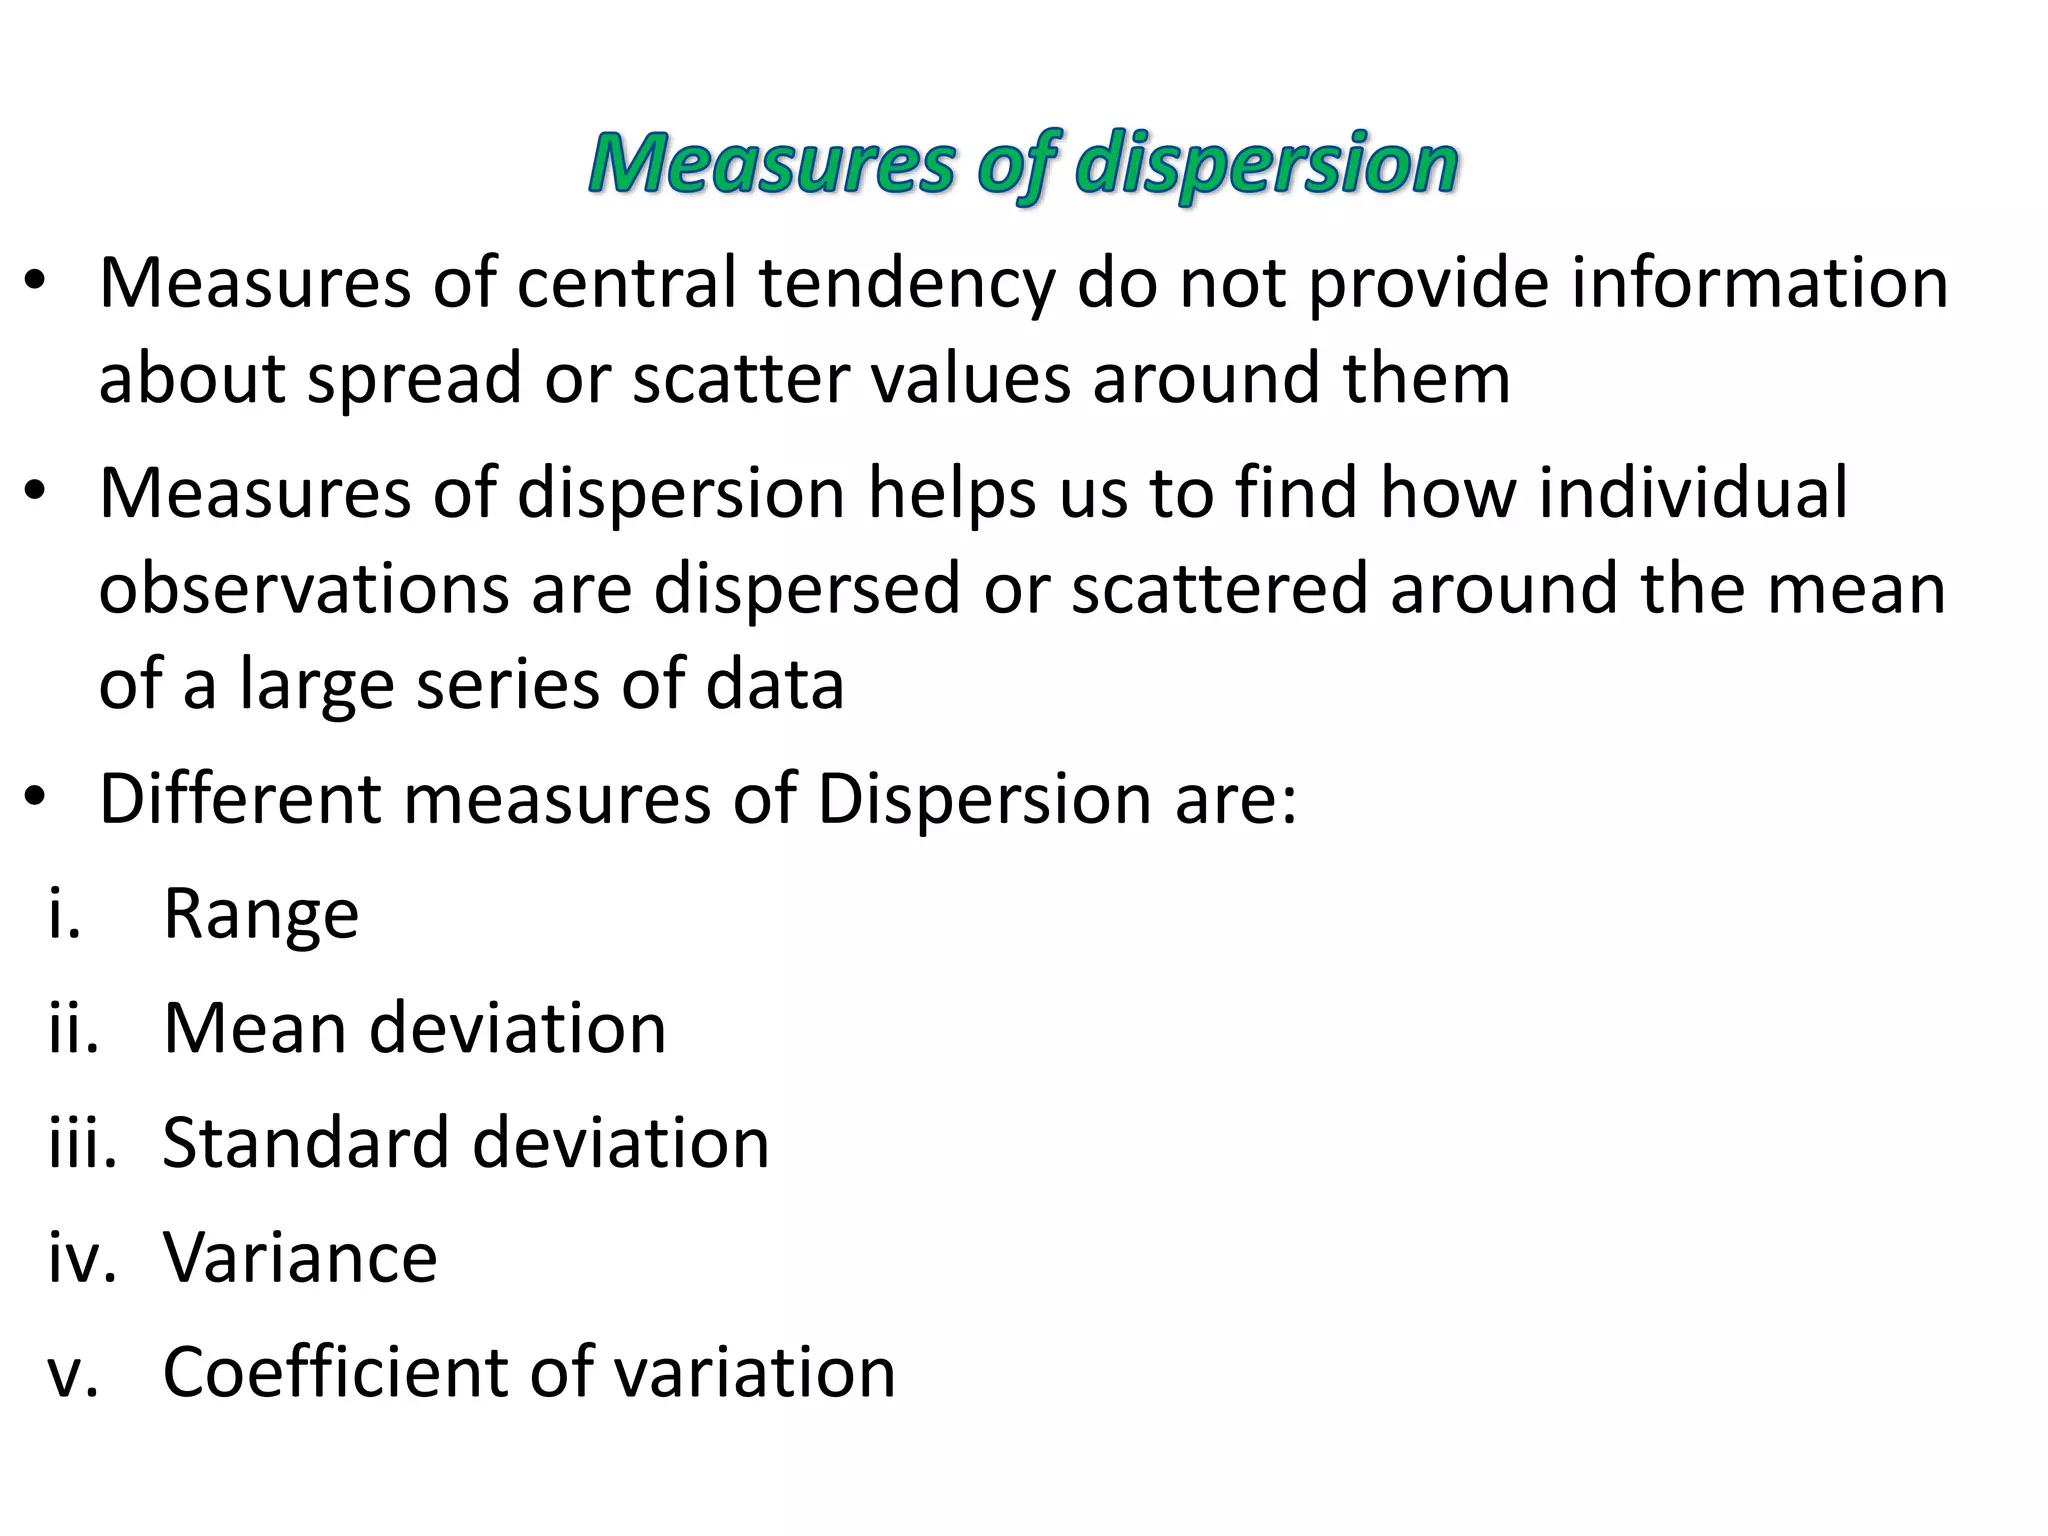


Statistical analysis and its applications can be used in many fields including pharmaceutical research, clinical trials, public health, epidemiology, genetics, and demographics. Some key uses of statistics include evaluating drug effects, comparing drug treatments, exploring associations between diseases and risk factors, and analyzing clinical trial and genomics data. Measures of central tendency, dispersion, and other statistical methodologies help researchers draw conclusions from collected data.