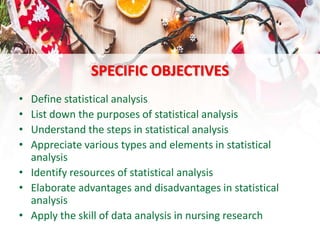
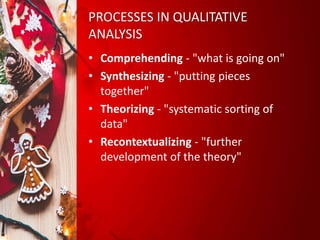
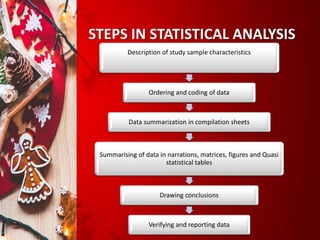
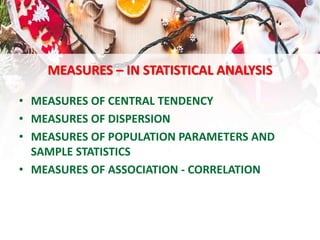
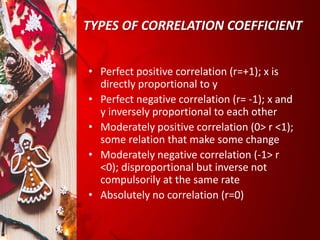
This document provides an overview of statistical analysis for nursing research. It defines key terms like statistics, data analysis, and population. It outlines the specific objectives of understanding statistical analysis and applying it to nursing research skillfully. It also describes the various types of statistical analysis including descriptive statistics, inferential statistics, parametric and nonparametric tests. Finally, it discusses the steps in statistical analysis, available computer programs, uses of statistical analysis in different fields including nursing, and advantages and disadvantages of statistical analysis.
CENTRAL OBJECTIVE
• Bythe end of the seminar, the learner will acquire
adequate knowledge regarding statistical analysis
and apply this knowledge in conducting research
thesis skillfully with a positive attitude
3.
SPECIFIC OBJECTIVES
• Definestatistical analysis
• List down the purposes of statistical analysis
• Understand the steps in statistical analysis
• Appreciate various types and elements in statistical
analysis
• Identify resources of statistical analysis
• Elaborate advantages and disadvantages in statistical
analysis
• Apply the skill of data analysis in nursing research
DEFINITION - STATISTICS
•It refers to the body of technique or methodology
which has been developed for the collection,
presentation and analysis of quantitative data and for
the use of such that in decision making.
• The science of statistics is the method of judging
collection, natural or social phenomenon from the
results obtained from the analysis or enumeration or
collection of estimates
7.
STATISTICAL METHODOLOGIES
• Descriptivestatistics
• Its summarises data from a sample using indexes
such as the mean or standard deviation
• Inferential statistics
• It draws conclusion from the data that are subject to
random variations. eg. Observational errors and
sampling variations
8.
DEFINITION - STATISTICALANALYSIS
• Statistical analysis is the organization and analysis of
quantitative or qualitative data using statistical
procedures, including both descriptive and inferential
statistics.
• Statistical analysis is the science of collecting,
exploring and presenting large amounts of data to
discover underlying patterns and trends.
9.
• Data analysisis a process of inspecting, cleansing,
transforming and modeling data with the goal of
discovering useful information, informing conclusions
and supporting decision making
10.
NEEDS & PURPOSES
•To measure things
• To examine on relationship
• To predict or make predictions or infer from the
samples to a theoretical model
• To test the proposed relationships in a theoretical
model
• To test hypothesis
• To construct concept and develop theories
11.
• To exploreissues and the meaning of deviations in data
• To explain activities or attitude
• To describe what is happening
• Make comparison or contrast descriptively to find
similarities and differences
• To draw conclusions about populations based on the
sample result
• To Summarize the result and present an information
• To inform that the findings from sample are indicative
12.
ELEMENTS
• Understanding thecomplex relationship among the
correlates of the phenomena under study
• Start with simple comparison of proportions and
means
• Interpretation of result should be guided by clinical
and biological consideration
13.
TYPES - Parametricstatistical analysis
• Most commonly used type of statistical analysis
where the findings are inferred to the parameters of
a normally distributed population
• Numerical data(quantitative variables) that are
normally distributed are analysed with parametric
test
14.
TYPES - Nonparametricstatistical analysis
• Nonparametric statistical analysis or distribution free
techniques can be used in studies that do not meet the
assumptions as described in the parametric statistical
analysis
• Mostly this technique is not as powerful as their
parametric counterpart
• If the distribution of sample is skewd towards one side,
or the distribution is unknown due to the small sample
size, nonparametric Statistical Techniques can be used
• Non parametric tests are used to analyse ordinal and
categorical data
15.
COMPUTER ANALYSIS OFQUANTITATIVE
DATA
• Microsoft Excel
• SPSS(Statistical Package for Social Sciences)
• Epi-info
• SAS(Statistical Analysis System)
• Minitab
• Stata
• Systat
• NCSS(Number Cruncher Statistical System)
16.
ANALYSIS OF QUALITATIVEDATA
• time consuming, detail-oriented and seemingly
overwhelming task
• provides ways of discerning, examining, comparing
and interpreting meaningful patterns or themes
• deals with words
• carried out typically in active and inactive processes
17.
PROCESSES IN QUALITATIVE
ANALYSIS
•Comprehending - "what is going on"
• Synthesizing - "putting pieces
together"
• Theorizing - "systematic sorting of
data"
• Recontextualizing - "further
development of the theory"
18.
STEPS IN STATISTICALANALYSIS
Description of study sample characteristics
Ordering and coding of data
Data summarization in compilation sheets
Summarising of data in narrations, matrices, figures and Quasi
statistical tables
Drawing conclusions
Verifying and reporting data
19.
MEASURES – INSTATISTICAL ANALYSIS
• MEASURES OF CENTRAL TENDENCY
• MEASURES OF DISPERSION
• MEASURES OF POPULATION PARAMETERS AND
SAMPLE STATISTICS
• MEASURES OF ASSOCIATION - CORRELATION
20.
TYPES OF CORRELATIONCOEFFICIENT
• Perfect positive correlation (r=+1); x is
directly proportional to y
• Perfect negative correlation (r= -1); x and
y inversely proportional to each other
• Moderately positive correlation (0> r <1);
some relation that make some change
• Moderately negative correlation (-1> r
<0); disproportional but inverse not
compulsorily at the same rate
• Absolutely no correlation (r=0)
21.
RESOURCES FOR STATISTICALANALYSIS
Data resources for statistical analysis
• Primary or statistical sources – data collected from
surveys and census
• Secondary or non- statistical sources – data that have
been primarily collected for some other purpose (eg:
administrative data, private sector data)
22.
Resources for analysis
•Packaged computer programs can perform the data
analysis and provide with the results of analysis on a
computer print out
• SPSS, SAS, and biomedical data processing(BMDP)
ADVANTAGES OF STATISTICALANALYSIS
• Faster and accurate than manual work
• Time and energy saving
• Correlation and findings can easily interpreted
graphically or with tables
29.
DISADVANTAGES OR PITFALLS
•Needs competent statistician
• Machine cannot rectify error, if input is wrong- the
whole result will be affected. If the analysis selected
are inappropriate for the data, the computer
program is often unable to detect that error and
proceed to perform the analysis; that's why it is very
important to enter data without errors
30.
• Unsaved dataor electrical errors may cause overload
of doing the same work all over again
• Statistics can be used intentionally or unintentionally
to reach faulty conclusions
• Misleading information is unfortunately the norm in
advertising
• Data dredging and survey questions
JOURNAL ABSTRACT
• LuppaC, Sikorski M, Luck T, Ehreke L, Konnopka A,
Wiese B et al. Age- and gender-specific prevalence of
depression in latest-life – Systematic review and
meta-analysis. Journal of Affective Disorders. Elsevier
Publication. Volume 136, Issue 3, February 2012,
Pages 212-221
34.
JOURNAL ABSTRACT
• RobertB, Natasja J, Menezes M. Risk of symptom
recurrence with medication discontinuation in first-
episode psychosis: A systematic review.
Schizophrenia Research. Elsevier Publication. Volume
152, Issues 2–3, February 2014, Pages 408-414
35.
REFERENCE - Books
•Sharma SK. Nursing research & Statistics. Third Edition. New
Delhi: Elseviers Publications;2018
• Kader P . Nursing Research- Principles, process and issues.
Second edition. Newyork : Palgrave Macmillan; 2006
• Sundaram RK, Dwivedi SN, Sreenivas V. Medical Statistics-
Principles and methods. Second edition. New Delhi: Wolter
Kluwer publication; 2015
• Kaur S & Singh A. Nursing research & Statistics. New Delhi:
CBS Publishers & Distributers; 2015
• Burns N and Grove SK. Understanding nursing research-
building an evidence based practice. Fourth Edition. New
Delhi: Reed Elsevier India; 2007
36.
REFERENCE - Journals
•Luppa C, Sikorski M, Luck T, Ehreke L, Konnopka A, Wiese
B et al. Age- and gender-specific prevalence of
depression in latest-life – Systematic review and meta-
analysis. Journal of Affective Disorders. Volume 136, Issue
3, February 2012, Pages 212-221
• Robert B, Natasja J, Menezes M. Risk of symptom
recurrence with medication discontinuation in first-
episode psychosis: A systematic review. Schizophrenia
Research. Elsevier Publication. Volume 152, Issues 2–
3, February 2014, Pages 408-414
37.
REFERENCE - Internet
•https://www.slideshare.net/demarcial/statistical-
analysis-and-interpretation
• www.sas.com>insights>analytics
• https://whatis.techtarget.com/definition/statistical-
analysis