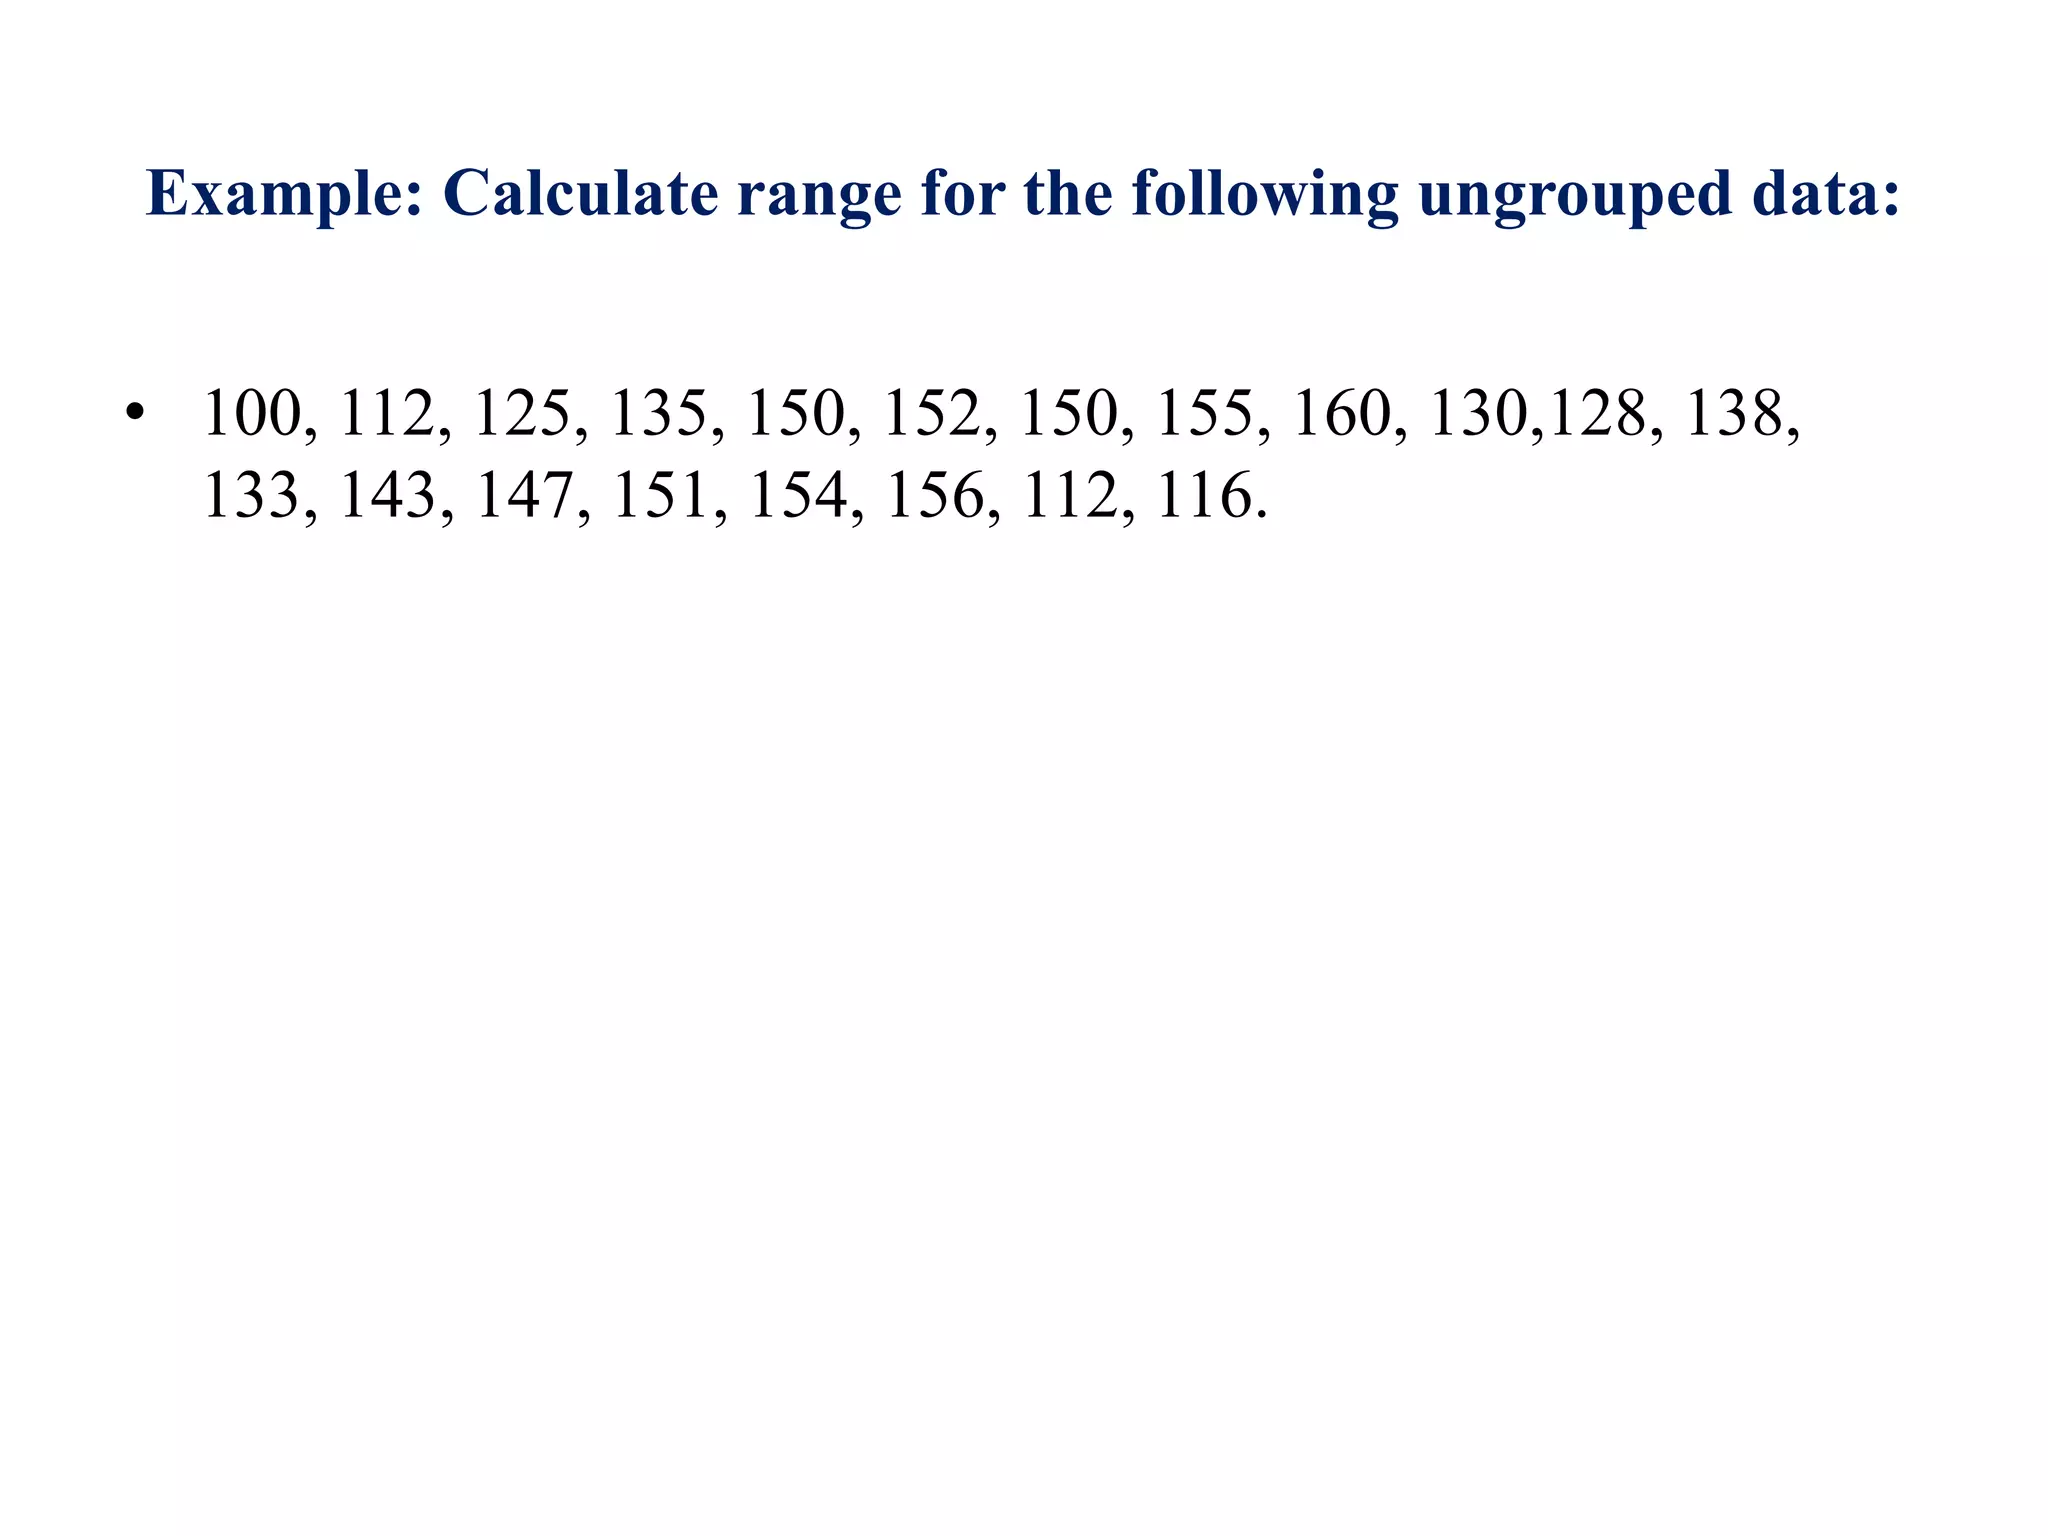
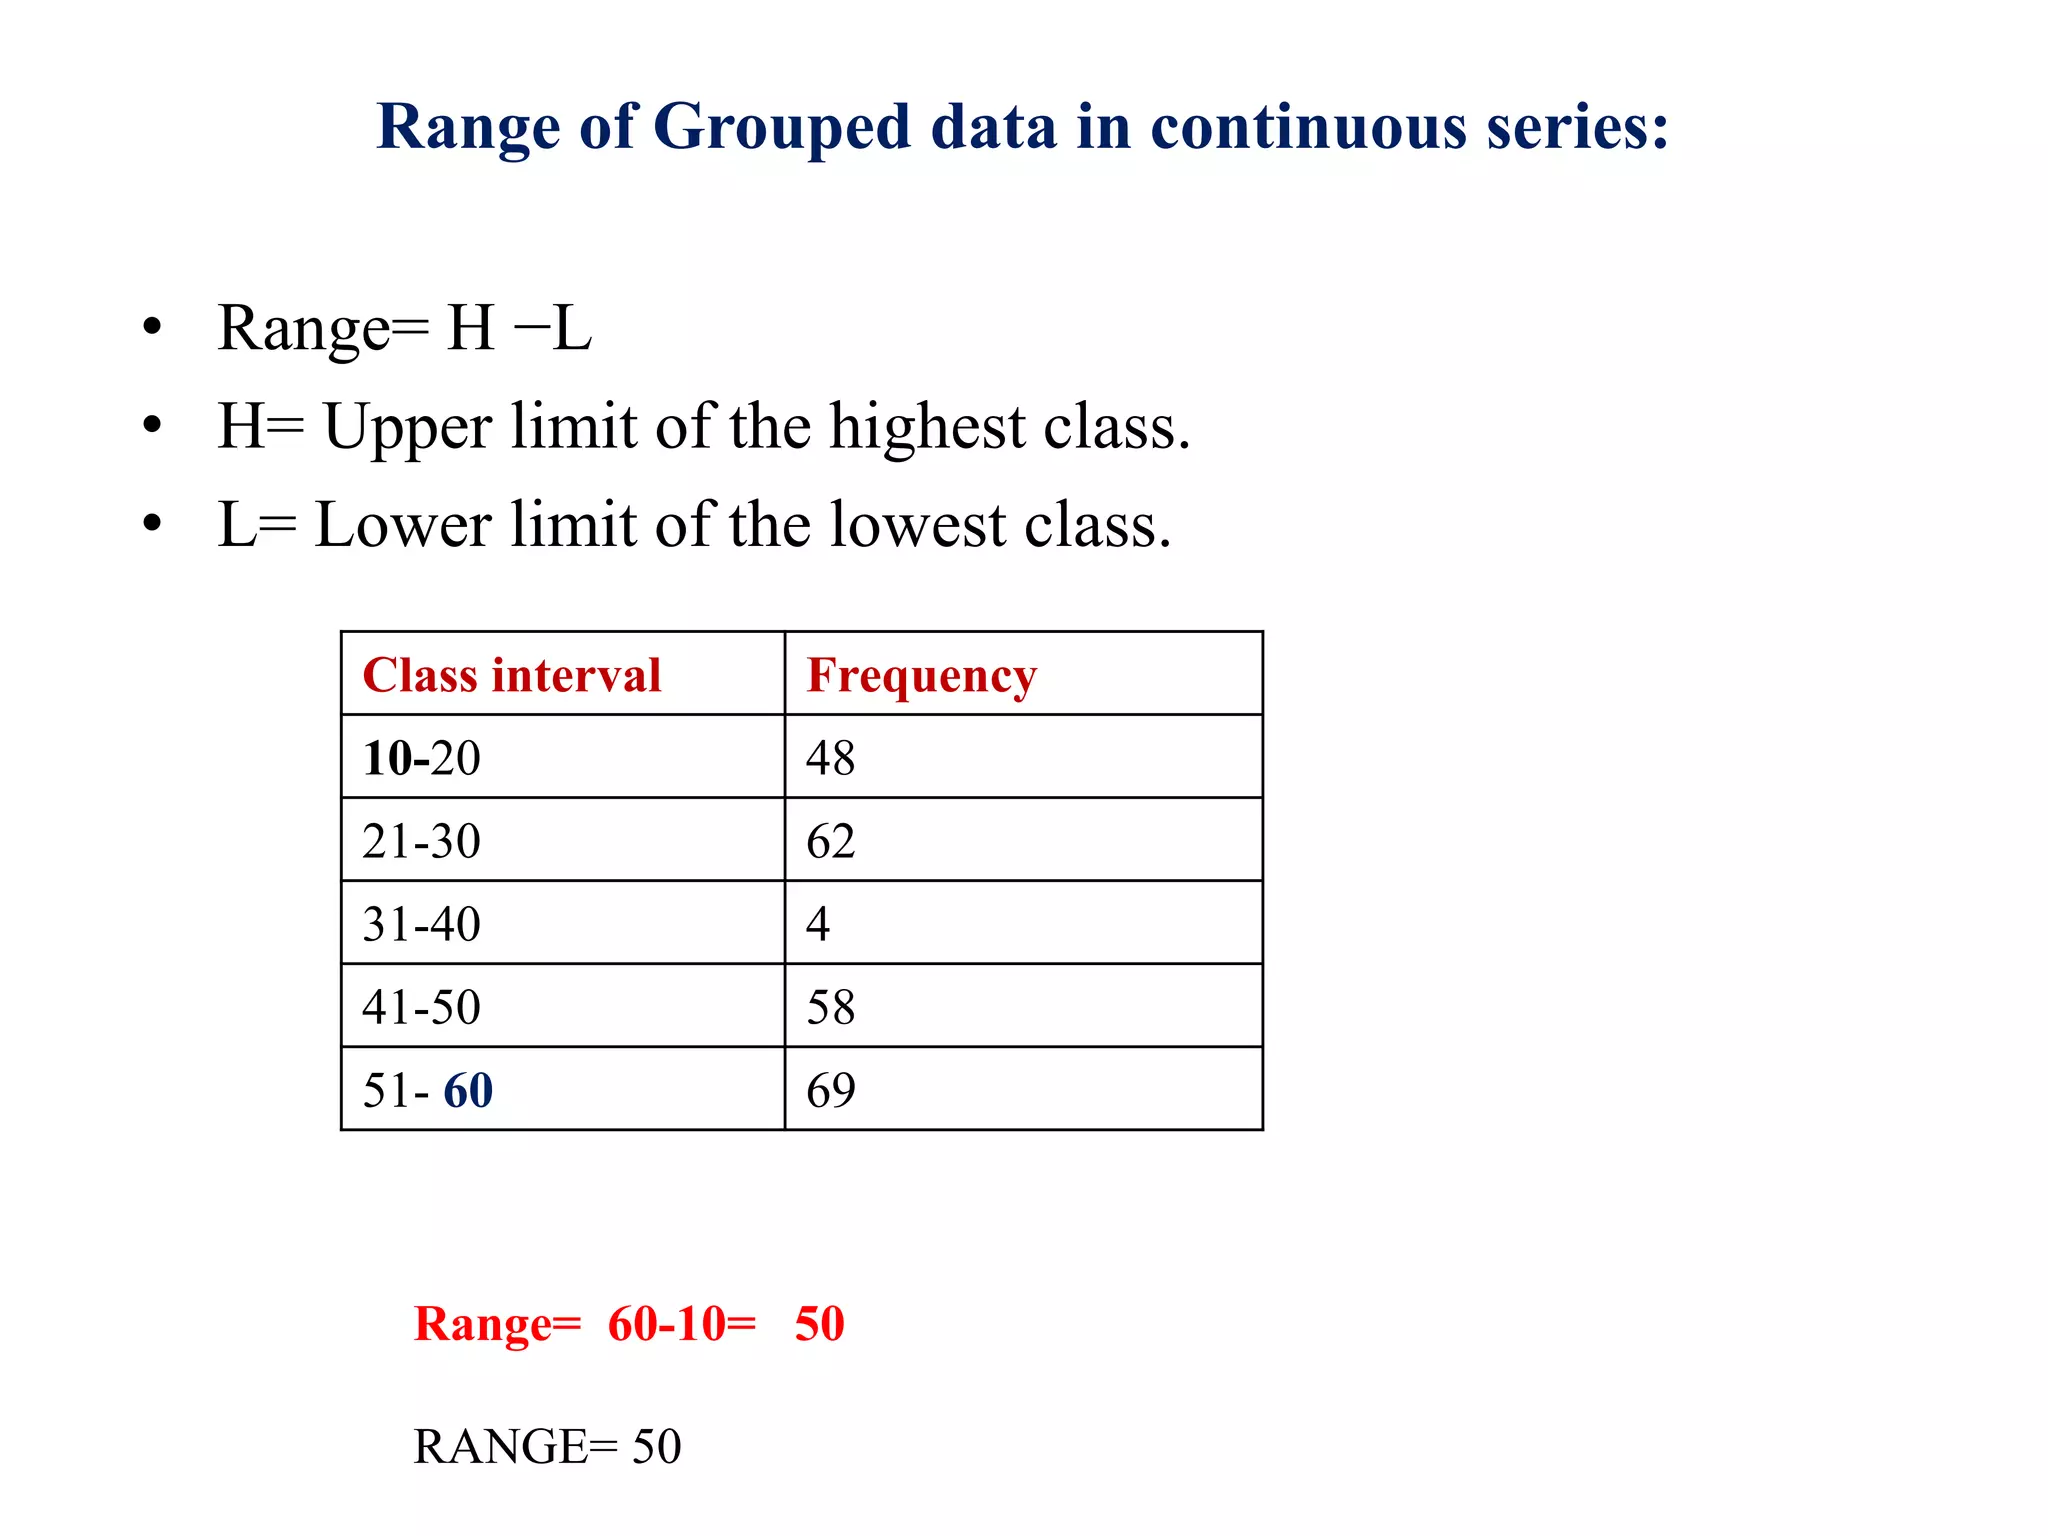
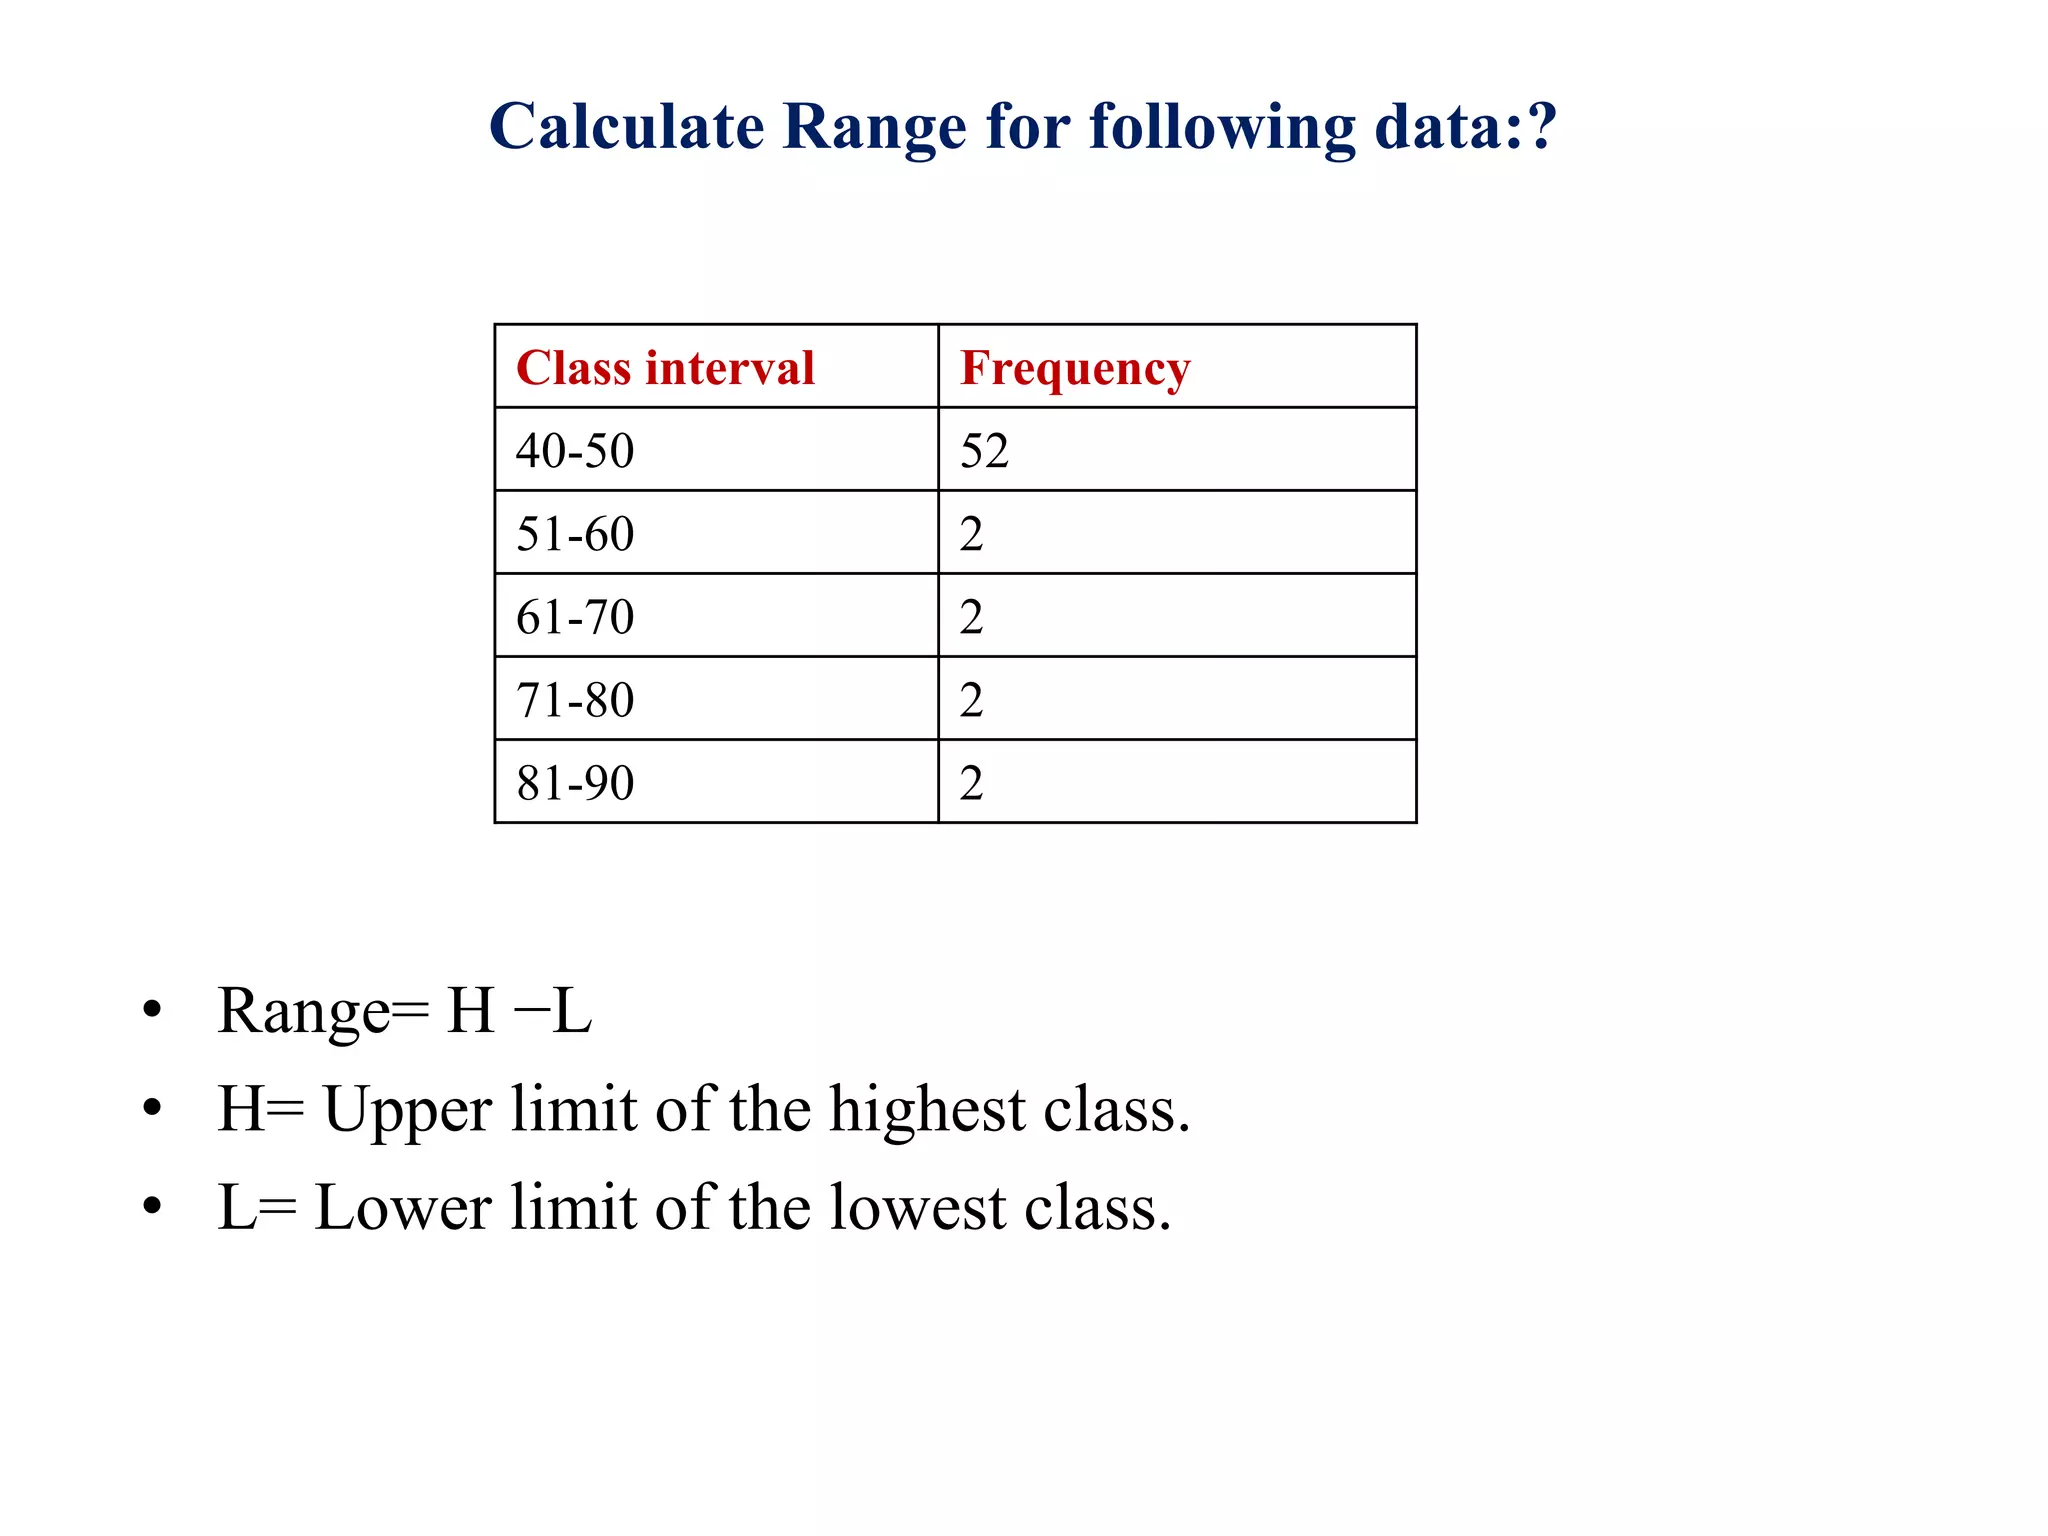
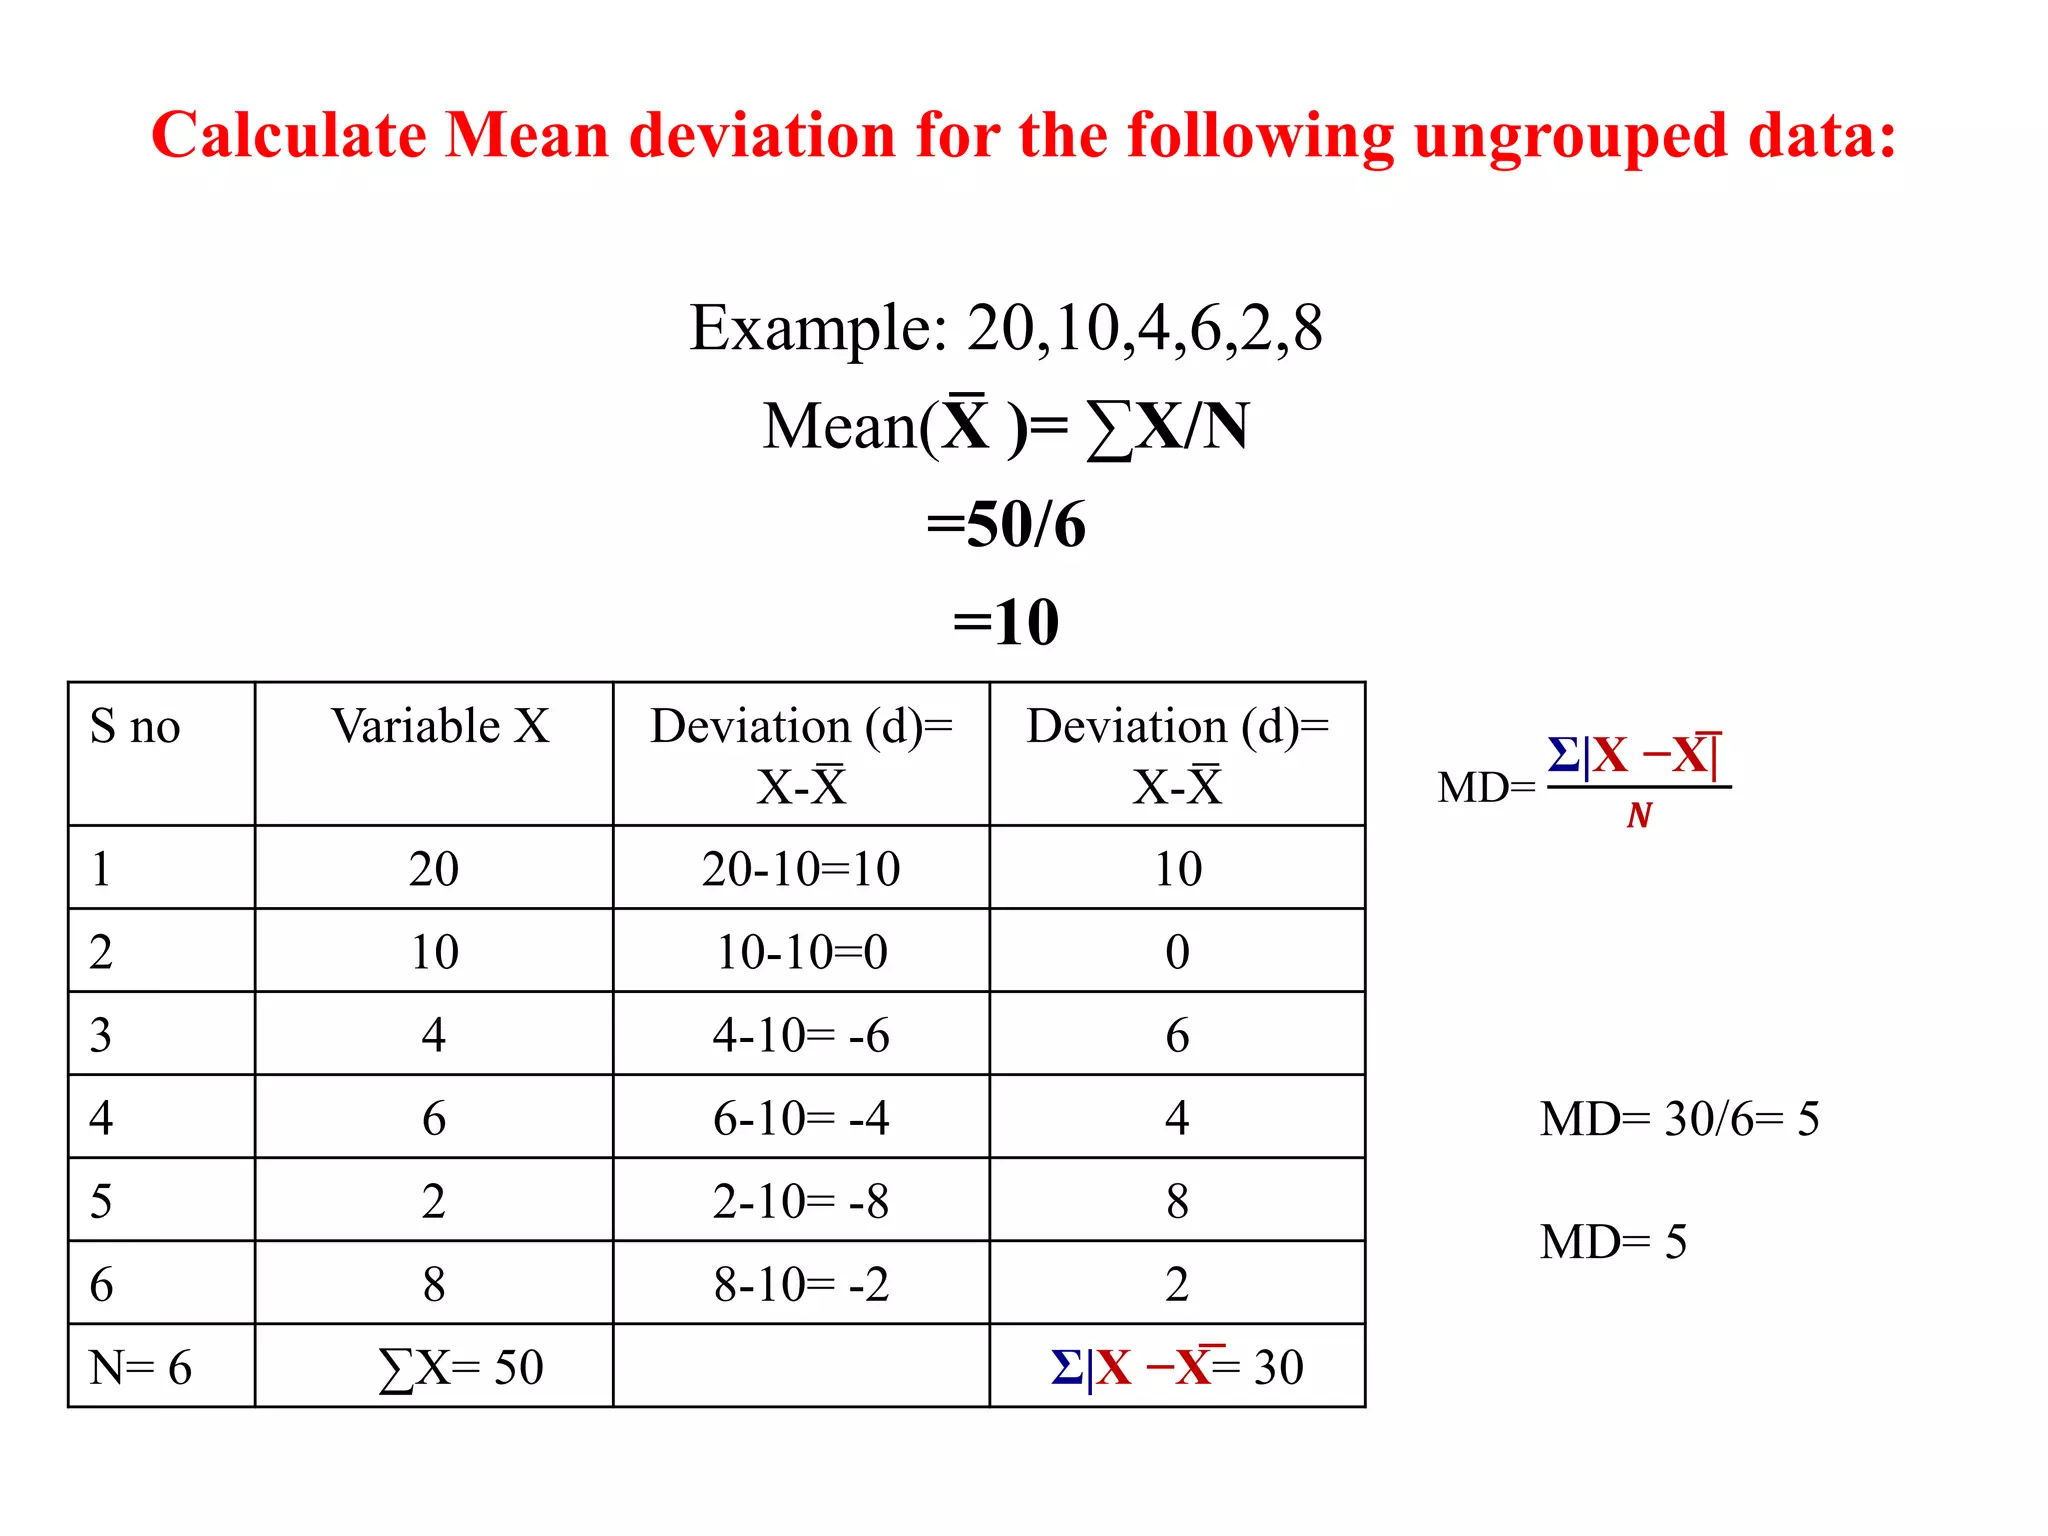
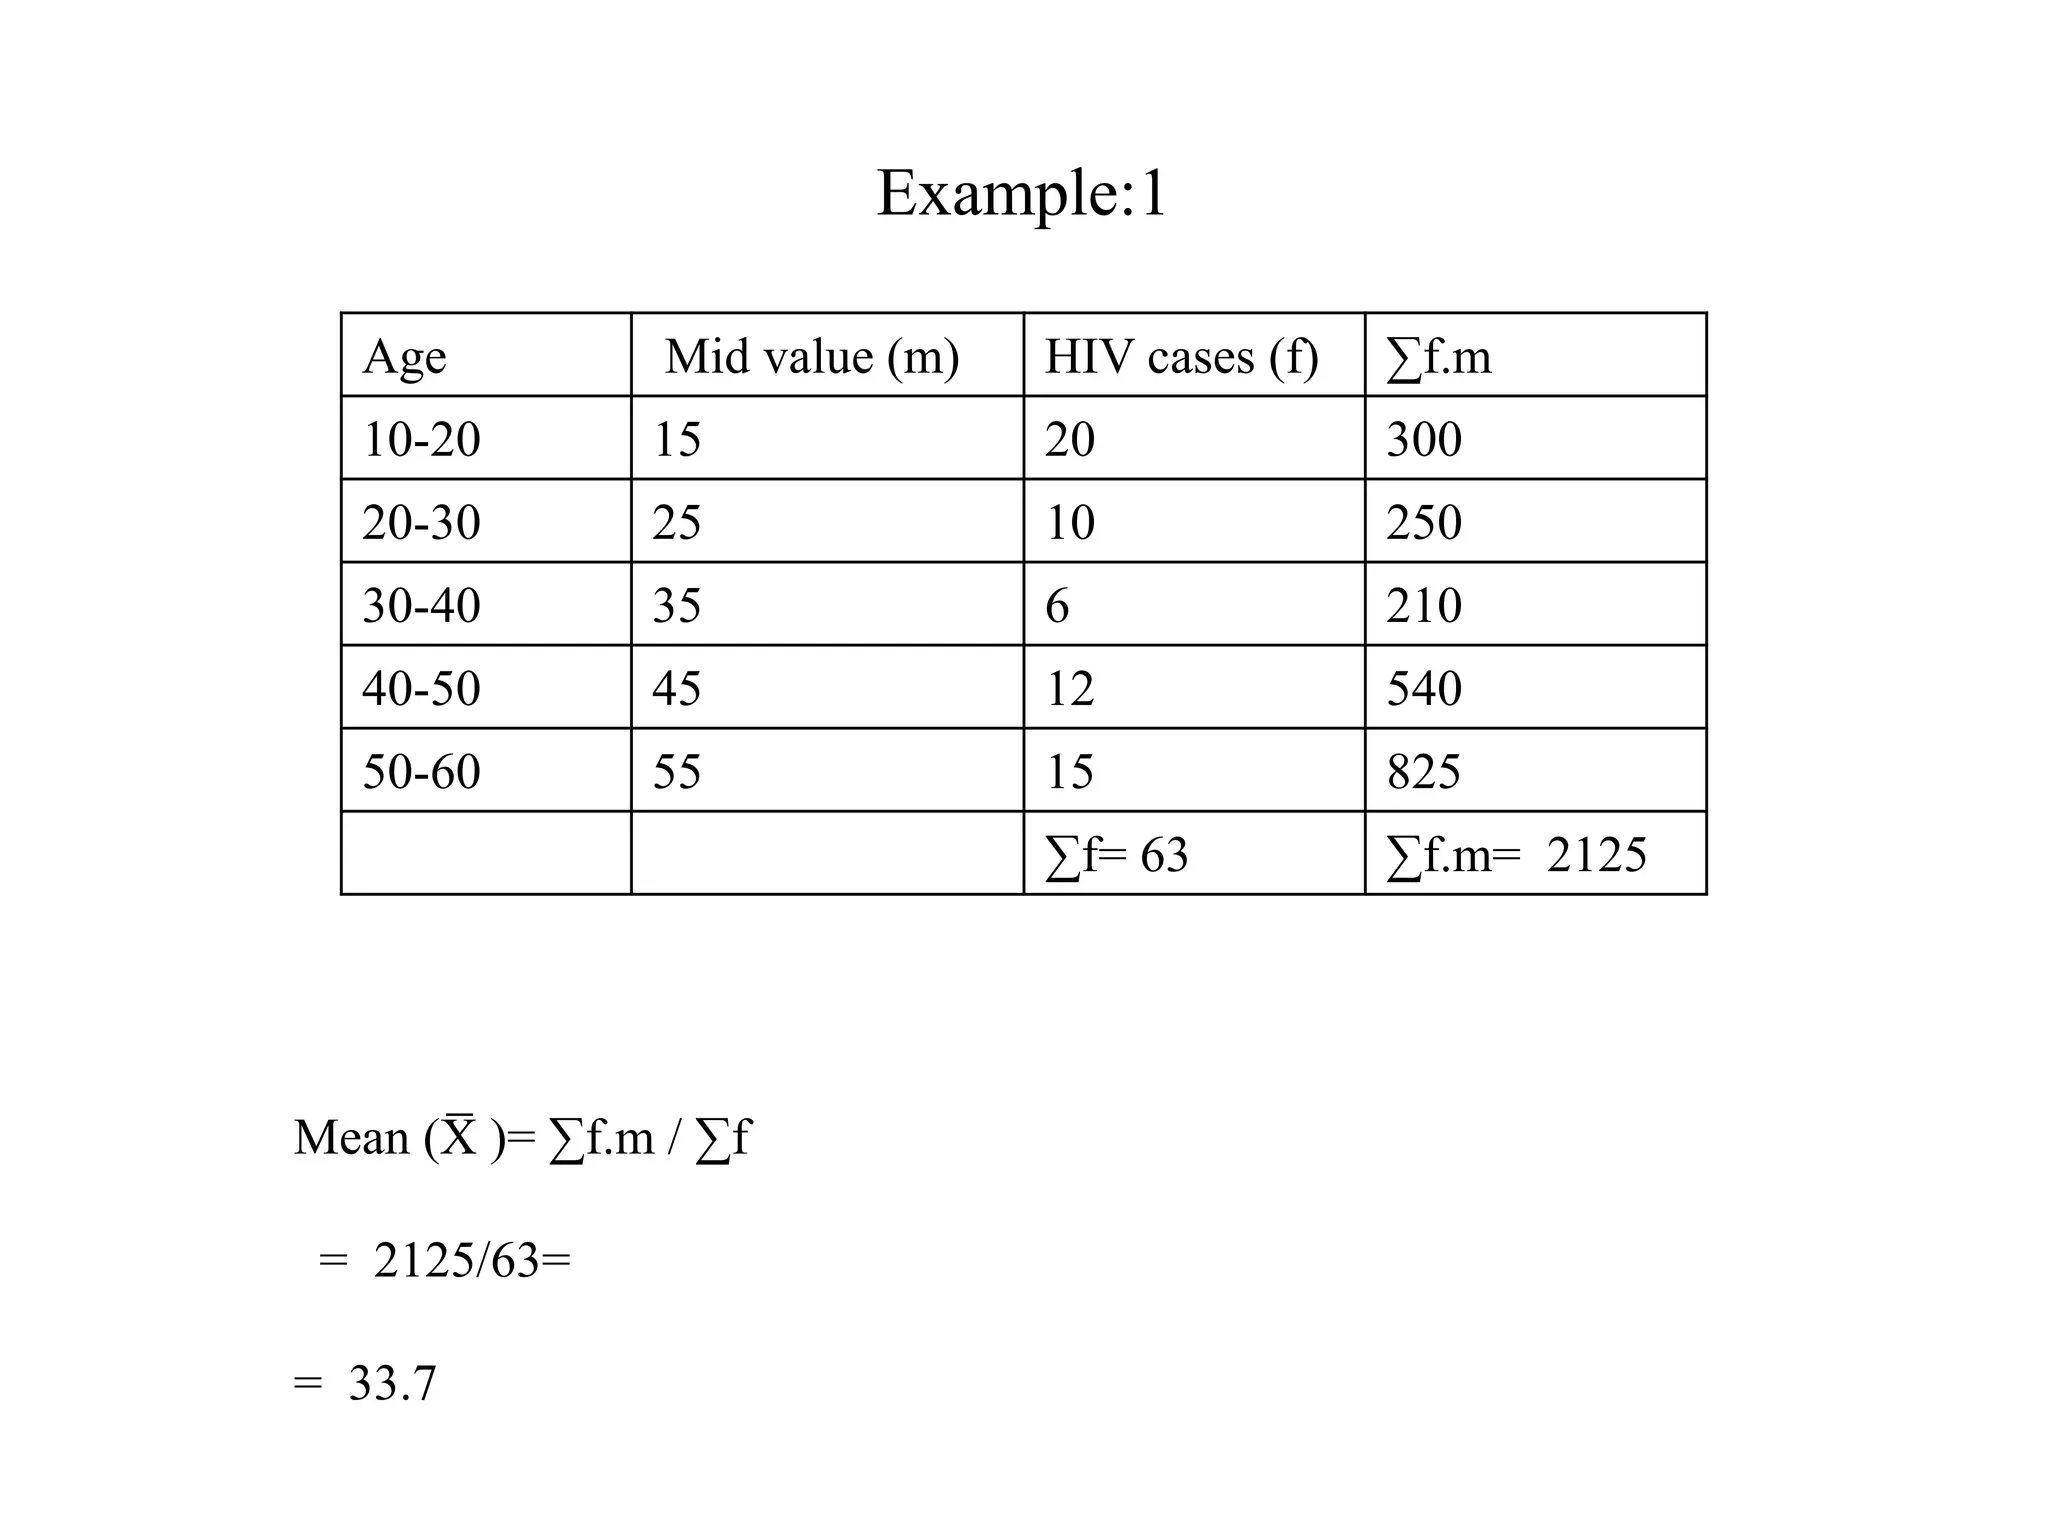
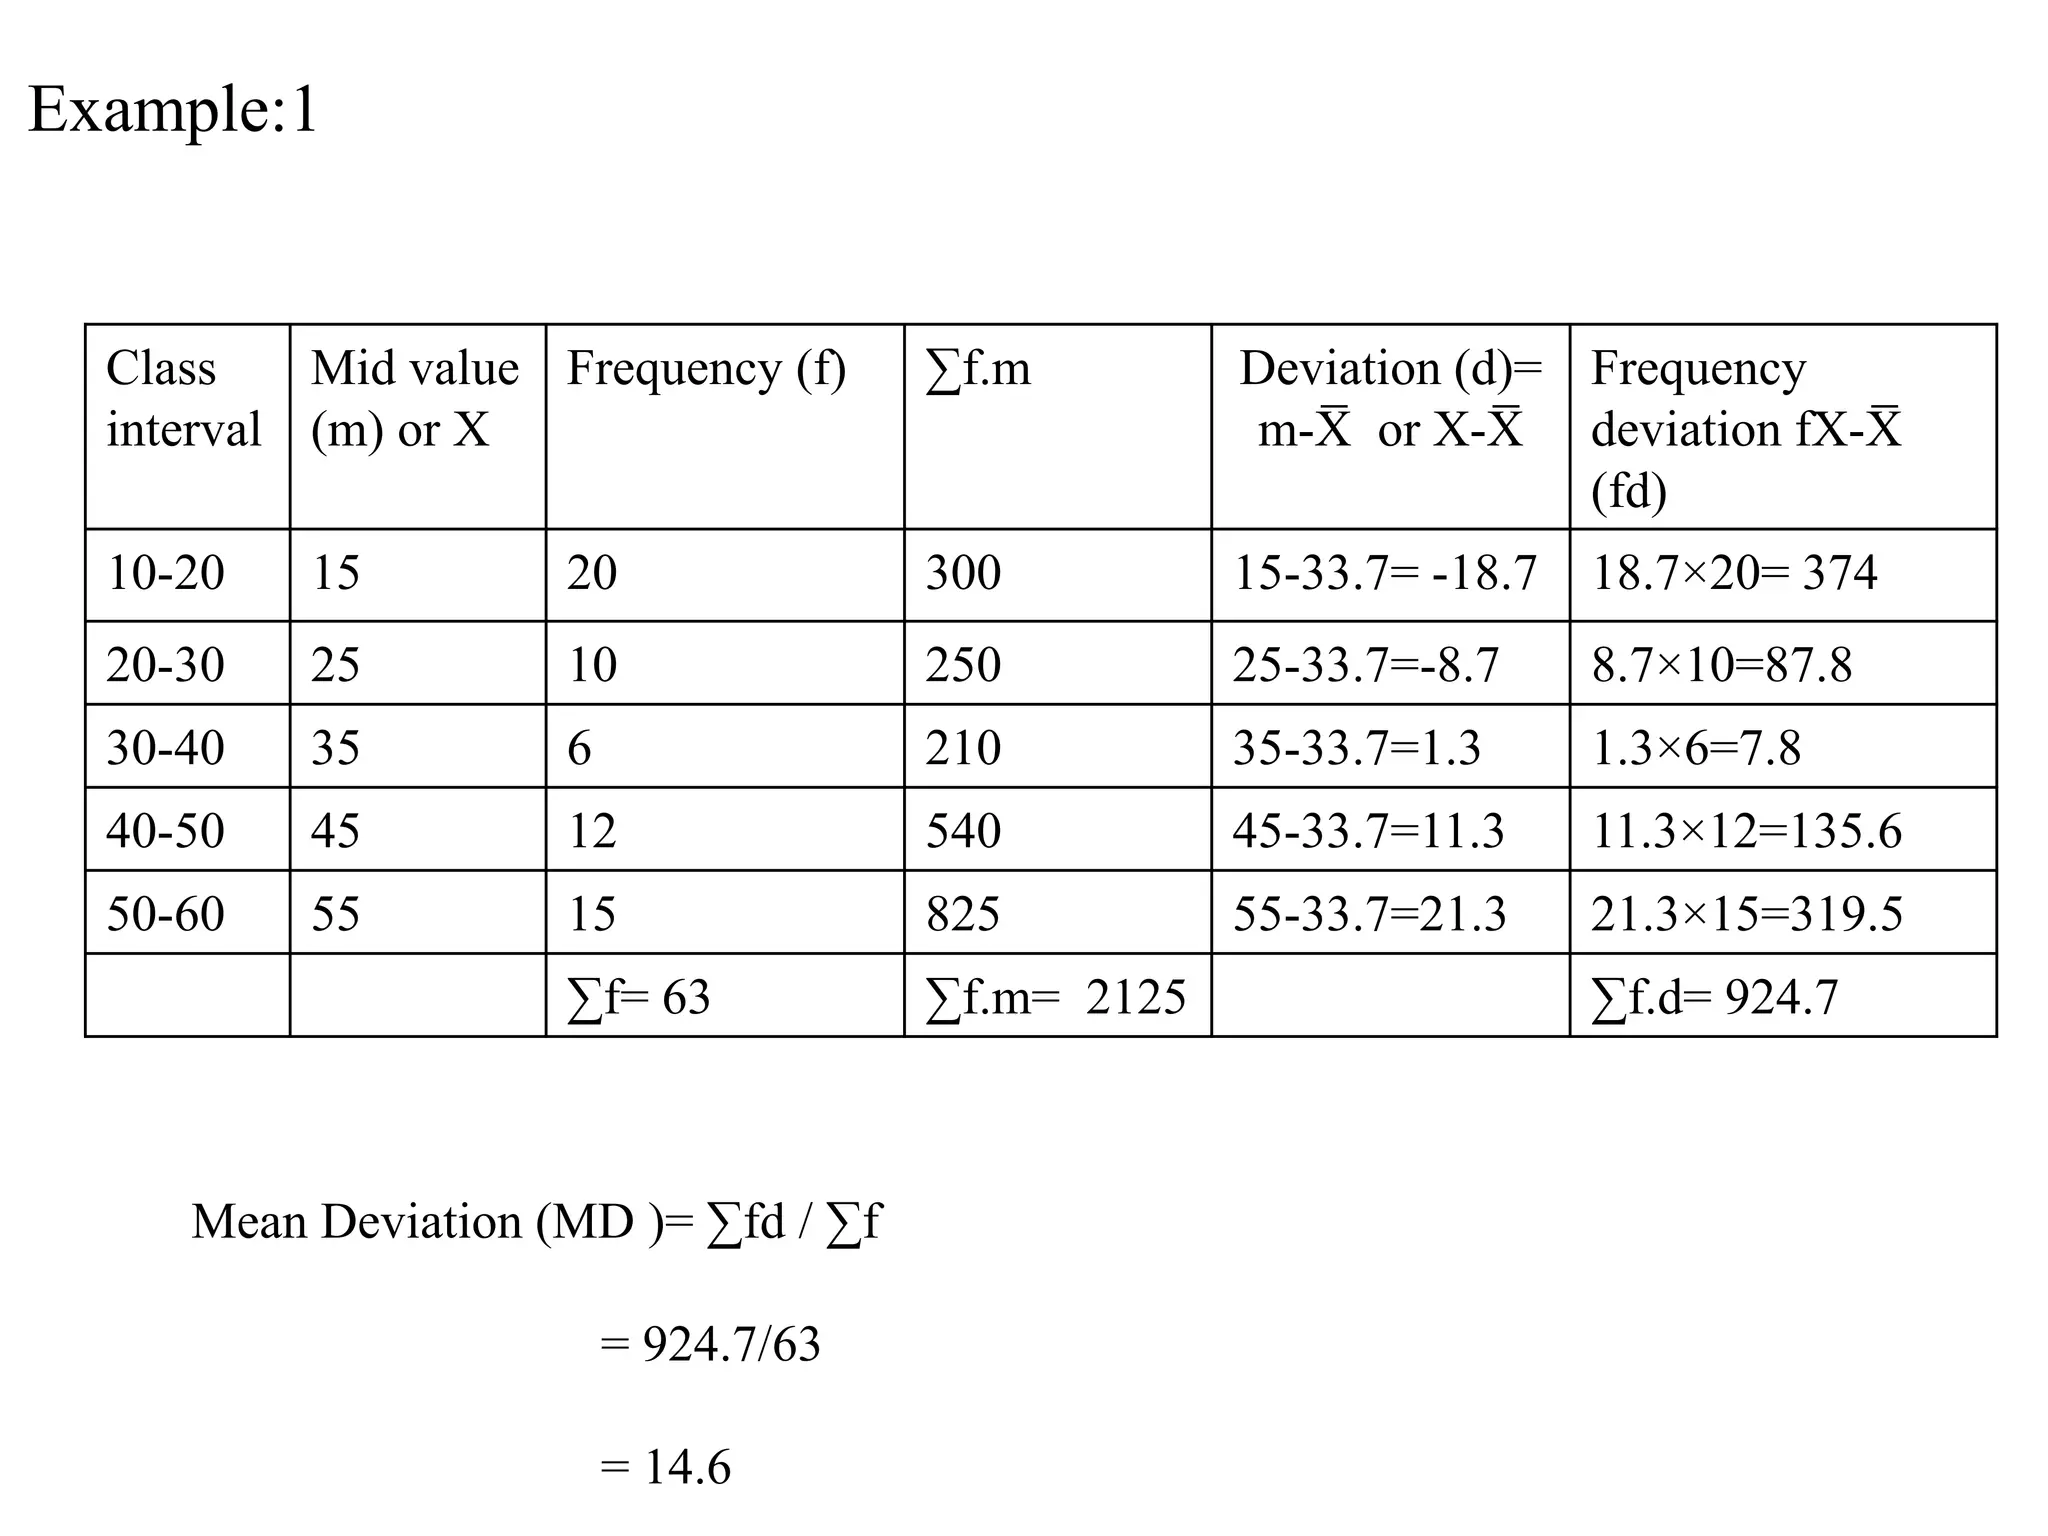
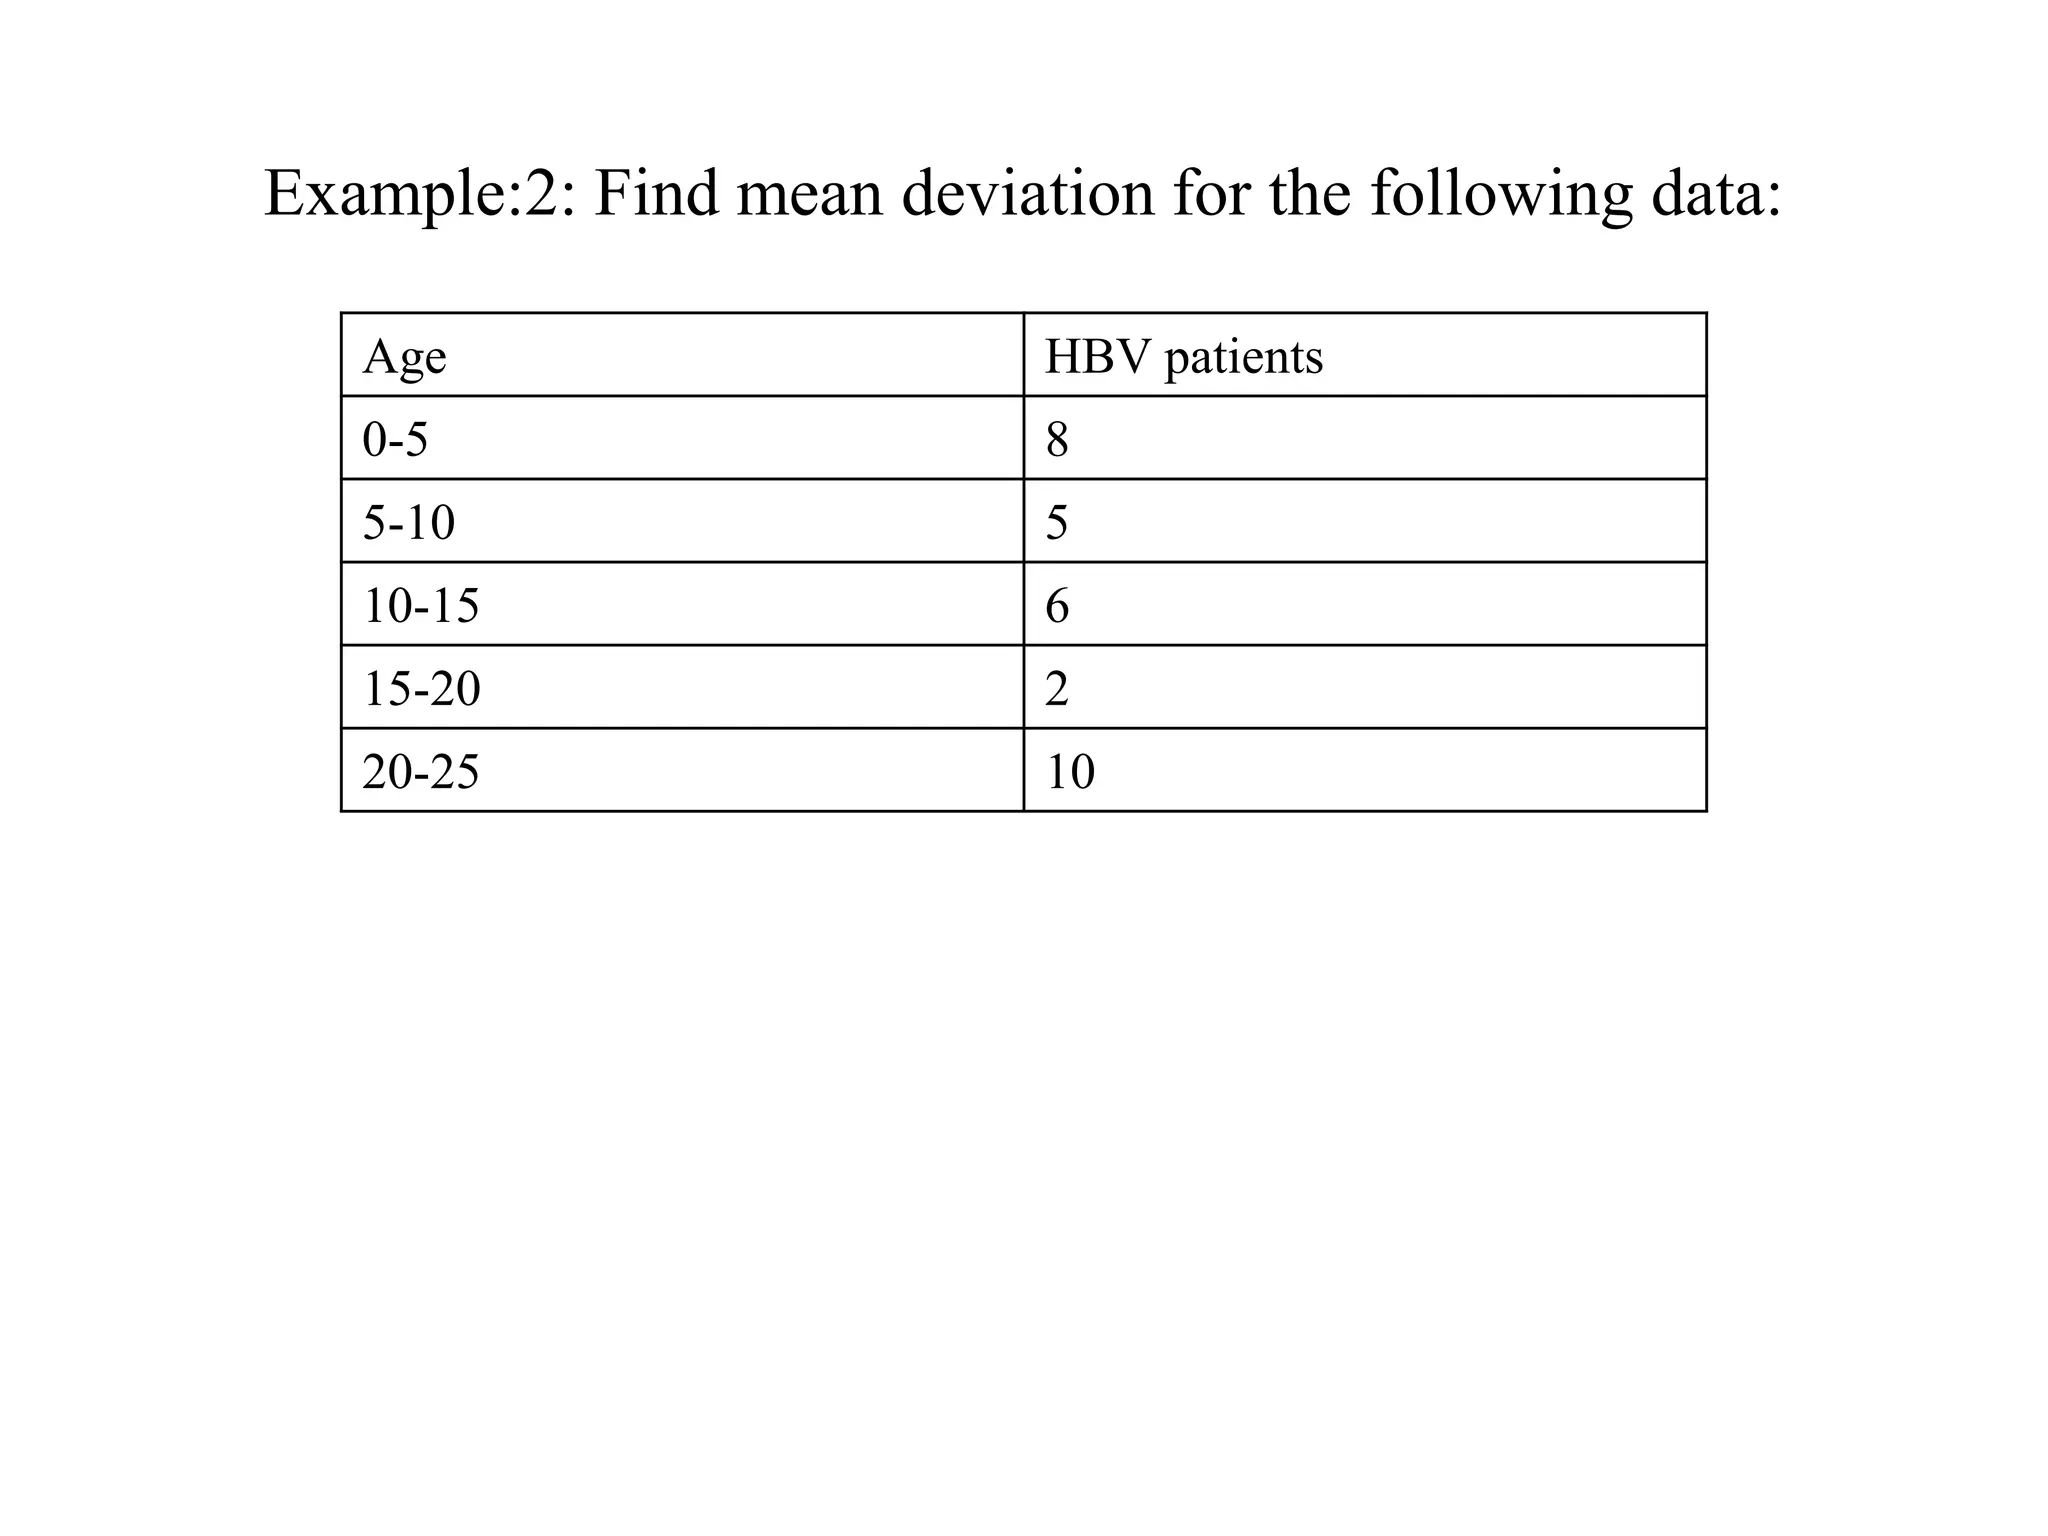
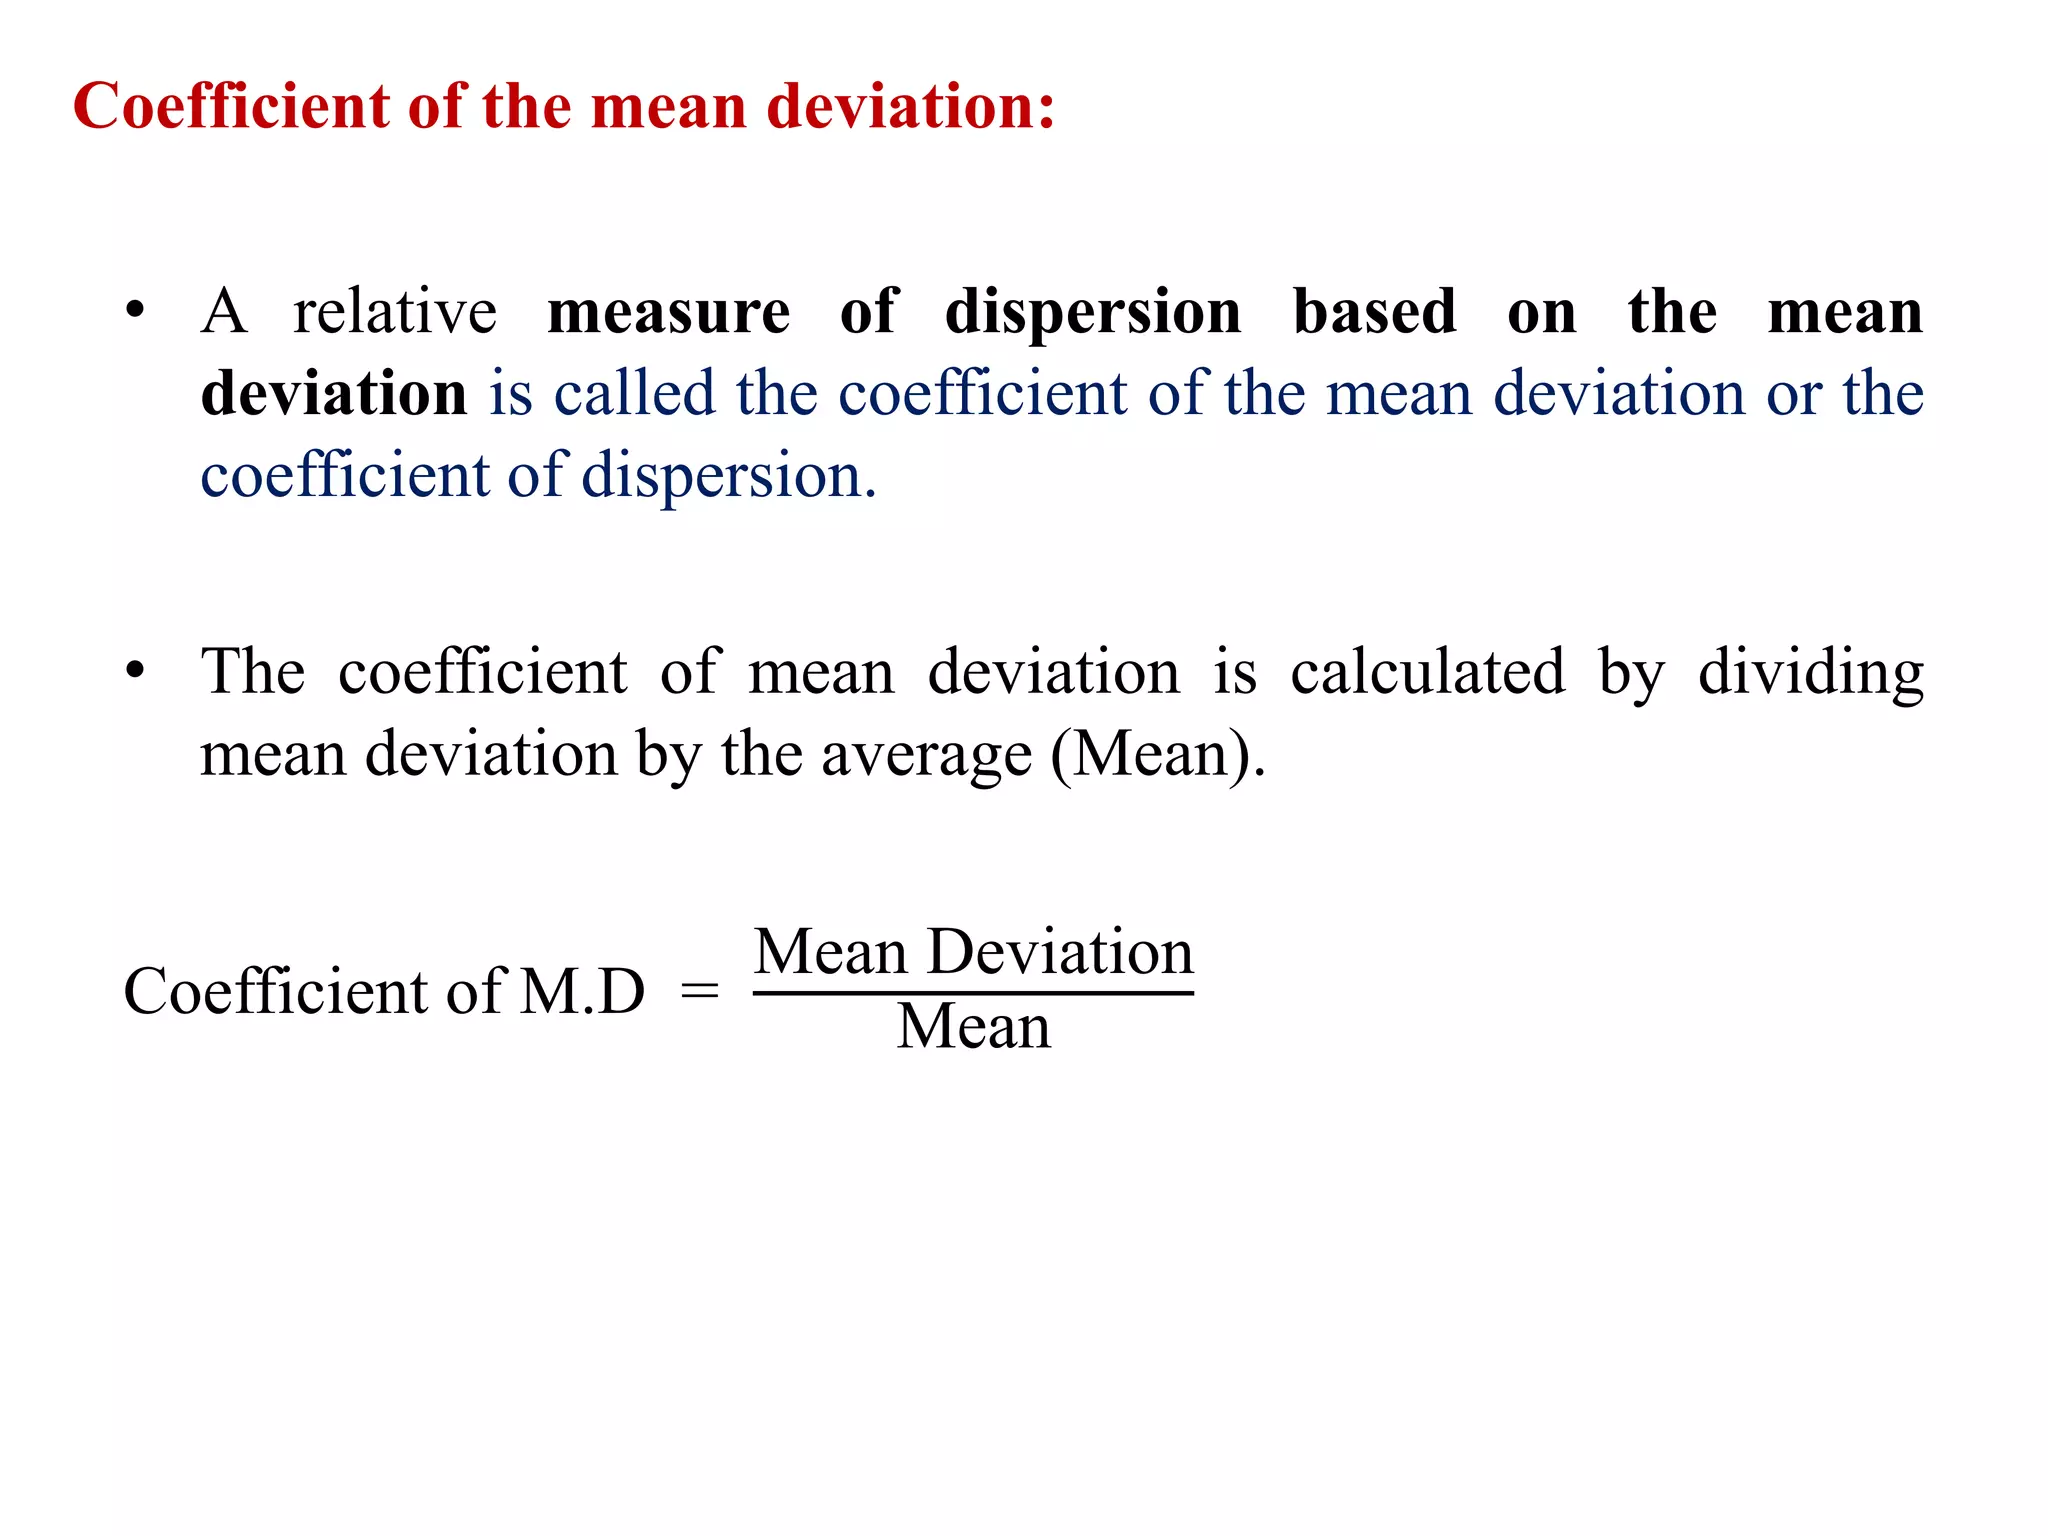
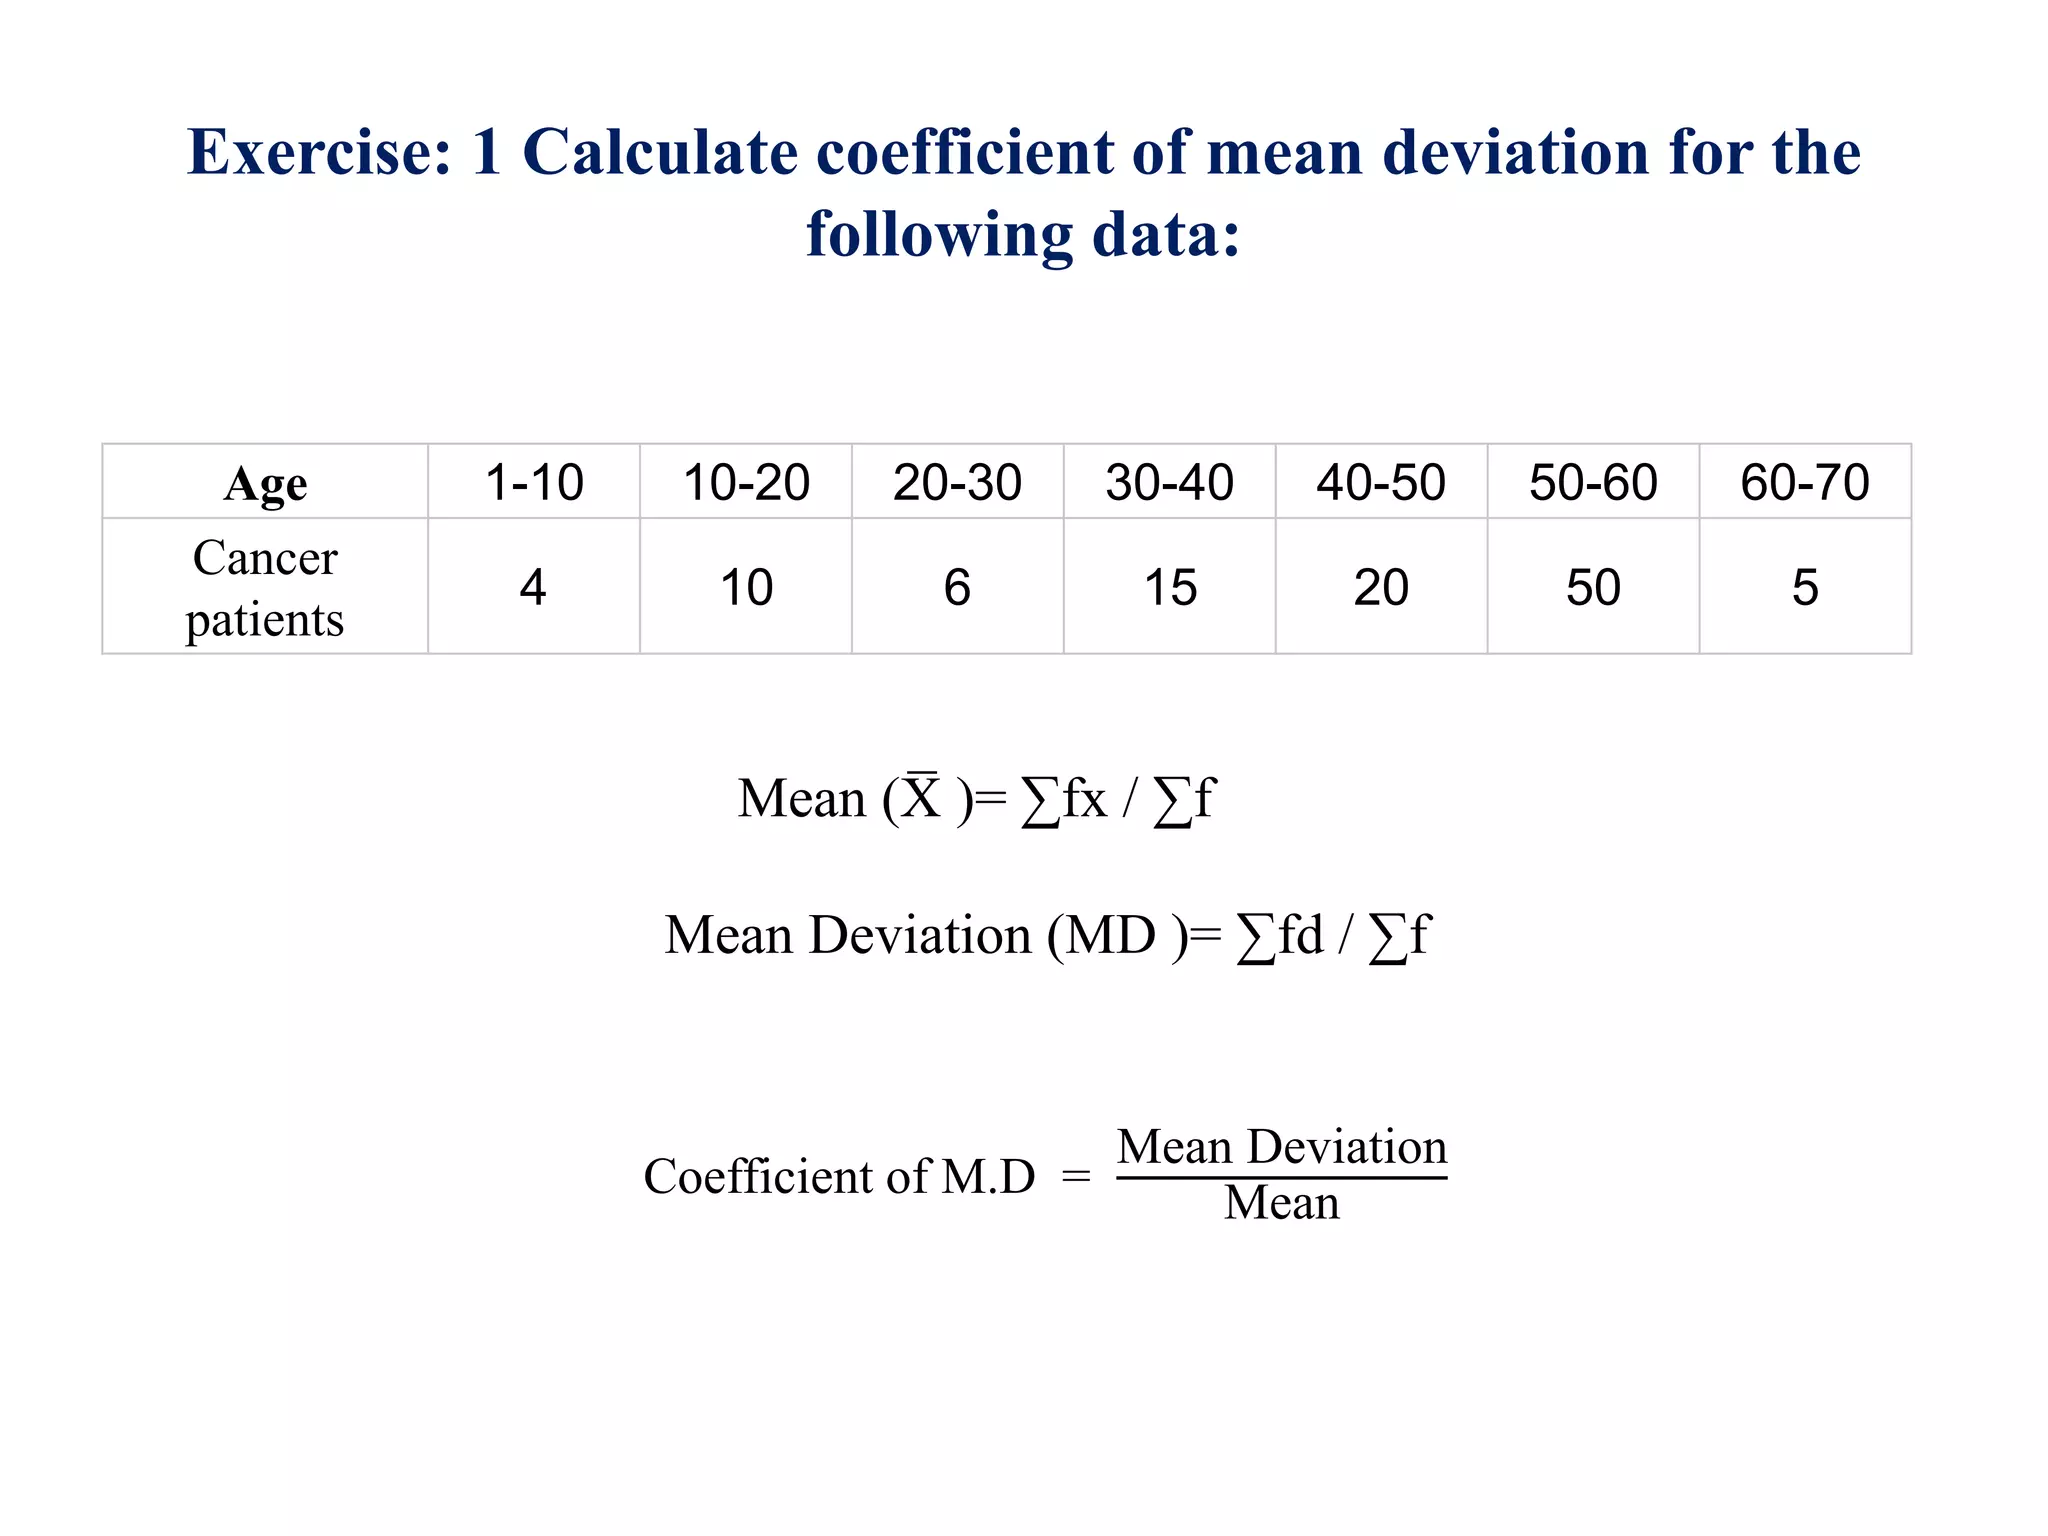
Measures of dispersion
Dr. Harinatha Reddy Aswartha
Department of Life Sciences
Range:
Range:
• The Range is the difference between the highest and smallest values
in a set of observations.
Range: Large value in the series of data − Smallest value in the series data.
R= L −S
• Example:
141, 112, 125, 100, 115, 122, 150,
Arrange the data in ascending order: 100,112, 115,122,125,141,150.
Highest value: 150
Smallest value: 100
Range: 150-100= 50
Example: Calculate range for the following ungrouped data:
• 100, 112, 125, 135, 150, 152, 150, 155, 160, 130,128, 138,
133, 143, 147, 151, 154, 156, 112, 116.
Range of Grouped data in continuous series:
• Range= H −L
• H= Upper limit of the highest class.
• L= Lower limit of the lowest class.
Class interval Frequency
10-20 48
21-30 62
31-40 4
41-50 58
51- 60 69
Range= 60-10= 50
RANGE= 50
Calculate Range for following data:?
• Range= H −L
• H= Upper limit of the highest class.
• L= Lower limit of the lowest class.
Class interval Frequency
40-50 52
51-60 2
61-70 2
71-80 2
81-90 2
Coefficient of Range:
• The measure of the distribution based on range is the
coefficient of range also known as range coefficient of
dispersion.
• Coefficient of range is the relative measure corresponding to
range.
• Coefficient range=
• H= Highest value,
• L= Lowest value,
Coefficient of Range for the following data:
• 100,50,30,20,70,40,10,70
• Coefficient of Range:
= 100-10/100+10
= 90/110
= 0.81
= 81%
Calculate Range and coefficient range for the following data:
Example:
48, 60, 50, 36, 69, 51, 51, 38, 40, 41, 46, 45, 53, 41, 46, 45, 60.
Uses of Range
• Range observations is important in analysing the variations in
the quality of products, like medicines, antibiotics, tonics etc.
• Range is useful measure in the study of fluctuations in
maximum and minimum temperature and humidity are used
for weather forecast.
Mean deviation
150
Mean deviation:
• Mean deviation: can be defined as the mean of all the
deviations in a given set of data obtained from an average.
• Formula for ungrouped data:
Mean deviation (MD):
Σ|X −X̅|
𝑵
X= Variable or Value of the observation
X̅: Arithmetic mean or mean or Average
N: Total number of observations
X-X̅ (d): Deviation
Calculate Mean deviation for the following ungrouped data:
Example: 20,10,4,6,2,8
Mean(X
̅ )= ∑X/N
=50/6
=10
MD=
Σ|X −X̅|
𝑵
S no Variable X Deviation (d)=
X-X
̅
Deviation (d)=
X-X
̅
1 20 20-10=10 10
2 10 10-10=0 0
3 4 4-10= -6 6
4 6 6-10= -4 4
5 2 2-10= -8 8
6 8 8-10= -2 2
N= 6 ∑X= 50 Σ|X −X̅= 30
MD= 30/6= 5
MD= 5
Calculate mean deviation for following ungrouped data:
Examples: 5,10,20,2,10,20 ?
Mean deviation for grouped data (Continuous series)
• Mean Deviation (MD )= ∑fd / ∑f
• ∑fd = Sum of multiplication of each frequency and deviation
form mean.
• ∑f= Sum of all the frequency.
Example:1
Age H1N1 patients
10-20 20
20-30 10
30-40 6
40-50 12
50-60 15
Example:1
Mean (X
̅ )= ∑f.m / ∑f
= 2125/63=
= 33.7
Age Mid value (m) HIV cases (f) ∑f.m
10-20 15 20 300
20-30 25 10 250
30-40 35 6 210
40-50 45 12 540
50-60 55 15 825
∑f= 63 ∑f.m= 2125
Example:1
Class
interval
Mid value
(m) or X
Frequency (f) ∑f.m Deviation (d)=
m-X
̅ or X-X
̅
Frequency
deviation fX-X
̅
(fd)
10-20 15 20 300 15-33.7= -18.7 18.7×20= 374
20-30 25 10 250 25-33.7=-8.7 8.7×10=87.8
30-40 35 6 210 35-33.7=1.3 1.3×6=7.8
40-50 45 12 540 45-33.7=11.3 11.3×12=135.6
50-60 55 15 825 55-33.7=21.3 21.3×15=319.5
∑f= 63 ∑f.m= 2125 ∑f.d= 924.7
Mean Deviation (MD )= ∑fd / ∑f
= 924.7/63
= 14.6
Example:2: Find mean deviation for the following data:
Age HBV patients
0-5 8
5-10 5
10-15 6
15-20 2
20-25 10
Uses of mean deviation:
• Mean deviation used in medicine, microbiology,
pharmacology, social sciences and in business etc.
• Mean deviation is good for sample studies where
detailed study is not required.
Coefficient of mean deviation
• A relative measure of dispersion based on the mean
deviation is called the coefficient of the mean deviation or the
coefficient of dispersion.
• The coefficient of mean deviation is calculated by dividing
mean deviation by the average (Mean).
Coefficient of M.D =
Mean Deviation
Mean
Coefficient of the mean deviation:
Calculate coefficient of mean deviation for the following grouped
data:
Age 3-4 4-5 5-6 6-7 7-8 8-9 9-10
Diabetes
PATIENTS
3 7 22 60 85 32 8
Mean Deviation (MD )= ∑fd / ∑f
Mean (X
̅ )= ∑fm / ∑f
Coefficient of M.D =
Mean Deviation
Mean
Class
interv
al
Middle
value
(m or
X)
Freque
ncy (f)
fm Deviation (d)=
m-X
̅
(Step: 2)
Frequency
deviation (fd)
(Step: 3)
3-4 3.5 3 10.5 3.5-7.09= 3.59 3×3.59=10.77
4-5 4.5 7 31.5 4.5-7.09=2.59 4.5×2.59=18.13
5-6 5.5 22 121. 1.59 34.98
6-7 6.5 60 390 0.59 35.40
7-8 7.5 85 637.5 0.41 34.85
8-9 8.5 32 272. 1.41 45.12
9-10 9.5 8 76 2.41 19.28
∑f=217 ∑fm=1538.5 ∑fd=198.53
Step:1
Mean (X
̅ )= ∑fm / ∑f
= 1538.5/217
Mean X
̅ = 7.09
Step:4
Mean Deviation (MD )= ∑fd / ∑f
= 198.53/217
= 0.915
Step:5
C.E of M.D =
Mean Deviation
Mean
= 0.915/7.09
= 0.129
Exercise: 1 Calculate coefficient of mean deviation for the
following data:
Age 1-10 10-20 20-30 30-40 40-50 50-60 60-70
Cancer
patients
4 10 6 15 20 50 5
Mean Deviation (MD )= ∑fd / ∑f
Mean (X
̅ )= ∑fx / ∑f
Coefficient of M.D =
Mean Deviation
Mean
THANK YOU

Biostatistics Measures of dispersion

  • 1.
    Measures of dispersion Dr.Harinatha Reddy Aswartha Department of Life Sciences
  • 2.
  • 3.
    Range: • The Rangeis the difference between the highest and smallest values in a set of observations. Range: Large value in the series of data − Smallest value in the series data. R= L −S • Example: 141, 112, 125, 100, 115, 122, 150, Arrange the data in ascending order: 100,112, 115,122,125,141,150. Highest value: 150 Smallest value: 100 Range: 150-100= 50
  • 4.
    Example: Calculate rangefor the following ungrouped data: • 100, 112, 125, 135, 150, 152, 150, 155, 160, 130,128, 138, 133, 143, 147, 151, 154, 156, 112, 116.
  • 5.
    Range of Groupeddata in continuous series: • Range= H −L • H= Upper limit of the highest class. • L= Lower limit of the lowest class. Class interval Frequency 10-20 48 21-30 62 31-40 4 41-50 58 51- 60 69 Range= 60-10= 50 RANGE= 50
  • 6.
    Calculate Range forfollowing data:? • Range= H −L • H= Upper limit of the highest class. • L= Lower limit of the lowest class. Class interval Frequency 40-50 52 51-60 2 61-70 2 71-80 2 81-90 2
  • 7.
  • 8.
    Coefficient of Range: •The measure of the distribution based on range is the coefficient of range also known as range coefficient of dispersion. • Coefficient of range is the relative measure corresponding to range. • Coefficient range= • H= Highest value, • L= Lowest value,
  • 9.
    Coefficient of Rangefor the following data: • 100,50,30,20,70,40,10,70 • Coefficient of Range: = 100-10/100+10 = 90/110 = 0.81 = 81%
  • 10.
    Calculate Range andcoefficient range for the following data: Example: 48, 60, 50, 36, 69, 51, 51, 38, 40, 41, 46, 45, 53, 41, 46, 45, 60.
  • 11.
    Uses of Range •Range observations is important in analysing the variations in the quality of products, like medicines, antibiotics, tonics etc. • Range is useful measure in the study of fluctuations in maximum and minimum temperature and humidity are used for weather forecast.
  • 12.
  • 13.
    Mean deviation: • Meandeviation: can be defined as the mean of all the deviations in a given set of data obtained from an average. • Formula for ungrouped data: Mean deviation (MD): Σ|X −X̅| 𝑵 X= Variable or Value of the observation X̅: Arithmetic mean or mean or Average N: Total number of observations X-X̅ (d): Deviation
  • 14.
    Calculate Mean deviationfor the following ungrouped data: Example: 20,10,4,6,2,8 Mean(X ̅ )= ∑X/N =50/6 =10 MD= Σ|X −X̅| 𝑵 S no Variable X Deviation (d)= X-X ̅ Deviation (d)= X-X ̅ 1 20 20-10=10 10 2 10 10-10=0 0 3 4 4-10= -6 6 4 6 6-10= -4 4 5 2 2-10= -8 8 6 8 8-10= -2 2 N= 6 ∑X= 50 Σ|X −X̅= 30 MD= 30/6= 5 MD= 5
  • 15.
    Calculate mean deviationfor following ungrouped data: Examples: 5,10,20,2,10,20 ?
  • 16.
    Mean deviation forgrouped data (Continuous series) • Mean Deviation (MD )= ∑fd / ∑f • ∑fd = Sum of multiplication of each frequency and deviation form mean. • ∑f= Sum of all the frequency.
  • 17.
    Example:1 Age H1N1 patients 10-2020 20-30 10 30-40 6 40-50 12 50-60 15
  • 18.
    Example:1 Mean (X ̅ )=∑f.m / ∑f = 2125/63= = 33.7 Age Mid value (m) HIV cases (f) ∑f.m 10-20 15 20 300 20-30 25 10 250 30-40 35 6 210 40-50 45 12 540 50-60 55 15 825 ∑f= 63 ∑f.m= 2125
  • 19.
    Example:1 Class interval Mid value (m) orX Frequency (f) ∑f.m Deviation (d)= m-X ̅ or X-X ̅ Frequency deviation fX-X ̅ (fd) 10-20 15 20 300 15-33.7= -18.7 18.7×20= 374 20-30 25 10 250 25-33.7=-8.7 8.7×10=87.8 30-40 35 6 210 35-33.7=1.3 1.3×6=7.8 40-50 45 12 540 45-33.7=11.3 11.3×12=135.6 50-60 55 15 825 55-33.7=21.3 21.3×15=319.5 ∑f= 63 ∑f.m= 2125 ∑f.d= 924.7 Mean Deviation (MD )= ∑fd / ∑f = 924.7/63 = 14.6
  • 20.
    Example:2: Find meandeviation for the following data: Age HBV patients 0-5 8 5-10 5 10-15 6 15-20 2 20-25 10
  • 21.
    Uses of meandeviation: • Mean deviation used in medicine, microbiology, pharmacology, social sciences and in business etc. • Mean deviation is good for sample studies where detailed study is not required.
  • 22.
  • 23.
    • A relativemeasure of dispersion based on the mean deviation is called the coefficient of the mean deviation or the coefficient of dispersion. • The coefficient of mean deviation is calculated by dividing mean deviation by the average (Mean). Coefficient of M.D = Mean Deviation Mean Coefficient of the mean deviation:
  • 24.
    Calculate coefficient ofmean deviation for the following grouped data: Age 3-4 4-5 5-6 6-7 7-8 8-9 9-10 Diabetes PATIENTS 3 7 22 60 85 32 8 Mean Deviation (MD )= ∑fd / ∑f Mean (X ̅ )= ∑fm / ∑f Coefficient of M.D = Mean Deviation Mean
  • 25.
    Class interv al Middle value (m or X) Freque ncy (f) fmDeviation (d)= m-X ̅ (Step: 2) Frequency deviation (fd) (Step: 3) 3-4 3.5 3 10.5 3.5-7.09= 3.59 3×3.59=10.77 4-5 4.5 7 31.5 4.5-7.09=2.59 4.5×2.59=18.13 5-6 5.5 22 121. 1.59 34.98 6-7 6.5 60 390 0.59 35.40 7-8 7.5 85 637.5 0.41 34.85 8-9 8.5 32 272. 1.41 45.12 9-10 9.5 8 76 2.41 19.28 ∑f=217 ∑fm=1538.5 ∑fd=198.53 Step:1 Mean (X ̅ )= ∑fm / ∑f = 1538.5/217 Mean X ̅ = 7.09 Step:4 Mean Deviation (MD )= ∑fd / ∑f = 198.53/217 = 0.915 Step:5 C.E of M.D = Mean Deviation Mean = 0.915/7.09 = 0.129
  • 26.
    Exercise: 1 Calculatecoefficient of mean deviation for the following data: Age 1-10 10-20 20-30 30-40 40-50 50-60 60-70 Cancer patients 4 10 6 15 20 50 5 Mean Deviation (MD )= ∑fd / ∑f Mean (X ̅ )= ∑fx / ∑f Coefficient of M.D = Mean Deviation Mean
  • 27.