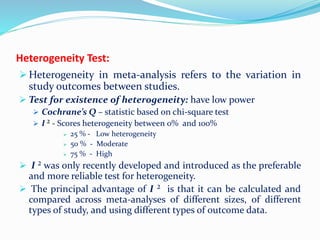
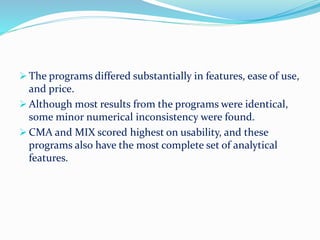
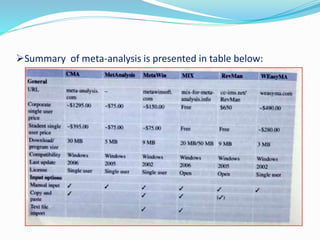
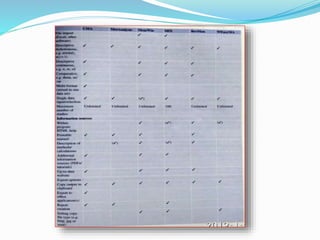
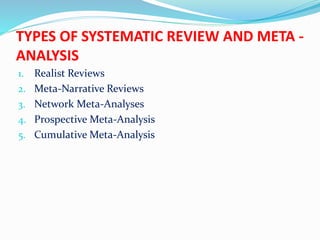
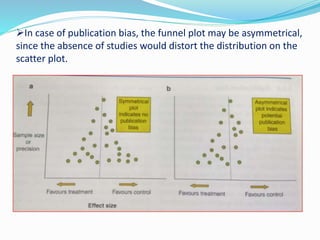
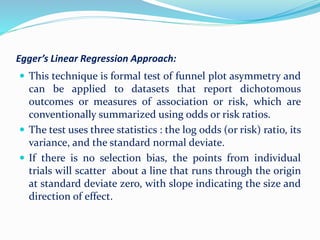
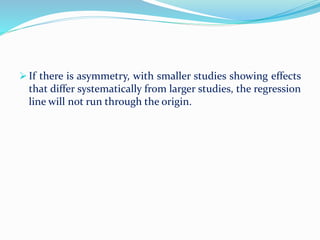
STATISTICS IN META ANALYSIS
Presented by:
Dr. Shrirang Sangle
Content:
 Introduction
 Quantitative Synthesis (Meta-Analysis)
 Odds and Odds Ratio
 Risk and Relative Risk
 Confidence Intervals
 Forest Plot
 The Heterogeneity Test
 Fixed and Random Effect models
 Software dedicated to Meta- analysis
 Particular Types of Systematic reviews and Meta–Analysis
 Pitfalls in Systematic Reviews
INTRODUCTION
 Health care professionals are increasingly required to base
their practice on the best available evidence.
 The quality of the studies may be variable, and the individual
studies might have produced conflicting results.
 It is therefore important that health care decisions are not
based solely on one or two studies without account being
taken of the whole range of research information available on
that topic.
 Systematic review have rapidly gained an important place in
aiding clinical decision making in medicine, although dentistry
has been a little slower to adopt this approach.
 Systematic reviews are themselves considered a research
activity, although the data are derived from primary studies
in the area of interest rather than from direct
experimentation ( Needleman 2002).
Quantitative Synthesis (Meta-Analysis)
 Meta-Analysis is not always possible when necessary data
to perform meta-analysis cannot be obtained, and it may
not be appropriate when the data are sparse or when the
studies are too heterogeneous to be sensibly combined.
 The meta-analysis is performed to increase the power, to
improve precision, and to answer the questions not posed
by the individual studies, and to settle controversies arising
from conflicting studies or to generate new hypothesis (
Manchikanti et al. 2009; Egger et al. 1997)
 Meta-Analysis is a two-stage process.
 The first stage involves the calculation of a measure of
treatment effect with its 95% confidence intervals (CI) for
each individual study.
 The summary statistics that are usually used to measure
treatment effect include odds ratios OR, relative risks (RR)
and risk difference.
 In second stage of meta-analysis, an overall treatment
effect is calculated as weighted average of the individual
summary statistics.
 The typical graph for displaying the results of meta-
analysis is called a ‘forest plot’.
Odds and Odds Ratio:
 The odds for a group is defined as the number of patients
in the group who achieve the stated end point divided by
the number of patients who do not.
 For example: the odds of acne resolution during treatment
with an antibiotic in a group of 10 patients may be 6-4 (6 with
resolution of acne divided by 4 without = 1.5); in a control
group , the odds may be 3-7 (0.43).
 The odds ratio, as the name implies, is a ratio of odds.
 It is defined as the ratio of the odds of the treatment group
to the odds of the control group.
 For example: In above example, the odds ratio of treatment
to control group would be 3.5 ( 1.5 divided by 0.43).
Risk and Relative Risk:
 Risk, as opposed to odds, is calculated as the number of
patients in the group who achieve the stated endpoint
divided by the total number of patients in the group.
 Risk ratio or relative risk is a ratio of two ‘risks’.
 In the example above, the risks would be 6 in 10 in the
treatment group ( 6 divided by 10 = 0.6) and 3 in 10 in the
control group (0.3), giving a risk ratio, or relative risk of 2 (0.6
divided by 0.3) (Akobeng 2005).
Interpretation of Odds Ratios and Relative Risk
 An odds ratio or relative risk greater than 1 indicates
increased likelihood of the stated outcome being achieved
in the treatment group.
 If the odds ratio or relative risk is less than 1, there is a
decreased likelihood in the treatment group.
 If the odds ratio or relative risk is less than 1, there is
decreased likelihood in the treatment group.
 The ratio of 1 indicates no difference that is , the outcome
is just likely to occur in the treatment group as it is in the
control group.
 As in all estimates of treatment effect, odds ratios or
relative risk reported in meta-analysis should be
accompained by confidence intervals ( Akobeng 2005 )
Confidence Intervals:
 Confidence intervals should accompany estimates of
treatment effects.
 Ninety-five percent confidence intervals are commonly
reported, but the other intervals such as 90% or 99% are
also sometimes used.
 The 95% CI of an estimate will be the range within which
we are 95% certain that the true population treatment
effect will lie.
 The width of a confidence interval indicates the precision
of the estimate.
 The wider the interval, the less the precision.
Forest Plot:
 Meta-analysis results are commonly displayed graphically
as ‘ Forest Plot’.
 In the forest plot each study is represented by a black
square and a horizontal line (CI:95%) .
 The area of the black square reflects the weight of the study
in the meta-analysis.
Heterogeneity Test:
 Heterogeneity in meta-analysis refers to the variation in
study outcomes between studies.
 Test for existence of heterogeneity: have low power
 Cochrane’s Q – statistic based on chi-square test
 I ² - Scores heterogeneity between 0% and 100%
 25 % - Low heterogeneity
 50 % - Moderate
 75 % - High
 I ² was only recently developed and introduced as the preferable
and more reliable test for heterogeneity.
 The principal advantage of I ² is that it can be calculated and
compared across meta-analyses of different sizes, of different
types of study, and using different types of outcome data.
Fixed and Random effect model:
 Presence or absence of heterogeneity influences the
subsequent method of analysis
 Fixed effects model
 Random effects model
FIXED EFFECTS MODEL RANDOM EFFECTS MODEL
 Conduct, if heterogeneity is
absent
 Assumes the size of
treatment effect be same
(fixed) across all studies and
variation due to chance
 When heterogeneity exists we
get:
 A pooled estimate which may
give too much weight to large
studies,
 Conduct, if heterogeneity is
present
 Assumes that the size of
treatment effect does vary
between studies.
 When heterogeneity exists we
get:
 Possibly a different pooled
estimate with a different
interpretation,
 A confidence interval which
is too narrow,
 a P- value which is too small
 When heterogeneity does not
exists:
 a pooled estimate which is
correct,
 a confidence interval which
is correct,
 a P- value which is correct
 a wider confidence interval
 a larger P-value
 When heterogeneity does not
exist:
 a pooled estimate which is
correct,
 a confidence interval which
is too wide,
 a P- value which is too large
Software Dedicated to Meta-analysis of Casual Studies
 Bax et al. ( 2007) systematically assessed the difference in
features, results, and usability of currently available meta-
analysis programs.
 Six programs were included in their review:
 Comprehensive Meta-analysis (CMA)
 MetaAnalysis
 MetaWin,
 MIX,
 RevMan
 WEasyMA
 The programs differed substantially in features, ease of use,
and price.
 Although most results from the programs were identical,
some minor numerical inconsistency were found.
 CMA and MIX scored highest on usability, and these
programs also have the most complete set of analytical
features.
Summary of meta-analysis is presented in table below:
TYPES OF SYSTEMATIC REVIEW AND META -
ANALYSIS
1. Realist Reviews
2. Meta-Narrative Reviews
3. Network Meta-Analyses
4. Prospective Meta-Analysis
5. Cumulative Meta-Analysis
1. Realist Reviews:
 Realist reviews aim to determine how complex programs
work in specific contexts and settings (Pawson et al.2005).
2. Meta-Narrative Reviews:
 Meta-narrative reviews aim to explain complex bodies of
evidence through mapping and comparing different
over-arching storylines (Greenhalgh et al. 2005).
 The phases of meta-narrative review are given in table
3. Network Meta-Analyses
 Network meta-analyses, also known as multiple treatments
meta-analyses, can be used to analyse data from comparisons of
many different treatments (Lumley 2002; salanti et al. 2008).
 They use both direct and indirect comparisons and can be used
to compare interventions that have not been directly compared.
 Lumley (2002) has presented methods of estimating treatment
differences between treatments that have not been directly
compared in a randomized trial and, more importantly, methods
of estimating the uncertainty in these differences.
 These methods require information from large number of
different treatment comparisons.
4. Prospective Meta-Analysis
 Systematic reviews are by nature retrospective because the
trials included are usually identified after the trials have
been completed and the results reported.
 A prospective meta-analysis (PMA) is a meta-analysis of
studies that were identified, evaluated, and determined to
be eligible for the meta-analysis before the results of any of
those studies became known.
 PMA can help to overcome some of the recognized
problems of retrospective meta-analyses by:
a) Enabling hypotheses to be specified a priori ignorant of
the results of individual trials.
b) Enabling prospective application of study selection
criteria.
c) Enabling a priori statements of intended analyses,
including subgroup analyses, to be made before the
results of individual trials are known.
 This avoids potential difficulties in interpretation related
to the data-dependent emphasis on particular subgroups
( Higgins and Green 2011 ).
5. Cumulative Meta-Analysis
 It is defined as the repeated performance of meta-analysis
whenever a new trial becomes available for inclusion.
 Such cumulative meta-analysis can retrospectively identify
the point in time when a treatment effect first reached
conventional levels of significance (Egger and Smith 1997).
STEPS:
Pitfalls in Systematic Reviews:
 Although systematic reviews are considered the highest
quality of evidence, there may be concerns about
systematic reviews of which the reader should be aware (
farquhar and Vail 2006).
Failures to take into Account Losses to Follow-up:
 This is also known as attrition bias.
 Each study should report the patients who drop out and
the reasons why, if known.
 It is possible that the reasons for dropping out could be due
to adverse events, or poor outcomes, and the use of
intention to treat analysis is usually recommended to
address dropouts.
Funding Bias:
 A systematic review has shown that published studies
funded by commercial interests had four times the odds of
favouring the experimental intervention, due to more
careful selection of which studies to support, the narrow
inclusion criteria that many industry trials apply, avoiding
patients who have a poor prognosis, or patients with
comorbidities, or selection of studies to submit for
publication.
Publication Bias:
 Publication bias can be seen to originate from three
interrelated sources: researchers, journal editors, and
research sponsors.
 Evidence suggest that researchers are less likely to ‘write
up’ and submit the study if its ‘negative’ , and journal
editors are less likely to publish this research if it is
submitted.
 However the sponsors of research may have a financial
stake in the results of research into their own products-
paticularly in the fields of pharmaceutical evaluation.
 Publication bias can be considered to have 3 stages:
1. Prepublication bias occurs in the performance of research,
caused by ignorance, sloth, greed, or the double standard
applied to clinical trials but not to clinical practice.
2. Publication bias refers to basing acceptance or rejection of
manuscript on whether it supports the treatment tested.
Potentially biased reviewers are of equal concern.
3. Post publication bias occurs in publishing interpretations,
reviews, and meta-analyses of published clinical trials.
Funnel Plot Analysis:
 A common approach is based on scatter plots of the
treatment effect estimated by individual studies versus a
measure of study size or precision ( the funnel plot).
 In this graphical representation, larger and more precise
studies are plotted at the top, near the combined effect
size, while smaller and less precise studies will show a
wider distribution below.
 If there is no publication bias, the studies would be
expected to be symmetrically distributed on both sides of
the combined effect size line.
In case of publication bias, the funnel plot may be asymmetrical,
since the absence of studies would distort the distribution on the
scatter plot.
Egger’s Linear Regression Approach:
 This technique is formal test of funnel plot asymmetry and
can be applied to datasets that report dichotomous
outcomes or measures of association or risk, which are
conventionally summarized using odds or risk ratios.
 The test uses three statistics : the log odds (or risk) ratio, its
variance, and the standard normal deviate.
 If there is no selection bias, the points from individual
trials will scatter about a line that runs through the origin
at standard deviate zero, with slope indicating the size and
direction of effect.
 If there is asymmetry, with smaller studies showing effects
that differ systematically from larger studies, the regression
line will not run through the origin.
Statistics in meta analysis

Statistics in meta analysis

  • 1.
    STATISTICS IN METAANALYSIS Presented by: Dr. Shrirang Sangle
  • 2.
    Content:  Introduction  QuantitativeSynthesis (Meta-Analysis)  Odds and Odds Ratio  Risk and Relative Risk  Confidence Intervals  Forest Plot  The Heterogeneity Test  Fixed and Random Effect models  Software dedicated to Meta- analysis  Particular Types of Systematic reviews and Meta–Analysis  Pitfalls in Systematic Reviews
  • 3.
    INTRODUCTION  Health careprofessionals are increasingly required to base their practice on the best available evidence.  The quality of the studies may be variable, and the individual studies might have produced conflicting results.  It is therefore important that health care decisions are not based solely on one or two studies without account being taken of the whole range of research information available on that topic.  Systematic review have rapidly gained an important place in aiding clinical decision making in medicine, although dentistry has been a little slower to adopt this approach.
  • 4.
     Systematic reviewsare themselves considered a research activity, although the data are derived from primary studies in the area of interest rather than from direct experimentation ( Needleman 2002).
  • 5.
    Quantitative Synthesis (Meta-Analysis) Meta-Analysis is not always possible when necessary data to perform meta-analysis cannot be obtained, and it may not be appropriate when the data are sparse or when the studies are too heterogeneous to be sensibly combined.  The meta-analysis is performed to increase the power, to improve precision, and to answer the questions not posed by the individual studies, and to settle controversies arising from conflicting studies or to generate new hypothesis ( Manchikanti et al. 2009; Egger et al. 1997)
  • 6.
     Meta-Analysis isa two-stage process.  The first stage involves the calculation of a measure of treatment effect with its 95% confidence intervals (CI) for each individual study.  The summary statistics that are usually used to measure treatment effect include odds ratios OR, relative risks (RR) and risk difference.  In second stage of meta-analysis, an overall treatment effect is calculated as weighted average of the individual summary statistics.  The typical graph for displaying the results of meta- analysis is called a ‘forest plot’.
  • 7.
    Odds and OddsRatio:  The odds for a group is defined as the number of patients in the group who achieve the stated end point divided by the number of patients who do not.  For example: the odds of acne resolution during treatment with an antibiotic in a group of 10 patients may be 6-4 (6 with resolution of acne divided by 4 without = 1.5); in a control group , the odds may be 3-7 (0.43).  The odds ratio, as the name implies, is a ratio of odds.  It is defined as the ratio of the odds of the treatment group to the odds of the control group.  For example: In above example, the odds ratio of treatment to control group would be 3.5 ( 1.5 divided by 0.43).
  • 8.
    Risk and RelativeRisk:  Risk, as opposed to odds, is calculated as the number of patients in the group who achieve the stated endpoint divided by the total number of patients in the group.  Risk ratio or relative risk is a ratio of two ‘risks’.  In the example above, the risks would be 6 in 10 in the treatment group ( 6 divided by 10 = 0.6) and 3 in 10 in the control group (0.3), giving a risk ratio, or relative risk of 2 (0.6 divided by 0.3) (Akobeng 2005).
  • 9.
    Interpretation of OddsRatios and Relative Risk  An odds ratio or relative risk greater than 1 indicates increased likelihood of the stated outcome being achieved in the treatment group.  If the odds ratio or relative risk is less than 1, there is a decreased likelihood in the treatment group.  If the odds ratio or relative risk is less than 1, there is decreased likelihood in the treatment group.  The ratio of 1 indicates no difference that is , the outcome is just likely to occur in the treatment group as it is in the control group.  As in all estimates of treatment effect, odds ratios or relative risk reported in meta-analysis should be accompained by confidence intervals ( Akobeng 2005 )
  • 10.
    Confidence Intervals:  Confidenceintervals should accompany estimates of treatment effects.  Ninety-five percent confidence intervals are commonly reported, but the other intervals such as 90% or 99% are also sometimes used.  The 95% CI of an estimate will be the range within which we are 95% certain that the true population treatment effect will lie.  The width of a confidence interval indicates the precision of the estimate.  The wider the interval, the less the precision.
  • 11.
    Forest Plot:  Meta-analysisresults are commonly displayed graphically as ‘ Forest Plot’.  In the forest plot each study is represented by a black square and a horizontal line (CI:95%) .  The area of the black square reflects the weight of the study in the meta-analysis.
  • 21.
    Heterogeneity Test:  Heterogeneityin meta-analysis refers to the variation in study outcomes between studies.  Test for existence of heterogeneity: have low power  Cochrane’s Q – statistic based on chi-square test  I ² - Scores heterogeneity between 0% and 100%  25 % - Low heterogeneity  50 % - Moderate  75 % - High  I ² was only recently developed and introduced as the preferable and more reliable test for heterogeneity.  The principal advantage of I ² is that it can be calculated and compared across meta-analyses of different sizes, of different types of study, and using different types of outcome data.
  • 22.
    Fixed and Randomeffect model:  Presence or absence of heterogeneity influences the subsequent method of analysis  Fixed effects model  Random effects model
  • 23.
    FIXED EFFECTS MODELRANDOM EFFECTS MODEL  Conduct, if heterogeneity is absent  Assumes the size of treatment effect be same (fixed) across all studies and variation due to chance  When heterogeneity exists we get:  A pooled estimate which may give too much weight to large studies,  Conduct, if heterogeneity is present  Assumes that the size of treatment effect does vary between studies.  When heterogeneity exists we get:  Possibly a different pooled estimate with a different interpretation,
  • 24.
     A confidenceinterval which is too narrow,  a P- value which is too small  When heterogeneity does not exists:  a pooled estimate which is correct,  a confidence interval which is correct,  a P- value which is correct  a wider confidence interval  a larger P-value  When heterogeneity does not exist:  a pooled estimate which is correct,  a confidence interval which is too wide,  a P- value which is too large
  • 25.
    Software Dedicated toMeta-analysis of Casual Studies  Bax et al. ( 2007) systematically assessed the difference in features, results, and usability of currently available meta- analysis programs.  Six programs were included in their review:  Comprehensive Meta-analysis (CMA)  MetaAnalysis  MetaWin,  MIX,  RevMan  WEasyMA
  • 26.
     The programsdiffered substantially in features, ease of use, and price.  Although most results from the programs were identical, some minor numerical inconsistency were found.  CMA and MIX scored highest on usability, and these programs also have the most complete set of analytical features.
  • 27.
    Summary of meta-analysisis presented in table below:
  • 29.
    TYPES OF SYSTEMATICREVIEW AND META - ANALYSIS 1. Realist Reviews 2. Meta-Narrative Reviews 3. Network Meta-Analyses 4. Prospective Meta-Analysis 5. Cumulative Meta-Analysis
  • 30.
    1. Realist Reviews: Realist reviews aim to determine how complex programs work in specific contexts and settings (Pawson et al.2005). 2. Meta-Narrative Reviews:  Meta-narrative reviews aim to explain complex bodies of evidence through mapping and comparing different over-arching storylines (Greenhalgh et al. 2005).  The phases of meta-narrative review are given in table
  • 32.
    3. Network Meta-Analyses Network meta-analyses, also known as multiple treatments meta-analyses, can be used to analyse data from comparisons of many different treatments (Lumley 2002; salanti et al. 2008).  They use both direct and indirect comparisons and can be used to compare interventions that have not been directly compared.  Lumley (2002) has presented methods of estimating treatment differences between treatments that have not been directly compared in a randomized trial and, more importantly, methods of estimating the uncertainty in these differences.  These methods require information from large number of different treatment comparisons.
  • 33.
    4. Prospective Meta-Analysis Systematic reviews are by nature retrospective because the trials included are usually identified after the trials have been completed and the results reported.  A prospective meta-analysis (PMA) is a meta-analysis of studies that were identified, evaluated, and determined to be eligible for the meta-analysis before the results of any of those studies became known.  PMA can help to overcome some of the recognized problems of retrospective meta-analyses by:
  • 34.
    a) Enabling hypothesesto be specified a priori ignorant of the results of individual trials. b) Enabling prospective application of study selection criteria. c) Enabling a priori statements of intended analyses, including subgroup analyses, to be made before the results of individual trials are known.  This avoids potential difficulties in interpretation related to the data-dependent emphasis on particular subgroups ( Higgins and Green 2011 ).
  • 35.
    5. Cumulative Meta-Analysis It is defined as the repeated performance of meta-analysis whenever a new trial becomes available for inclusion.  Such cumulative meta-analysis can retrospectively identify the point in time when a treatment effect first reached conventional levels of significance (Egger and Smith 1997).
  • 36.
  • 37.
    Pitfalls in SystematicReviews:  Although systematic reviews are considered the highest quality of evidence, there may be concerns about systematic reviews of which the reader should be aware ( farquhar and Vail 2006).
  • 38.
    Failures to takeinto Account Losses to Follow-up:  This is also known as attrition bias.  Each study should report the patients who drop out and the reasons why, if known.  It is possible that the reasons for dropping out could be due to adverse events, or poor outcomes, and the use of intention to treat analysis is usually recommended to address dropouts.
  • 39.
    Funding Bias:  Asystematic review has shown that published studies funded by commercial interests had four times the odds of favouring the experimental intervention, due to more careful selection of which studies to support, the narrow inclusion criteria that many industry trials apply, avoiding patients who have a poor prognosis, or patients with comorbidities, or selection of studies to submit for publication.
  • 40.
    Publication Bias:  Publicationbias can be seen to originate from three interrelated sources: researchers, journal editors, and research sponsors.  Evidence suggest that researchers are less likely to ‘write up’ and submit the study if its ‘negative’ , and journal editors are less likely to publish this research if it is submitted.  However the sponsors of research may have a financial stake in the results of research into their own products- paticularly in the fields of pharmaceutical evaluation.
  • 41.
     Publication biascan be considered to have 3 stages: 1. Prepublication bias occurs in the performance of research, caused by ignorance, sloth, greed, or the double standard applied to clinical trials but not to clinical practice. 2. Publication bias refers to basing acceptance or rejection of manuscript on whether it supports the treatment tested. Potentially biased reviewers are of equal concern. 3. Post publication bias occurs in publishing interpretations, reviews, and meta-analyses of published clinical trials.
  • 42.
    Funnel Plot Analysis: A common approach is based on scatter plots of the treatment effect estimated by individual studies versus a measure of study size or precision ( the funnel plot).  In this graphical representation, larger and more precise studies are plotted at the top, near the combined effect size, while smaller and less precise studies will show a wider distribution below.  If there is no publication bias, the studies would be expected to be symmetrically distributed on both sides of the combined effect size line.
  • 43.
    In case ofpublication bias, the funnel plot may be asymmetrical, since the absence of studies would distort the distribution on the scatter plot.
  • 44.
    Egger’s Linear RegressionApproach:  This technique is formal test of funnel plot asymmetry and can be applied to datasets that report dichotomous outcomes or measures of association or risk, which are conventionally summarized using odds or risk ratios.  The test uses three statistics : the log odds (or risk) ratio, its variance, and the standard normal deviate.  If there is no selection bias, the points from individual trials will scatter about a line that runs through the origin at standard deviate zero, with slope indicating the size and direction of effect.
  • 45.
     If thereis asymmetry, with smaller studies showing effects that differ systematically from larger studies, the regression line will not run through the origin.

Editor's Notes

  • #25 The p-value is the level of marginal significance within a statistical hypothesis test representing the probability of the occurrence of a given event.
  • #31 Overarching - Comprehensive
  • #40  comorbidity is the presence of one or more additional diseases or disorders co-occurring with (that is, concomitant or concurrent with) a primary disease or disorder