Download as PPSX, PPTX

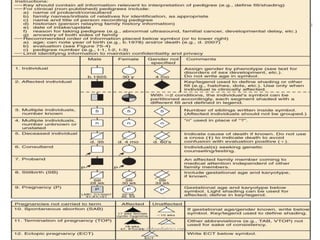
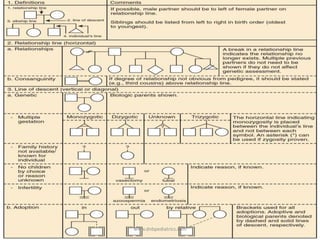
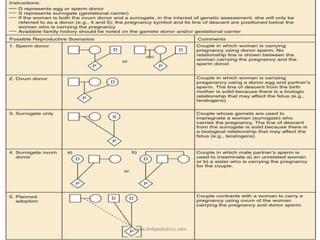
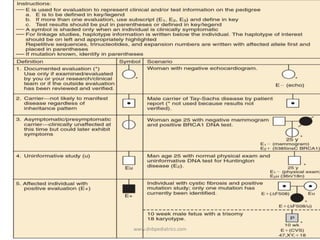
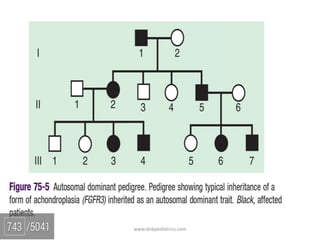
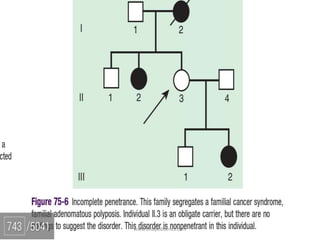
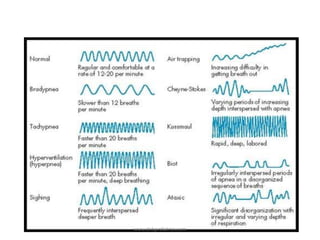
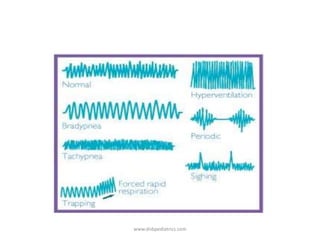
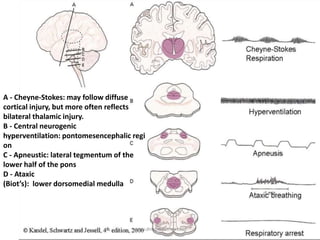
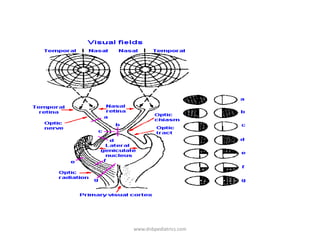
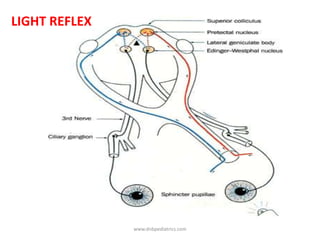
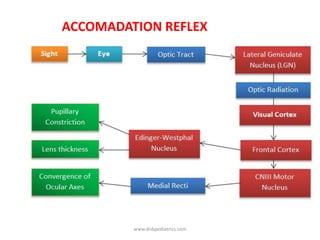
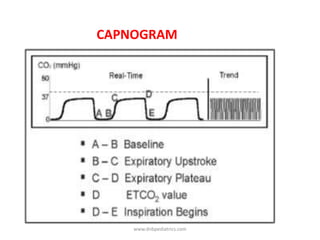
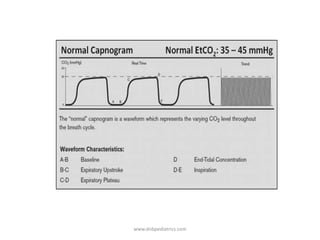
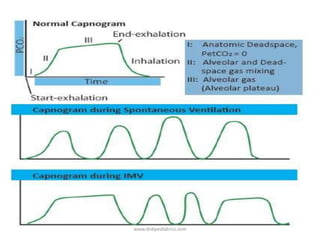
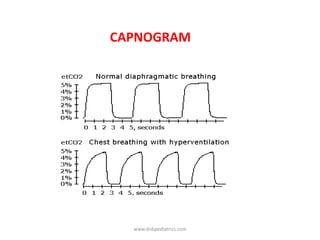
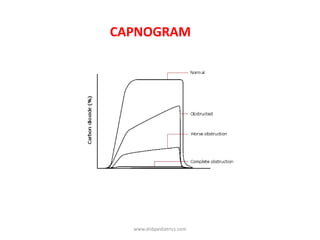
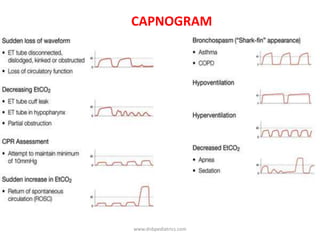
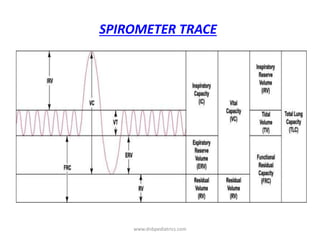
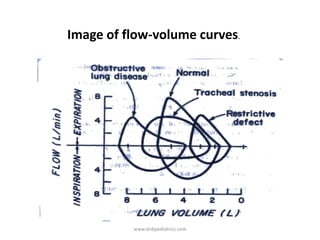
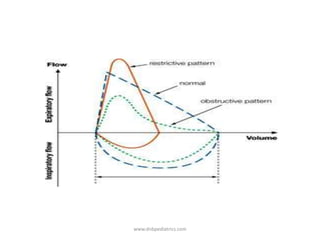
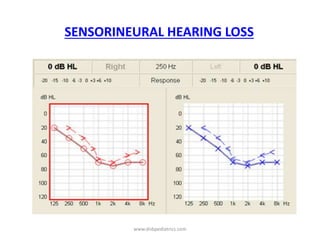
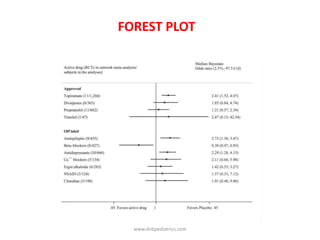
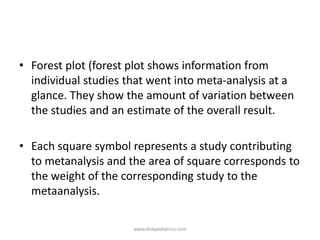
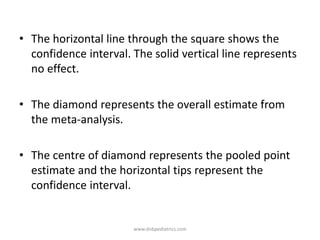
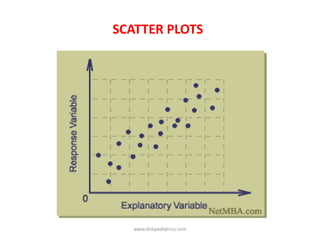
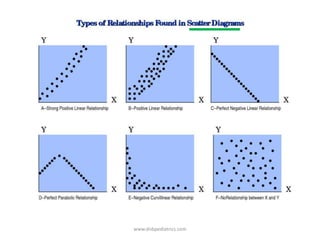
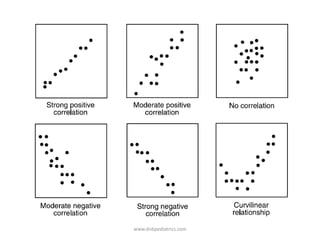
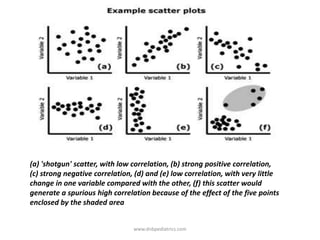
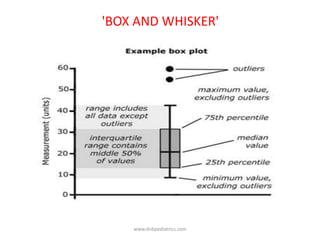
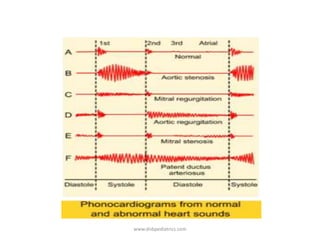
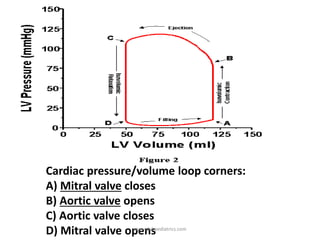
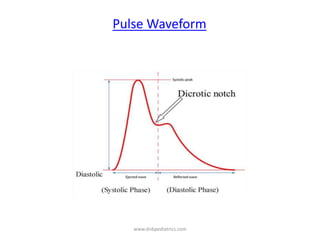
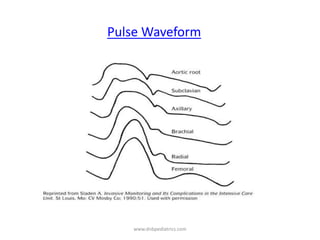
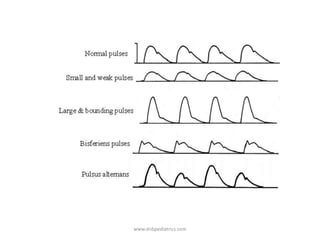
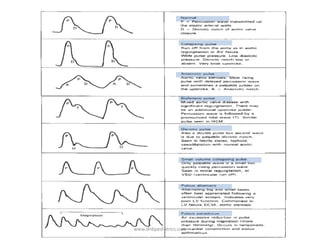
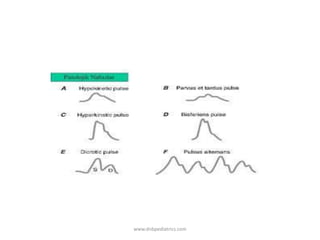
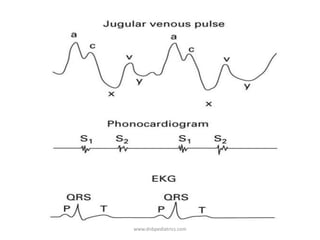
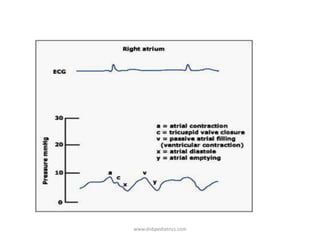
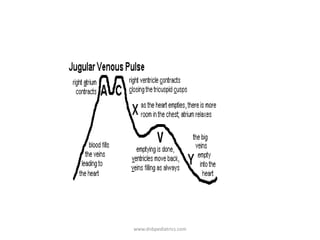
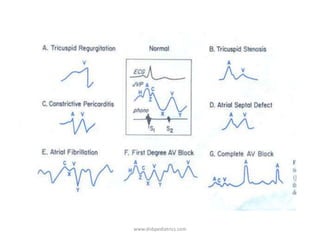

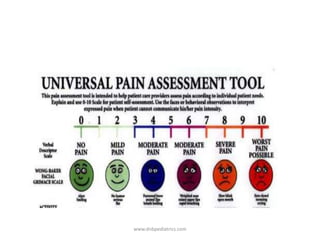

This document contains information about various graphs, charts, and clinical tests that may be included in an OSCE (Objective Structured Clinical Examination) in pediatrics. It includes descriptions and examples of family trees, capnograms, scatter plots, box-and-whisker plots, pulse waveforms, growth charts, Berger's audiometry test, and more. The document is a study guide for the types of charts and diagrams that may be assessed in a pediatric OSCE.


