Downloaded 583 times

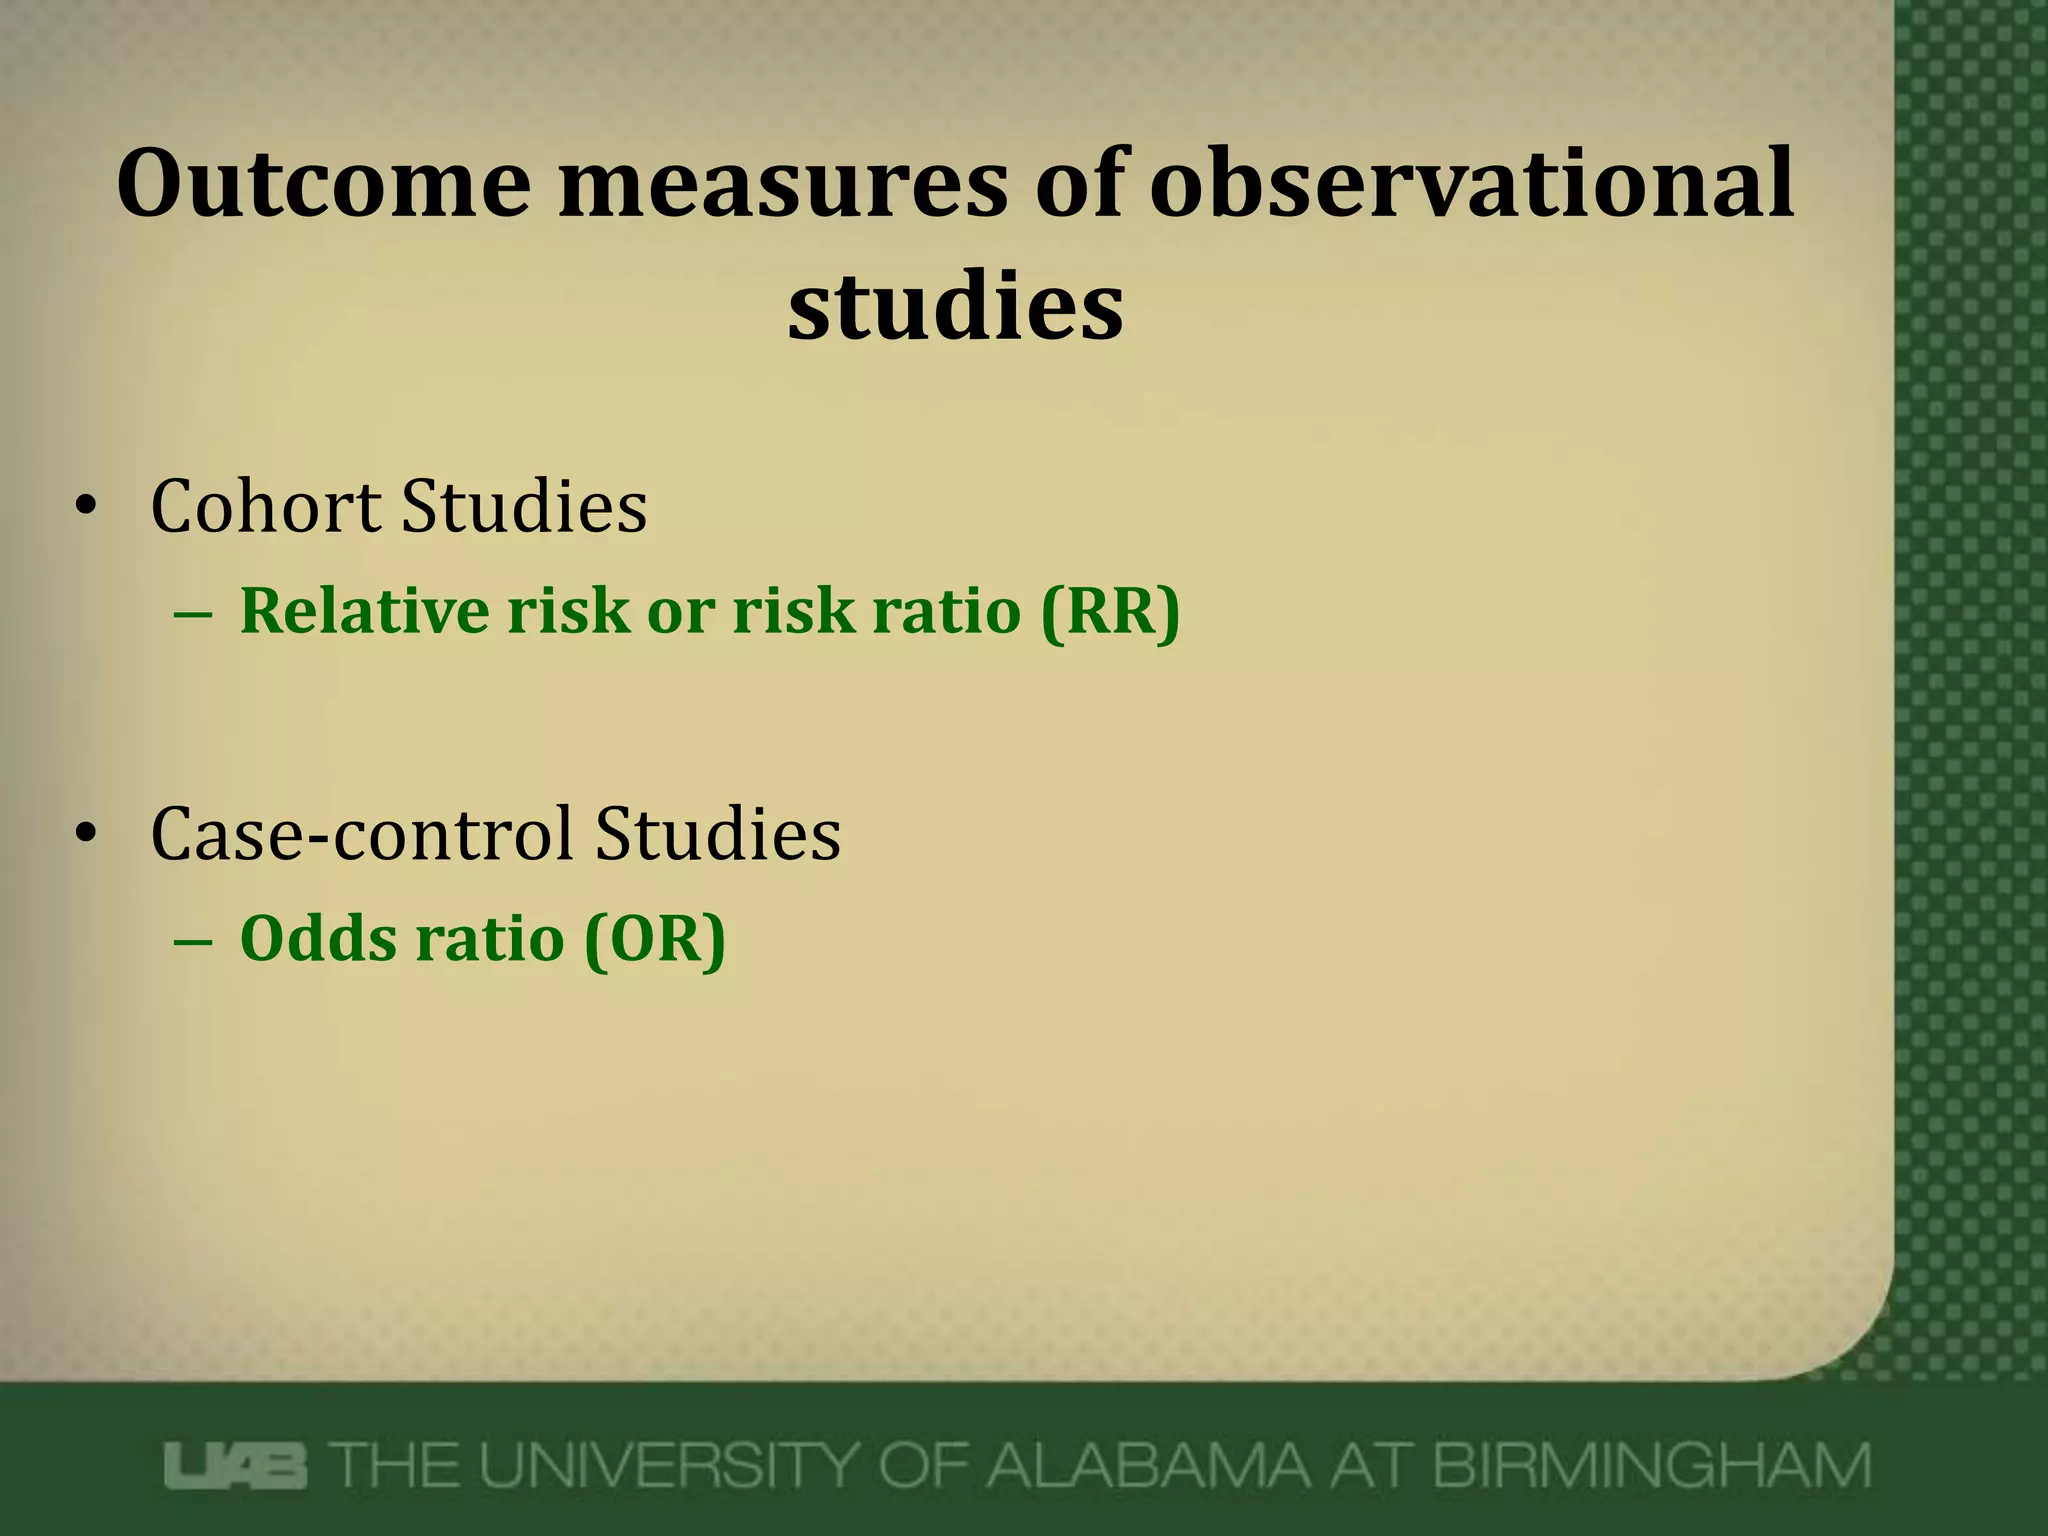
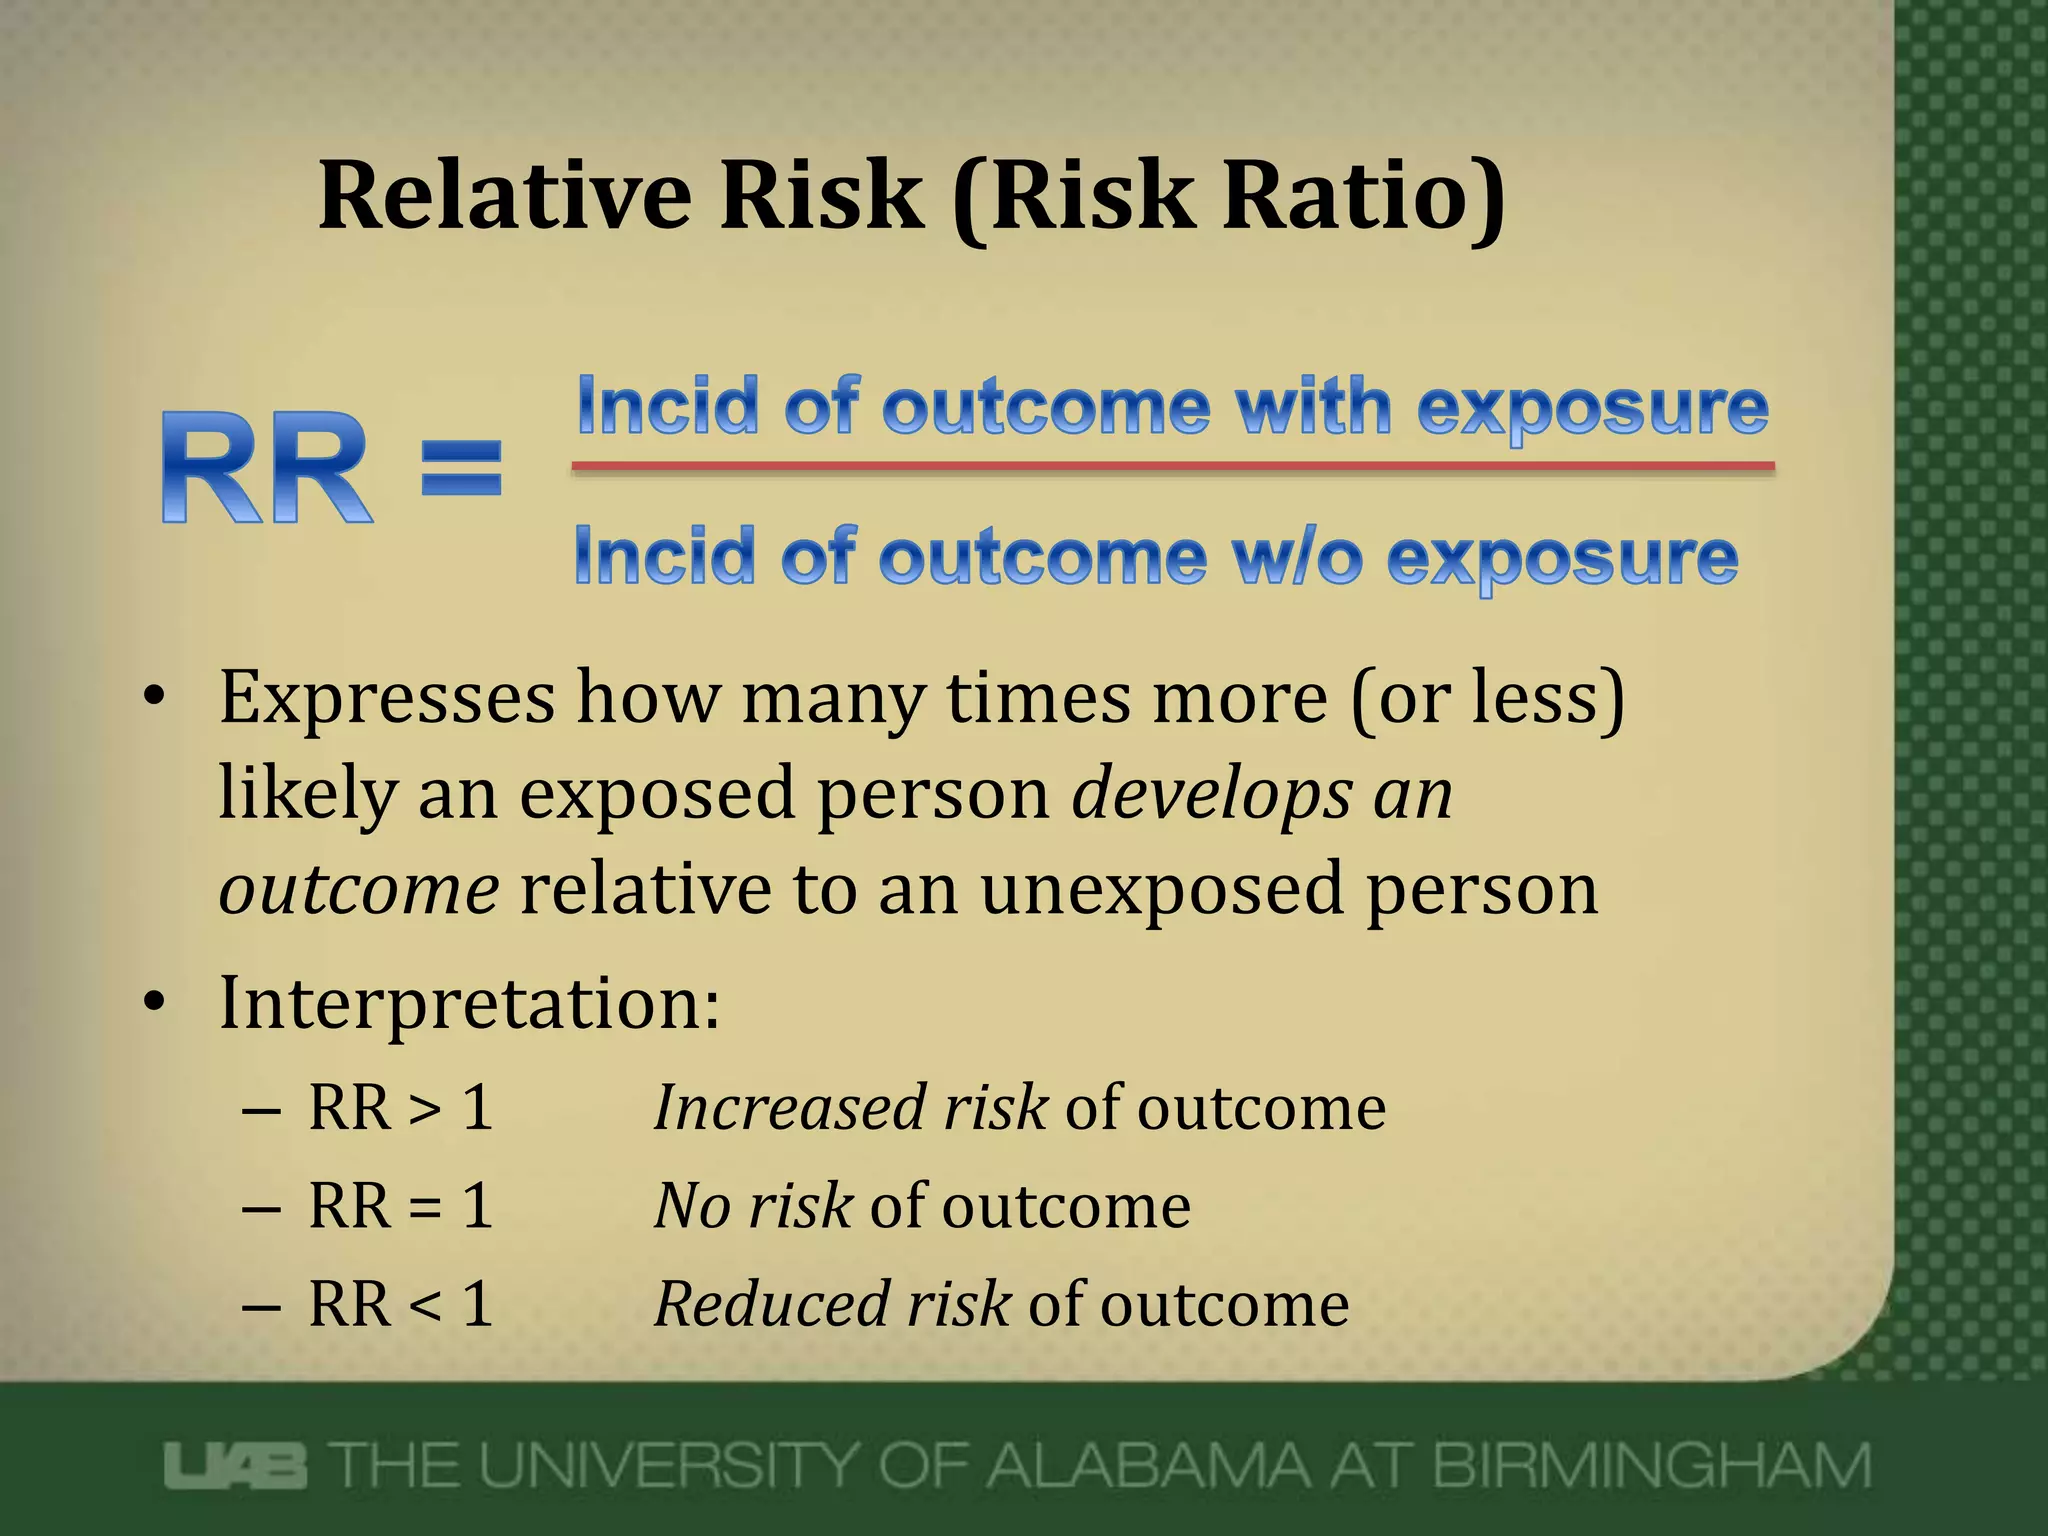
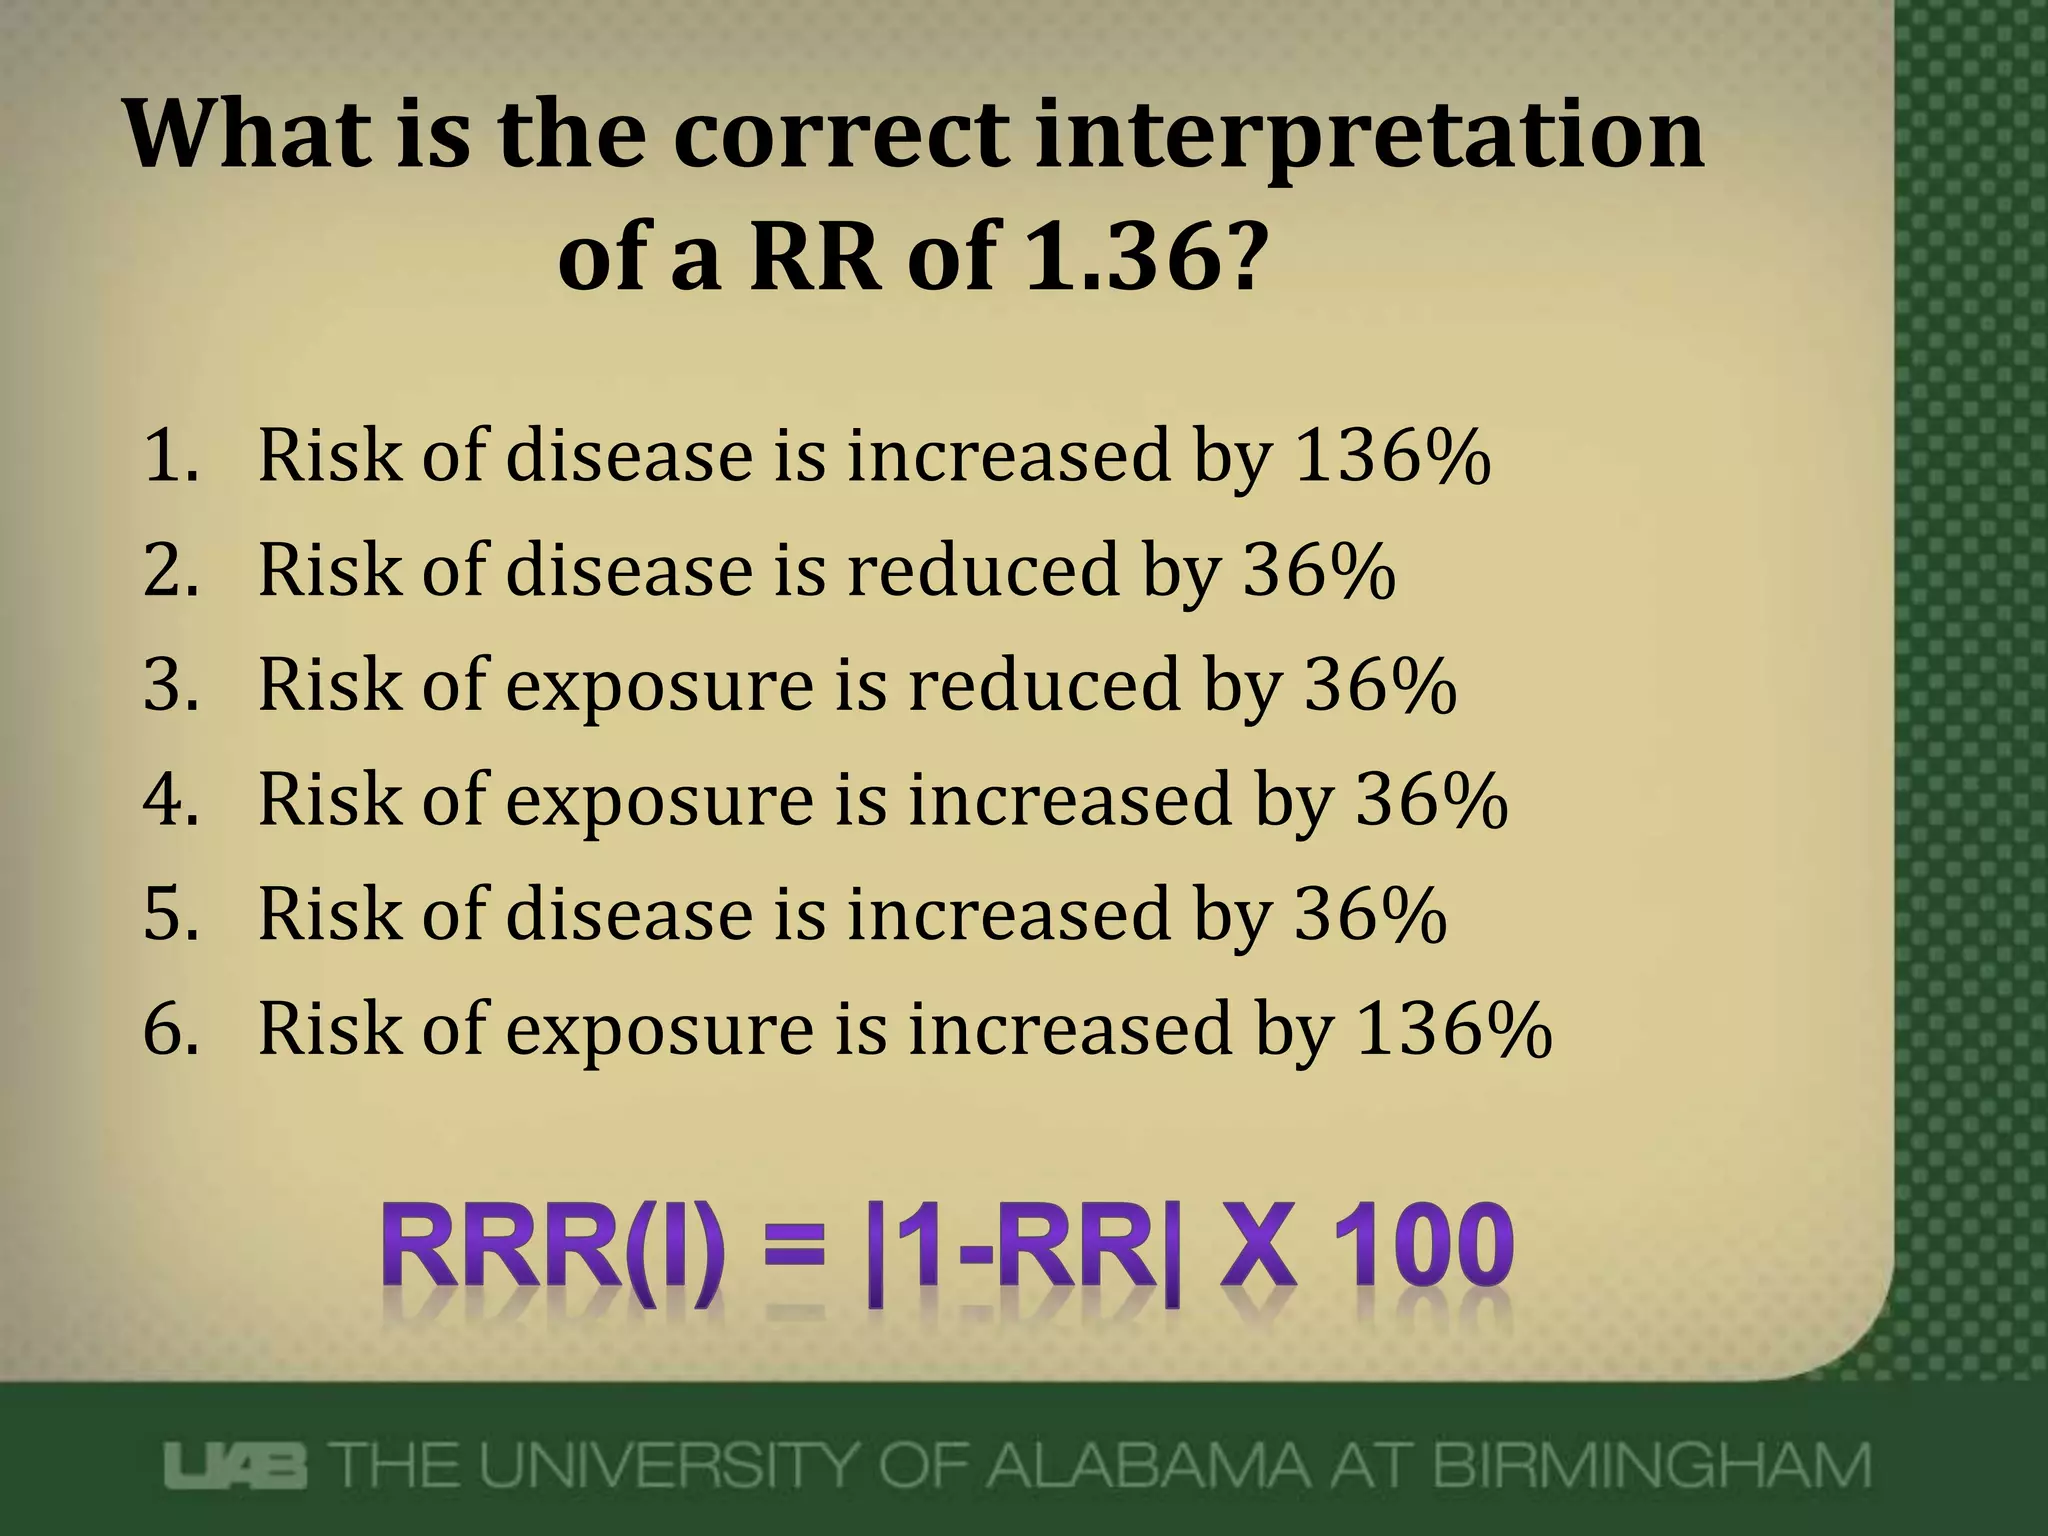

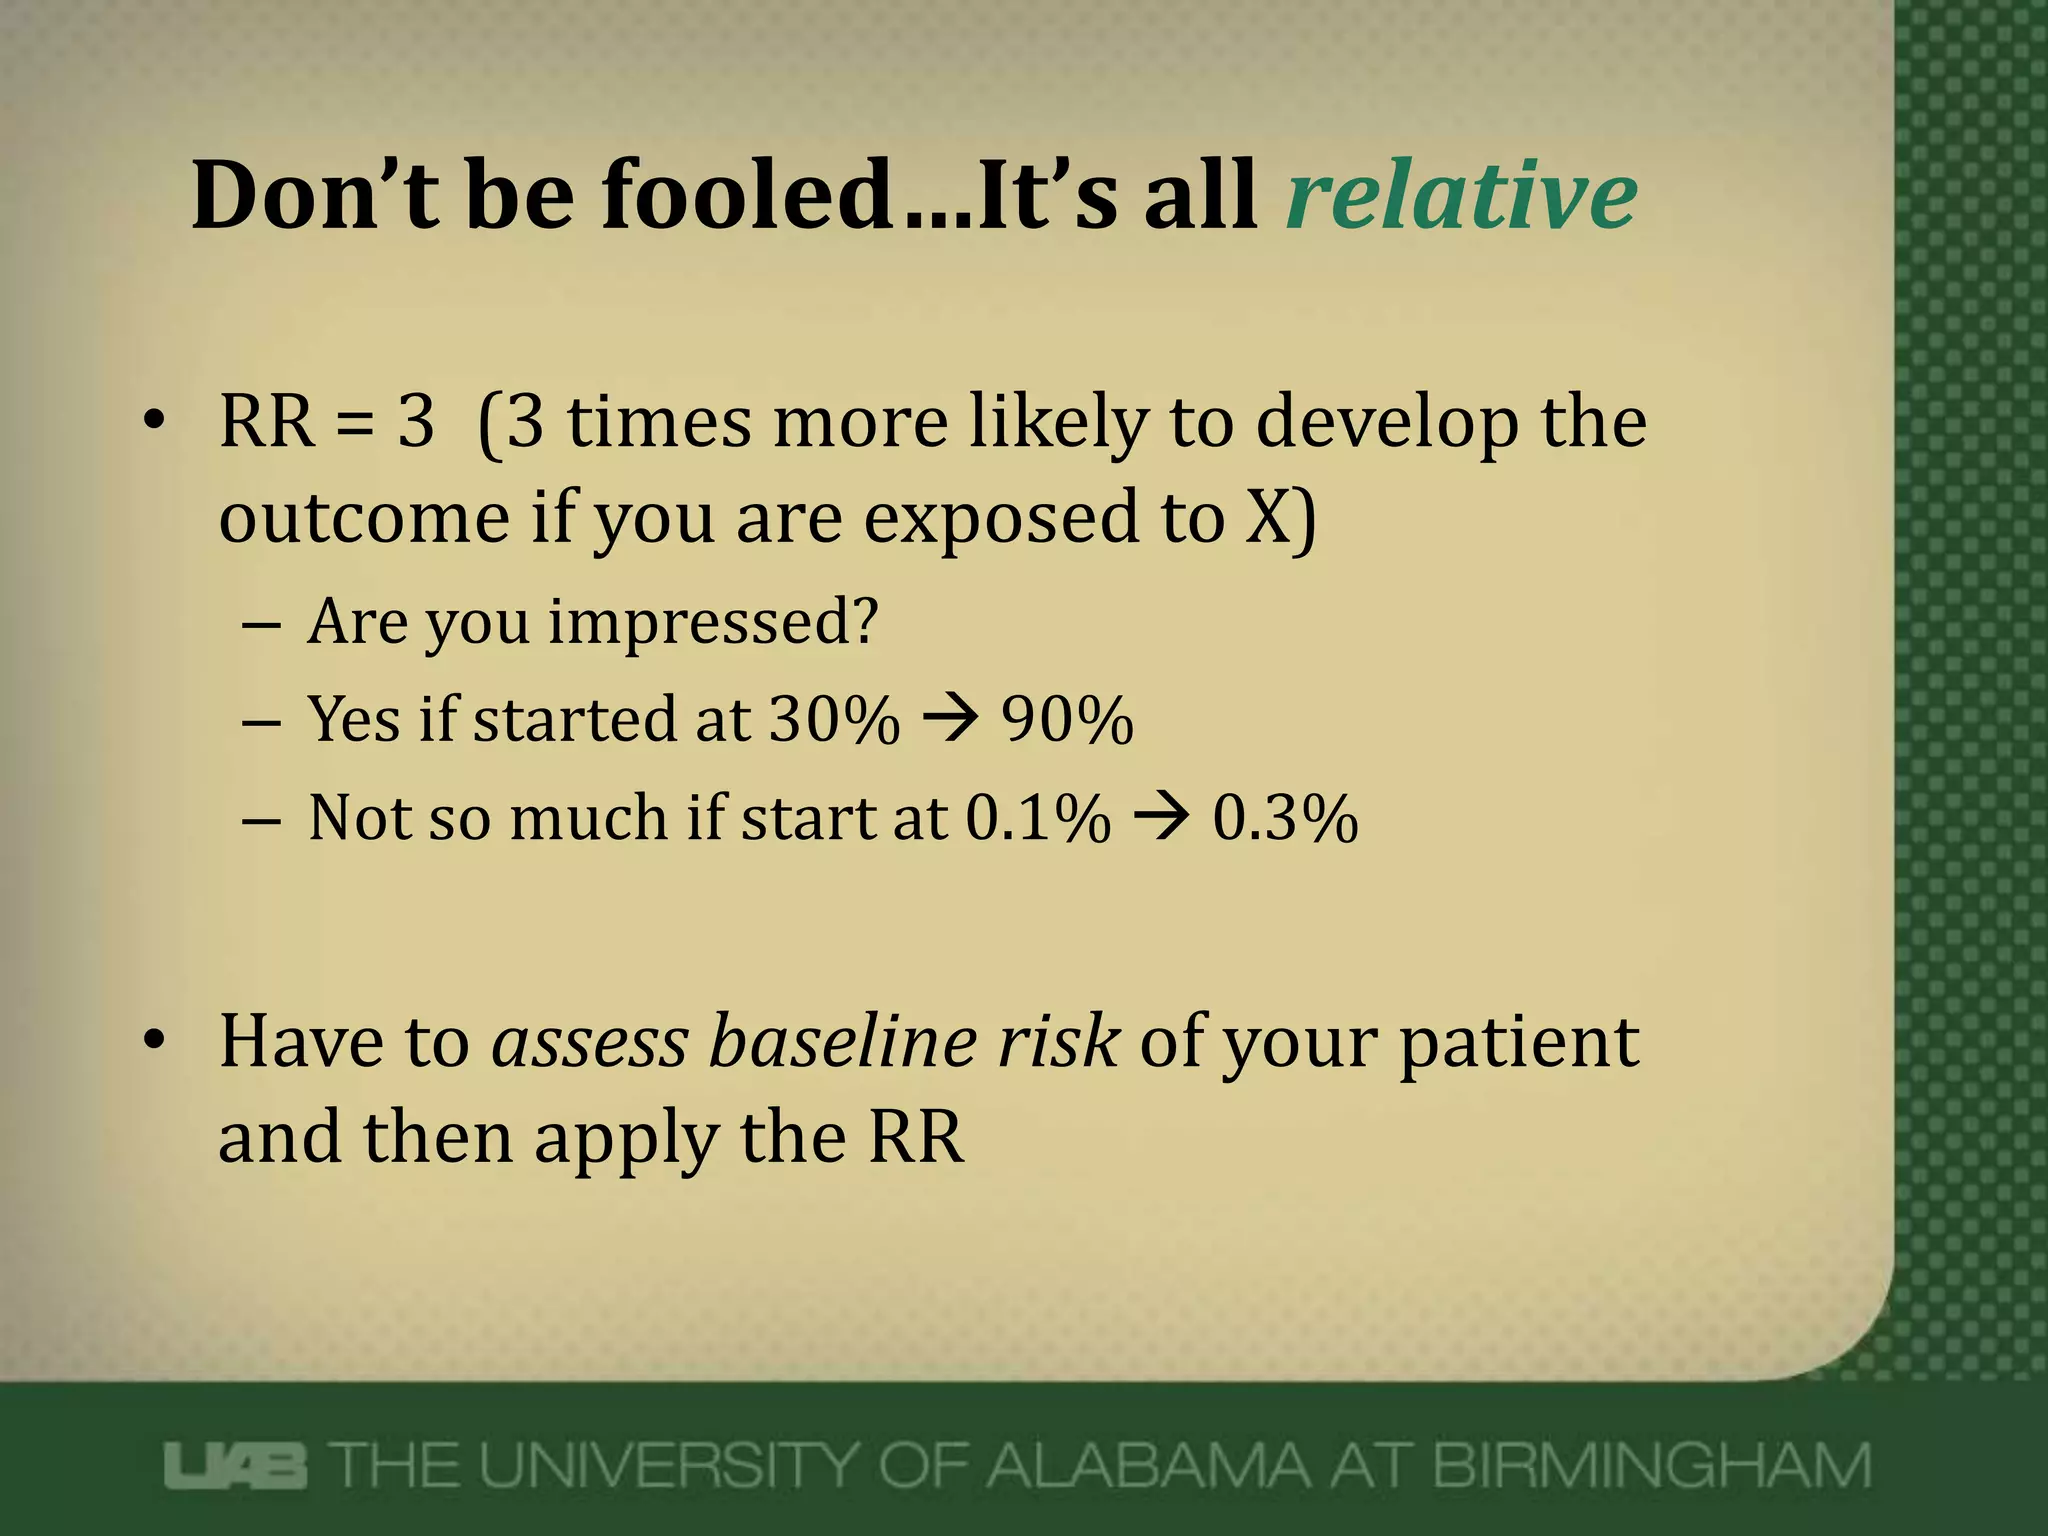


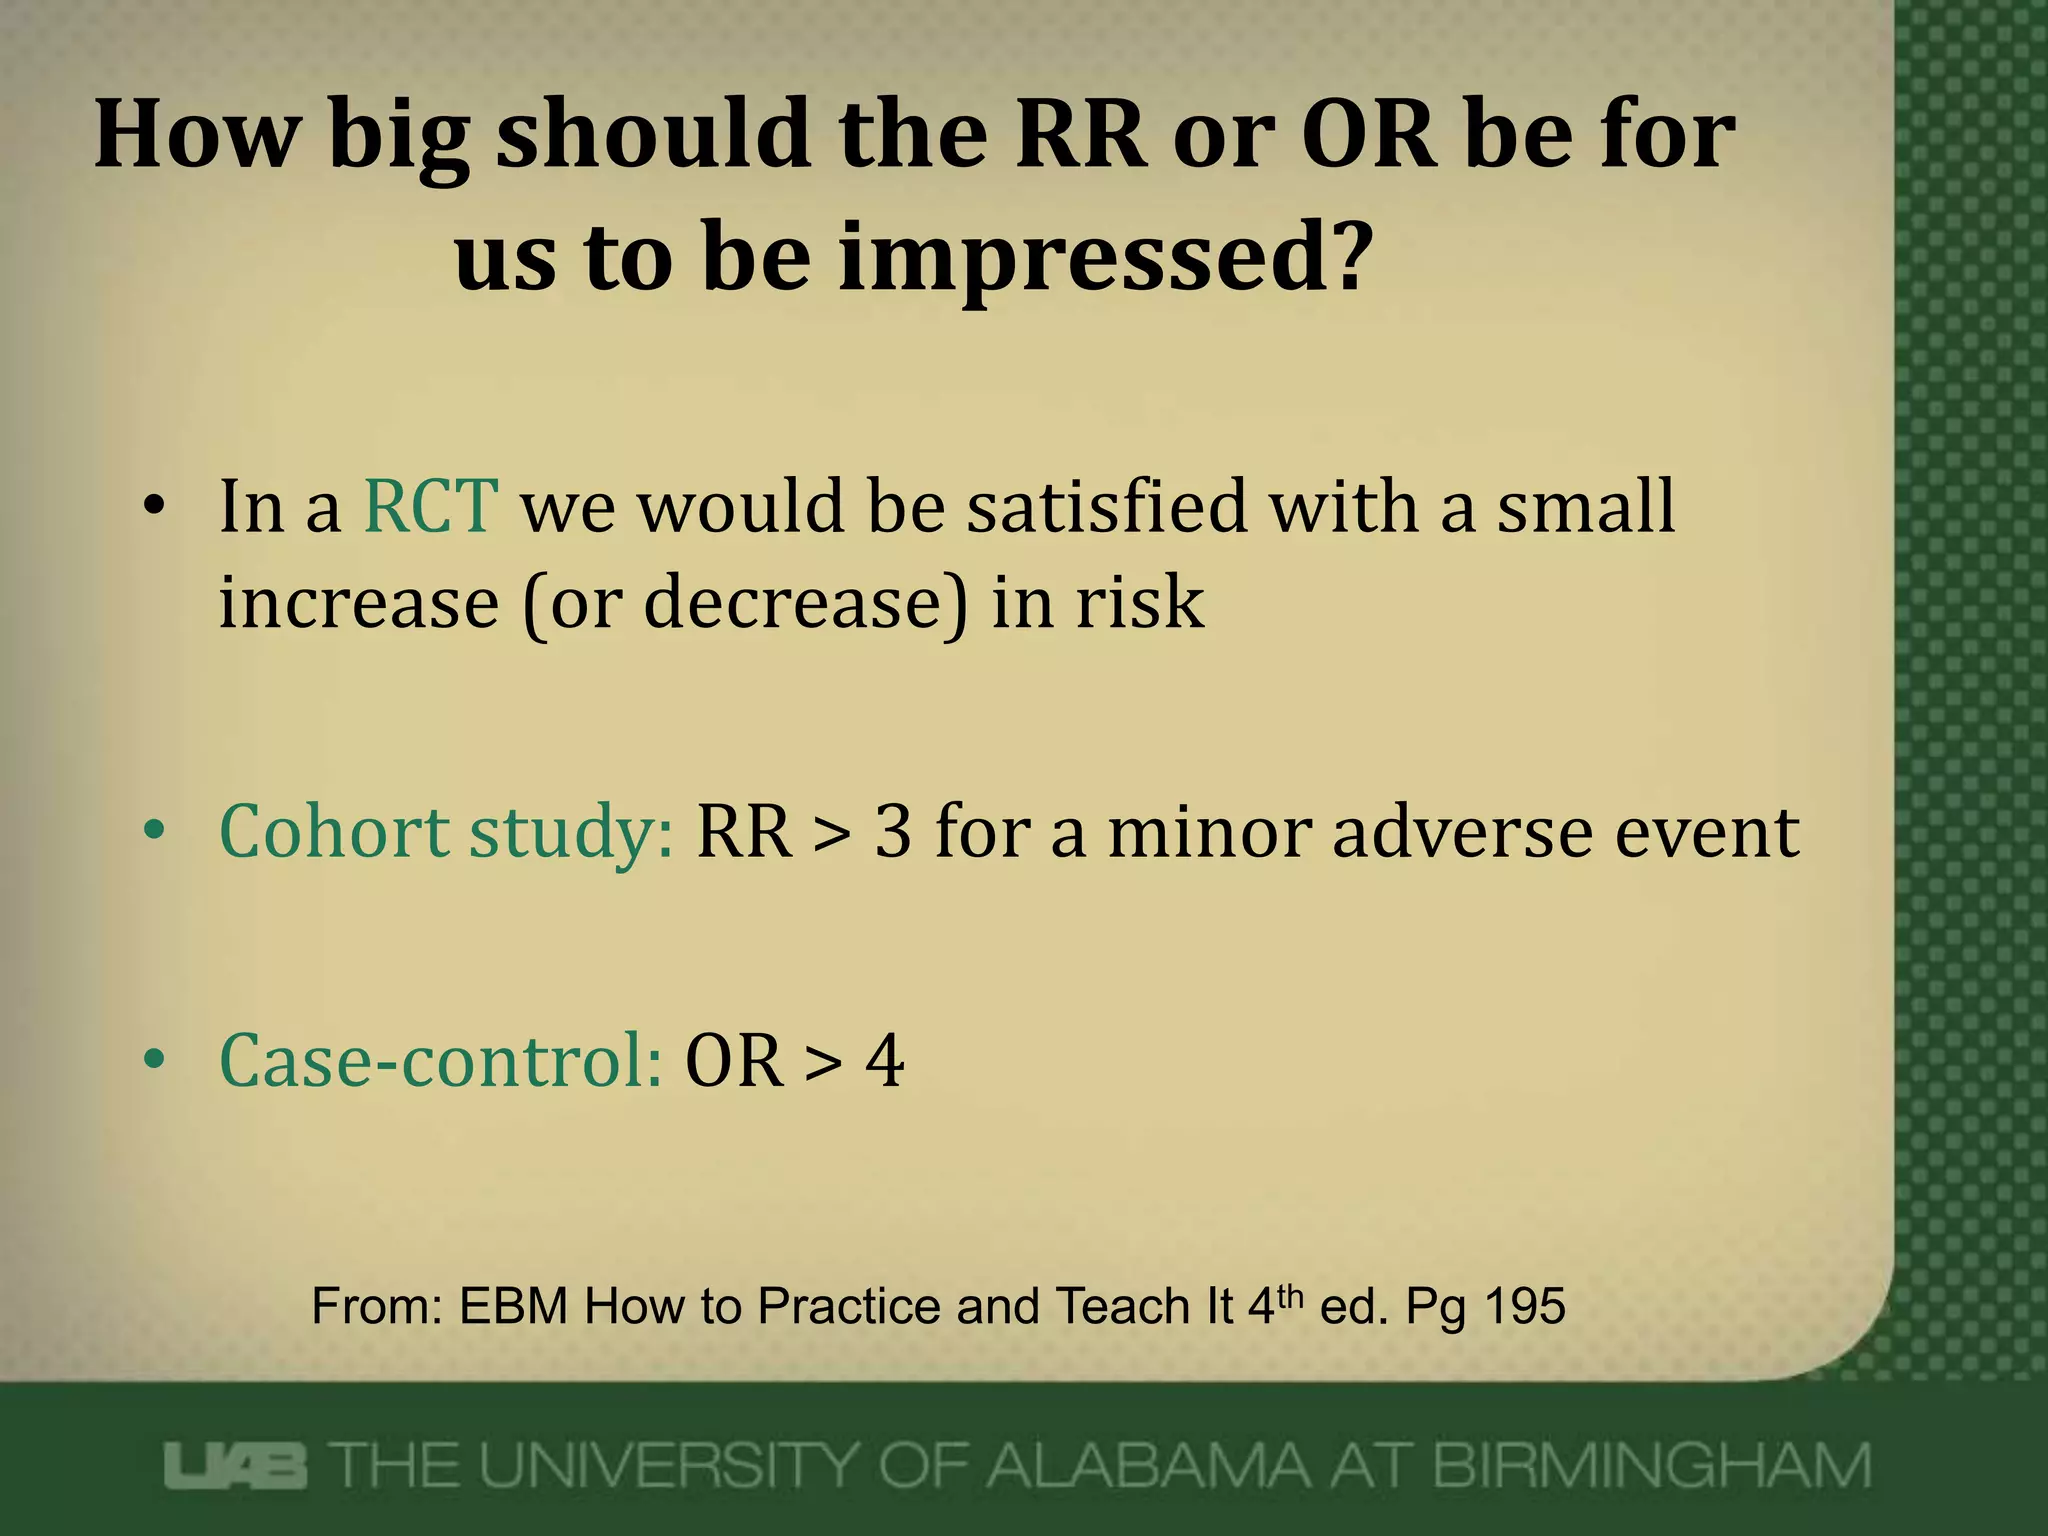


The document discusses the interpretation of relative risk (RR) and odds ratio (OR) in observational studies and their implications for understanding disease risk associated with exposure. It illustrates how to interpret various RR values, with examples, explaining the importance of considering baseline risk when evaluating findings. Additionally, it advises caution regarding the credibility of associations based on adjustments for confounding variables.