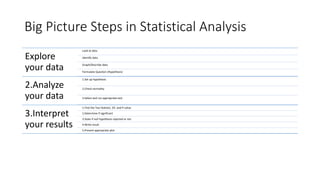
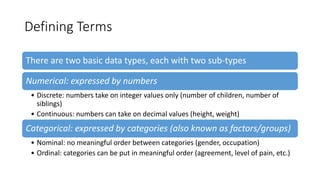
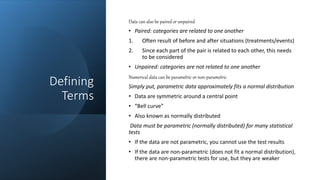
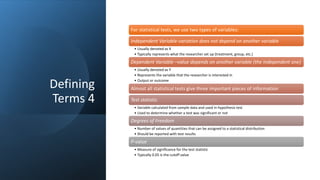
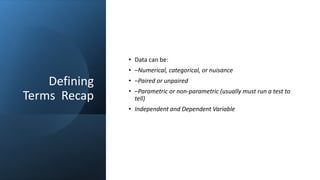
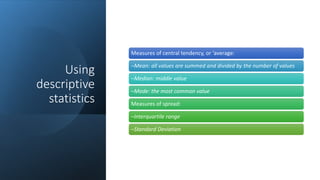
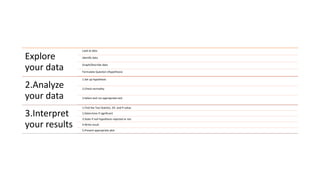
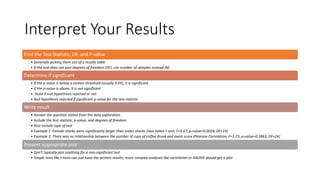
SlideShare a Scribd company logo
DATA ANALYSIS USING SPSS
SUMIA FATIMA
Research Development Head RSRS
Introduction
The software used is SPSS (Statistical
Package for the Social Sciences)
–commonly used in social sciences
and health fields
–as opposed to other statistical
software such as SAS or R, it requires
little to no coding background
The Big Question.
How should I analyze my data?
It depends on the nature of the data and what
questions you want to answer
To answer those questions, you need to explore
your data. and select the proper analysis
Big Picture Steps in Statistical Analysis
Explore
your data
Look at data
Identify data
Graph/Describe data
Formulate Question (Hypothesis)
2.Analyze
your data
1.Set up hypothesis
2.Check normality
3.Select and run appropriate test
3.Interpret
your results
1.Find the Test Statistic, DF, and P-value
2.Determine if significant
3.State if null hypothesis rejected or not
4.Write result
5.Present appropriate plot
Defining Terms
There are two basic data types, each with two sub-types
Numerical: expressed by numbers
• Discrete: numbers take on integer values only (number of children, number of
siblings)
• Continuous: numbers can take on decimal values (height, weight)
Categorical: expressed by categories (also known as factors/groups)
• Nominal: no meaningful order between categories (gender, occupation)
• Ordinal: categories can be put in meaningful order (agreement, level of pain, etc.)
Defining
Terms
Data can also be paired or unpaired
• Paired: categories are related to one another
1. Often result of before and after situations (treatments/events)
2. Since each part of the pair is related to each other, this needs
to be considered
• Unpaired: categories are not related to one another
Numerical data can be parametric or non-parametric
Simply put, parametric data approximately fits a normal distribution
• Data are symmetric around a central point
• “Bell curve”
• Also known as normally distributed
Data must be parametric (normally distributed) for many statistical
tests
• If the data are not parametric, you cannot use the test results
• If the data are non-parametric (does not fit a normal distribution),
there are non-parametric tests for use, but they are weaker
Defining
Terms 4
For statistical tests, we use two types of variables:
Independent Variable-variation does not depend on another variable
• Usually denoted as X
• Typically represents what the researcher set up (treatment, group, etc.)
Dependent Variable –value depends on another variable (the independent one)
• Usually denoted as Y
• Represents the variable that the researcher is interested in
• Output or outcome
Almost all statistical tests give three important pieces of information
Test statistic
• Variable calculated from sample data and used in hypothesis test
• Used to determine whether a test was significant or not
Degrees of Freedom
• Number of values of quantities that can be assigned to a statistical distribution
• Should be reported with test results
P-value
• Measure of significance for the test statistic
• Typically 0.05 is the cutoff value
Defining
Terms Recap
• Data can be:
• –Numerical, categorical, or nuisance
• –Paired or unpaired
• –Parametric or non-parametric (usually must run a test to
tell)
• Independent and Dependent Variable
Using
descriptive
statistics
Measures of central tendency, or ‘average:
–Mean: all values are summed and divided by the number of values
–Median: middle value
–Mode: the most common value
Measures of spread:
–Interquartile range
–Standard Deviation
Types of Graphs to be covered
• Type of Graph Data Type Basic Example
• Histogram Single numerical variable Heights of freshman students
• Boxplot Single numerical variable;
single numerical variable + categorical variable Heights of freshman students
• Bar Chart Single numerical variable + categorical variable Heights of students by grade
• Scatterplot Two numerical variables Heights and weights of students
• Line Charts Two numerical variables (one usually time) Heart rate over time
• Multiple Line Three or more numerical variable Various concentrations of nutrients in
charts (one usually time, rest on same scale) bloodstream over time
• Pie graph Single numerical variable (proportions) Percentageof students across grades
+categorical variable
Inferential Statistics
If we want to draw conclusions about an entire
population from our sample, we enter the realm of
inferential statistics
This section will go over a variety of the basic tests
Explore
your data
Look at data
Identify data
Graph/Describe data
Formulate Question (Hypothesis)
2.Analyze
your data
1.Set up hypothesis
2.Check normality
3.Select and run appropriate test
3.Interpret
your results
1.Find the Test Statistic, DF, and P-value
2.Determine if significant
3.State if null hypothesis rejected or not
4.Write result
5.Present appropriate plot
Analyze your data: Set up Hypothesis
When running a statistical test, there are two hypotheses being tested
Null Hypothesis: the default, or ‘boring’ state
•Typically ‘no change’, ‘no difference’, or ‘no relationship’
Alternative Hypothesis: something else happening
Construct the two hypotheses based on your question from the data exploration step
Example
–Question: Is there a difference between male and female shark body length?
–Null Hypothesis: There is no difference in shark length by gender.
–Alternative Hypothesis: There is a difference in shark length by gender.
Check Normality
• Reminder: Non-parametric tests are
weaker, so we only use those tests if we
cannot use parametric ones
NORMALITY
• Bell Curve Distribution
• Skewness and Kurtosis values between -1.96 to +1.96
• Shapiro Wilk Test or Kolmogorov test value above 0.05
Interpret Your Results
Find the Test Statistic, DF, and P-value
• Generally picking them out of a results table
• If the test does not give degrees of freedom (DF), use number of samples instead (N)
Determine if significant
• If the p-value is below a certain threshold (usually 0.05), it is significant
• If the p-value is above, it is not significant
• .State if null hypothesis rejected or not
• Null hypothesis rejected if significant p-value for the test statistic
Write result
• Answer the question stated from the data exploration
• Include the test statistic, p-value, and degrees of freedom
• Also include type of test
• Example 1: Female sharks were significantly larger than males sharks (two-tailed T-test, F=5.67, p-value=0.0024, DF=19)
• Example 2: There was no relationship between the number of cups of coffee drunk and exam score (Pearson Correlation, F=1.23, p-value=0.5863, DF=24)
Present appropriate plot
• Don’t typically plot anything for a non-significant test
• Simple tests like t-tests can just have the written results; more complex analyses like correlation or ANOVA should get a plot

More Related Content

Similar to Presentation 7.pptx

Lecture 2 What is Statistics, Anyway
Lecture 2 What is Statistics, AnywayLecture 2 What is Statistics, Anyway
Lecture 2 What is Statistics, Anyway
Jason Edington
 
Inferential statistics quantitative data - single sample and 2 groups
Inferential statistics   quantitative data - single sample and 2 groupsInferential statistics   quantitative data - single sample and 2 groups
Inferential statistics quantitative data - single sample and 2 groups
Dhritiman Chakrabarti
 
Module 4 data analysis
Module 4 data analysisModule 4 data analysis
Module 4 data analysisILRI-Jmaru
 
Medical Statistics.ppt
Medical Statistics.pptMedical Statistics.ppt
Medical Statistics.ppt
ssuserf0d95a
 
Univariate Analysis
 Univariate Analysis Univariate Analysis
Univariate AnalysisSoumya Sahoo
 
Stats-Review-Maie-St-John-5-20-2009.ppt
Stats-Review-Maie-St-John-5-20-2009.pptStats-Review-Maie-St-John-5-20-2009.ppt
Stats-Review-Maie-St-John-5-20-2009.ppt
DiptoKumerSarker1
 
Need a nonplagiarised paper and a form completed by 1006015 before.docx
Need a nonplagiarised paper and a form completed by 1006015 before.docxNeed a nonplagiarised paper and a form completed by 1006015 before.docx
Need a nonplagiarised paper and a form completed by 1006015 before.docx
lea6nklmattu
 
Statistics for Anaesthesiologists
Statistics for AnaesthesiologistsStatistics for Anaesthesiologists
Statistics for Anaesthesiologists
xeonfusion
 
Research Course - RCT.pdf
Research Course - RCT.pdfResearch Course - RCT.pdf
Research Course - RCT.pdf
MarioKopljar1
 
Research Course - RCT.pptx
Research Course - RCT.pptxResearch Course - RCT.pptx
Research Course - RCT.pptx
MarioKopljar1
 
Research Course - RCT.pdf
Research Course - RCT.pdfResearch Course - RCT.pdf
Research Course - RCT.pdf
MarioKopljar1
 
Introduction to biostatistics
Introduction to biostatisticsIntroduction to biostatistics
Introduction to biostatistics
Ali Al Mousawi
 
Biostatistics
Biostatistics Biostatistics
Biostatistics
Vaibhav Ambashikar
 
introduction to statistical theory
introduction to statistical theoryintroduction to statistical theory
introduction to statistical theory
Unsa Shakir
 
Some nonparametric statistic for categorical & ordinal data
Some nonparametric statistic for categorical & ordinal dataSome nonparametric statistic for categorical & ordinal data
Some nonparametric statistic for categorical & ordinal data
Regent University
 
Introduction to Statistics
Introduction to StatisticsIntroduction to Statistics
Introduction to Statistics
jasondroesch
 
TREATMENT OF DATA_Scrd.pptx
TREATMENT OF DATA_Scrd.pptxTREATMENT OF DATA_Scrd.pptx
TREATMENT OF DATA_Scrd.pptx
Carmela857185
 
Stats !.pdf
Stats !.pdfStats !.pdf
Stats !.pdf
phweb
 
An Introduction to SPSS
An Introduction to SPSSAn Introduction to SPSS
An Introduction to SPSS
Rajesh Gunesh
 

Similar to Presentation 7.pptx (20)

Lecture 2 What is Statistics, Anyway
Lecture 2 What is Statistics, AnywayLecture 2 What is Statistics, Anyway
Lecture 2 What is Statistics, Anyway
 
Inferential statistics quantitative data - single sample and 2 groups
Inferential statistics   quantitative data - single sample and 2 groupsInferential statistics   quantitative data - single sample and 2 groups
Inferential statistics quantitative data - single sample and 2 groups
 
Module 4 data analysis
Module 4 data analysisModule 4 data analysis
Module 4 data analysis
 
Medical Statistics.ppt
Medical Statistics.pptMedical Statistics.ppt
Medical Statistics.ppt
 
Univariate Analysis
 Univariate Analysis Univariate Analysis
Univariate Analysis
 
Stats-Review-Maie-St-John-5-20-2009.ppt
Stats-Review-Maie-St-John-5-20-2009.pptStats-Review-Maie-St-John-5-20-2009.ppt
Stats-Review-Maie-St-John-5-20-2009.ppt
 
Need a nonplagiarised paper and a form completed by 1006015 before.docx
Need a nonplagiarised paper and a form completed by 1006015 before.docxNeed a nonplagiarised paper and a form completed by 1006015 before.docx
Need a nonplagiarised paper and a form completed by 1006015 before.docx
 
Statistics for Anaesthesiologists
Statistics for AnaesthesiologistsStatistics for Anaesthesiologists
Statistics for Anaesthesiologists
 
Research Course - RCT.pdf
Research Course - RCT.pdfResearch Course - RCT.pdf
Research Course - RCT.pdf
 
Research Course - RCT.pptx
Research Course - RCT.pptxResearch Course - RCT.pptx
Research Course - RCT.pptx
 
Research Course - RCT.pdf
Research Course - RCT.pdfResearch Course - RCT.pdf
Research Course - RCT.pdf
 
Introduction to biostatistics
Introduction to biostatisticsIntroduction to biostatistics
Introduction to biostatistics
 
Biostatistics
Biostatistics Biostatistics
Biostatistics
 
Analysis
AnalysisAnalysis
Analysis
 
introduction to statistical theory
introduction to statistical theoryintroduction to statistical theory
introduction to statistical theory
 
Some nonparametric statistic for categorical & ordinal data
Some nonparametric statistic for categorical & ordinal dataSome nonparametric statistic for categorical & ordinal data
Some nonparametric statistic for categorical & ordinal data
 
Introduction to Statistics
Introduction to StatisticsIntroduction to Statistics
Introduction to Statistics
 
TREATMENT OF DATA_Scrd.pptx
TREATMENT OF DATA_Scrd.pptxTREATMENT OF DATA_Scrd.pptx
TREATMENT OF DATA_Scrd.pptx
 
Stats !.pdf
Stats !.pdfStats !.pdf
Stats !.pdf
 
An Introduction to SPSS
An Introduction to SPSSAn Introduction to SPSS
An Introduction to SPSS
 

Recently uploaded

ashokathegreat project class 12 presentation
ashokathegreat project class 12 presentationashokathegreat project class 12 presentation
ashokathegreat project class 12 presentation
aditiyad2020
 
IrishWritersCtrsPersonalEssaysMay29.pptx
IrishWritersCtrsPersonalEssaysMay29.pptxIrishWritersCtrsPersonalEssaysMay29.pptx
IrishWritersCtrsPersonalEssaysMay29.pptx
Aine Greaney Ellrott
 
Memory Rental Store - The Ending(Storyboard)
Memory Rental Store - The Ending(Storyboard)Memory Rental Store - The Ending(Storyboard)
Memory Rental Store - The Ending(Storyboard)
SuryaKalyan3
 
Memory Rental Store - The Chase (Storyboard)
Memory Rental Store - The Chase (Storyboard)Memory Rental Store - The Chase (Storyboard)
Memory Rental Store - The Chase (Storyboard)
SuryaKalyan3
 
CLASS XII- HISTORY-THEME 4-Thinkers, Bes
CLASS XII- HISTORY-THEME 4-Thinkers, BesCLASS XII- HISTORY-THEME 4-Thinkers, Bes
CLASS XII- HISTORY-THEME 4-Thinkers, Bes
aditiyad2020
 
一比一原版UPenn毕业证宾夕法尼亚大学毕业证成绩单如何办理
一比一原版UPenn毕业证宾夕法尼亚大学毕业证成绩单如何办理一比一原版UPenn毕业证宾夕法尼亚大学毕业证成绩单如何办理
一比一原版UPenn毕业证宾夕法尼亚大学毕业证成绩单如何办理
beduwt
 
一比一原版(DU毕业证)迪肯大学毕业证成绩单
一比一原版(DU毕业证)迪肯大学毕业证成绩单一比一原版(DU毕业证)迪肯大学毕业证成绩单
一比一原版(DU毕业证)迪肯大学毕业证成绩单
zvaywau
 
acting board rough title here lolaaaaaaa
acting board rough title here lolaaaaaaaacting board rough title here lolaaaaaaa
acting board rough title here lolaaaaaaa
angelicafronda7
 
Codes n Conventionss copy (2).pptx new new
Codes n Conventionss copy (2).pptx new newCodes n Conventionss copy (2).pptx new new
Codes n Conventionss copy (2).pptx new new
ZackSpencer3
 
The Legacy of Breton In A New Age by Master Terrance Lindall
The Legacy of Breton In A New Age by Master Terrance LindallThe Legacy of Breton In A New Age by Master Terrance Lindall
The Legacy of Breton In A New Age by Master Terrance Lindall
BBaez1
 
The Last Polymath: Muntadher Saleh‎‎‎‎‎‎‎‎‎‎‎‎
The Last Polymath: Muntadher Saleh‎‎‎‎‎‎‎‎‎‎‎‎The Last Polymath: Muntadher Saleh‎‎‎‎‎‎‎‎‎‎‎‎
The Last Polymath: Muntadher Saleh‎‎‎‎‎‎‎‎‎‎‎‎
iraqartsandculture
 
2137ad Merindol Colony Interiors where refugee try to build a seemengly norm...
2137ad  Merindol Colony Interiors where refugee try to build a seemengly norm...2137ad  Merindol Colony Interiors where refugee try to build a seemengly norm...
2137ad Merindol Colony Interiors where refugee try to build a seemengly norm...
luforfor
 
一比一原版(GU毕业证)格里菲斯大学毕业证成绩单
一比一原版(GU毕业证)格里菲斯大学毕业证成绩单一比一原版(GU毕业证)格里菲斯大学毕业证成绩单
一比一原版(GU毕业证)格里菲斯大学毕业证成绩单
zvaywau
 
ART FORMS OF KERALA: TRADITIONAL AND OTHERS
ART FORMS OF KERALA: TRADITIONAL AND OTHERSART FORMS OF KERALA: TRADITIONAL AND OTHERS
ART FORMS OF KERALA: TRADITIONAL AND OTHERS
Sandhya J.Nair
 
2137ad - Characters that live in Merindol and are at the center of main stories
2137ad - Characters that live in Merindol and are at the center of main stories2137ad - Characters that live in Merindol and are at the center of main stories
2137ad - Characters that live in Merindol and are at the center of main stories
luforfor
 
Inter-Dimensional Girl Boards Segment (Act 3)
Inter-Dimensional Girl Boards Segment (Act 3)Inter-Dimensional Girl Boards Segment (Act 3)
Inter-Dimensional Girl Boards Segment (Act 3)
CristianMestre
 
Sundabet | Slot gacor dan terpercaya mudah menang
Sundabet | Slot gacor dan terpercaya mudah menangSundabet | Slot gacor dan terpercaya mudah menang
Sundabet | Slot gacor dan terpercaya mudah menang
Sundabet | Situs Slot gacor dan terpercaya
 
thGAP - BAbyss in Moderno!! Transgenic Human Germline Alternatives Project
thGAP - BAbyss in Moderno!!  Transgenic Human Germline Alternatives ProjectthGAP - BAbyss in Moderno!!  Transgenic Human Germline Alternatives Project
thGAP - BAbyss in Moderno!! Transgenic Human Germline Alternatives Project
Marc Dusseiller Dusjagr
 
Caffeinated Pitch Bible- developed by Claire Wilson
Caffeinated Pitch Bible- developed by Claire WilsonCaffeinated Pitch Bible- developed by Claire Wilson
Caffeinated Pitch Bible- developed by Claire Wilson
ClaireWilson398082
 

Recently uploaded (20)

ashokathegreat project class 12 presentation
ashokathegreat project class 12 presentationashokathegreat project class 12 presentation
ashokathegreat project class 12 presentation
 
IrishWritersCtrsPersonalEssaysMay29.pptx
IrishWritersCtrsPersonalEssaysMay29.pptxIrishWritersCtrsPersonalEssaysMay29.pptx
IrishWritersCtrsPersonalEssaysMay29.pptx
 
Memory Rental Store - The Ending(Storyboard)
Memory Rental Store - The Ending(Storyboard)Memory Rental Store - The Ending(Storyboard)
Memory Rental Store - The Ending(Storyboard)
 
Memory Rental Store - The Chase (Storyboard)
Memory Rental Store - The Chase (Storyboard)Memory Rental Store - The Chase (Storyboard)
Memory Rental Store - The Chase (Storyboard)
 
CLASS XII- HISTORY-THEME 4-Thinkers, Bes
CLASS XII- HISTORY-THEME 4-Thinkers, BesCLASS XII- HISTORY-THEME 4-Thinkers, Bes
CLASS XII- HISTORY-THEME 4-Thinkers, Bes
 
一比一原版UPenn毕业证宾夕法尼亚大学毕业证成绩单如何办理
一比一原版UPenn毕业证宾夕法尼亚大学毕业证成绩单如何办理一比一原版UPenn毕业证宾夕法尼亚大学毕业证成绩单如何办理
一比一原版UPenn毕业证宾夕法尼亚大学毕业证成绩单如何办理
 
一比一原版(DU毕业证)迪肯大学毕业证成绩单
一比一原版(DU毕业证)迪肯大学毕业证成绩单一比一原版(DU毕业证)迪肯大学毕业证成绩单
一比一原版(DU毕业证)迪肯大学毕业证成绩单
 
acting board rough title here lolaaaaaaa
acting board rough title here lolaaaaaaaacting board rough title here lolaaaaaaa
acting board rough title here lolaaaaaaa
 
Codes n Conventionss copy (2).pptx new new
Codes n Conventionss copy (2).pptx new newCodes n Conventionss copy (2).pptx new new
Codes n Conventionss copy (2).pptx new new
 
The Legacy of Breton In A New Age by Master Terrance Lindall
The Legacy of Breton In A New Age by Master Terrance LindallThe Legacy of Breton In A New Age by Master Terrance Lindall
The Legacy of Breton In A New Age by Master Terrance Lindall
 
The Last Polymath: Muntadher Saleh‎‎‎‎‎‎‎‎‎‎‎‎
The Last Polymath: Muntadher Saleh‎‎‎‎‎‎‎‎‎‎‎‎The Last Polymath: Muntadher Saleh‎‎‎‎‎‎‎‎‎‎‎‎
The Last Polymath: Muntadher Saleh‎‎‎‎‎‎‎‎‎‎‎‎
 
2137ad Merindol Colony Interiors where refugee try to build a seemengly norm...
2137ad  Merindol Colony Interiors where refugee try to build a seemengly norm...2137ad  Merindol Colony Interiors where refugee try to build a seemengly norm...
2137ad Merindol Colony Interiors where refugee try to build a seemengly norm...
 
European Cybersecurity Skills Framework Role Profiles.pdf
European Cybersecurity Skills Framework Role Profiles.pdfEuropean Cybersecurity Skills Framework Role Profiles.pdf
European Cybersecurity Skills Framework Role Profiles.pdf
 
一比一原版(GU毕业证)格里菲斯大学毕业证成绩单
一比一原版(GU毕业证)格里菲斯大学毕业证成绩单一比一原版(GU毕业证)格里菲斯大学毕业证成绩单
一比一原版(GU毕业证)格里菲斯大学毕业证成绩单
 
ART FORMS OF KERALA: TRADITIONAL AND OTHERS
ART FORMS OF KERALA: TRADITIONAL AND OTHERSART FORMS OF KERALA: TRADITIONAL AND OTHERS
ART FORMS OF KERALA: TRADITIONAL AND OTHERS
 
2137ad - Characters that live in Merindol and are at the center of main stories
2137ad - Characters that live in Merindol and are at the center of main stories2137ad - Characters that live in Merindol and are at the center of main stories
2137ad - Characters that live in Merindol and are at the center of main stories
 
Inter-Dimensional Girl Boards Segment (Act 3)
Inter-Dimensional Girl Boards Segment (Act 3)Inter-Dimensional Girl Boards Segment (Act 3)
Inter-Dimensional Girl Boards Segment (Act 3)
 
Sundabet | Slot gacor dan terpercaya mudah menang
Sundabet | Slot gacor dan terpercaya mudah menangSundabet | Slot gacor dan terpercaya mudah menang
Sundabet | Slot gacor dan terpercaya mudah menang
 
thGAP - BAbyss in Moderno!! Transgenic Human Germline Alternatives Project
thGAP - BAbyss in Moderno!!  Transgenic Human Germline Alternatives ProjectthGAP - BAbyss in Moderno!!  Transgenic Human Germline Alternatives Project
thGAP - BAbyss in Moderno!! Transgenic Human Germline Alternatives Project
 
Caffeinated Pitch Bible- developed by Claire Wilson
Caffeinated Pitch Bible- developed by Claire WilsonCaffeinated Pitch Bible- developed by Claire Wilson
Caffeinated Pitch Bible- developed by Claire Wilson
 

Presentation 7.pptx

  • 1. DATA ANALYSIS USING SPSS SUMIA FATIMA Research Development Head RSRS
  • 2. Introduction The software used is SPSS (Statistical Package for the Social Sciences) –commonly used in social sciences and health fields –as opposed to other statistical software such as SAS or R, it requires little to no coding background
  • 3. The Big Question. How should I analyze my data? It depends on the nature of the data and what questions you want to answer To answer those questions, you need to explore your data. and select the proper analysis
  • 4. Big Picture Steps in Statistical Analysis Explore your data Look at data Identify data Graph/Describe data Formulate Question (Hypothesis) 2.Analyze your data 1.Set up hypothesis 2.Check normality 3.Select and run appropriate test 3.Interpret your results 1.Find the Test Statistic, DF, and P-value 2.Determine if significant 3.State if null hypothesis rejected or not 4.Write result 5.Present appropriate plot
  • 5. Defining Terms There are two basic data types, each with two sub-types Numerical: expressed by numbers • Discrete: numbers take on integer values only (number of children, number of siblings) • Continuous: numbers can take on decimal values (height, weight) Categorical: expressed by categories (also known as factors/groups) • Nominal: no meaningful order between categories (gender, occupation) • Ordinal: categories can be put in meaningful order (agreement, level of pain, etc.)
  • 6. Defining Terms Data can also be paired or unpaired • Paired: categories are related to one another 1. Often result of before and after situations (treatments/events) 2. Since each part of the pair is related to each other, this needs to be considered • Unpaired: categories are not related to one another Numerical data can be parametric or non-parametric Simply put, parametric data approximately fits a normal distribution • Data are symmetric around a central point • “Bell curve” • Also known as normally distributed Data must be parametric (normally distributed) for many statistical tests • If the data are not parametric, you cannot use the test results • If the data are non-parametric (does not fit a normal distribution), there are non-parametric tests for use, but they are weaker
  • 7. Defining Terms 4 For statistical tests, we use two types of variables: Independent Variable-variation does not depend on another variable • Usually denoted as X • Typically represents what the researcher set up (treatment, group, etc.) Dependent Variable –value depends on another variable (the independent one) • Usually denoted as Y • Represents the variable that the researcher is interested in • Output or outcome Almost all statistical tests give three important pieces of information Test statistic • Variable calculated from sample data and used in hypothesis test • Used to determine whether a test was significant or not Degrees of Freedom • Number of values of quantities that can be assigned to a statistical distribution • Should be reported with test results P-value • Measure of significance for the test statistic • Typically 0.05 is the cutoff value
  • 8. Defining Terms Recap • Data can be: • –Numerical, categorical, or nuisance • –Paired or unpaired • –Parametric or non-parametric (usually must run a test to tell) • Independent and Dependent Variable
  • 9. Using descriptive statistics Measures of central tendency, or ‘average: –Mean: all values are summed and divided by the number of values –Median: middle value –Mode: the most common value Measures of spread: –Interquartile range –Standard Deviation
  • 10.
  • 11. Types of Graphs to be covered • Type of Graph Data Type Basic Example • Histogram Single numerical variable Heights of freshman students • Boxplot Single numerical variable; single numerical variable + categorical variable Heights of freshman students • Bar Chart Single numerical variable + categorical variable Heights of students by grade • Scatterplot Two numerical variables Heights and weights of students • Line Charts Two numerical variables (one usually time) Heart rate over time • Multiple Line Three or more numerical variable Various concentrations of nutrients in charts (one usually time, rest on same scale) bloodstream over time • Pie graph Single numerical variable (proportions) Percentageof students across grades +categorical variable
  • 12. Inferential Statistics If we want to draw conclusions about an entire population from our sample, we enter the realm of inferential statistics This section will go over a variety of the basic tests
  • 13. Explore your data Look at data Identify data Graph/Describe data Formulate Question (Hypothesis) 2.Analyze your data 1.Set up hypothesis 2.Check normality 3.Select and run appropriate test 3.Interpret your results 1.Find the Test Statistic, DF, and P-value 2.Determine if significant 3.State if null hypothesis rejected or not 4.Write result 5.Present appropriate plot
  • 14. Analyze your data: Set up Hypothesis When running a statistical test, there are two hypotheses being tested Null Hypothesis: the default, or ‘boring’ state •Typically ‘no change’, ‘no difference’, or ‘no relationship’ Alternative Hypothesis: something else happening Construct the two hypotheses based on your question from the data exploration step Example –Question: Is there a difference between male and female shark body length? –Null Hypothesis: There is no difference in shark length by gender. –Alternative Hypothesis: There is a difference in shark length by gender.
  • 15. Check Normality • Reminder: Non-parametric tests are weaker, so we only use those tests if we cannot use parametric ones
  • 16. NORMALITY • Bell Curve Distribution • Skewness and Kurtosis values between -1.96 to +1.96 • Shapiro Wilk Test or Kolmogorov test value above 0.05
  • 17. Interpret Your Results Find the Test Statistic, DF, and P-value • Generally picking them out of a results table • If the test does not give degrees of freedom (DF), use number of samples instead (N) Determine if significant • If the p-value is below a certain threshold (usually 0.05), it is significant • If the p-value is above, it is not significant • .State if null hypothesis rejected or not • Null hypothesis rejected if significant p-value for the test statistic Write result • Answer the question stated from the data exploration • Include the test statistic, p-value, and degrees of freedom • Also include type of test • Example 1: Female sharks were significantly larger than males sharks (two-tailed T-test, F=5.67, p-value=0.0024, DF=19) • Example 2: There was no relationship between the number of cups of coffee drunk and exam score (Pearson Correlation, F=1.23, p-value=0.5863, DF=24) Present appropriate plot • Don’t typically plot anything for a non-significant test • Simple tests like t-tests can just have the written results; more complex analyses like correlation or ANOVA should get a plot