Downloaded 605 times
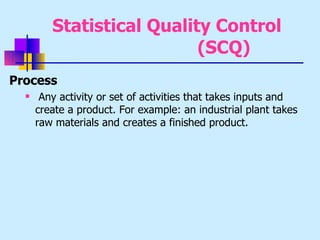
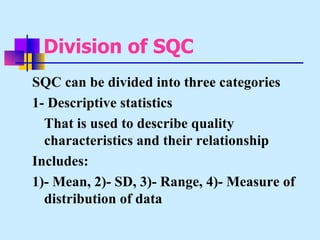
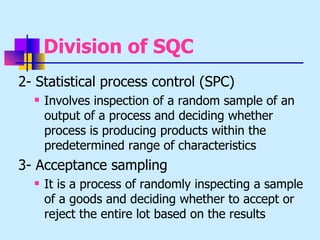
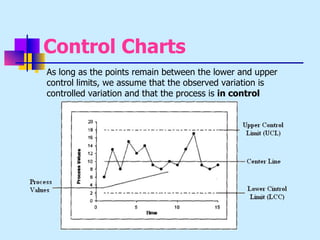
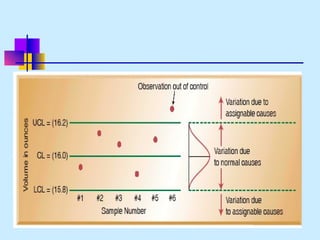
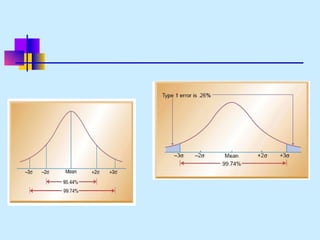
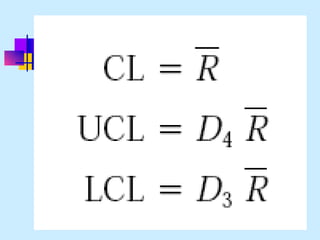
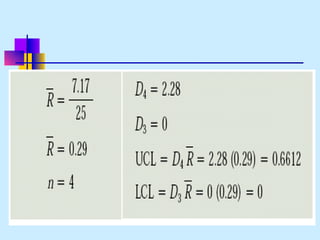
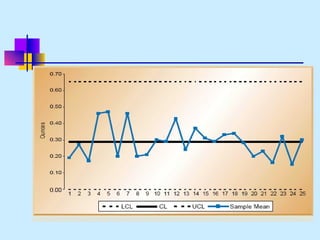

1. The document discusses statistical quality control (SQC) and how it can be divided into descriptive statistics, statistical process control (SPC), and acceptance sampling. SPC involves inspecting random samples from a process to determine if the process is producing products within predetermined ranges. 2. The document explains the differences between controlled and uncontrolled variation. Controlled variation results from normal process factors while uncontrolled variation is due to special causes that need to be addressed. Control charts are used to visually identify points and processes that are out of control. 3. Different types of control charts (variable and attribute charts) are discussed for monitoring both continuous measurements and discrete attributes of a process. The document provides an example of an X-bar


