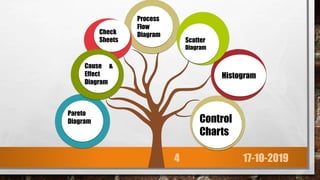
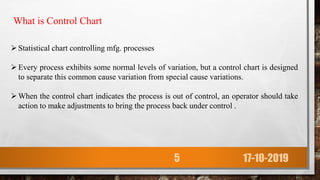
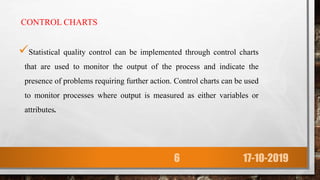
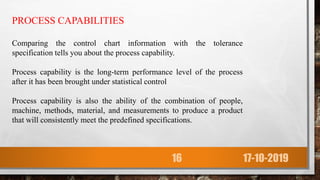
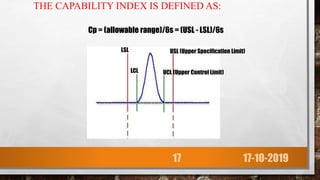
Presented by-
Ashish Rajendra Chaudhari
M. Pharm 1st Sem.
Statistical Control Chart 17-10-2019
1
CONTENT
Introduction
Objective
Principal
Control Chart
Characteristics
Importance
Reference
17-10-20192
Statistical process control are tools used to determine
whether a manufacturing of dosage form in pharmaceutical
industry is in a state of statistical control or not
The charts are used to provide a visual graphic representation
of instances when a process is beginning to go out of control.
Monitors, controls, and improves processes through statistical
techniques.
INTRODUCTION
17-10-20193
Pareto
Diagram
m
Control
Charts
Process
Flow
Diagram
Histogram
Scatter
Diagram
Check
Sheets
Cause &
Effect
Diagram
17-10-20194
What is Control Chart
Statistical chart controlling mfg. processes
Every process exhibits some normal levels of variation, but a control chart is designed
to separate this common cause variation from special cause variations.
When the control chart indicates the process is out of control, an operator should take
action to make adjustments to bring the process back under control .
17-10-20195
CONTROL CHARTS
Statistical quality control can be implemented through control charts
that are used to monitor the output of the process and indicate the
presence of problems requiring further action. Control charts can be used
to monitor processes where output is measured as either variables or
attributes.
17-10-20196
OBJECTIVE
To secure information to be used in changing specifications or in determining whether
the process can meet specifications or not.
 To secure information to be used on establishing or changing production procedures.
To secure information to be used on changing inspection procedures or acceptance
procedures or both.
To provide a basis for current decision during production.
To provide a basis for current decisions on acceptance for rejection of manufacturing or
purchased product.
To familiarize personnel with the use of control chart.
17-10-20197
PRINCIPLE
A process that is operating with only chance causes of variation present is said
to be in statistical control.
A process that is operating in the presence of assignable causes is said to be out
of control.
The 0goal of spc is the elimination of variability in the process
17-10-20198
TYPES
CONTROL
CHARTS
Variable
charts
X-Bar R-Bar
Attribute
charts
P-Chart C-Chart nP-Chart
17-10-20199
VARIABLE CHARTS
•Charts for variable data requires measurements on continuous scale such as
lengths, weight, PH or resistance
• Variable data include more information than attribute data , thus are preferred
for SPC and essential for diagnosis
•Types of variable charts :
1) x-bar
2) r-bar
17-10-201910
ATTRIBUTE CHARTS
•Attribute data requires only a count of discrete measurements such as
good or bad.
•The charts for attributes will be useful provided the defective rate is
high enough to show on the chart with a reasonable subgroup size .
•Current competitive quality requirement in many industries are so high
that attribute charts are not useful .
17-10-201911
CHARACTERISTICS
•A control chart is a time-ordered diagram to monitor a quality characteristic,
consisting of:
• 1. A nominal value, or center line, the average of several past samples.
•2. Two control limits used to judge whether action is required, an upper
control limit (UCL) and a lower control limit (LCL).
•3. Data points, each consisting of the average measurement calculated from a
sample taken from the process, ordered overtime. By the central limit
theorem, regardless of the distribution of the underlying individual
measurements, the distribution of the sample means will follow a normal
distribution. The control limits are set based on the sampling distribution of
the quality measurement.
17-10-201912
17-10-201913
BENEFITS
•A control chart indicates when something may be wrong, so that corrective action
can be taken.
• The patterns of the plot on a control chart diagnosis possible cause and hence
indicate possible remedial actions.
• It can estimate the process capability of process.
• It provides useful information regarding actions to take for quality improvement
17-10-201914
Importance
Improving product quality
Improving productivity
Reducing waste
Reducing defects and improving
customer value
17-10-201915
Comparing the control chart information with the tolerance
specification tells you about the process capability.
Process capability is the long-term performance level of the process
after it has been brought under statistical control
Process capability is also the ability of the combination of people,
machine, methods, material, and measurements to produce a product
that will consistently meet the predefined specifications.
PROCESS CAPABILITIES
17-10-201916
17-10-201917
THE CAPABILITY INDEX IS DEFINED AS:
Cp = (allowable range)/6s = (USL - LSL)/6s
USL (Upper Specification Limit)LSL
LCL UCL (Upper Control Limit)
CONCLUSION
•Several drawbacks in the conventional approach of drug formulation
development can be solved by using control charts as tools in statistical process
control to determine whether a manufacturing of dosage form in pharmaceutical
industry is in a state of statistical control or not.
•The control charts serve to illustrate the current operational condition of a process
by providing a visual display that clearly indicates whether a process is within
limits, out of control, or headed for an out of control condition, offering
management time to take corrective action and avoid waste.
17-10-201918
REFERENCES
1. Joseph M. Juran , A.Blanton Godfrey . Jurann’s Handbook 5th edition,
McGraw-Hill , New York Washington, D.C. pp. 45.1.
2. Shah, S., Shridhar, P. And Gohil, D., 2014. Control chart: A statistical process
control tool in pharmacy. Asian journal of pharmaceutics (AJP): free full text
articles from Asian J pharm, 4 (3).
3. Rami Hikmat Found, Adman Mukattash , Statistical Process Control Tools: A
Practical for Jordanian Industrial Organization ,JJMIE, Volume 4 , No 6,
December 2010, pp- 693-700
4. www.Slideshare.Com /control charts/Dr.Vijendar Palsingh
17-10-201919
17-10-201920

Statistical control chart

  • 1.
    Presented by- Ashish RajendraChaudhari M. Pharm 1st Sem. Statistical Control Chart 17-10-2019 1
  • 2.
  • 3.
    Statistical process controlare tools used to determine whether a manufacturing of dosage form in pharmaceutical industry is in a state of statistical control or not The charts are used to provide a visual graphic representation of instances when a process is beginning to go out of control. Monitors, controls, and improves processes through statistical techniques. INTRODUCTION 17-10-20193
  • 4.
  • 5.
    What is ControlChart Statistical chart controlling mfg. processes Every process exhibits some normal levels of variation, but a control chart is designed to separate this common cause variation from special cause variations. When the control chart indicates the process is out of control, an operator should take action to make adjustments to bring the process back under control . 17-10-20195
  • 6.
    CONTROL CHARTS Statistical qualitycontrol can be implemented through control charts that are used to monitor the output of the process and indicate the presence of problems requiring further action. Control charts can be used to monitor processes where output is measured as either variables or attributes. 17-10-20196
  • 7.
    OBJECTIVE To secure informationto be used in changing specifications or in determining whether the process can meet specifications or not.  To secure information to be used on establishing or changing production procedures. To secure information to be used on changing inspection procedures or acceptance procedures or both. To provide a basis for current decision during production. To provide a basis for current decisions on acceptance for rejection of manufacturing or purchased product. To familiarize personnel with the use of control chart. 17-10-20197
  • 8.
    PRINCIPLE A process thatis operating with only chance causes of variation present is said to be in statistical control. A process that is operating in the presence of assignable causes is said to be out of control. The 0goal of spc is the elimination of variability in the process 17-10-20198
  • 9.
  • 10.
    VARIABLE CHARTS •Charts forvariable data requires measurements on continuous scale such as lengths, weight, PH or resistance • Variable data include more information than attribute data , thus are preferred for SPC and essential for diagnosis •Types of variable charts : 1) x-bar 2) r-bar 17-10-201910
  • 11.
    ATTRIBUTE CHARTS •Attribute datarequires only a count of discrete measurements such as good or bad. •The charts for attributes will be useful provided the defective rate is high enough to show on the chart with a reasonable subgroup size . •Current competitive quality requirement in many industries are so high that attribute charts are not useful . 17-10-201911
  • 12.
    CHARACTERISTICS •A control chartis a time-ordered diagram to monitor a quality characteristic, consisting of: • 1. A nominal value, or center line, the average of several past samples. •2. Two control limits used to judge whether action is required, an upper control limit (UCL) and a lower control limit (LCL). •3. Data points, each consisting of the average measurement calculated from a sample taken from the process, ordered overtime. By the central limit theorem, regardless of the distribution of the underlying individual measurements, the distribution of the sample means will follow a normal distribution. The control limits are set based on the sampling distribution of the quality measurement. 17-10-201912
  • 13.
  • 14.
    BENEFITS •A control chartindicates when something may be wrong, so that corrective action can be taken. • The patterns of the plot on a control chart diagnosis possible cause and hence indicate possible remedial actions. • It can estimate the process capability of process. • It provides useful information regarding actions to take for quality improvement 17-10-201914
  • 15.
    Importance Improving product quality Improvingproductivity Reducing waste Reducing defects and improving customer value 17-10-201915
  • 16.
    Comparing the controlchart information with the tolerance specification tells you about the process capability. Process capability is the long-term performance level of the process after it has been brought under statistical control Process capability is also the ability of the combination of people, machine, methods, material, and measurements to produce a product that will consistently meet the predefined specifications. PROCESS CAPABILITIES 17-10-201916
  • 17.
    17-10-201917 THE CAPABILITY INDEXIS DEFINED AS: Cp = (allowable range)/6s = (USL - LSL)/6s USL (Upper Specification Limit)LSL LCL UCL (Upper Control Limit)
  • 18.
    CONCLUSION •Several drawbacks inthe conventional approach of drug formulation development can be solved by using control charts as tools in statistical process control to determine whether a manufacturing of dosage form in pharmaceutical industry is in a state of statistical control or not. •The control charts serve to illustrate the current operational condition of a process by providing a visual display that clearly indicates whether a process is within limits, out of control, or headed for an out of control condition, offering management time to take corrective action and avoid waste. 17-10-201918
  • 19.
    REFERENCES 1. Joseph M.Juran , A.Blanton Godfrey . Jurann’s Handbook 5th edition, McGraw-Hill , New York Washington, D.C. pp. 45.1. 2. Shah, S., Shridhar, P. And Gohil, D., 2014. Control chart: A statistical process control tool in pharmacy. Asian journal of pharmaceutics (AJP): free full text articles from Asian J pharm, 4 (3). 3. Rami Hikmat Found, Adman Mukattash , Statistical Process Control Tools: A Practical for Jordanian Industrial Organization ,JJMIE, Volume 4 , No 6, December 2010, pp- 693-700 4. www.Slideshare.Com /control charts/Dr.Vijendar Palsingh 17-10-201919
  • 20.