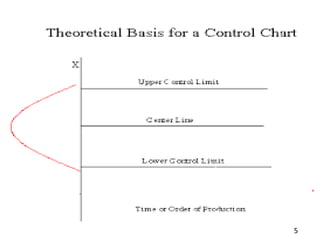
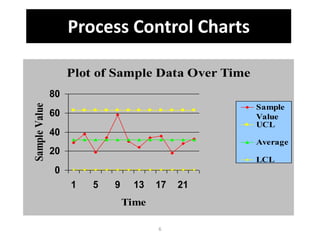
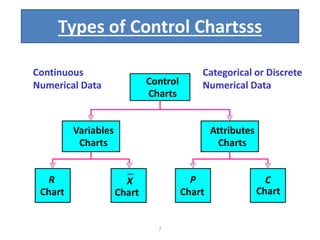
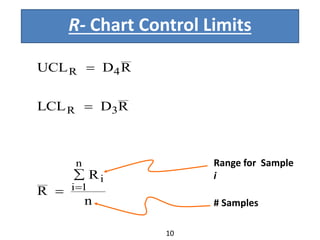
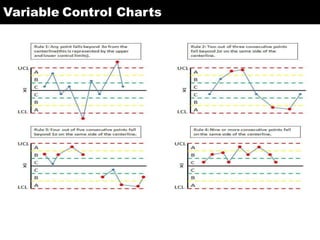
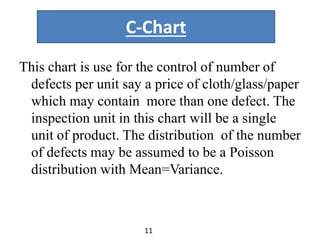
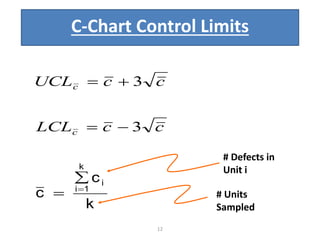
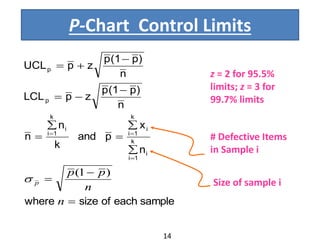
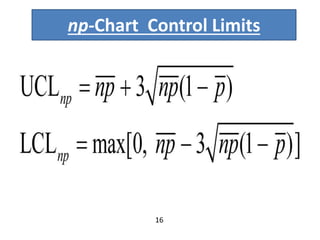
Control Chart
Submitted to:- Submitted By:-
Dr. Vijender Pal Singh Sumit
Asst.prof. (14104024)
MBA Deptt. finance
1
Statistical Quality control
• “statistical quality control can be simply
defined as an economic and effective system
of maintaining and improving the quality of
outputs throughout the whole operating
process of specification , production and
inspection based on continuous testing with
random samples.”
2
Methods of Quality controls
1. Control of the manufacturing process
through the statistical ‘control chart.’
2. Inspection of articles by the ‘acceptance
sampling technique.’
3
Control chart
A statistical chart used for controlling
manufacturing processes is known as a control
chart. A control chart is a graphical method
consisting of the following three different
lines;-
1. Central line.
2. Upper control limit(UCL).
3. Lower control limit(LCL).
4
5
6
Process Control Charts
Plot of Sample Data Over Time
0
20
40
60
80
1 5 9 13 17 21
Time
SampleValue
Sample
Value
UCL
Average
LCL
7
Control
Charts
R
Chart
Variables
Charts
Attributes
Charts
X
Chart
P
Chart
C
Chart
Continuous
Numerical Data
Categorical or Discrete
Numerical Data
Types of Control Chartsss
• This chart is constructed for controlling the
variations in the average quality standard of
the products in a production process . The line
is at  X (mean).
 X Chart
7
9
X Chart Control Limits
Range for
sample i
# Samples
Mean for
sample i
RAxxLCL
RAxxUCL


n
R
R
i
n
1i


n
x
i
n
i
x



Value depends upon sample size
Variable Control ChartX-Bar
X BAR CHART
LCL = 11.90
UCL = 12.10
X = 12.00
Range chart or R- chart
The range chart is constructed for controlling
the variation in the dispersion or variability
of the quality standard of the products in a
production process.
i. The central line is at R(mean)
RD=LCL
RD=UCL
3
4
LimitsControlChartR
9
R- Chart Control Limits
Range for Sample
i
# Samplesn
R
R
RDLCL
RDUCL
i
n
1i
3R
4R





10
Variable Control Charts
C-Chart
This chart is use for the control of number of
defects per unit say a price of cloth/glass/paper
which may contain more than one defect. The
inspection unit in this chart will be a single
unit of product. The distribution of the number
of defects may be assumed to be a Poisson
distribution with Mean=Variance.
11
12
C-Chart Control Limits
# Defects in
Unit i
# Units
Sampledk
c
c
i
k
1i




ccLCL
ccUCL
c
c
3
3
P-Chart
This chart is constructed for controlling the
quality standard in the average fraction
defective of the products in a process
when the observed sample items are
classified into defectives and non-
defectives.
13
P-Chart Control Limits
# Defective Items
in Sample i
Size of sample i
z = 2 for 95.5%
limits; z = 3 for
99.7% limits
sampleeachofsizewhere
n
x
pand
k
n
n
n
)p(1p
zpLCL
n
)p(1p
zpUCL
i
k
1i
i
k
1i
i
k
1i
p
p














n
n
pp
p
)1(

14
np-Chart
The procedure for plotting the points on the
control chart can be simplified if relating
to the number of defectives rather than to
the fraction or percentage or proportion of
defectives are plotted.
15
np-Chart Control Limits
16
Reference
 www.google.com
 en.wikipedia.org./wiki/control_chart
 Quantitative Techniques in business
(Dr.Aditham B.Rao)
 sStatistics For MBA
(Dr. S.C.Aggarwal)
17
Control chart

Control chart

  • 1.
    Control Chart Submitted to:-Submitted By:- Dr. Vijender Pal Singh Sumit Asst.prof. (14104024) MBA Deptt. finance 1
  • 2.
    Statistical Quality control •“statistical quality control can be simply defined as an economic and effective system of maintaining and improving the quality of outputs throughout the whole operating process of specification , production and inspection based on continuous testing with random samples.” 2
  • 3.
    Methods of Qualitycontrols 1. Control of the manufacturing process through the statistical ‘control chart.’ 2. Inspection of articles by the ‘acceptance sampling technique.’ 3
  • 4.
    Control chart A statisticalchart used for controlling manufacturing processes is known as a control chart. A control chart is a graphical method consisting of the following three different lines;- 1. Central line. 2. Upper control limit(UCL). 3. Lower control limit(LCL). 4
  • 5.
  • 6.
    6 Process Control Charts Plotof Sample Data Over Time 0 20 40 60 80 1 5 9 13 17 21 Time SampleValue Sample Value UCL Average LCL
  • 7.
  • 8.
    • This chartis constructed for controlling the variations in the average quality standard of the products in a production process . The line is at  X (mean).  X Chart 7
  • 9.
    9 X Chart ControlLimits Range for sample i # Samples Mean for sample i RAxxLCL RAxxUCL   n R R i n 1i   n x i n i x    Value depends upon sample size
  • 10.
    Variable Control ChartX-Bar XBAR CHART LCL = 11.90 UCL = 12.10 X = 12.00
  • 11.
    Range chart orR- chart The range chart is constructed for controlling the variation in the dispersion or variability of the quality standard of the products in a production process. i. The central line is at R(mean) RD=LCL RD=UCL 3 4 LimitsControlChartR 9
  • 12.
    R- Chart ControlLimits Range for Sample i # Samplesn R R RDLCL RDUCL i n 1i 3R 4R      10
  • 13.
  • 14.
    C-Chart This chart isuse for the control of number of defects per unit say a price of cloth/glass/paper which may contain more than one defect. The inspection unit in this chart will be a single unit of product. The distribution of the number of defects may be assumed to be a Poisson distribution with Mean=Variance. 11
  • 15.
    12 C-Chart Control Limits #Defects in Unit i # Units Sampledk c c i k 1i     ccLCL ccUCL c c 3 3
  • 16.
    P-Chart This chart isconstructed for controlling the quality standard in the average fraction defective of the products in a process when the observed sample items are classified into defectives and non- defectives. 13
  • 17.
    P-Chart Control Limits #Defective Items in Sample i Size of sample i z = 2 for 95.5% limits; z = 3 for 99.7% limits sampleeachofsizewhere n x pand k n n n )p(1p zpLCL n )p(1p zpUCL i k 1i i k 1i i k 1i p p               n n pp p )1(  14
  • 18.
    np-Chart The procedure forplotting the points on the control chart can be simplified if relating to the number of defectives rather than to the fraction or percentage or proportion of defectives are plotted. 15
  • 19.
  • 20.
    Reference  www.google.com  en.wikipedia.org./wiki/control_chart Quantitative Techniques in business (Dr.Aditham B.Rao)  sStatistics For MBA (Dr. S.C.Aggarwal) 17