Downloaded 42 times


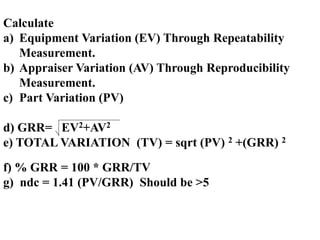


![REPEATABILITY-EQUIPMENT VARIATION(EV)
TRIAL: K1
2 0.8862
EV = R*K1 = 0.0248 3 0.5908
3 0.5908
REPRODUCIBILITY-APPRAISER VARIATION
OPERATOR : K2
AV = [(Xdiff*K2)2
-(EV2
/nr)] 2 0.7071
AV = 0.00 3 0.5231
3 0.5231
REPEATABILITY & REPRODUCIBILITY
R&R = (EV2
+ AV2
)
R&R = 0.02
PART VARIATION (PV)
PV = Rp*K3 = 0.26
PART K3
TOTAL VARIATION (TV) 2 0.7071
TV = (R&R2
+ PV2
) 3 0.5231
TV = 0.26 4 0.4467
% EV = 10 5 0.4030
6 0.3742
% AV = 0 7 0.3534
8 0.3375
% R&R = 10 9 0.3249
10 0.3146
% PV = 100 10 0.3146
Actual
Actual
MEASUREMENT UNIT ANALYSIS
Actual](https://image.slidesharecdn.com/msa5day-191004151429/85/MSA-26-320.jpg)


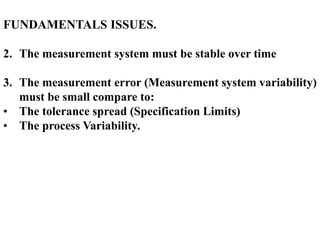
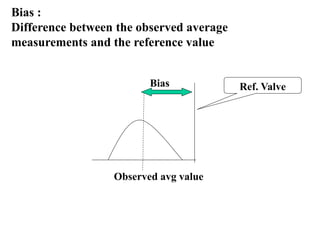
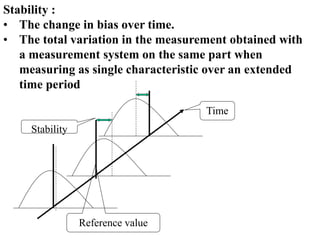
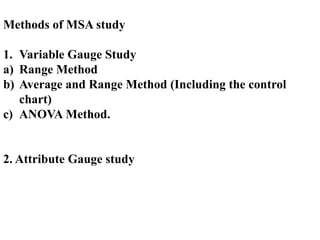
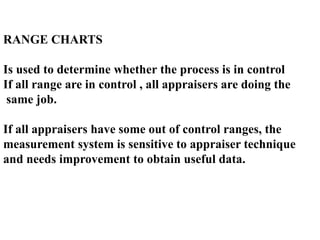
This document discusses measurement system analysis (MSA), which assesses the quality of measurement systems that generate measurements critical to a facility's operations. MSA applies statistical methods to evaluate six key properties (repeatability, reproducibility, accuracy, bias, linearity, stability) that characterize a measurement system's variation. Conducting an MSA is important when a new measuring device is introduced, to compare measurement devices, or when required by a customer's control plan. The document outlines methods like variable and attribute gauge studies to evaluate a measurement system, and provides acceptance criteria to determine if a system is acceptable based on the percentage of variation attributed to the gauge.


![Rodebaugh sixsigma[1]](https://cdn.slidesharecdn.com/ss_thumbnails/rodebaugh-sixsigma1-191102025225-thumbnail.jpg?width=640&height=640&fit=bounds)


