Downloaded 450 times

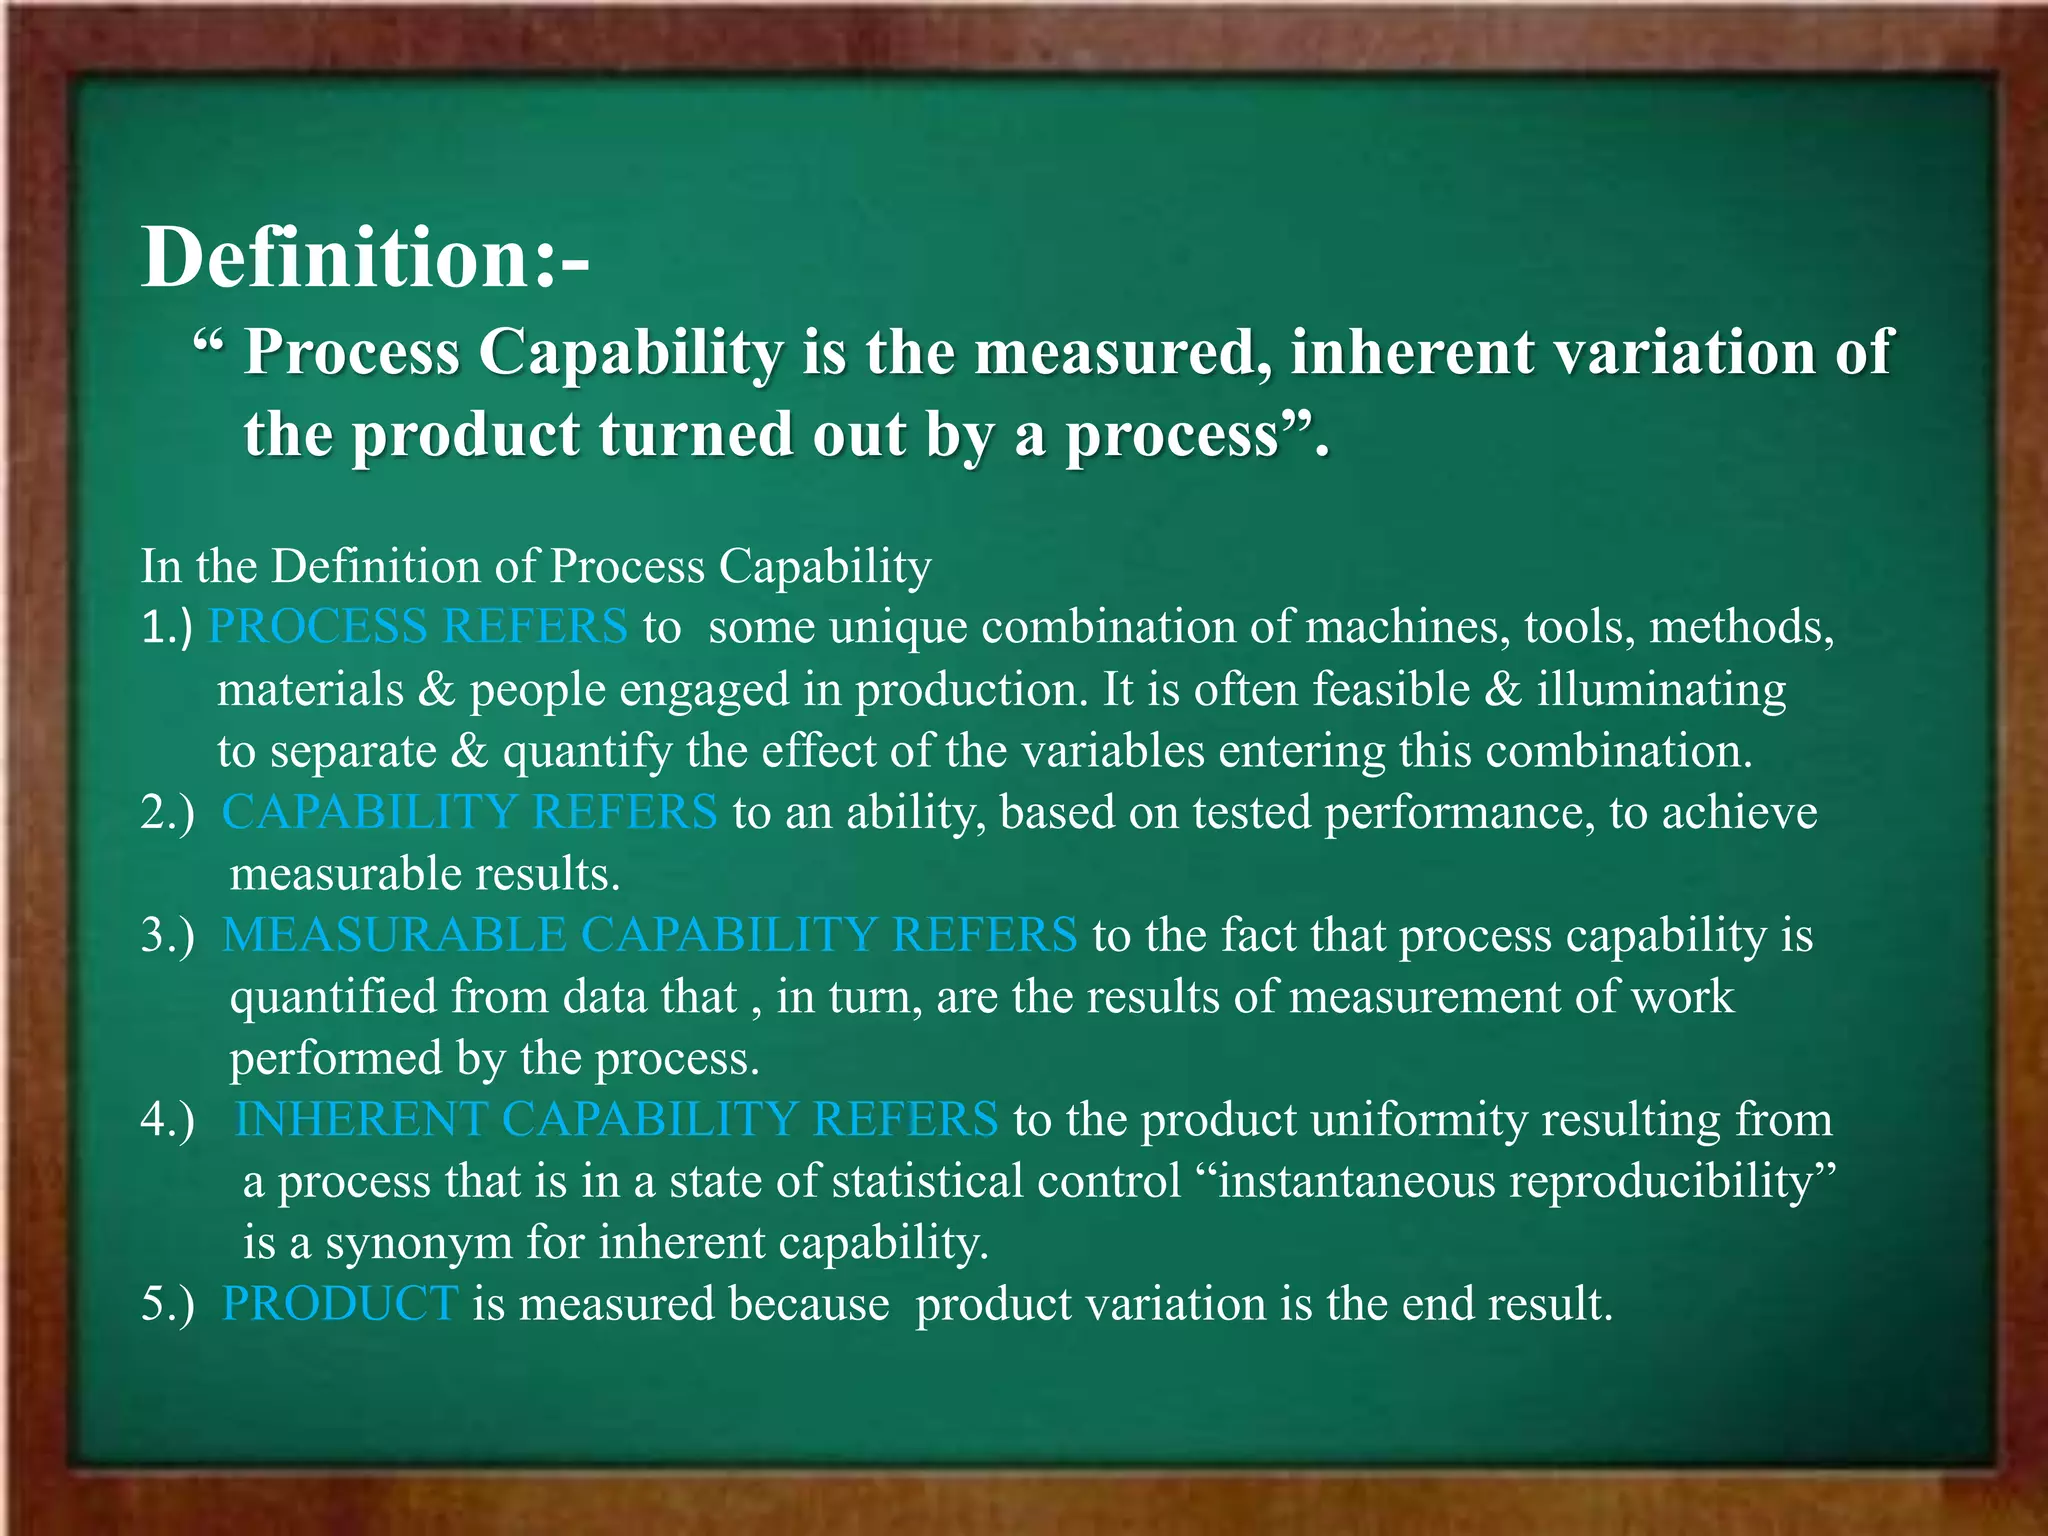
![Limitation of Cp Index & To Generate Cpk
The Cp index is limited in its use since it doesn’t address the centering of the process
Relative to he specification limit. For that reason ,the Cpk was developed and
I is defind as
Cpk = min[ Cpku,Cpkl]
Where, Cpku= =Upper Process Capability Index
Cpkl= =Lower Process Capability Index
If Cp = Cpk the process is center at the midpoint of the specifications.
Cpk <Cp the process is off center. The magnitude of Cpk relative to Cp is a direct
measure of how off-centre the process is operating.](https://image.slidesharecdn.com/1890c7cf-146d-4e07-abab-a3b540aceae7-151011161559-lva1-app6892/75/PROCESS-CAPABILITY-9-2048.jpg)
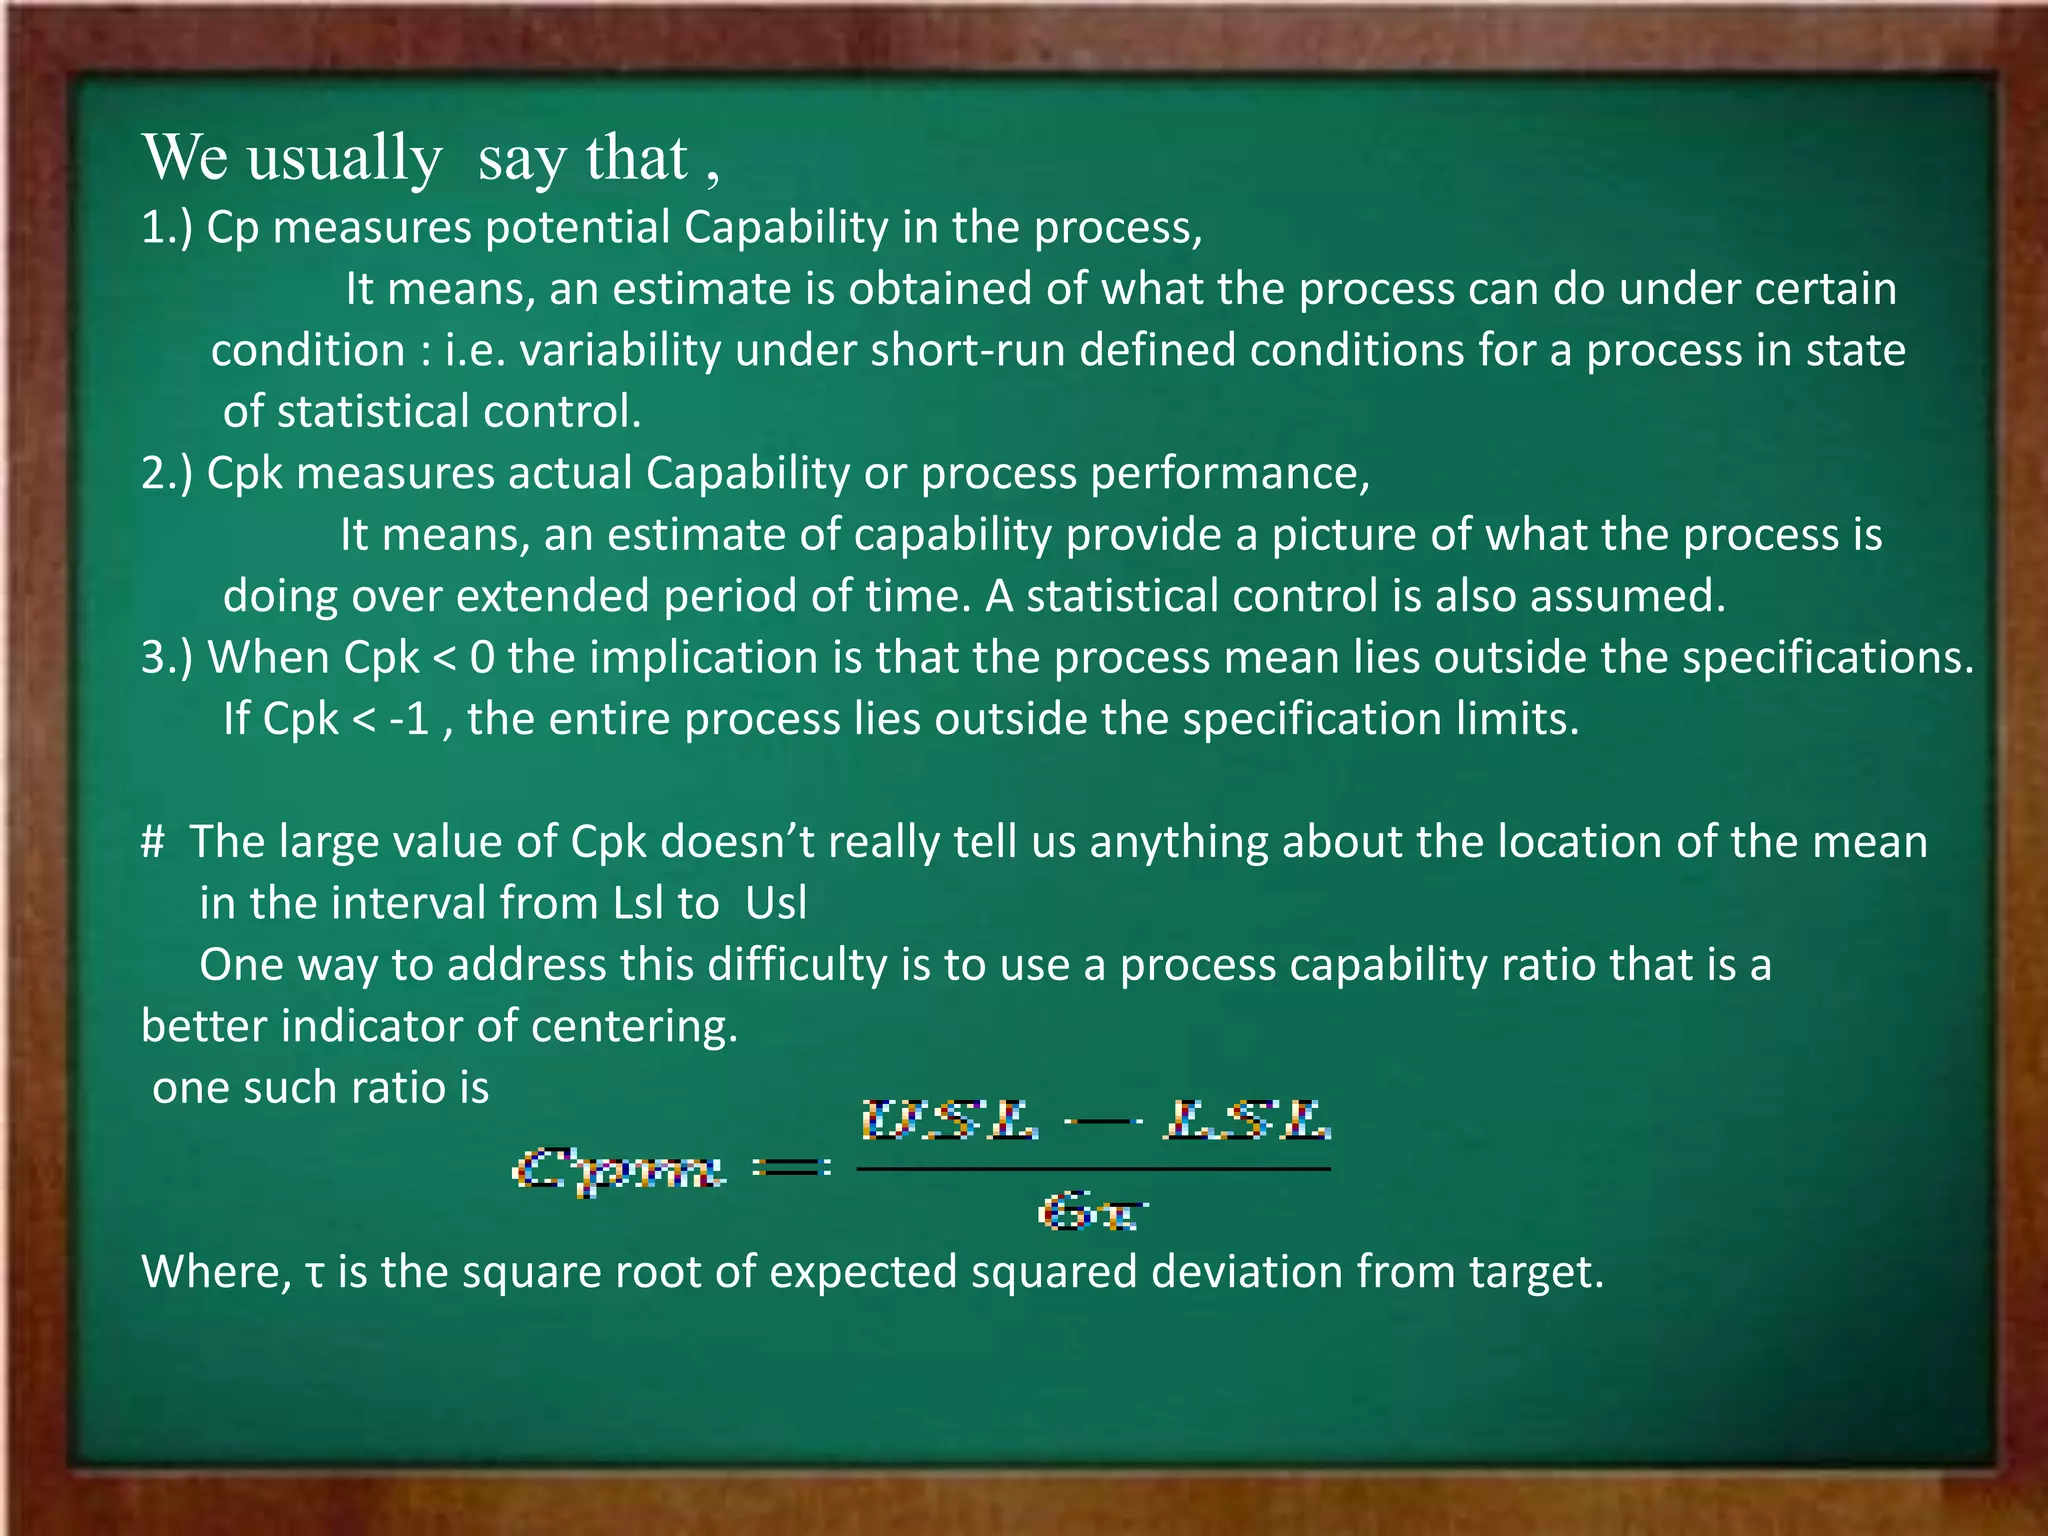
![Cpm
• You are almost never going to use
this, but for completeness…..
• In some processes you will not
target the center point.
• Example cutting impellers you
want to cut an impeller diameter
between 196 and 200 mm
• It may be cheaper to bias the
target cut towards say 199mm
instead of 198mm
• So in this case if we target
199mm we want to measure
the process against the target
instead of the center point
Cpm = Cp/[1+((Xbar-T)^2/s^2)]; Where T is the
target value. Explained above.](https://image.slidesharecdn.com/1890c7cf-146d-4e07-abab-a3b540aceae7-151011161559-lva1-app6892/75/PROCESS-CAPABILITY-15-2048.jpg)


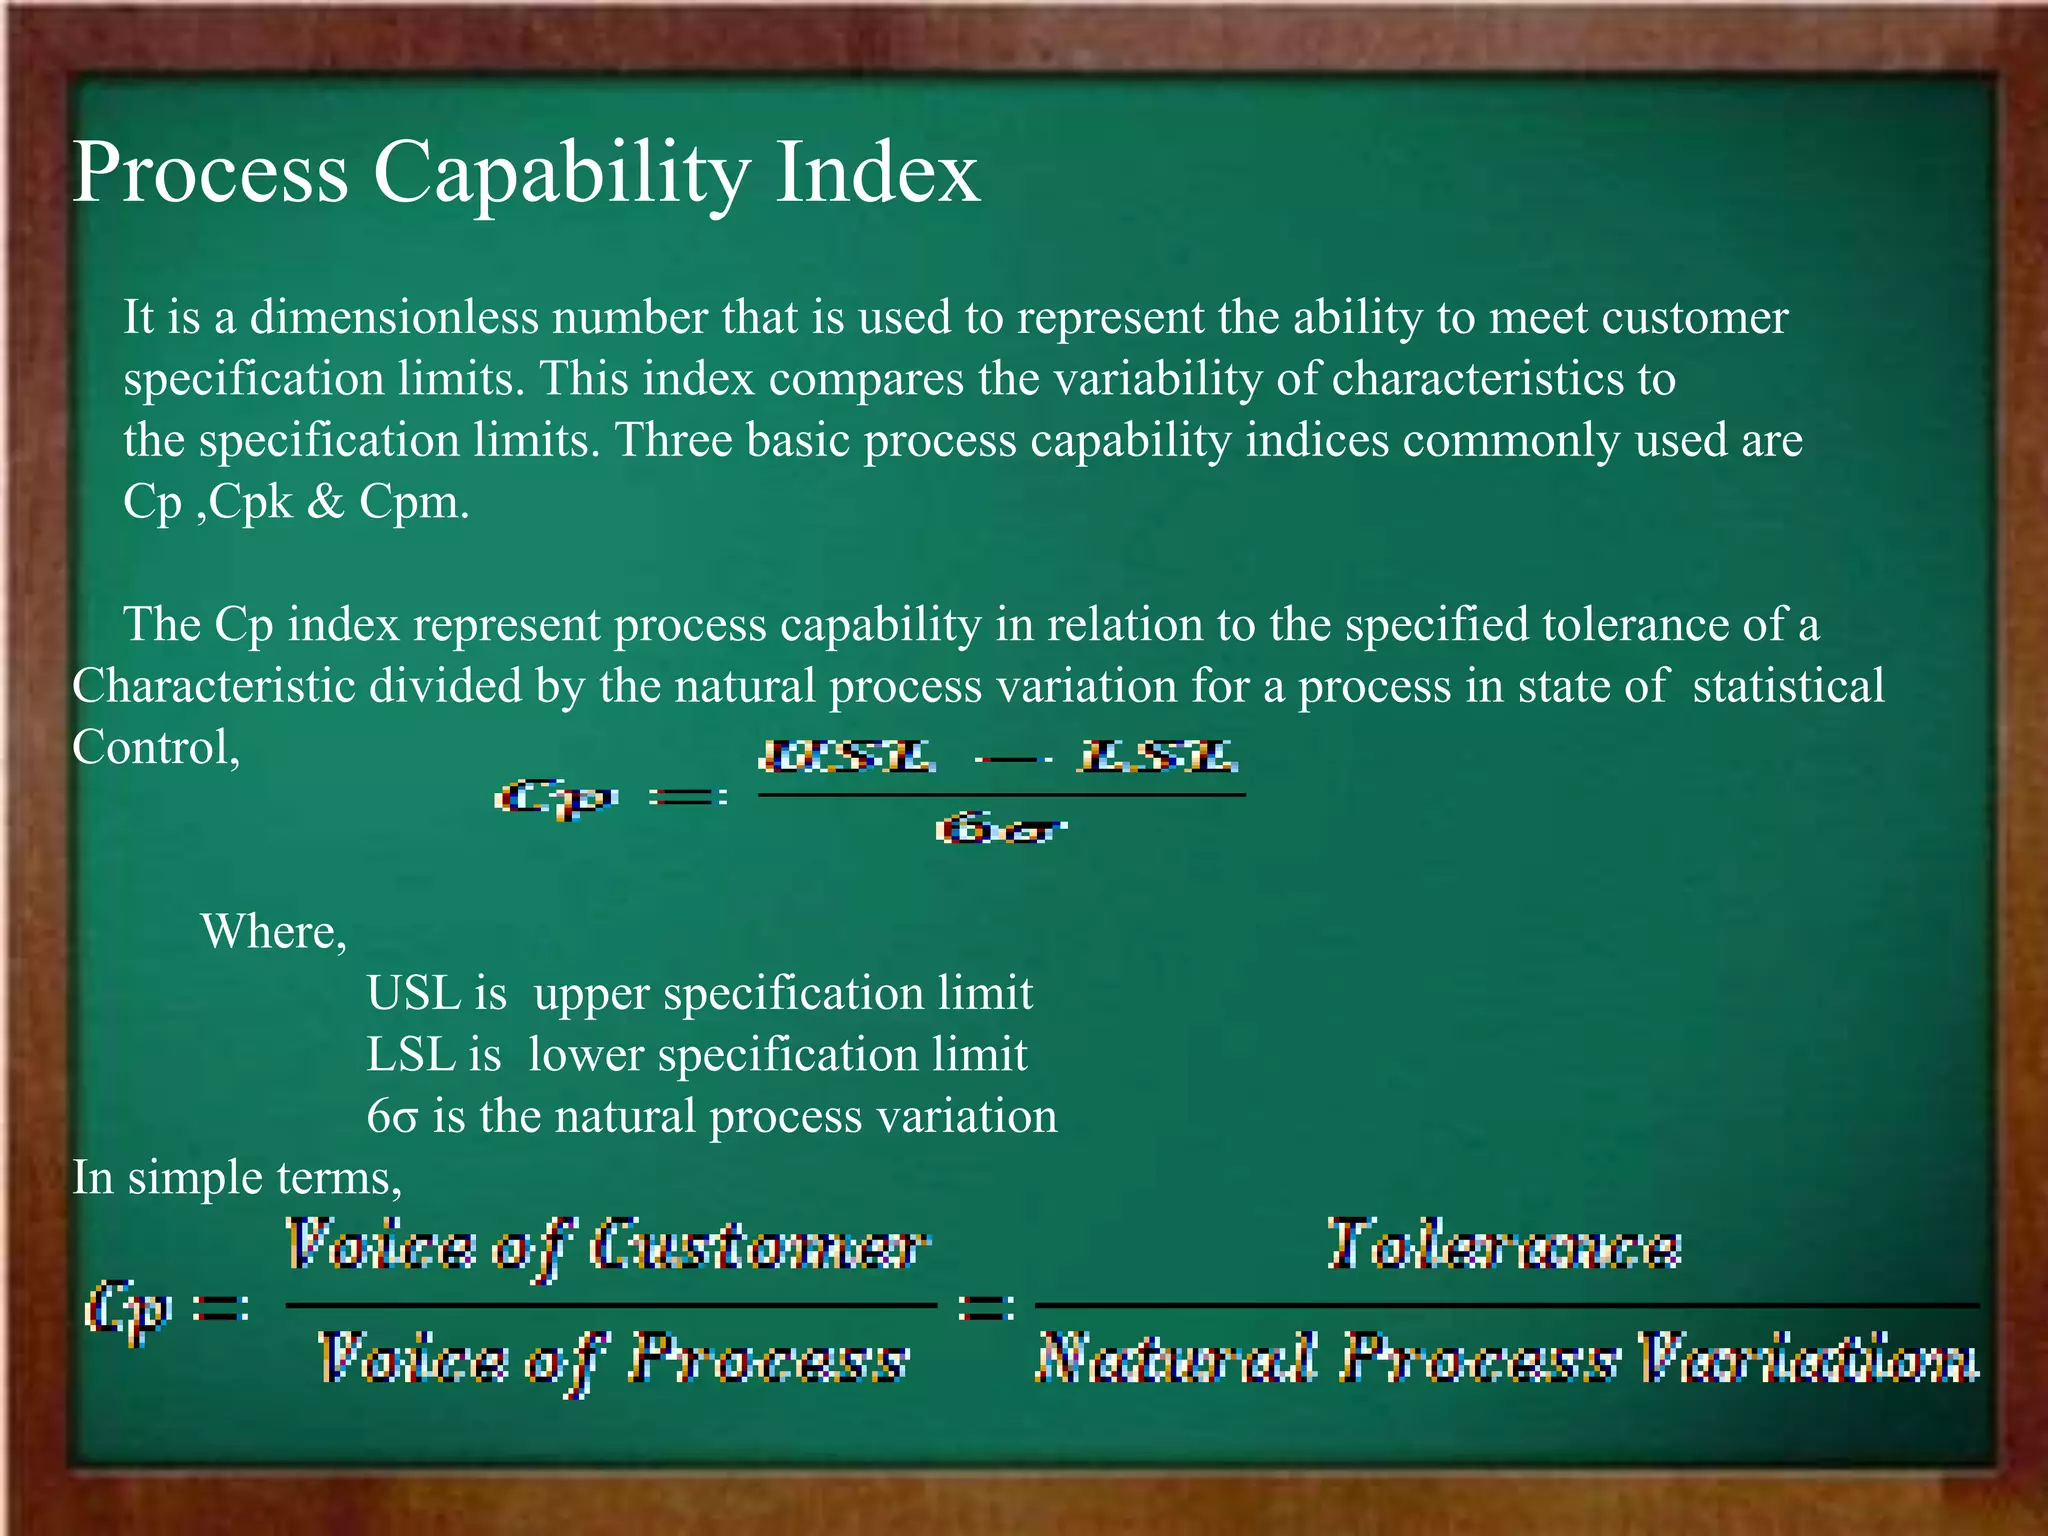
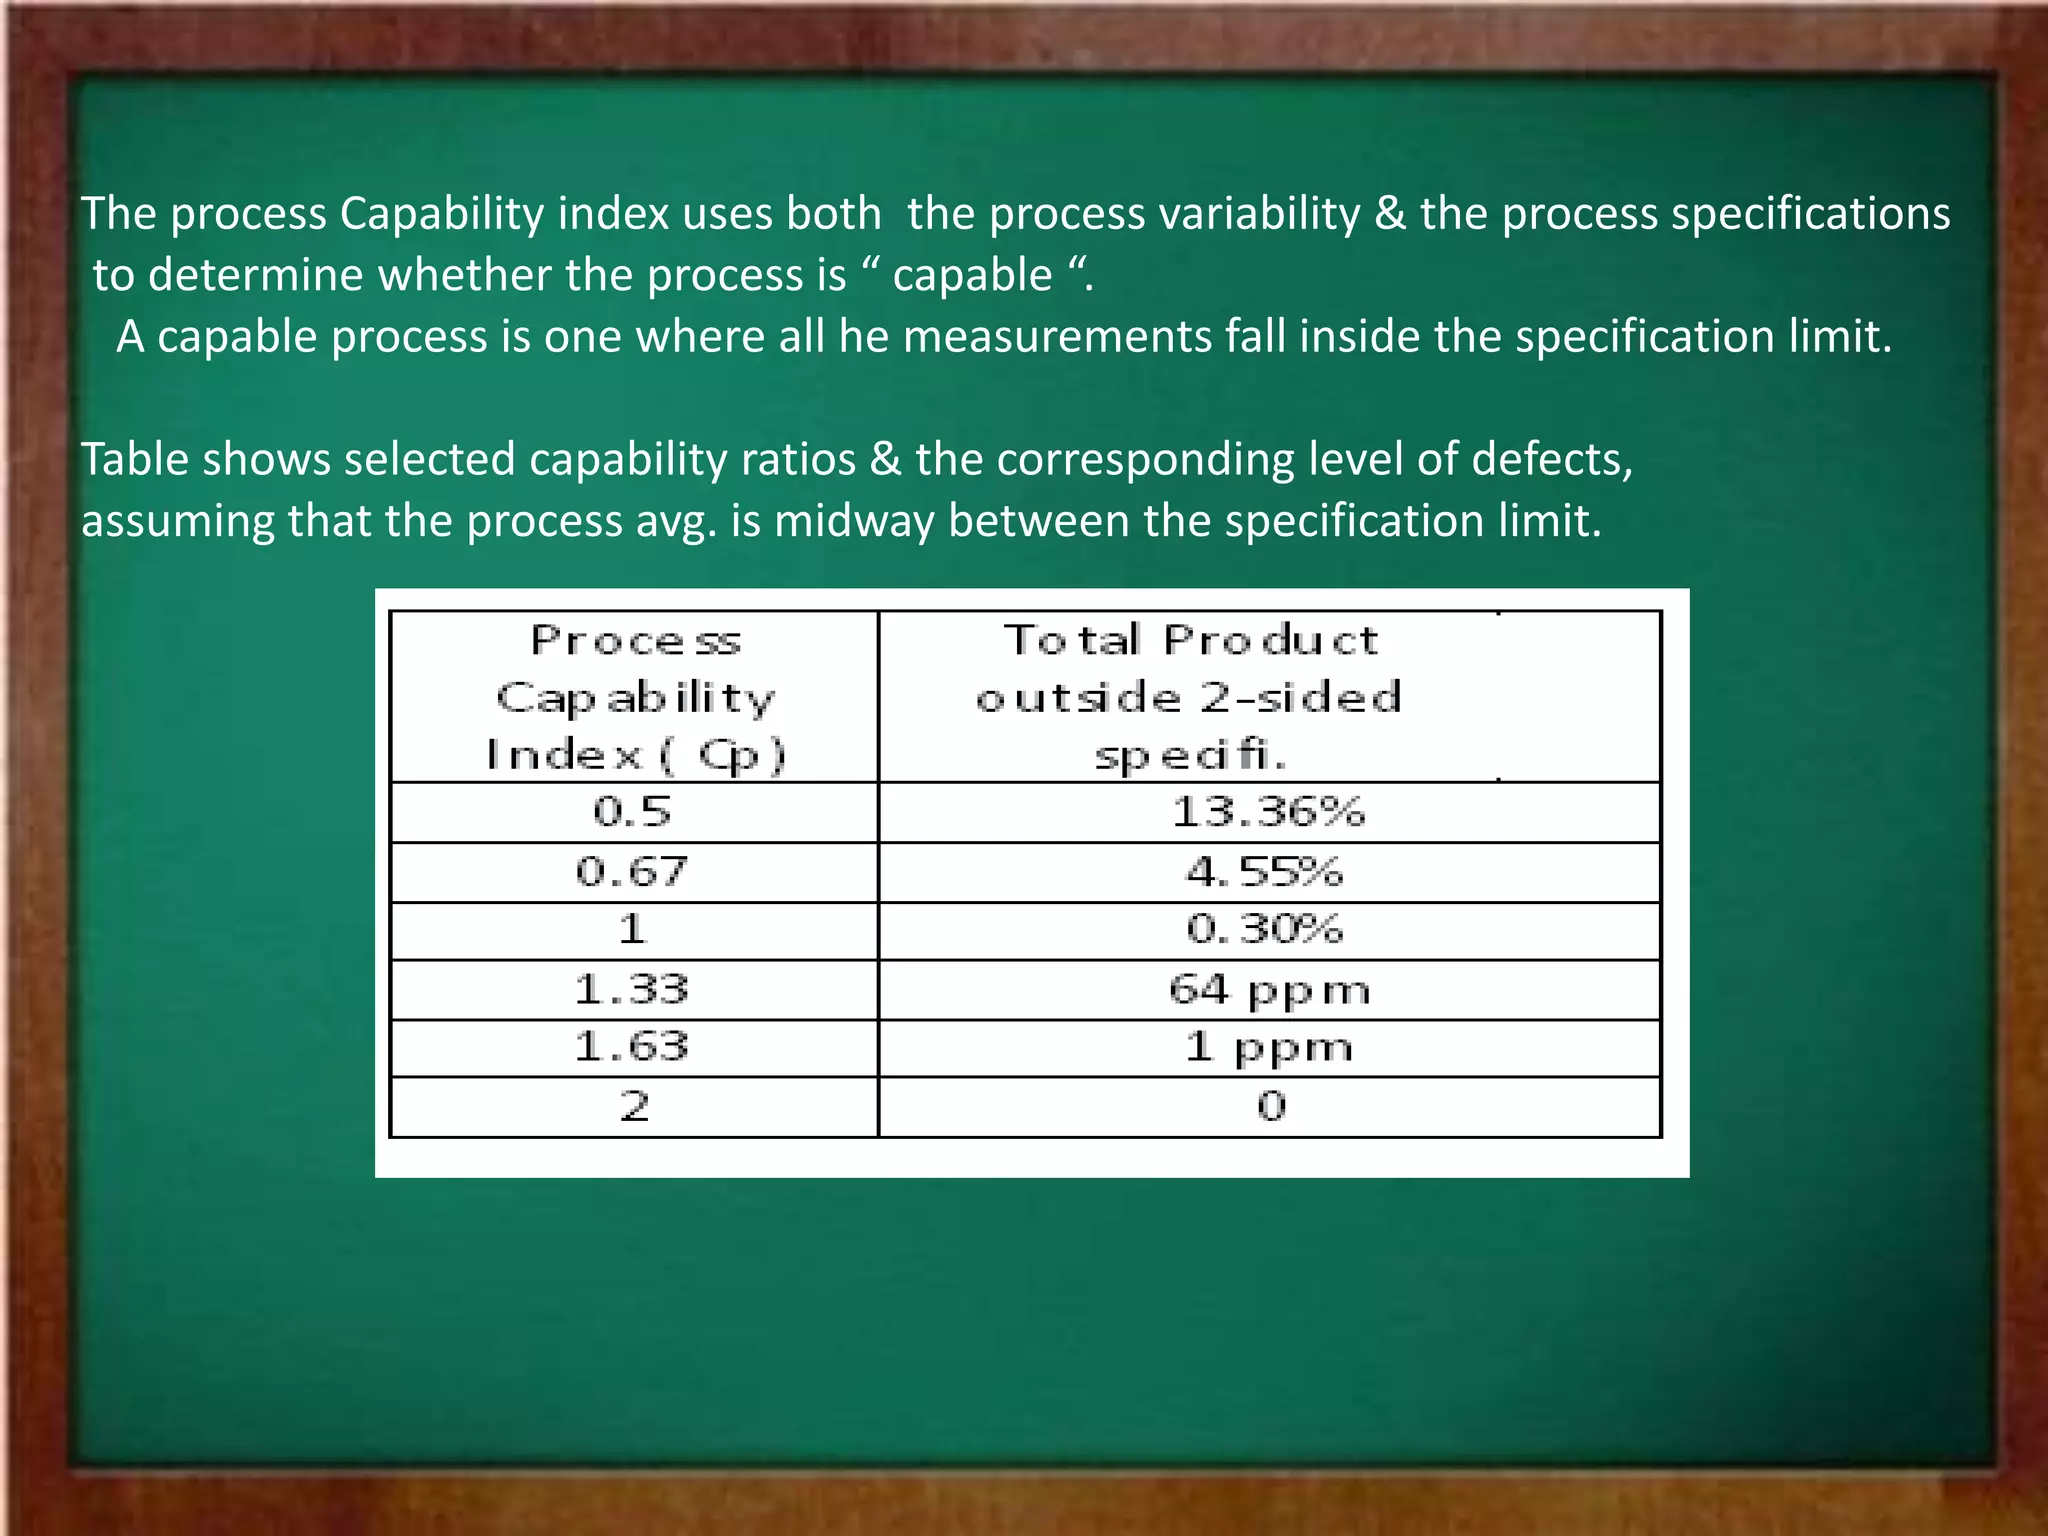
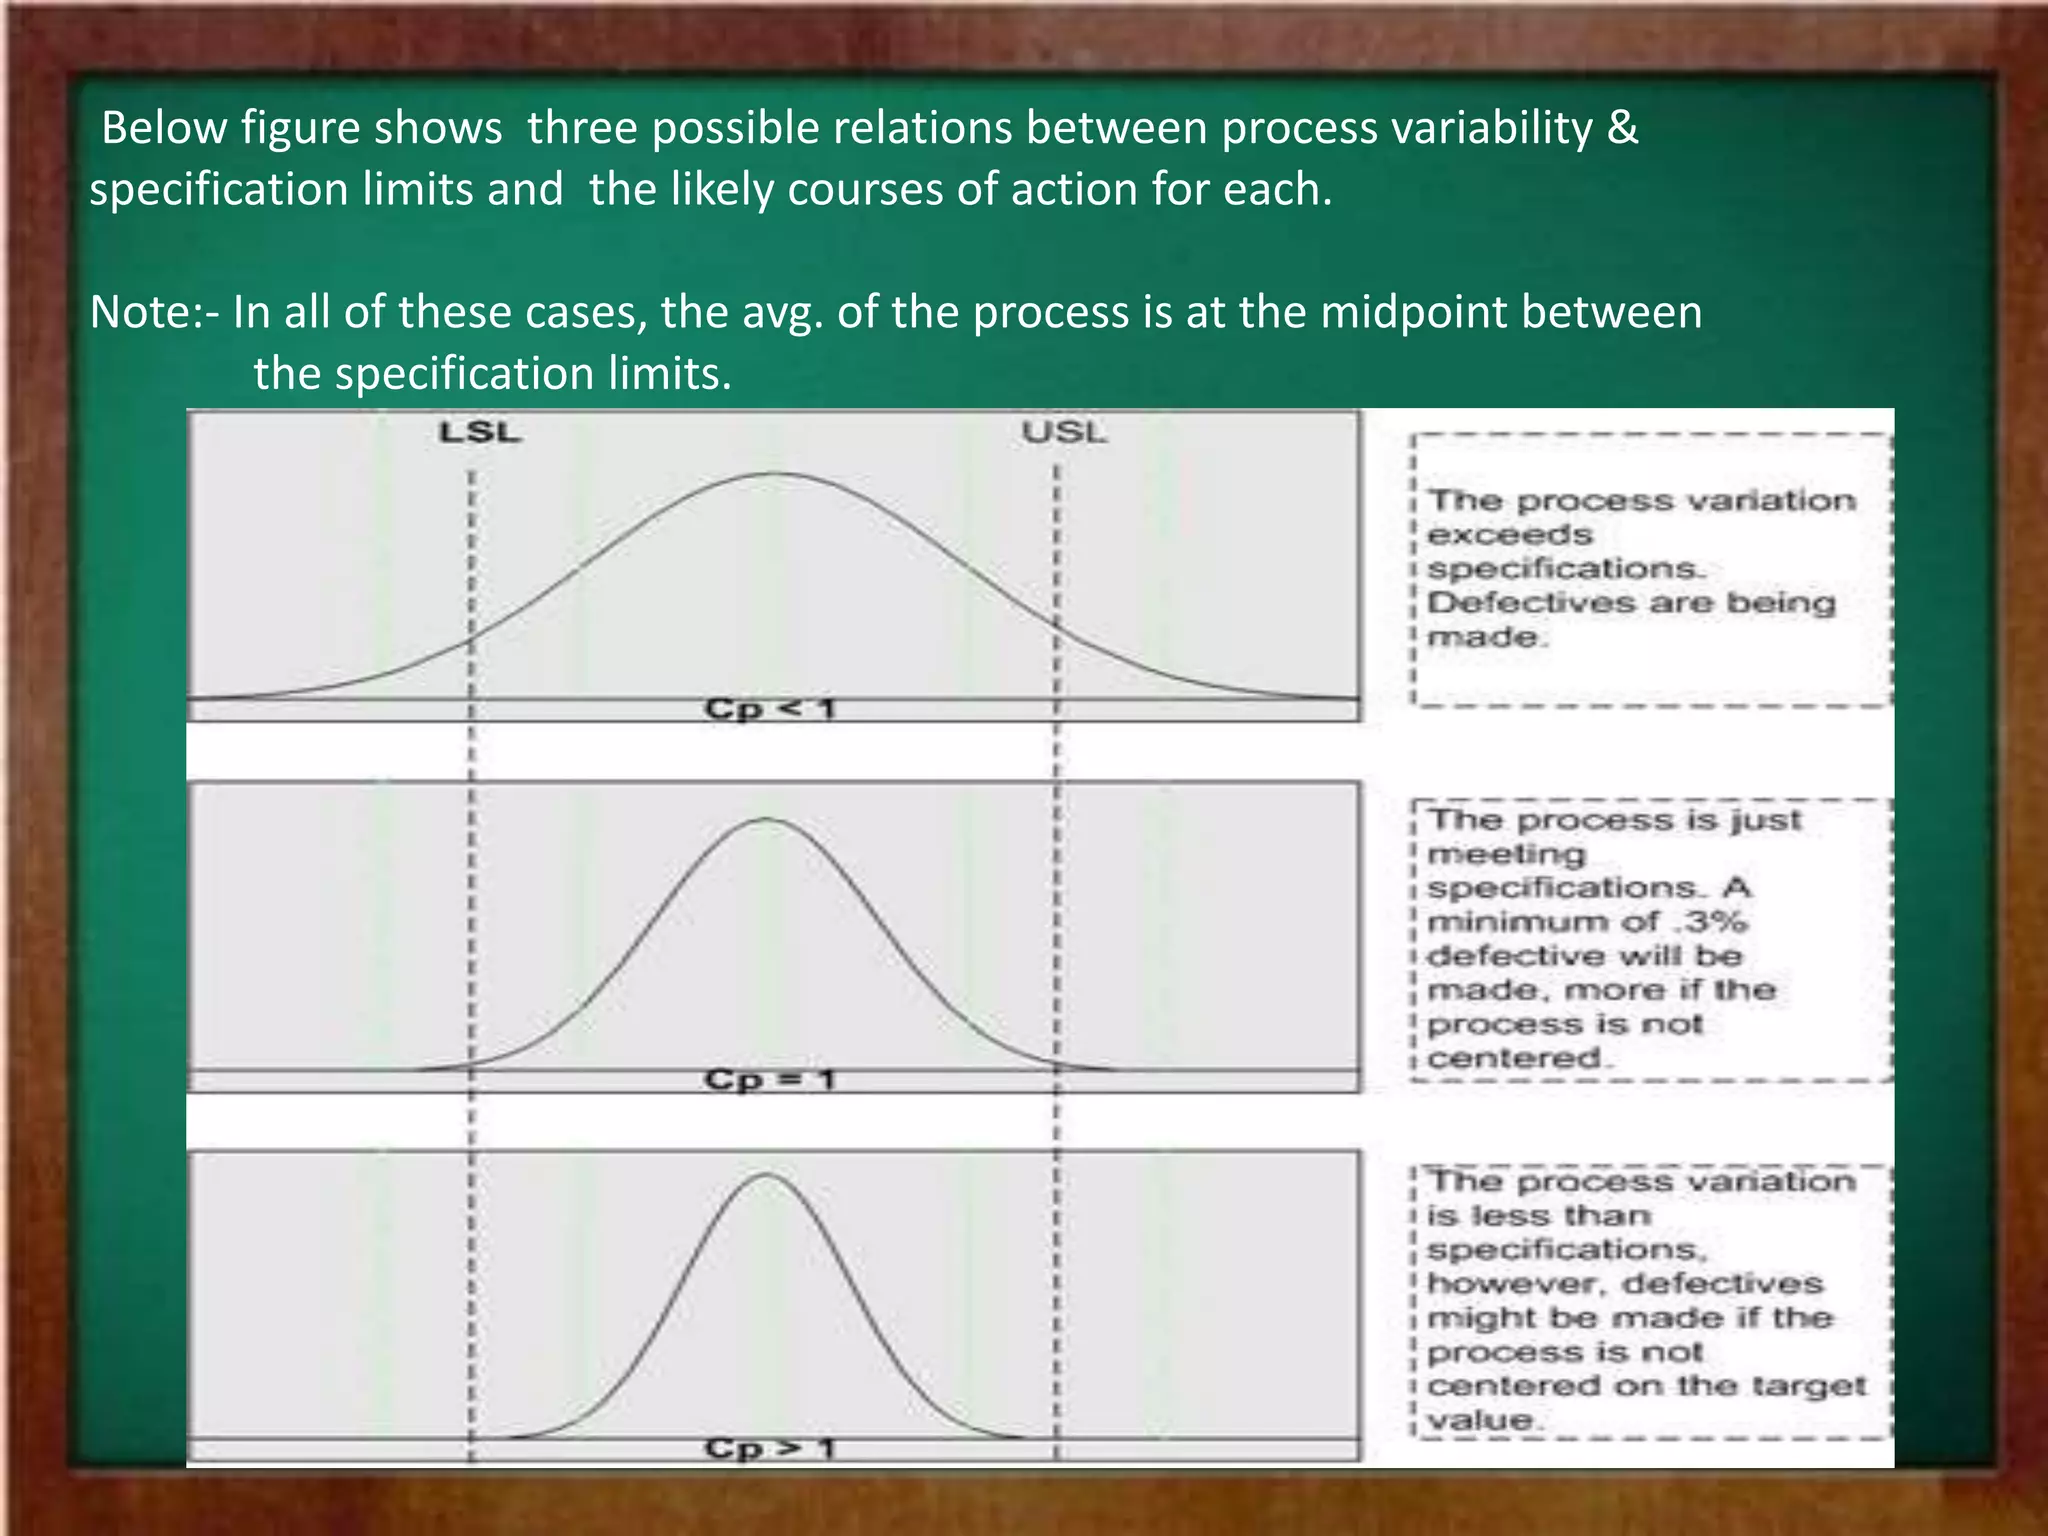
The document discusses process capability and defines key terms related to process capability. It provides the standard formula for process capability using 6 sigma and explains how process capability is compared to specification limits. It then discusses different process capability indices including Cp, Cpk, and Cpm. It explains how these indices measure both potential and actual process capability. The document also discusses limitations of the Cp index and the use of Cpk to address process centering. It describes how to calculate confidence intervals for process capability ratios and discusses some key process performance metrics.