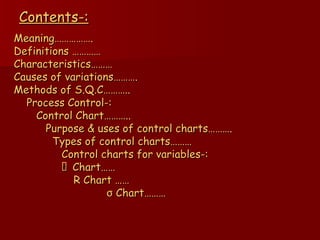
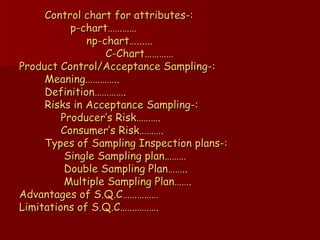
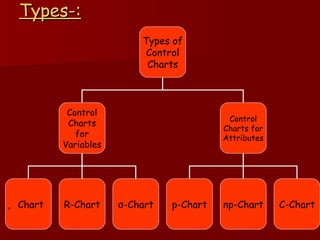
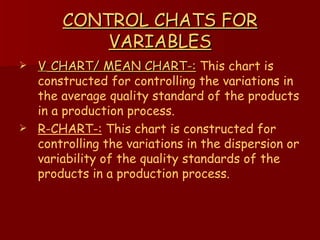
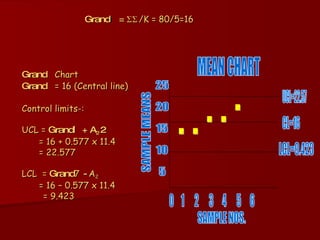
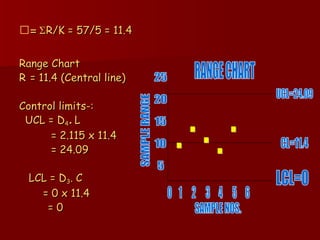
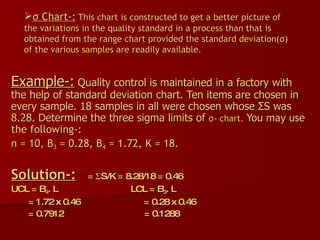
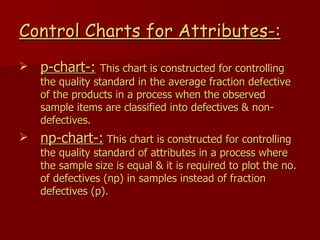
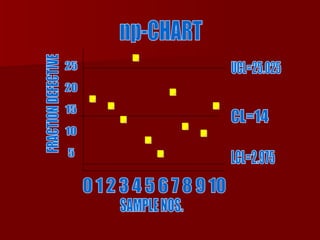
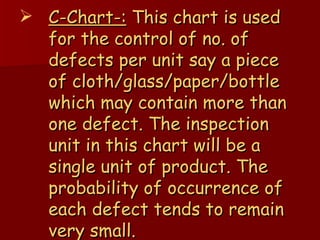
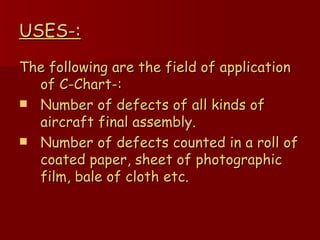
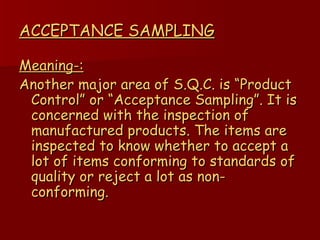
SlideShare a Scribd company logo
STATISTICAL    QUALITY   CONTROL   (S.Q.C.)   PRESENTED BY-:   NIKHIL GARG   ROLL NO- 0129626
Contents-: ,[object Object],[object Object],[object Object],[object Object],[object Object],[object Object],[object Object],[object Object],[object Object],[object Object],[object Object],[object Object],[object Object]
Control chart for attributes-:   p-chart…………   np-chart…......   C-Chart…………  Product Control/Acceptance Sampling-:   Meaning…………..   Definition………….   Risks in Acceptance Sampling-:   Producer’s Risk……….   Consumer’s Risk……….   Types of Sampling Inspection plans-:   Single Sampling plan………   Double Sampling Plan……..   Multiple Sampling Plan…….  Advantages of S.Q.C…………… Limitations of S.Q.C…………….
Acknowledgement-: ,[object Object]
MEANING-: ,[object Object],[object Object]
DEFINATION-: ,[object Object],[object Object],[object Object]
Definition-: ,[object Object],[object Object],[object Object]
CHARACTERISTICS OF S.Q.C.-: ,[object Object],[object Object],[object Object],[object Object]
CAUSES OF VARIATIONS IN QUALITY-: ,[object Object],[object Object]
METHODS OF S.Q.C.-: ,[object Object],[object Object]
Control Chart A  control chart   is a time plot of a statistic, such as a sample mean, range, standard deviation, or proportion, with a center line and  upper and lower   control limits .  The limits give the desired range of values for the statistic.  When the statistic is outside the bounds, or when its time plot reveals certain patterns, the process may be out of control. A process is considered in  statistical control  if it has no assignable causes, only natural variation. UCL LCL Center Line Time Value This point is out of the control limits 3  3 
PURPOSE & USES OF CONTROL CHARTS ,[object Object],[object Object],[object Object],[object Object],[object Object]
Types-: Types of Control Charts Control Charts for Variables    Chart Control Charts for Attributes R-Chart σ -Chart p-Chart np-Chart C-Chart
CONTROL CHATS FOR VARIABLES ,[object Object],[object Object]
EXAMPLE-: ,[object Object],[object Object],[object Object],[object Object],[object Object],[object Object],1 2 3 4 5 Weights Sample  No.
Solution-: 10 14 11 8 14 Σ R=57 14 14 16 16 20 Σ     =80 70 70 80 80 100 ,[object Object],[object Object],[object Object],[object Object],[object Object],1 2 3 4 5 K=5 Range R=(L-S)    =( Σ X/5) Total Weights ( Σ X) Weights (X) Sample no.
Grand   =  Σ  /K = 80/5=16   Grand   Chart  Grand   = 16 (Central line)   Control limits-:  UCL =  Grand + A 2    = 16 + 0.577 x 11.4  = 22.577  LCL  =  Grand -  A 2     = 16 – 0.577 x 11.4   = 9.423  UCL=22.57 CL=16 LCL=9.423 0  1  2  3  4  5  6 25 20 15 10 5 MEAN CHART . . . . . SAMPLE MEANS SAMPLE NOS.
  =  Σ R/K = 57/5 = 11.4 ,[object Object],[object Object],[object Object],[object Object],[object Object],[object Object],[object Object],[object Object],[object Object],UCL=24.09 CL=11.4 LCL=0 0  1  2  3  4  5  6 25 20 15 10 5 RANGE CHART . . . . . SAMPLE RANGE SAMPLE NOS.
[object Object],Example-:  Quality control is maintained in a factory with the help of standard deviation chart. Ten items are chosen in every sample. 18 samples in all were chosen whose  Σ S was 8.28. Determine the three sigma limits of  σ - chart.  You may use the following-:  n = 10, B 3  = 0.28, B 4  = 1.72, K = 18. Solution-:    =  Σ S/K = 8.28/18 = 0.46 UCL = B 4 .   LCL = B 3 .  = 1.72 x 0.46  = 0.28 x 0.46 = 0.7912  = 0.1288
Control Charts for Attributes-: ,[object Object],[object Object]
Example-: Σ d = 60 K = 10 0.05 0.03 0.03 0.06 0.05 0.06 0.08 0.1 0.1 0.04 5 3 3 6 5 6 8 10 10 4 100 100 100 100 100 100 100 100 100 100 1 2 3 4 5 6 7 8 9 10 Fraction defectives (d/n) No. of defectives (d) Size of sample (n) Sample No.
  =  Total no. of defectives/Total no. of units = 60/1000 = 0.06 »q ̅   = 1-    = 1- 0.06 = 0.94     = 0.06 (central line) UCL =   + 3 √  . q ̅ /n   = 0.06 + 3√0.06x0.94/100   = 0.1311 LCL =    - 3   √  . q ̅/n   = 0.06 - 3   √  0.06x0.94/100   = -0.0111 = 0
UCL=0.1311 CL=0.06 LCL=0 0 1 2 3 4 5 6 7 8 9 10 .16 .12 .08 .04 p-CHART . . . . . FRACTION DEFECTIVE SAMPLE NOS. . . . . .
Example-: ,[object Object],[object Object],[object Object],[object Object],[object Object],[object Object],[object Object],[object Object],[object Object],[object Object],[object Object]
UCL=25.025 CL=14 LCL=2.975 0 1 2 3 4 5 6 7 8 9 10 25 20 15 10 5 np-CHART . . . . . FRACTION DEFECTIVE SAMPLE NOS. . . . . .
[object Object]
USES-: ,[object Object],[object Object],[object Object]
ACCEPTANCE SAMPLING ,[object Object],[object Object]
DEFINATION-: ,[object Object],[object Object],[object Object]
Risks in Acceptance sampling ,[object Object],[object Object]
Types of Sampling Inspection Plan ,[object Object]
Single Sampling Plan Count the no. of defectives,  ‘ d’ in the sample of size ‘n’ Is ‘d’ ≤ ‘c’ If yes, than accept the lot If no, then reject the lot
Double Sampling Plan-: ,[object Object]
Double Sampling Plan-: Count the no. of defectives, d 1 in the first sample of size n 1 Is d 1  ≤ c 1  ? Draw another sample of size n 2 If No, then check  If c 1  ≤ d 1  ≥ c 2  ? Count the no. of defectives d 2  in this sample Is d 1  + d 2  ≤ c 2 If No, reject the lot If yes, accept the lot If yes, then accept the lot.
Multiple Sampling Plan-: ,[object Object]
ADVANTAGES OF S.Q.C.-: ,[object Object],[object Object],[object Object],[object Object],[object Object],[object Object]
LIMITATIONS-: ,[object Object],[object Object],[object Object],[object Object]
THE   END

More Related Content

What's hot

Control charts in statistical quality control
Control charts in statistical quality controlControl charts in statistical quality control
Control charts in statistical quality control
rakheechhibber1971
 
Control charts
Control chartsControl charts
Control charts
Sutha Vincent
 
X bar and R control charts
X bar and R control chartsX bar and R control charts
X bar and R control charts
Dhruv Shah
 
Statistical quality control
Statistical quality controlStatistical quality control
Statistical quality control
Suresh Thengumpallil
 
Statistical quality control
Statistical quality controlStatistical quality control
Statistical quality control
Sai Datri Arige
 
Statistical Quality Control.
Statistical Quality Control.Statistical Quality Control.
Statistical Quality Control.
Raviraj Jadeja
 
Statistical Quality Control
Statistical Quality ControlStatistical Quality Control
Statistical Quality ControlDr. Rana Singh
 
Control charts for variables
Control charts for variables Control charts for variables
Control charts for variables
Dr. Mahmoud Al-Naimi
 
Control charts
Control chartsControl charts
Control charts
Sahul Hameed
 
Control charts (p np c u)
Control charts (p np c u)Control charts (p np c u)
Control charts (p np c u)
Vipul Wadhwa
 
Control charts
Control chartsControl charts
Control charts
rashmi_awal
 
Taguchi loss function
Taguchi loss functionTaguchi loss function
Taguchi loss function
nithyanithi26
 
Statistical quality control
Statistical quality controlStatistical quality control
Statistical quality controlAnubhav Grover
 
Quality Control Tools And Techniques PowerPoint Presentation Slides
Quality Control Tools And Techniques PowerPoint Presentation Slides Quality Control Tools And Techniques PowerPoint Presentation Slides
Quality Control Tools And Techniques PowerPoint Presentation Slides
SlideTeam
 
Operating characteristics curve
Operating characteristics curveOperating characteristics curve
Operating characteristics curve
Chintan Trivedi
 
Indifference Curves
Indifference CurvesIndifference Curves
Indifference Curves
tutor2u
 
Quality Function Deployment
Quality Function DeploymentQuality Function Deployment
Quality Function Deployment
mmarleanne
 
Process capability
Process capabilityProcess capability
Process capability
padam nagar
 
X‾ and r charts
X‾ and r chartsX‾ and r charts
X‾ and r charts
Akhil Krishnan G
 
Quality Control Chart
 Quality Control Chart Quality Control Chart
Quality Control Chart
Ashish Gupta
 

What's hot (20)

Control charts in statistical quality control
Control charts in statistical quality controlControl charts in statistical quality control
Control charts in statistical quality control
 
Control charts
Control chartsControl charts
Control charts
 
X bar and R control charts
X bar and R control chartsX bar and R control charts
X bar and R control charts
 
Statistical quality control
Statistical quality controlStatistical quality control
Statistical quality control
 
Statistical quality control
Statistical quality controlStatistical quality control
Statistical quality control
 
Statistical Quality Control.
Statistical Quality Control.Statistical Quality Control.
Statistical Quality Control.
 
Statistical Quality Control
Statistical Quality ControlStatistical Quality Control
Statistical Quality Control
 
Control charts for variables
Control charts for variables Control charts for variables
Control charts for variables
 
Control charts
Control chartsControl charts
Control charts
 
Control charts (p np c u)
Control charts (p np c u)Control charts (p np c u)
Control charts (p np c u)
 
Control charts
Control chartsControl charts
Control charts
 
Taguchi loss function
Taguchi loss functionTaguchi loss function
Taguchi loss function
 
Statistical quality control
Statistical quality controlStatistical quality control
Statistical quality control
 
Quality Control Tools And Techniques PowerPoint Presentation Slides
Quality Control Tools And Techniques PowerPoint Presentation Slides Quality Control Tools And Techniques PowerPoint Presentation Slides
Quality Control Tools And Techniques PowerPoint Presentation Slides
 
Operating characteristics curve
Operating characteristics curveOperating characteristics curve
Operating characteristics curve
 
Indifference Curves
Indifference CurvesIndifference Curves
Indifference Curves
 
Quality Function Deployment
Quality Function DeploymentQuality Function Deployment
Quality Function Deployment
 
Process capability
Process capabilityProcess capability
Process capability
 
X‾ and r charts
X‾ and r chartsX‾ and r charts
X‾ and r charts
 
Quality Control Chart
 Quality Control Chart Quality Control Chart
Quality Control Chart
 

Similar to Ppt On S.Q.C.

control charts to enhance your problem solving abilities
control charts to enhance your problem solving abilitiescontrol charts to enhance your problem solving abilities
control charts to enhance your problem solving abilities
INSTITUTE OF ENGINEERING /BKC
 
STATISTICAL QUALITY CONTROL- QUALITY ASSURANCE
STATISTICAL QUALITY CONTROL- QUALITY ASSURANCE STATISTICAL QUALITY CONTROL- QUALITY ASSURANCE
STATISTICAL QUALITY CONTROL- QUALITY ASSURANCE
Dr Duggirala Mahendra
 
statistical quality control
statistical quality controlstatistical quality control
statistical quality control
Vicky Raj
 
Production & Operation Management Chapter9[1]
Production & Operation Management Chapter9[1]Production & Operation Management Chapter9[1]
Production & Operation Management Chapter9[1]
Hariharan Ponnusamy
 
Statisticalqualitycontrol
StatisticalqualitycontrolStatisticalqualitycontrol
Statisticalqualitycontrolceutics1315
 
Statistical process control ppt @ doms
Statistical process control ppt @ doms Statistical process control ppt @ doms
Statistical process control ppt @ doms
Babasab Patil
 
Statistical Process Control
Statistical Process ControlStatistical Process Control
Statistical Process Control
NAVEENBANSHIWAL
 
Chap 9 A Process Capability & Spc Hk
Chap 9 A Process Capability & Spc HkChap 9 A Process Capability & Spc Hk
Chap 9 A Process Capability & Spc Hkajithsrc
 
6 statistical quality control
6   statistical quality control6   statistical quality control
6 statistical quality control
Ijan Rahman Ode
 
Facility Location
Facility Location Facility Location
Facility Location
Joshua Miranda
 
Statistics
StatisticsStatistics
Statistics
sangeeta saini
 
control charts
control chartscontrol charts
control charts
Geetu Saini
 
Final notes on s1 qc
Final notes on s1 qcFinal notes on s1 qc
Final notes on s1 qc
Shashank Srivastava
 
Final notes on s1 qc
Final notes on s1 qcFinal notes on s1 qc
Final notes on s1 qc
Shashank Srivastava
 
Statistical process control ppt @ bec doms
Statistical process control ppt @ bec domsStatistical process control ppt @ bec doms
Statistical process control ppt @ bec doms
Babasab Patil
 
14. Statistical Process Control.pptx
14. Statistical Process Control.pptx14. Statistical Process Control.pptx
14. Statistical Process Control.pptx
SarthakGupta856447
 
C chart
C chartC chart

Similar to Ppt On S.Q.C. (20)

control charts to enhance your problem solving abilities
control charts to enhance your problem solving abilitiescontrol charts to enhance your problem solving abilities
control charts to enhance your problem solving abilities
 
STATISTICAL QUALITY CONTROL- QUALITY ASSURANCE
STATISTICAL QUALITY CONTROL- QUALITY ASSURANCE STATISTICAL QUALITY CONTROL- QUALITY ASSURANCE
STATISTICAL QUALITY CONTROL- QUALITY ASSURANCE
 
statistical quality control
statistical quality controlstatistical quality control
statistical quality control
 
Ch04
Ch04Ch04
Ch04
 
Production & Operation Management Chapter9[1]
Production & Operation Management Chapter9[1]Production & Operation Management Chapter9[1]
Production & Operation Management Chapter9[1]
 
Chapter9[1]
Chapter9[1]Chapter9[1]
Chapter9[1]
 
Statisticalqualitycontrol
StatisticalqualitycontrolStatisticalqualitycontrol
Statisticalqualitycontrol
 
Statisticalqualitycontrol
StatisticalqualitycontrolStatisticalqualitycontrol
Statisticalqualitycontrol
 
Statistical process control ppt @ doms
Statistical process control ppt @ doms Statistical process control ppt @ doms
Statistical process control ppt @ doms
 
Statistical Process Control
Statistical Process ControlStatistical Process Control
Statistical Process Control
 
Chap 9 A Process Capability & Spc Hk
Chap 9 A Process Capability & Spc HkChap 9 A Process Capability & Spc Hk
Chap 9 A Process Capability & Spc Hk
 
6 statistical quality control
6   statistical quality control6   statistical quality control
6 statistical quality control
 
Facility Location
Facility Location Facility Location
Facility Location
 
Statistics
StatisticsStatistics
Statistics
 
control charts
control chartscontrol charts
control charts
 
Final notes on s1 qc
Final notes on s1 qcFinal notes on s1 qc
Final notes on s1 qc
 
Final notes on s1 qc
Final notes on s1 qcFinal notes on s1 qc
Final notes on s1 qc
 
Statistical process control ppt @ bec doms
Statistical process control ppt @ bec domsStatistical process control ppt @ bec doms
Statistical process control ppt @ bec doms
 
14. Statistical Process Control.pptx
14. Statistical Process Control.pptx14. Statistical Process Control.pptx
14. Statistical Process Control.pptx
 
C chart
C chartC chart
C chart
 

Recently uploaded

Global Interconnection Group Joint Venture[960] (1).pdf
Global Interconnection Group Joint Venture[960] (1).pdfGlobal Interconnection Group Joint Venture[960] (1).pdf
Global Interconnection Group Joint Venture[960] (1).pdf
Henry Tapper
 
Attending a job Interview for B1 and B2 Englsih learners
Attending a job Interview for B1 and B2 Englsih learnersAttending a job Interview for B1 and B2 Englsih learners
Attending a job Interview for B1 and B2 Englsih learners
Erika906060
 
Accpac to QuickBooks Conversion Navigating the Transition with Online Account...
Accpac to QuickBooks Conversion Navigating the Transition with Online Account...Accpac to QuickBooks Conversion Navigating the Transition with Online Account...
Accpac to QuickBooks Conversion Navigating the Transition with Online Account...
PaulBryant58
 
Memorandum Of Association Constitution of Company.ppt
Memorandum Of Association Constitution of Company.pptMemorandum Of Association Constitution of Company.ppt
Memorandum Of Association Constitution of Company.ppt
seri bangash
 
FINAL PRESENTATION.pptx12143241324134134
FINAL PRESENTATION.pptx12143241324134134FINAL PRESENTATION.pptx12143241324134134
FINAL PRESENTATION.pptx12143241324134134
LR1709MUSIC
 
Sustainability: Balancing the Environment, Equity & Economy
Sustainability: Balancing the Environment, Equity & EconomySustainability: Balancing the Environment, Equity & Economy
Sustainability: Balancing the Environment, Equity & Economy
Operational Excellence Consulting
 
falcon-invoice-discounting-a-premier-platform-for-investors-in-india
falcon-invoice-discounting-a-premier-platform-for-investors-in-indiafalcon-invoice-discounting-a-premier-platform-for-investors-in-india
falcon-invoice-discounting-a-premier-platform-for-investors-in-india
Falcon Invoice Discounting
 
Cree_Rey_BrandIdentityKit.PDF_PersonalBd
Cree_Rey_BrandIdentityKit.PDF_PersonalBdCree_Rey_BrandIdentityKit.PDF_PersonalBd
Cree_Rey_BrandIdentityKit.PDF_PersonalBd
creerey
 
Improving profitability for small business
Improving profitability for small businessImproving profitability for small business
Improving profitability for small business
Ben Wann
 
Skye Residences | Extended Stay Residences Near Toronto Airport
Skye Residences | Extended Stay Residences Near Toronto AirportSkye Residences | Extended Stay Residences Near Toronto Airport
Skye Residences | Extended Stay Residences Near Toronto Airport
marketingjdass
 
April 2024 Nostalgia Products Newsletter
April 2024 Nostalgia Products NewsletterApril 2024 Nostalgia Products Newsletter
April 2024 Nostalgia Products Newsletter
NathanBaughman3
 
Enterprise Excellence is Inclusive Excellence.pdf
Enterprise Excellence is Inclusive Excellence.pdfEnterprise Excellence is Inclusive Excellence.pdf
Enterprise Excellence is Inclusive Excellence.pdf
KaiNexus
 
Introduction to Amazon company 111111111111
Introduction to Amazon company 111111111111Introduction to Amazon company 111111111111
Introduction to Amazon company 111111111111
zoyaansari11365
 
Search Disrupted Google’s Leaked Documents Rock the SEO World.pdf
Search Disrupted Google’s Leaked Documents Rock the SEO World.pdfSearch Disrupted Google’s Leaked Documents Rock the SEO World.pdf
Search Disrupted Google’s Leaked Documents Rock the SEO World.pdf
Arihant Webtech Pvt. Ltd
 
Cracking the Workplace Discipline Code Main.pptx
Cracking the Workplace Discipline Code Main.pptxCracking the Workplace Discipline Code Main.pptx
Cracking the Workplace Discipline Code Main.pptx
Workforce Group
 
Premium MEAN Stack Development Solutions for Modern Businesses
Premium MEAN Stack Development Solutions for Modern BusinessesPremium MEAN Stack Development Solutions for Modern Businesses
Premium MEAN Stack Development Solutions for Modern Businesses
SynapseIndia
 
20240425_ TJ Communications Credentials_compressed.pdf
20240425_ TJ Communications Credentials_compressed.pdf20240425_ TJ Communications Credentials_compressed.pdf
20240425_ TJ Communications Credentials_compressed.pdf
tjcomstrang
 
Taurus Zodiac Sign_ Personality Traits and Sign Dates.pptx
Taurus Zodiac Sign_ Personality Traits and Sign Dates.pptxTaurus Zodiac Sign_ Personality Traits and Sign Dates.pptx
Taurus Zodiac Sign_ Personality Traits and Sign Dates.pptx
my Pandit
 
Meas_Dylan_DMBS_PB1_2024-05XX_Revised.pdf
Meas_Dylan_DMBS_PB1_2024-05XX_Revised.pdfMeas_Dylan_DMBS_PB1_2024-05XX_Revised.pdf
Meas_Dylan_DMBS_PB1_2024-05XX_Revised.pdf
dylandmeas
 
chapter 10 - excise tax of transfer and business taxation
chapter 10 - excise tax of transfer and business taxationchapter 10 - excise tax of transfer and business taxation
chapter 10 - excise tax of transfer and business taxation
AUDIJEAngelo
 

Recently uploaded (20)

Global Interconnection Group Joint Venture[960] (1).pdf
Global Interconnection Group Joint Venture[960] (1).pdfGlobal Interconnection Group Joint Venture[960] (1).pdf
Global Interconnection Group Joint Venture[960] (1).pdf
 
Attending a job Interview for B1 and B2 Englsih learners
Attending a job Interview for B1 and B2 Englsih learnersAttending a job Interview for B1 and B2 Englsih learners
Attending a job Interview for B1 and B2 Englsih learners
 
Accpac to QuickBooks Conversion Navigating the Transition with Online Account...
Accpac to QuickBooks Conversion Navigating the Transition with Online Account...Accpac to QuickBooks Conversion Navigating the Transition with Online Account...
Accpac to QuickBooks Conversion Navigating the Transition with Online Account...
 
Memorandum Of Association Constitution of Company.ppt
Memorandum Of Association Constitution of Company.pptMemorandum Of Association Constitution of Company.ppt
Memorandum Of Association Constitution of Company.ppt
 
FINAL PRESENTATION.pptx12143241324134134
FINAL PRESENTATION.pptx12143241324134134FINAL PRESENTATION.pptx12143241324134134
FINAL PRESENTATION.pptx12143241324134134
 
Sustainability: Balancing the Environment, Equity & Economy
Sustainability: Balancing the Environment, Equity & EconomySustainability: Balancing the Environment, Equity & Economy
Sustainability: Balancing the Environment, Equity & Economy
 
falcon-invoice-discounting-a-premier-platform-for-investors-in-india
falcon-invoice-discounting-a-premier-platform-for-investors-in-indiafalcon-invoice-discounting-a-premier-platform-for-investors-in-india
falcon-invoice-discounting-a-premier-platform-for-investors-in-india
 
Cree_Rey_BrandIdentityKit.PDF_PersonalBd
Cree_Rey_BrandIdentityKit.PDF_PersonalBdCree_Rey_BrandIdentityKit.PDF_PersonalBd
Cree_Rey_BrandIdentityKit.PDF_PersonalBd
 
Improving profitability for small business
Improving profitability for small businessImproving profitability for small business
Improving profitability for small business
 
Skye Residences | Extended Stay Residences Near Toronto Airport
Skye Residences | Extended Stay Residences Near Toronto AirportSkye Residences | Extended Stay Residences Near Toronto Airport
Skye Residences | Extended Stay Residences Near Toronto Airport
 
April 2024 Nostalgia Products Newsletter
April 2024 Nostalgia Products NewsletterApril 2024 Nostalgia Products Newsletter
April 2024 Nostalgia Products Newsletter
 
Enterprise Excellence is Inclusive Excellence.pdf
Enterprise Excellence is Inclusive Excellence.pdfEnterprise Excellence is Inclusive Excellence.pdf
Enterprise Excellence is Inclusive Excellence.pdf
 
Introduction to Amazon company 111111111111
Introduction to Amazon company 111111111111Introduction to Amazon company 111111111111
Introduction to Amazon company 111111111111
 
Search Disrupted Google’s Leaked Documents Rock the SEO World.pdf
Search Disrupted Google’s Leaked Documents Rock the SEO World.pdfSearch Disrupted Google’s Leaked Documents Rock the SEO World.pdf
Search Disrupted Google’s Leaked Documents Rock the SEO World.pdf
 
Cracking the Workplace Discipline Code Main.pptx
Cracking the Workplace Discipline Code Main.pptxCracking the Workplace Discipline Code Main.pptx
Cracking the Workplace Discipline Code Main.pptx
 
Premium MEAN Stack Development Solutions for Modern Businesses
Premium MEAN Stack Development Solutions for Modern BusinessesPremium MEAN Stack Development Solutions for Modern Businesses
Premium MEAN Stack Development Solutions for Modern Businesses
 
20240425_ TJ Communications Credentials_compressed.pdf
20240425_ TJ Communications Credentials_compressed.pdf20240425_ TJ Communications Credentials_compressed.pdf
20240425_ TJ Communications Credentials_compressed.pdf
 
Taurus Zodiac Sign_ Personality Traits and Sign Dates.pptx
Taurus Zodiac Sign_ Personality Traits and Sign Dates.pptxTaurus Zodiac Sign_ Personality Traits and Sign Dates.pptx
Taurus Zodiac Sign_ Personality Traits and Sign Dates.pptx
 
Meas_Dylan_DMBS_PB1_2024-05XX_Revised.pdf
Meas_Dylan_DMBS_PB1_2024-05XX_Revised.pdfMeas_Dylan_DMBS_PB1_2024-05XX_Revised.pdf
Meas_Dylan_DMBS_PB1_2024-05XX_Revised.pdf
 
chapter 10 - excise tax of transfer and business taxation
chapter 10 - excise tax of transfer and business taxationchapter 10 - excise tax of transfer and business taxation
chapter 10 - excise tax of transfer and business taxation
 

Ppt On S.Q.C.

  • 1. STATISTICAL QUALITY CONTROL (S.Q.C.) PRESENTED BY-: NIKHIL GARG ROLL NO- 0129626
  • 2.
  • 3. Control chart for attributes-: p-chart………… np-chart…...... C-Chart………… Product Control/Acceptance Sampling-: Meaning………….. Definition…………. Risks in Acceptance Sampling-: Producer’s Risk………. Consumer’s Risk………. Types of Sampling Inspection plans-: Single Sampling plan……… Double Sampling Plan…….. Multiple Sampling Plan……. Advantages of S.Q.C…………… Limitations of S.Q.C…………….
  • 4.
  • 5.
  • 6.
  • 7.
  • 8.
  • 9.
  • 10.
  • 11. Control Chart A control chart is a time plot of a statistic, such as a sample mean, range, standard deviation, or proportion, with a center line and upper and lower control limits . The limits give the desired range of values for the statistic. When the statistic is outside the bounds, or when its time plot reveals certain patterns, the process may be out of control. A process is considered in statistical control if it has no assignable causes, only natural variation. UCL LCL Center Line Time Value This point is out of the control limits 3  3 
  • 12.
  • 13. Types-: Types of Control Charts Control Charts for Variables  Chart Control Charts for Attributes R-Chart σ -Chart p-Chart np-Chart C-Chart
  • 14.
  • 15.
  • 16.
  • 17. Grand = Σ  /K = 80/5=16 Grand Chart Grand = 16 (Central line) Control limits-: UCL = Grand + A 2  = 16 + 0.577 x 11.4 = 22.577 LCL = Grand - A 2  = 16 – 0.577 x 11.4 = 9.423 UCL=22.57 CL=16 LCL=9.423 0 1 2 3 4 5 6 25 20 15 10 5 MEAN CHART . . . . . SAMPLE MEANS SAMPLE NOS.
  • 18.
  • 19.
  • 20.
  • 21. Example-: Σ d = 60 K = 10 0.05 0.03 0.03 0.06 0.05 0.06 0.08 0.1 0.1 0.04 5 3 3 6 5 6 8 10 10 4 100 100 100 100 100 100 100 100 100 100 1 2 3 4 5 6 7 8 9 10 Fraction defectives (d/n) No. of defectives (d) Size of sample (n) Sample No.
  • 22.  = Total no. of defectives/Total no. of units = 60/1000 = 0.06 »q ̅ = 1-  = 1- 0.06 = 0.94  = 0.06 (central line) UCL =  + 3 √ . q ̅ /n = 0.06 + 3√0.06x0.94/100 = 0.1311 LCL =  - 3 √ . q ̅/n = 0.06 - 3 √ 0.06x0.94/100 = -0.0111 = 0
  • 23. UCL=0.1311 CL=0.06 LCL=0 0 1 2 3 4 5 6 7 8 9 10 .16 .12 .08 .04 p-CHART . . . . . FRACTION DEFECTIVE SAMPLE NOS. . . . . .
  • 24.
  • 25. UCL=25.025 CL=14 LCL=2.975 0 1 2 3 4 5 6 7 8 9 10 25 20 15 10 5 np-CHART . . . . . FRACTION DEFECTIVE SAMPLE NOS. . . . . .
  • 26.
  • 27.
  • 28.
  • 29.
  • 30.
  • 31.
  • 32. Single Sampling Plan Count the no. of defectives, ‘ d’ in the sample of size ‘n’ Is ‘d’ ≤ ‘c’ If yes, than accept the lot If no, then reject the lot
  • 33.
  • 34. Double Sampling Plan-: Count the no. of defectives, d 1 in the first sample of size n 1 Is d 1 ≤ c 1 ? Draw another sample of size n 2 If No, then check If c 1 ≤ d 1 ≥ c 2 ? Count the no. of defectives d 2 in this sample Is d 1 + d 2 ≤ c 2 If No, reject the lot If yes, accept the lot If yes, then accept the lot.
  • 35.
  • 36.
  • 37.
  • 38. THE END