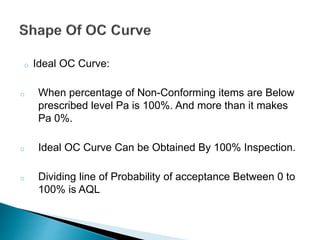
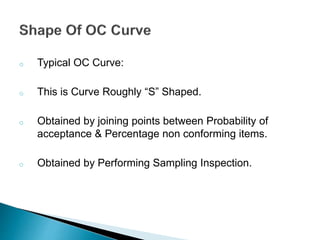
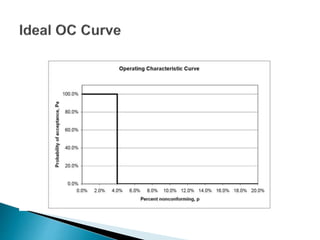
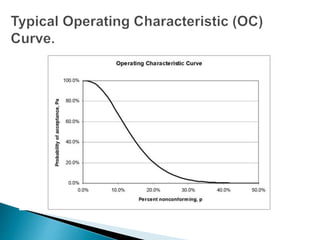
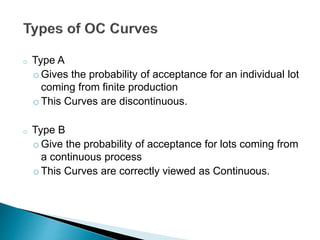
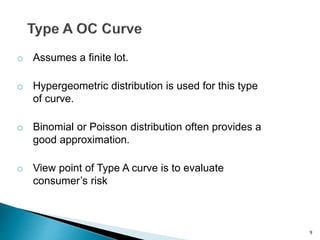
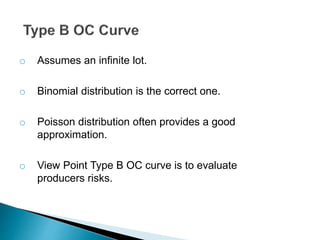
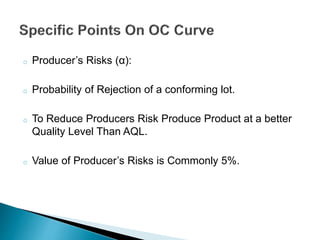
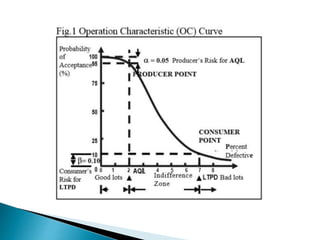
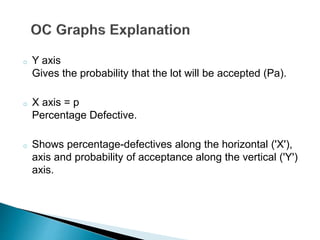
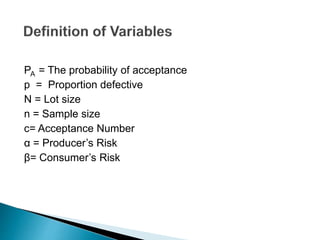
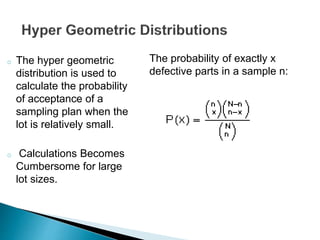
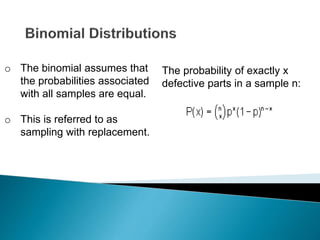
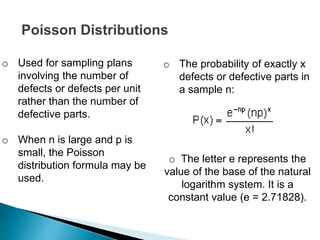
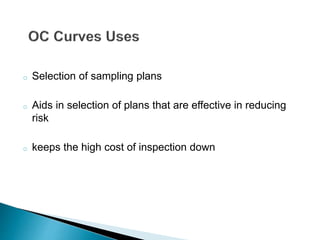
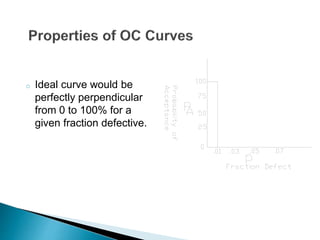
This document discusses operational characteristic (OC) curves, which are graphs used in quality control to determine the probability that a production lot will be accepted based on the percentage of non-conforming items found during sampling inspections. The key points covered include:
- The components of an OC curve including probability of acceptance (Pa) on the y-axis and percentage of defective items (p) on the x-axis.
- The different types of OC curves (A and B) which depend on whether the lot size is finite or infinite.
- Important points on the curve including the acceptable quality level (AQL) and rejectable quality level (RQL).
- The probability distributions used to model different sampling plans
Production Planning and Control
Objective of PPC
Classification/Functions of PPC
Levels of PPC
Factors determining Production Planning Procedures
Production Planning System
Factors Determining PC procedures
Production Planning and Control
Objective of PPC
Classification/Functions of PPC
Levels of PPC
Factors determining Production Planning Procedures
Production Planning System
Factors Determining PC procedures
Undertand requirements of normality in ANSI/ASQ Z1.9 and how that affects analysis of meter test data.
Review typical meter test data distributors and how to determine if meter test data is normal
Introduction to working with non-normal data
Industrial Training at Shahjalal Fertilizer Company Limited (SFCL)MdTanvirMahtab2
This presentation is about the working procedure of Shahjalal Fertilizer Company Limited (SFCL). A Govt. owned Company of Bangladesh Chemical Industries Corporation under Ministry of Industries.
About
Indigenized remote control interface card suitable for MAFI system CCR equipment. Compatible for IDM8000 CCR. Backplane mounted serial and TCP/Ethernet communication module for CCR remote access. IDM 8000 CCR remote control on serial and TCP protocol.
• Remote control: Parallel or serial interface.
• Compatible with MAFI CCR system.
• Compatible with IDM8000 CCR.
• Compatible with Backplane mount serial communication.
• Compatible with commercial and Defence aviation CCR system.
• Remote control system for accessing CCR and allied system over serial or TCP.
• Indigenized local Support/presence in India.
• Easy in configuration using DIP switches.
Technical Specifications
Indigenized remote control interface card suitable for MAFI system CCR equipment. Compatible for IDM8000 CCR. Backplane mounted serial and TCP/Ethernet communication module for CCR remote access. IDM 8000 CCR remote control on serial and TCP protocol.
Key Features
Indigenized remote control interface card suitable for MAFI system CCR equipment. Compatible for IDM8000 CCR. Backplane mounted serial and TCP/Ethernet communication module for CCR remote access. IDM 8000 CCR remote control on serial and TCP protocol.
• Remote control: Parallel or serial interface
• Compatible with MAFI CCR system
• Copatiable with IDM8000 CCR
• Compatible with Backplane mount serial communication.
• Compatible with commercial and Defence aviation CCR system.
• Remote control system for accessing CCR and allied system over serial or TCP.
• Indigenized local Support/presence in India.
Application
• Remote control: Parallel or serial interface.
• Compatible with MAFI CCR system.
• Compatible with IDM8000 CCR.
• Compatible with Backplane mount serial communication.
• Compatible with commercial and Defence aviation CCR system.
• Remote control system for accessing CCR and allied system over serial or TCP.
• Indigenized local Support/presence in India.
• Easy in configuration using DIP switches.
Cosmetic shop management system project report.pdfKamal Acharya
Buying new cosmetic products is difficult. It can even be scary for those who have sensitive skin and are prone to skin trouble. The information needed to alleviate this problem is on the back of each product, but it's thought to interpret those ingredient lists unless you have a background in chemistry.
Instead of buying and hoping for the best, we can use data science to help us predict which products may be good fits for us. It includes various function programs to do the above mentioned tasks.
Data file handling has been effectively used in the program.
The automated cosmetic shop management system should deal with the automation of general workflow and administration process of the shop. The main processes of the system focus on customer's request where the system is able to search the most appropriate products and deliver it to the customers. It should help the employees to quickly identify the list of cosmetic product that have reached the minimum quantity and also keep a track of expired date for each cosmetic product. It should help the employees to find the rack number in which the product is placed.It is also Faster and more efficient way.
Welcome to WIPAC Monthly the magazine brought to you by the LinkedIn Group Water Industry Process Automation & Control.
In this month's edition, along with this month's industry news to celebrate the 13 years since the group was created we have articles including
A case study of the used of Advanced Process Control at the Wastewater Treatment works at Lleida in Spain
A look back on an article on smart wastewater networks in order to see how the industry has measured up in the interim around the adoption of Digital Transformation in the Water Industry.
CFD Simulation of By-pass Flow in a HRSG module by R&R Consult.pptxR&R Consult
CFD analysis is incredibly effective at solving mysteries and improving the performance of complex systems!
Here's a great example: At a large natural gas-fired power plant, where they use waste heat to generate steam and energy, they were puzzled that their boiler wasn't producing as much steam as expected.
R&R and Tetra Engineering Group Inc. were asked to solve the issue with reduced steam production.
An inspection had shown that a significant amount of hot flue gas was bypassing the boiler tubes, where the heat was supposed to be transferred.
R&R Consult conducted a CFD analysis, which revealed that 6.3% of the flue gas was bypassing the boiler tubes without transferring heat. The analysis also showed that the flue gas was instead being directed along the sides of the boiler and between the modules that were supposed to capture the heat. This was the cause of the reduced performance.
Based on our results, Tetra Engineering installed covering plates to reduce the bypass flow. This improved the boiler's performance and increased electricity production.
It is always satisfying when we can help solve complex challenges like this. Do your systems also need a check-up or optimization? Give us a call!
Work done in cooperation with James Malloy and David Moelling from Tetra Engineering.
More examples of our work https://www.r-r-consult.dk/en/cases-en/
Sachpazis:Terzaghi Bearing Capacity Estimation in simple terms with Calculati...Dr.Costas Sachpazis
Terzaghi's soil bearing capacity theory, developed by Karl Terzaghi, is a fundamental principle in geotechnical engineering used to determine the bearing capacity of shallow foundations. This theory provides a method to calculate the ultimate bearing capacity of soil, which is the maximum load per unit area that the soil can support without undergoing shear failure. The Calculation HTML Code included.
Saudi Arabia stands as a titan in the global energy landscape, renowned for its abundant oil and gas resources. It's the largest exporter of petroleum and holds some of the world's most significant reserves. Let's delve into the top 10 oil and gas projects shaping Saudi Arabia's energy future in 2024.
Overview of the fundamental roles in Hydropower generation and the components involved in wider Electrical Engineering.
This paper presents the design and construction of hydroelectric dams from the hydrologist’s survey of the valley before construction, all aspects and involved disciplines, fluid dynamics, structural engineering, generation and mains frequency regulation to the very transmission of power through the network in the United Kingdom.
Author: Robbie Edward Sayers
Collaborators and co editors: Charlie Sims and Connor Healey.
(C) 2024 Robbie E. Sayers
2. o OC Curve?
o Shape of OC curve
o Types of OC curve
o Specific Points On OC Curve
o Probability Distributions used in OC Curve
o OC Curve Uses
o OC Curve Properties
3. o OC Curve was Developed along with SQC in 1930’s and
40’s.
o Graph used in quality control to determine the probability
of accepting production lots.
o Used in Discrimination of Sampling Plan Between Good
And Bad Lots.
o Measures Performance of Acceptance Sampling Plans.
4. o Ideal OC Curve:
o When percentage of Non-Conforming items are Below
prescribed level Pa is 100%. And more than it makes
Pa 0%.
o Ideal OC Curve Can be Obtained By 100% Inspection.
o Dividing line of Probability of acceptance Between 0 to
100% is AQL
5. o Typical OC Curve:
o This is Curve Roughly “S” Shaped.
o Obtained by joining points between Probability of
acceptance & Percentage non conforming items.
o Obtained by Performing Sampling Inspection.
6.
7.
8. o Type A
oGives the probability of acceptance for an individual lot
coming from finite production
oThis Curves are discontinuous.
o Type B
oGive the probability of acceptance for lots coming from
a continuous process
oThis Curves are correctly viewed as Continuous.
9. 9
o Assumes a finite lot.
o Hypergeometric distribution is used for this type
of curve.
o Binomial or Poisson distribution often provides a
good approximation.
o View point of Type A curve is to evaluate
consumer’s risk
10. o Assumes an infinite lot.
o Binomial distribution is the correct one.
o Poisson distribution often provides a good
approximation.
o View Point Type B OC curve is to evaluate
producers risks.
11. o Producer’s Risks (α):
o Probability of Rejection of a conforming lot.
o To Reduce Producers Risk Produce Product at a better
Quality Level Than AQL.
o Value of Producer’s Risks is Commonly 5%.
12. o Consumer’s Risks (β):
o Risk associated with Consumer.
o Probability of accepting a non-conforming lot.
o Usually it is 10%.
13. o AQL(Acceptable Quality Level):
o Maximum Percent of defectives that will make lot easily
acceptable.
o Fraction of Defectives accepted without any serious
effect on quality and customer relations.
o PA for an AQL lot should be high.
o AQL is also Termed as Producer’s “safe point”.
14. o Rejectable Quality Level(RQL):
o Quality Level Unacceptable to the Customer.
o Definition Of Unsatisfactory Quality.
o Characterised by low probability of acceptance.
o PA of lot at RQL represents Consumer’s Risk.
15.
16. o Y axis
Gives the probability that the lot will be accepted (Pa).
o X axis = p
Percentage Defective.
o Shows percentage-defectives along the horizontal ('X'),
axis and probability of acceptance along the vertical ('Y')
axis.
17. PA = The probability of acceptance
p = Proportion defective
N = Lot size
n = Sample size
c= Acceptance Number
α = Producer’s Risk
β= Consumer’s Risk
18. o Hyper geometric Distributions
o Binomial Distributions
o Poisson’s Distributions
19. o The hyper geometric
distribution is used to
calculate the probability
of acceptance of a
sampling plan when the
lot is relatively small.
o Calculations Becomes
Cumbersome for large
lot sizes.
The probability of exactly x
defective parts in a sample n:
20. o The binomial assumes that
the probabilities associated
with all samples are equal.
o This is referred to as
sampling with replacement.
The probability of exactly x
defective parts in a sample n:
21. Poisson Distributions
o Used for sampling plans
involving the number of
defects or defects per unit
rather than the number of
defective parts.
o When n is large and p is
small, the Poisson
distribution formula may be
used.
o The probability of exactly x
defects or defective parts in
a sample n:
o The letter e represents the
value of the base of the natural
logarithm system. It is a
constant value (e = 2.71828).
22. o Selection of sampling plans
o Aids in selection of plans that are effective in reducing
risk
o keeps the high cost of inspection down
23. o Ideal curve would be
perfectly perpendicular
from 0 to 100% for a
given fraction defective.
24. o Sampling Plans with Same Percent samples give very
different quality protection.
25. o Larger the sample size
steeper is the slope of
OC curve.
o Larger sample size
gives protection to
consumer and producer.