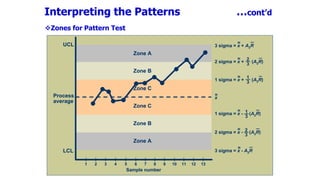
Statistical Quality Control involves using statistical techniques to control quality by inspecting products and processes to determine if they meet quality standards. W. Edward Deming advocated for this approach to reduce variation and achieve consistency. There are three main categories of statistical quality control: descriptive statistics, acceptance sampling, and statistical process control (SPC). SPC involves measuring quality characteristics over time and charting the results to identify variations and determine whether a process is stable and in control. Control charts are a key tool in SPC, as they graph data over time and can be used to differentiate between common cause variation and special cause variation.
This presentation breifs about the quality control sector, its ojectives, benefits. The various departments which monitor the quality in India are also mentioned.
Statistical quality control applied industrial and manufacturing operations. Case study regarding the use of these tools. Description of statistical tools used in quality control and inspection.
Statistical process control (SPC) is a method of quality control which uses statistical methods. SPC is applied in order to monitor and control a process. Monitoring and controlling the process ensures that it operates at its full potential. At its full potential, the process can make as much conforming product as possible with a minimum (if not an elimination) of waste (rework or scrap). SPC can be applied to any process where the "conforming product" (product meeting specifications) output can be measured. Key tools used in SPC include control charts; a focus on continuous improvement; and the design of experiments. An example of a process where SPC is applied is manufacturing lines.
statistical quality control, the use of statistical methods in the monitoring and maintaining of the quality of products and services. One method, referred to as acceptance sampling, can be used when a decision must be made to accept or reject a group of parts or items based on the quality found in a sample. A second method, referred to as statistical process control, uses graphical displays known as control charts to determine whether a process should be continued or should be adjusted to achieve the desired quality.Statistical process control (SPC) or statistical quality control (SQC) is the application of statistical methods to monitor and control the quality of a production process. This helps to ensure that the process operates efficiently, producing more specification-conforming products with less waste scrap. SPC can be applied to any process where the "conforming product" (product meeting specifications) output can be measured. Key tools used in SPC include run charts, control charts, a focus on continuous improvement, and the design of experiments. An example of a process where SPC is applied is manufacturing lines.
SPC must be practiced in two phases: The first phase is the initial establishment of the process, and the second phase is the regular production use of the process. In the second phase, a decision of the period to be examined must be made, depending upon the change in 5M&E conditions (Man, Machine, Material, Method, Movement, Environment) and wear rate of parts used in the manufacturing process (machine parts, jigs, and fixtures).
An advantage of SPC over other methods of quality control, such as "inspection," is that it emphasizes early detection and prevention of problems, rather than the correction of problems after they have occurred.
In addition to reducing waste, SPC can lead to a reduction in the time required to produce the product. SPC makes it less likely the finished product will need to be reworked or scrapped.
Statistical process control was pioneered by Walter A. Shewhart at Bell Laboratories in the early 1920s. Shewhart developed the control chart in 1924 and the concept of a state of statistical control. Statistical control is equivalent to the concept of exchangeability.
Statistical process control is appropriate to support any repetitive process, and has been implemented in many settings where for example ISO 9000 quality management systems are used, including financial auditing and accounting, IT operations, health care processes, and clerical processes such as loan arrangement and administration, customer billing etc. Despite criticism of its use in design and development, it is well-placed to manage semi-automated data governance of high-volume data processing operations, for example in an enterprise data warehouse, or an enterprise data quality management system.In manufacturing, quality is defined as conformance to specification. However, no two products or characteristics are ever exactly the same.
Seven tools of quality control.slideshareraiaryan448
7 tools of quality control help identify potential problem root cause and then target them for improvements and process optimization. These are widely used in all kind of manufacturing industries along with service industry as well.
Falcon stands out as a top-tier P2P Invoice Discounting platform in India, bridging esteemed blue-chip companies and eager investors. Our goal is to transform the investment landscape in India by establishing a comprehensive destination for borrowers and investors with diverse profiles and needs, all while minimizing risk. What sets Falcon apart is the elimination of intermediaries such as commercial banks and depository institutions, allowing investors to enjoy higher yields.
how can I sell pi coins after successfully completing KYCDOT TECH
Pi coins is not launched yet in any exchange 💱 this means it's not swappable, the current pi displaying on coin market cap is the iou version of pi. And you can learn all about that on my previous post.
RIGHT NOW THE ONLY WAY you can sell pi coins is through verified pi merchants. A pi merchant is someone who buys pi coins and resell them to exchanges and crypto whales. Looking forward to hold massive quantities of pi coins before the mainnet launch.
This is because pi network is not doing any pre-sale or ico offerings, the only way to get my coins is from buying from miners. So a merchant facilitates the transactions between the miners and these exchanges holding pi.
I and my friends has sold more than 6000 pi coins successfully with this method. I will be happy to share the contact of my personal pi merchant. The one i trade with, if you have your own merchant you can trade with them. For those who are new.
Message: @Pi_vendor_247 on telegram.
I wouldn't advise you selling all percentage of the pi coins. Leave at least a before so its a win win during open mainnet. Have a nice day pioneers ♥️
#kyc #mainnet #picoins #pi #sellpi #piwallet
#pinetwork
when will pi network coin be available on crypto exchange.DOT TECH
There is no set date for when Pi coins will enter the market.
However, the developers are working hard to get them released as soon as possible.
Once they are available, users will be able to exchange other cryptocurrencies for Pi coins on designated exchanges.
But for now the only way to sell your pi coins is through verified pi vendor.
Here is the telegram contact of my personal pi vendor
@Pi_vendor_247
US Economic Outlook - Being Decided - M Capital Group August 2021.pdfpchutichetpong
The U.S. economy is continuing its impressive recovery from the COVID-19 pandemic and not slowing down despite re-occurring bumps. The U.S. savings rate reached its highest ever recorded level at 34% in April 2020 and Americans seem ready to spend. The sectors that had been hurt the most by the pandemic specifically reduced consumer spending, like retail, leisure, hospitality, and travel, are now experiencing massive growth in revenue and job openings.
Could this growth lead to a “Roaring Twenties”? As quickly as the U.S. economy contracted, experiencing a 9.1% drop in economic output relative to the business cycle in Q2 2020, the largest in recorded history, it has rebounded beyond expectations. This surprising growth seems to be fueled by the U.S. government’s aggressive fiscal and monetary policies, and an increase in consumer spending as mobility restrictions are lifted. Unemployment rates between June 2020 and June 2021 decreased by 5.2%, while the demand for labor is increasing, coupled with increasing wages to incentivize Americans to rejoin the labor force. Schools and businesses are expected to fully reopen soon. In parallel, vaccination rates across the country and the world continue to rise, with full vaccination rates of 50% and 14.8% respectively.
However, it is not completely smooth sailing from here. According to M Capital Group, the main risks that threaten the continued growth of the U.S. economy are inflation, unsettled trade relations, and another wave of Covid-19 mutations that could shut down the world again. Have we learned from the past year of COVID-19 and adapted our economy accordingly?
“In order for the U.S. economy to continue growing, whether there is another wave or not, the U.S. needs to focus on diversifying supply chains, supporting business investment, and maintaining consumer spending,” says Grace Feeley, a research analyst at M Capital Group.
While the economic indicators are positive, the risks are coming closer to manifesting and threatening such growth. The new variants spreading throughout the world, Delta, Lambda, and Gamma, are vaccine-resistant and muddy the predictions made about the economy and health of the country. These variants bring back the feeling of uncertainty that has wreaked havoc not only on the stock market but the mindset of people around the world. MCG provides unique insight on how to mitigate these risks to possibly ensure a bright economic future.
The European Unemployment Puzzle: implications from population agingGRAPE
We study the link between the evolving age structure of the working population and unemployment. We build a large new Keynesian OLG model with a realistic age structure, labor market frictions, sticky prices, and aggregate shocks. Once calibrated to the European economy, we quantify the extent to which demographic changes over the last three decades have contributed to the decline of the unemployment rate. Our findings yield important implications for the future evolution of unemployment given the anticipated further aging of the working population in Europe. We also quantify the implications for optimal monetary policy: lowering inflation volatility becomes less costly in terms of GDP and unemployment volatility, which hints that optimal monetary policy may be more hawkish in an aging society. Finally, our results also propose a partial reversal of the European-US unemployment puzzle due to the fact that the share of young workers is expected to remain robust in the US.
NO1 Uk Divorce problem uk all amil baba in karachi,lahore,pakistan talaq ka m...Amil Baba Dawood bangali
Contact with Dawood Bhai Just call on +92322-6382012 and we'll help you. We'll solve all your problems within 12 to 24 hours and with 101% guarantee and with astrology systematic. If you want to take any personal or professional advice then also you can call us on +92322-6382012 , ONLINE LOVE PROBLEM & Other all types of Daily Life Problem's.Then CALL or WHATSAPP us on +92322-6382012 and Get all these problems solutions here by Amil Baba DAWOOD BANGALI
#vashikaranspecialist #astrologer #palmistry #amliyaat #taweez #manpasandshadi #horoscope #spiritual #lovelife #lovespell #marriagespell#aamilbabainpakistan #amilbabainkarachi #powerfullblackmagicspell #kalajadumantarspecialist #realamilbaba #AmilbabainPakistan #astrologerincanada #astrologerindubai #lovespellsmaster #kalajaduspecialist #lovespellsthatwork #aamilbabainlahore#blackmagicformarriage #aamilbaba #kalajadu #kalailam #taweez #wazifaexpert #jadumantar #vashikaranspecialist #astrologer #palmistry #amliyaat #taweez #manpasandshadi #horoscope #spiritual #lovelife #lovespell #marriagespell#aamilbabainpakistan #amilbabainkarachi #powerfullblackmagicspell #kalajadumantarspecialist #realamilbaba #AmilbabainPakistan #astrologerincanada #astrologerindubai #lovespellsmaster #kalajaduspecialist #lovespellsthatwork #aamilbabainlahore #blackmagicforlove #blackmagicformarriage #aamilbaba #kalajadu #kalailam #taweez #wazifaexpert #jadumantar #vashikaranspecialist #astrologer #palmistry #amliyaat #taweez #manpasandshadi #horoscope #spiritual #lovelife #lovespell #marriagespell#aamilbabainpakistan #amilbabainkarachi #powerfullblackmagicspell #kalajadumantarspecialist #realamilbaba #AmilbabainPakistan #astrologerincanada #astrologerindubai #lovespellsmaster #kalajaduspecialist #lovespellsthatwork #aamilbabainlahore #Amilbabainuk #amilbabainspain #amilbabaindubai #Amilbabainnorway #amilbabainkrachi #amilbabainlahore #amilbabaingujranwalan #amilbabainislamabad
how can I sell my pi coins for cash in a pi APPDOT TECH
You can't sell your pi coins in the pi network app. because it is not listed yet on any exchange.
The only way you can sell is by trading your pi coins with an investor (a person looking forward to hold massive amounts of pi coins before mainnet launch) .
You don't need to meet the investor directly all the trades are done with a pi vendor/merchant (a person that buys the pi coins from miners and resell it to investors)
I Will leave The telegram contact of my personal pi vendor, if you are finding a legitimate one.
@Pi_vendor_247
#pi network
#pi coins
#money
Introduction to Indian Financial System ()Avanish Goel
The financial system of a country is an important tool for economic development of the country, as it helps in creation of wealth by linking savings with investments.
It facilitates the flow of funds form the households (savers) to business firms (investors) to aid in wealth creation and development of both the parties
The secret way to sell pi coins effortlessly.DOT TECH
Well as we all know pi isn't launched yet. But you can still sell your pi coins effortlessly because some whales in China are interested in holding massive pi coins. And they are willing to pay good money for it. If you are interested in selling I will leave a contact for you. Just telegram this number below. I sold about 3000 pi coins to him and he paid me immediately.
Telegram: @Pi_vendor_247
NO1 Uk Black Magic Specialist Expert In Sahiwal, Okara, Hafizabad, Mandi Bah...Amil Baba Dawood bangali
Contact with Dawood Bhai Just call on +92322-6382012 and we'll help you. We'll solve all your problems within 12 to 24 hours and with 101% guarantee and with astrology systematic. If you want to take any personal or professional advice then also you can call us on +92322-6382012 , ONLINE LOVE PROBLEM & Other all types of Daily Life Problem's.Then CALL or WHATSAPP us on +92322-6382012 and Get all these problems solutions here by Amil Baba DAWOOD BANGALI
#vashikaranspecialist #astrologer #palmistry #amliyaat #taweez #manpasandshadi #horoscope #spiritual #lovelife #lovespell #marriagespell#aamilbabainpakistan #amilbabainkarachi #powerfullblackmagicspell #kalajadumantarspecialist #realamilbaba #AmilbabainPakistan #astrologerincanada #astrologerindubai #lovespellsmaster #kalajaduspecialist #lovespellsthatwork #aamilbabainlahore#blackmagicformarriage #aamilbaba #kalajadu #kalailam #taweez #wazifaexpert #jadumantar #vashikaranspecialist #astrologer #palmistry #amliyaat #taweez #manpasandshadi #horoscope #spiritual #lovelife #lovespell #marriagespell#aamilbabainpakistan #amilbabainkarachi #powerfullblackmagicspell #kalajadumantarspecialist #realamilbaba #AmilbabainPakistan #astrologerincanada #astrologerindubai #lovespellsmaster #kalajaduspecialist #lovespellsthatwork #aamilbabainlahore #blackmagicforlove #blackmagicformarriage #aamilbaba #kalajadu #kalailam #taweez #wazifaexpert #jadumantar #vashikaranspecialist #astrologer #palmistry #amliyaat #taweez #manpasandshadi #horoscope #spiritual #lovelife #lovespell #marriagespell#aamilbabainpakistan #amilbabainkarachi #powerfullblackmagicspell #kalajadumantarspecialist #realamilbaba #AmilbabainPakistan #astrologerincanada #astrologerindubai #lovespellsmaster #kalajaduspecialist #lovespellsthatwork #aamilbabainlahore #Amilbabainuk #amilbabainspain #amilbabaindubai #Amilbabainnorway #amilbabainkrachi #amilbabainlahore #amilbabaingujranwalan #amilbabainislamabad
Even tho Pi network is not listed on any exchange yet.
Buying/Selling or investing in pi network coins is highly possible through the help of vendors. You can buy from vendors[ buy directly from the pi network miners and resell it]. I will leave the telegram contact of my personal vendor.
@Pi_vendor_247
Falcon stands out as a top-tier P2P Invoice Discounting platform in India, bridging esteemed blue-chip companies and eager investors. Our goal is to transform the investment landscape in India by establishing a comprehensive destination for borrowers and investors with diverse profiles and needs, all while minimizing risk. What sets Falcon apart is the elimination of intermediaries such as commercial banks and depository institutions, allowing investors to enjoy higher yields.
what is the future of Pi Network currency.DOT TECH
The future of the Pi cryptocurrency is uncertain, and its success will depend on several factors. Pi is a relatively new cryptocurrency that aims to be user-friendly and accessible to a wide audience. Here are a few key considerations for its future:
Message: @Pi_vendor_247 on telegram if u want to sell PI COINS.
1. Mainnet Launch: As of my last knowledge update in January 2022, Pi was still in the testnet phase. Its success will depend on a successful transition to a mainnet, where actual transactions can take place.
2. User Adoption: Pi's success will be closely tied to user adoption. The more users who join the network and actively participate, the stronger the ecosystem can become.
3. Utility and Use Cases: For a cryptocurrency to thrive, it must offer utility and practical use cases. The Pi team has talked about various applications, including peer-to-peer transactions, smart contracts, and more. The development and implementation of these features will be essential.
4. Regulatory Environment: The regulatory environment for cryptocurrencies is evolving globally. How Pi navigates and complies with regulations in various jurisdictions will significantly impact its future.
5. Technology Development: The Pi network must continue to develop and improve its technology, security, and scalability to compete with established cryptocurrencies.
6. Community Engagement: The Pi community plays a critical role in its future. Engaged users can help build trust and grow the network.
7. Monetization and Sustainability: The Pi team's monetization strategy, such as fees, partnerships, or other revenue sources, will affect its long-term sustainability.
It's essential to approach Pi or any new cryptocurrency with caution and conduct due diligence. Cryptocurrency investments involve risks, and potential rewards can be uncertain. The success and future of Pi will depend on the collective efforts of its team, community, and the broader cryptocurrency market dynamics. It's advisable to stay updated on Pi's development and follow any updates from the official Pi Network website or announcements from the team.
NO1 Uk Rohani Baba In Karachi Bangali Baba Karachi Online Amil Baba WorldWide...Amil baba
Contact with Dawood Bhai Just call on +92322-6382012 and we'll help you. We'll solve all your problems within 12 to 24 hours and with 101% guarantee and with astrology systematic. If you want to take any personal or professional advice then also you can call us on +92322-6382012 , ONLINE LOVE PROBLEM & Other all types of Daily Life Problem's.Then CALL or WHATSAPP us on +92322-6382012 and Get all these problems solutions here by Amil Baba DAWOOD BANGALI
#vashikaranspecialist #astrologer #palmistry #amliyaat #taweez #manpasandshadi #horoscope #spiritual #lovelife #lovespell #marriagespell#aamilbabainpakistan #amilbabainkarachi #powerfullblackmagicspell #kalajadumantarspecialist #realamilbaba #AmilbabainPakistan #astrologerincanada #astrologerindubai #lovespellsmaster #kalajaduspecialist #lovespellsthatwork #aamilbabainlahore#blackmagicformarriage #aamilbaba #kalajadu #kalailam #taweez #wazifaexpert #jadumantar #vashikaranspecialist #astrologer #palmistry #amliyaat #taweez #manpasandshadi #horoscope #spiritual #lovelife #lovespell #marriagespell#aamilbabainpakistan #amilbabainkarachi #powerfullblackmagicspell #kalajadumantarspecialist #realamilbaba #AmilbabainPakistan #astrologerincanada #astrologerindubai #lovespellsmaster #kalajaduspecialist #lovespellsthatwork #aamilbabainlahore #blackmagicforlove #blackmagicformarriage #aamilbaba #kalajadu #kalailam #taweez #wazifaexpert #jadumantar #vashikaranspecialist #astrologer #palmistry #amliyaat #taweez #manpasandshadi #horoscope #spiritual #lovelife #lovespell #marriagespell#aamilbabainpakistan #amilbabainkarachi #powerfullblackmagicspell #kalajadumantarspecialist #realamilbaba #AmilbabainPakistan #astrologerincanada #astrologerindubai #lovespellsmaster #kalajaduspecialist #lovespellsthatwork #aamilbabainlahore #Amilbabainuk #amilbabainspain #amilbabaindubai #Amilbabainnorway #amilbabainkrachi #amilbabainlahore #amilbabaingujranwalan #amilbabainislamabad
2. W. Edward Deming advocated the implementation of a statistical quality management
approach.
His philosophy behind this approach is ‘reduce variation’- fundamental to
the principle of continuous improvement and
the achievement of consistency, reliability, and uniformity.
It helps in trustworthiness, competitive position, and success.
Statistical Quality Control
Statistics: data sufficient enough to obtain a reliable result.
Quality: relative term and can be defined as totality of features and characteristics of a
product or service that bear on its ability to satisfy stated or implied need (ISO).
Control: The operational techniques and activities (a system for measuring and checking)
used to fulfil the requirements for quality. It
incorporates a feedback mechanism system to explore the causes of poor quality
or unsatisfactory performance and
takes corrective actions.
also suggests when to inspect, how often to inspect, and how much to inspect.
Basic Concept
3. Statistical Quality Control
A quality control system using statistical techniques to control quality by
performing
inspection,
testing and
analysis
to conclude whether the product is as stated or designed quality standard.
Relying on the probability theory, SQC
evaluates batch quality and
controls the quality of processes or products
It makes the inspection more reliable and less costly.
The basis of the measurement is the performance indicator, either individual,
group or departmental calculated over time (hourly, daily, or weekly).
These performance measures are plotted on a chart.
Pattern obtained from plotting these measures are basis of taking
appropriate actions so that
The process variation in minimized and
Major problems are prevented in future.
The timing and type of, and responsibility for, these actions depends on
whether the causes of variation is controlled or uncontrolled
Basic Concept ….Cont’d
4. Statistical Quality Control
In repetitive manufacture of a product, even with refined machinery,
skilled operator, and selected material, variations are inevitable in the
quality of units produced due to interactions of various causes.
Variation may be due to
Common or random causes of variation (as a result of normal
variation in material, method, and so on that causes natural variation
in product or process quality) resulting in stable pattern of variation.
Special causes (changes in men, machine, materials or tools, jigs and
fixture and so on) resulting in a shift from the stable pattern of
variation.
SQC assists in timely identification and elimination of the problem with
an object of reducing variations in process or product.
The application of statistical method of collecting and analyzing
inspection and other data for setting the economic standards of
product quality and maintaining adherence to the standards so that
variation in product quality can be controlled
Basic Concept ….Cont’d
5. Statistical quality control (SQC) is the term used to describe the
set of statistical tools used by quality professionals
SQC encompasses three broad categories of;
Descriptive statistics
used to describe quality characteristics and relationships.
the mean, standard deviation, and range.
Acceptance sampling used to randomly inspect a batch of products to
determine acceptance or rejection of entire lot based on the results.
Does not help to identify and catch the in-process problems
Statistical process control (SPC)
Involves inspecting the output from a process
Quality characteristics are measured and charted
Helpful in identifying in-process variations
Three SQC Categories
6. Variability: Sources of Variation
Variation exists in all processes.
Variation can be categorized as either;
Common or Random causes of variation, or
Random causes that cannot be identified
Unavoidable: inherent in the process
Normal variation in process variables such as material,
environment, method and so on.
Can be reduced almost to zero only through improvements in
the process variables.
Assignable causes of variation
Causes can be identified and eliminated
e.g. poor employee training, worn tool, machine needing repair
Can be controlled by operator but it needs attention of
management.
7. Traditional Statistical Tools
Descriptive Statistics include
Measure of accuracy (centering)
Measure of central tendency indicating the central
position of the series.
A measure of the central value is necessary to estimate
the accuracy or centering of a process.
The Mean- simply the average of a set of data
Sum of all the measurements/data divided by the
number of observations.
The Median- simply the value of middle item if the
data are arranged in ascending or descending order.
Applies directly if the number in the series is odd.
It lies between two middle numbers if the number
of the series is even.
The Mode- value that repeat itself maximum number
of times in the series.
Shape of Distribution of Observed Data
A measure of distribution of data
Normal or bell shaped
Skewed
n
x
x
n
1i
i
1
K
j
j
X
K
8. Distribution of Data
Also a measure of quality
characteristics.
Symmetric distribution - same
number of data are observed above
and below the mean.
This is what we see only when
normal variation is present in the
data
Skewed distribution – a
disproportionate number of data are
observed either above or below the
mean.
Mean and median fall at different
points in the distribution
Centre of gravity is shifted to
oneside or other.
9. Traditional Statistical Tools …cont’d
Measure of Precision or Spread
Reveals the extent to which numerical data
tend to spread about the mean value.
The Range- the simplest possible measure
of dispersion.
Difference between largest and smallest
observations in a set of data.
o Depends on sample size and it tends
to increase as sample size increases.
o Remains the same despite changes
in values lying between two extreme
values.
Standard Deviation- a measure deviation
of the values from the mean.
Small values >> data are closely
clustered around the mean
Large values >> data are spread out
around the mean.
1n
Xx
σ
n
1i
2
i
10. Statistical Process Control
Process Control
Refers to procedures or techniques adopted to evaluate, maintain and
improve the quality standard in various stages of manufacture.
A process is considered satisfactory as long as it produces items within
designed specification.
Process should be continuously monitored to ensure that the
process behaves as it is expected.
Salient features of process control
Controling the process at the right level and variability.
Detecting the deviation as quickly as possible so as to take
immediate corrective actions.
Ultimate aim is not only to detect trouble, but also to find out the
cause.
Developing an efficient information system in order to establish an
efficient system of process control.
11. Statistical Process Control
Statistical Process Control (SPC)
Statistical evaluation of the output of a process during production.
Goal is to make the process stable over time and then keep it stable unless the
planned changes are made.
Statistical description of stability requires that ‘pattern of variation’ remains
stable over time, not that there be no variation in the variable measured.
In statistical process control language:
A process that is in control has only common or random cause variation -
an inherent variability of the system.
When the normal functioning of the prosess is disturbed by some
unpredictable events, special cause variation is added to common cause
variation.
Applying SPC to service
Nature of defect is different in services
Service defect is a failure to meet customer requirements
One way to deal with service quality is to devise quantifiable measurement
of service elements
Number of complaints received per month,
Number of telephone rings before call is answered
12. Hospitals
timeliness and quickness of care, staff responses to requests, accuracy of lab
tests, cleanliness, courtesy, accuracy of paperwork, speed of admittance and
checkouts
Grocery Stores
waiting time to check out, frequency of out-of-stock items, quality of food
items, cleanliness, customer complaints, checkout register errors
Airlines
flight delays, lost luggage and luggage handling, waiting time at ticket counters
and check-in, agent and flight attendant courtesy, accurate flight information,
passenger cabin cleanliness and maintenance
Fast-Food Restaurants
waiting time for service, customer complaints, cleanliness, food quality, order
accuracy, employee courtesy
Catalogue-Order Companies
order accuracy, operator knowledge and courtesy, packaging, delivery time,
phone order waiting time
Insurance Companies
billing accuracy, timeliness of claims processing, agent availability and response
time
Statistical Process Control
13. Statistical Process Control: Control Chart
Control Chart
A graphical display of data over time (data are displayed in time sequence in
which they occurred/measured) used to differentiate common cause variation
from special cause variation.
Control charts combine numerical and graphical description of data with the use
of sampling distribution
normal distribution is basis for control chart.
Goal of using this chart is to achieve and mainatain process stability
A state in which a process has displayed a certain degree of consistency
Consistency is characterized by a stream of data falling within the
control limits.
Basic Components of a Control Chart
A control chart always has
a central line usually mathematical average of
all the samples plotted;
upper control and lower control limits defining
the constraints of common variations or range
of acceptable variation;
Performance data plotted over time.
Lines are determined from historical data.
14. Control Chart …Cont’d
When to use a control chart?
Controlling ongoing processes by finding and correcting problems as they occur.
Predicting the expected range of outcomes from a process.
Determining whether a process is stable (in statistical control).
Analyzing patterns of process variation from special causes (non-routine events)
or common causes (built into the process).
Determining whether the quality improvement project should aim to prevent
specific problems or to make fundamental changes to the process.
Control Chart Basic Procedure
Choose the appropriate control chart for the data.
Determine the appropriate time period for collecting and plotting data.
Collect data, construct the chart and analyze the data.
Look for “out-of-control signals” on the control chart.
When one is identified, mark it on the chart and investigate the cause.
Document how you investigated, what you learned, the cause and how it was
corrected.
Continue to plot data as they are generated. As each new data point is plotted,
check for new out-of-control signals
15. Control Chart …Cont’d
Interpretation of control chart
Points between control limits are due to
random chance variation
One or more data points above an UCL or
below a LCL mark statistically significant
changes in the process
A process is in control if
No sample points outside limits
Most points near process average
About equal number of points above and below centerline
Points appear randomly distributed
A process is assumed to be out of control if
Rule 1: A single point plots outside the control limits;
Rule 2: Two out of three consecutive points fall outside the two sigma warning limits on
the same side of the center line;
Rule 3: Four out of five consecutive points fall beyond the 1 sigma limit on the same
side of the center line;
Rule 4: Nine or more consecutive points fall to one side of the center line;
Rule 5: There is a run of six or more consecutive points steadily increasing or
decreasing
Time period
Measured
characteristics
16. Control Chart …Cont’d
Setting Control Limits
Type I error
Concluding a process is not in control when it actually is.
Type II error
Concluding a process is in control when it is not.
In control Out of control
In control No Error
Type I error
(producers risk)
Out of control
Type II Error
(consumers risk)
No error
Mean
LCL UCL
/2 /2
Probability
of Type I error
Mean
LCL UCL
/2 /2
Probability
of Type I error
17. General model for a control chart
UCL = μ + kσ
CL = μ
LCL = μ – kσ
where
μ is the mean of the variable
σ is the standard deviation of the variable
UCL=upper control limit; LCL = lower control limit;
CL = center line.
k is the distance of the control limits from the center line,
expressed in terms of standard deviation units.
When k is set to 3, we speak of 3-sigma control charts.
Historically, k = 3 has become an accepted standard in
industry.
Control Chart …Cont’d
18. Control Chart …Cont’d
Suggested Number of Data Points
More data points means more delay
Fewer data points means less precision, wider limits
A tradeoff needs to be made between more delay and less
precision
Generally 25 data points judged sufficient
Use smaller time periods to have more data points
Fewer cases may be used as approximation
Sample Size
Attribute charts require larger sample sizes
50 to 100 parts in a sample
Variable charts require smaller sample sizes
2 to 10 parts in a sample
19. Control Chart …Cont’d
Types of the control charts
Variables control charts
Variable data are measured on a continuous scale.
For example: time, weight, distance or temperature can be
measured in fractions or decimals.
Applied to data following continuous distribution
Attributes control charts
Attribute data are counted and cannot have fractions or
decimals.
Attribute data arise when you are determining only the
presence or absence of something:
success or failure,
accept or reject,
correct or not correct.
For example, a report can have four errors or five errors, but it
cannot have four and a half errors.
Applied to data following discrete distribution
20. Variable control charts
R chart (range chart)
X-bar (mean chart)
S chart (sigma chart)
Individual or run chart
i-chart
Moving range chart
Median chart
EWMA (exponentially weighted moving average chart)
General formulae for a control chart
UCL or UAL = μ + kσx k = 3 ; Accepted Standard
UWL = μ + 2/3 kσx
CL = μ
LWL = μ – 2/3 kσx
LCL or LAL = μ – kσx
Control Chart …Cont’d
m
i
i
X
X
m
X
n
m: # of sample mean
n: # of observations in each
sample
21. Control Chart …Cont’d
Mean control charts
Used to detect the variations in mean of
a process.
X-bar chart
Range control charts
Used to detect the changes in dispersion
or variability of a process
R chart
Use X-bar and R charts together
Sample size : 2 ~ 10
Use X-bar and S charts together
Sample size : > 10
Use i-chart and Moving range chart
together
Sample size : 1 or one-at-a-time data
System can show acceptable central
tendencies but unacceptable variability
or
System can show acceptable variability
but unacceptable central tendencies
Interpret the R-chart first:
If R-chart is in control -> interpret the X-bar
chart ->
(i) if in control: the process is in control;
(ii) if out of control: the process average is out
of control
If R-chart is out of control: the process
variation is out of control
-> Investigate the cause; no need to interpret
the X-bar chart
22. Control Chart …Cont’d
Constructing a X-bar Chart:
A quality control inspector at the Cocoa Fizz soft drink company has taken three samples
with four observations each of the volume of bottles filled.
If the standard deviation of the bottling operation is 0.2 ounces, use the below data to
develop control charts with limits of 3 standard deviations for the 16 oz. bottling operation.
Centerline and 3-sigma
control limit formulas
Time 1 Time 2 Time 3
Observation 1 15.8 16.1 16.0
Observation 2 16.0 16.1 15.9
Observation 3 15.8 15.8 15.9
Observation 4 15.9 15.9 15.8
Sample
means (X-
bar)
15.875 15.975 15.9
Sample
ranges (R)
0.2 0.3 0.2
3X X
UCL X
3X X
LCL X
X
CL X
m
i
i
X
X
m
X
n
Where,
m: # of sample mean
n: # of observations in each sample
23. Control Chart …Cont’d
Centerline (x-double bar):
Control limits for±3σ limits:
Control Chart
Plot the sample mean in the
sequence from which it was
generated and interpret the
pattern in the control chart.
15.875 15.975 15.9
x 15.92
3
x x
x x
.2
UCL x zσ 15.92 3 16.22
4
.2
LCL x zσ 15.92 3 15.62
4
24. Control Chart …Cont’d
Second Method for X-bar Chart using Range and A2 factor
Use this method when standard deviation for the process distribution is
unknown.
Control limits solution:
Center line and 3-sigma
control Fomulas:
1
2
k
i
i
x
n
R
R
k
R R
or
d d n
;
;&
2
2
2
2
3
3
x
x
x
CL X
R
UCL X X A R
d n
R
LCL X X A R
d n
26. Control Chart …Cont’d
R-Chart:
Always look at the Range chart first.
The control limits on the X-bar chart are
derived from the average range, so if the
Range chart is out of control, then the
control limits on the X-bar chart are
meaningless.
Look for out of control signal.
If there are any, then the special causes
must be eliminated.
There should be more than five distinct
values plotted, and no one value should
appear more than 25% of the time.
If there are values repeated too often,
then you have inadequate resolution
of your measurements, which will
adversely affect your control limit calculations.
Once the effect of the out of control points
from the Range chart is removed, look at
the X-bar Chart.
Standard Deviation of Range and Standard
Deviation of the process is related as:
Centerline and 3-sigma Control Limit
Formulas:
Where
3
3
2
R
d
d R
d
3 3
4
2 2
3 3
3
2 2
3 1 3
3 1 3
R
R
R
CL R
d d
UCL R R R D R
d d
d d
LCL R R R D R
d d
( )
( )
d
D
d
3
4
2
1 3 max( , )
d
D
d
3
3
2
0 1 3
28. Control Chart …Cont’d
S-Chart
The sample standard deviations are
plotted in order to control the
process variability.
For sample size (n>12),
With larger samples, the
resulting mean range does not
give a good estimate of
standard deviation
the S-chart is more efficient
than R-chart.
For situations where sample size
exceeds 12, the X-bar chart and the
S-chart should be used to check the
process stability.
Centerline and 3-sigma Control Limit
Formulas:
Where
s
s
s
CL S
c
UCL S S B S
c
c
LCL S S B S
c
2
4
4
4
2
4
3
4
1
3
1
3
max( , )
c
B
c
c
B
c
2
4
4
4
2
4
3
4
1
1 3
1
0 1 3
( )
&
kn
j ji
ji
j
Sx x
S S
n k
2
11
1
29. Changing Sample Size on the X-bar and R Charts
In some situations, it may be of interest to know the effect of changing
the sample size on the X-bar and R charts. Needed information:
= average range for the old sample size
= average range for the new sample size
nold = old sample size
nnew = new sample size
d2(old) = factor d2 for the old sample size
d2(new) = factor d2 for the new sample size
Centerline and 3-sigma Control Limit Formulas:
oldR
newR
Control Chart …Cont’d
( )
( )
( )
( )
old
old
x chart
d new
UCL x A R
d old
d new
LCL x A R
d old
2
2
2
2
2
2
( )
( )
( )
( )
( )
max ,
( )
old
new old
old
R chart
d new
UCL D R
d old
d new
CL R R
d old
d new
LCL D R
d old
2
4
2
2
2
2
3
2
0
33. Control Chart: Interpreting the Patterns
Patterns
A nonrandom identifiable arrangement of plotted points on the chart.
Provides sufficient reasons to look for special causes.
Causes that affect the process intermittently and
can be due to periodic and persistent disturbances
Natural pattern
No identifiable arrangement of the plotted points exists
No point falls outside the control limit;
Majority of the points are near the centerline; and
Few points are close to the control limits
These patterns are indicative of a process that is in control.
One point outside the control limits
Also known as freaks and are caused by external disturbance
Not difficult to identify the special causes for freaks. However, make sure
that no measurement or calculation error is associated with it,
Sudden, very short lived power failure,
Use of new tool for a brief test period or a broken tool,
incomplete operation, failure of components
34. Interpreting the Patterns …cont’d
Sudden shift in process mean
A sudden change or jump in process mean or average service level.
Afterward, the process becomes stable.
This sudden change can occur due to changes- intentional or otherwise in
Process settings e.g. temperature, pressure or depth of cut
Number of tellers at the Bank,
New operator, new equipment, new measurement instruments, new vendor
or new method of processing.
Gradual shift in the process mean
Such shift occurs when the process parameters change gradually over a period
of time.
Afterward, the process stabilizes
X-bar chart might exhibit such shift due to change in incoming quality of raw
materials or components over time, maintenance program or style of
supervision.
R-chart might exhibit such shift due to a new operator, decrease in worker skill
due to fatigue or monotoy, or improvement in incoming quality of raw
materials.
35. Interpreting the Patterns …cont’d
Trending pattern
Trend represents changes that steadily increases or decreases.
Trends do not stabilize or settle down
X-bar chart may exhibit a trend because of tool wear, dirt or chip buildup, aging
of equipment.
R-chart may exhibit trend because of gradual improvement of skill resulting
from on-the-job-training or a decrease in operator skill due to fatigue.
Cyclic pattern
A repetitive periodic behavior in the system.
A high and low points will appear on the control chart
X-bar chart may exhibit a cyclic behavior because of a rotation of operator,
periodic changes in temperature and humidity, seasonal variation of incoming
components, periodicity in mechanical or chemical properties of the material
R-chart might exhibit cyclic pattern because of operator fatigue and subsequent
energization following breaks, a difference between shifts, or periodic
maintenance of equipment.
Graph will not show cyclic pattern, if the samples are taken too infrequently
36. Interpreting the Patterns …cont’d
Zones for Pattern Test
UCL
LCL
Zone A
Zone B
Zone C
Zone C
Zone B
Zone A
Process
average
3 sigma = x + A2R
=
3 sigma = x - A2R
=
2 sigma = x + (A2R)
= 2
3
2 sigma = x - (A2R)
= 2
3
1 sigma = x + (A2R)
= 1
3
1 sigma = x - (A2R)
= 1
3
x
=
Sample number
|
1
|
2
|
3
|
4
|
5
|
6
|
7
|
8
|
9
|
10
|
11
|
12
|
13
UCL
LCL
Zone A
Zone B
Zone C
Zone C
Zone B
Zone A
Zone A
Zone B
Zone C
Zone C
Zone B
Zone A
Process
average
3 sigma = x + A2R
=
3 sigma = x - A2R
=
2 sigma = x + (A2R)
= 2
3
2 sigma = x - (A2R)
= 2
3
1 sigma = x + (A2R)
= 1
3
1 sigma = x - (A2R)
= 1
3
x
=
Sample number
|
1
|
2
|
3
|
4
|
5
|
6
|
7
|
8
|
9
|
10
|
11
|
12
|
13
|
1
|
2
|
3
|
4
|
5
|
6
|
7
|
8
|
9
|
10
|
11
|
12
|
13
39. Control Chart …Cont’d
A process is assumed to be out of control if
Rule 1: A single point plots outside the control
limits;
Rule 2: Two out of three consecutive points fall
outside the two sigma warning limits on the same
side of the center line;
Rule 3: Four out of five consecutive points fall
beyond the 1 sigma limit on the same side of the
center line;
Rule 4: Nine or more consecutive points fall to
one side of the center line;
Rule 5: There is a run of six or more consecutive
points steadily increasing or decreasing
40. Interpreting the Patterns …cont’d
Performing a Pattern Test
11 4.984.98 BB —— BB
22 5.005.00 BB UU CC
33 4.954.95 BB DD AA
44 4.964.96 BB DD AA
55 4.994.99 BB UU CC
66 5.015.01 —— UU CC
77 5.025.02 AA UU CC
88 5.055.05 AA UU BB
99 5.085.08 AA UU AA
1010 5.035.03 AA DD BB
SAMPLESAMPLE xx ABOVE/BELOWABOVE/BELOW UP/DOWNUP/DOWN ZONEZONE
11 4.984.98 BB —— BB
22 5.005.00 BB UU CC
33 4.954.95 BB DD AA
44 4.964.96 BB DD AA
55 4.994.99 BB UU CC
66 5.015.01 —— UU CC
77 5.025.02 AA UU CC
88 5.055.05 AA UU BB
99 5.085.08 AA UU AA
1010 5.035.03 AA DD BB
SAMPLESAMPLE xx ABOVE/BELOWABOVE/BELOW UP/DOWNUP/DOWN ZONEZONE
11 4.984.98 BB —— BB
22 5.005.00 BB UU CC
33 4.954.95 BB DD AA
44 4.964.96 BB DD AA
55 4.994.99 BB UU CC
66 5.015.01 —— UU CC
77 5.025.02 AA UU CC
88 5.055.05 AA UU BB
99 5.085.08 AA UU AA
1010 5.035.03 AA DD BB
SAMPLESAMPLE xx ABOVE/BELOWABOVE/BELOW UP/DOWNUP/DOWN ZONEZONESAMPLESAMPLE xx ABOVE/BELOWABOVE/BELOW UP/DOWNUP/DOWN ZONEZONE
41. Control Chart …Cont’d
A process is assumed to be out of control if
Rule 1: A single point plots outside the control
limits;
Rule 2: Two out of three consecutive points fall
outside the two sigma warning limits on the same
side of the center line;
Rule 3: Four out of five consecutive points fall
beyond the 1 sigma limit on the same side of the
center line;
Rule 4: Nine or more consecutive points fall to
one side of the center line;
Rule 5: There is a run of six or more consecutive
points steadily increasing or decreasing
42. Control Chart for Attributes
Attributes are discrete events: yes/no or pass/fail
Construction and interpretation are same as that of variable control charts.
Attributes control charts
p chart
Uses proportion nonconforming (defective) items in a sample.
Based on a binomial distribution.
Can be used for varying sample size.
np chart
Uses number of nonconforming items in a sample.
Should not be used when sample size varies.
c chart
Uses total number of nonconformities or defects in samples of constant size.
Occurence of nonconformities follows poisson distribution.
u chart
when the sample size varies, the number of nonconformities per unit is used as a basis for
this control chart.
43. Control Chart: p chart
Proportion nonconforming or defectives for each sample are plotted on the p-chart
The chart is examined to determine whether the process is in control.
Means to calculate center line and control limits
No standard or target value of proportion nonconforming is specified
It must be estimated from sample infromation and
For each sample, proportion of nonconforming items are determined as
The average of these individual sample proportion of nonconforming items is used as the
center line (CLp):
As true value of p is not known,
p-bar is used as an estimate
x
p
n
m m
i
i i
p
p x
CL p
m nm
( )
( )
p
p
p p
UCL p
n
p p
LCL p
n
1
3
1
3
44. 20 samples of 100 pairs of jeans20 samples of 100 pairs of jeans
NUMBER OFNUMBER OF PROPORTIONPROPORTION
SAMPLESAMPLE DEFECTIVESDEFECTIVES DEFECTIVEDEFECTIVE
11 66 .06.06
22 00 .00.00
33 44 .04.04
:: :: ::
:: :: ::
2020 1818 .18.18
200200
20 samples of 100 pairs of jeans20 samples of 100 pairs of jeans
NUMBER OFNUMBER OF PROPORTIONPROPORTION
SAMPLESAMPLE DEFECTIVESDEFECTIVES DEFECTIVEDEFECTIVE
11 66 .06.06
22 00 .00.00
33 44 .04.04
:: :: ::
:: :: ::
2020 1818 .18.18
200200
UCL = p + z = 0.10 + 3
p(1 - p)
n
0.10(1 - 0.10)
100
UCL = 0.190
LCL = 0.010
LCL = p - z = 0.10 - 3
p(1 - p)
n
0.10(1 - 0.10)
100
= 200 / 20(100) = 0.10
total defectives
total sample observations
p =
UCL = p + z = 0.10 + 3
p(1 - p)
n
0.10(1 - 0.10)
100
UCL = 0.190
UCL = p + z = 0.10 + 3
p(1 - p)
n
0.10(1 - 0.10)
100
UCL = 0.190
LCL = 0.010
LCL = p - z = 0.10 - 3
p(1 - p)
n
0.10(1 - 0.10)
100
LCL = 0.010
LCL = p - z = 0.10 - 3
p(1 - p)
n
0.10(1 - 0.10)
100
LCL = p - z = 0.10 - 3
p(1 - p)
n
0.10(1 - 0.10)
100
= 200 / 20(100) = 0.10
total defectives
total sample observations
p = = 200 / 20(100) = 0.10
total defectives
total sample observations
p = = 200 / 20(100) = 0.10
total defectives
total sample observations
p =
If the target or standard value is specified
Center line is selected as that target value i.e.
CLp= po where, po represent a standard value
Control limits are also based on the target velue.
If the lower control limit for p is turned out to be negative, LCL is
simply counted as zero.
Lowest possible value for proportion of nonconformng item is zero
Control Chart: p chart …Cont’d
45. Control Chart: p chart …Cont’d
Variable sample size
Changes in sample size casues the control limits to change, although the center
line remained fixed.
Control limits can be constructed:
For individual samples
If no standard value is given and sample mean proportion nonconforming
is p-bar, control limit for sample i with size ni are
Using average sample size
Where
( )
( )
i
i
p p
UCL p
n
p p
LCL p
n
1
3
1
3
( )
( )
p p
UCL p
n
p p
LCL p
n
1
3
1
3
m
i
i
n
n
m
1
46. Control Chart: c chart
No standard given
Average number of nonconformities per sample unit is found from the sample
observation and is denoted by c-bar.
The center line and control limits are:
If lower control limit is found to be less than zero, it is converted to zero.
Standard given
if the specified target for the number of nonconformities per sample unit be co..
The center line and control limits are then calculated from:
c
c
c
CL c
UCL c c
LCL c c
3
3
c o
c o o
o o o
CL c
UCL c c
LCL c c
3
3
47. Control Chart: c chart …Cont’d
Number of defects in 15 sample roomsNumber of defects in 15 sample rooms
1 121 12
2 82 8
3 163 16
: :: :
: :: :
15 1515 15
190190
SAMPLESAMPLE
cc = = 12.67= = 12.67
190190
1515
UCLUCL == cc ++ zzcc
= 12.67 + 3 12.67= 12.67 + 3 12.67
= 23.35= 23.35
LCLLCL == cc ++ zzcc
= 12.67= 12.67 -- 3 12.673 12.67
= 1.99= 1.99
NUMBER
OF
DEFECTS
Number of defects in 15 sample roomsNumber of defects in 15 sample rooms
1 121 12
2 82 8
3 163 16
: :: :
: :: :
15 1515 15
190190
SAMPLESAMPLE
cc = = 12.67= = 12.67
190190
1515
cc = = 12.67= = 12.67
190190
1515
cc = = 12.67= = 12.67
190190
1515
190190
1515
UCLUCL == cc ++ zzcc
= 12.67 + 3 12.67= 12.67 + 3 12.67
= 23.35= 23.35
UCLUCL == cc ++ zzcc
= 12.67 + 3 12.67= 12.67 + 3 12.67
= 23.35= 23.35
LCLLCL == cc ++ zzcc
= 12.67= 12.67 -- 3 12.673 12.67
= 1.99= 1.99
NUMBER
OF
DEFECTS
33
66
99
1212
1515
1818
2121
2424
NumberofdefectsNumberofdefects
Sample numberSample number
22 44 66 88 1010 1212 1414 1616
UCL = 23.35
LCL = 1.99
c = 12.67
33
66
99
1212
1515
1818
2121
2424
NumberofdefectsNumberofdefects
Sample numberSample number
22 44 66 88 1010 1212 1414 1616
UCL = 23.35
LCL = 1.99
c = 12.67
33
66
99
1212
1515
1818
2121
2424
NumberofdefectsNumberofdefects
Sample numberSample number
22 44 66 88 1010 1212 1414 161622 44 66 88 1010 1212 1414 1616
UCL = 23.35
LCL = 1.99
c = 12.67