Downloaded 156 times


![Mean or average
The simplest statistic is the mean or average. Years ago, when laboratories
were beginning to assay controls, it was easy to calculate a mean and use that
value as the "target" to be achieved. For example, given the following ten
analyses of a control material - 90, 91, 89, 84, 88, 93, 80, 90, 85, 87 - the
mean or X bar is 877/10 or 87.7. [The term X bar refers to a symbol having a
line or bar over the X,, however, we will use the term instead of the symbol in
the text of these lessons because it is easier to present.]
The mean value characterizes the "central tendency" or "location" of the data.
Although the mean is the value most likely to be observed, many of the actual
values are different than the mean. When assaying control materials, it is
obvious that technologists will not achieve the mean value each and every
time a control is analyzed. The values observed will show a dispersion or
distribution about the mean, and this distribution needs to be characterized to
set a range of acceptable control values.](https://image.slidesharecdn.com/internalqualitycontrol-160531105854/85/Internal-quality-control-7-320.jpg)
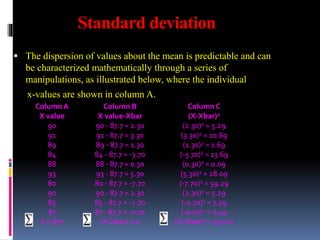
![Standard deviation
The first mathematical manipulation is to sum (∑) the individual
points and calculate the mean or average, which is 877 divided by 10,
or 87.7 in this example.
The second manipulation is to subtract the mean value from each
control value, as shown in column B. This term, shown as X value –
X bar, is called the difference score. As can be seen here, individual
difference scores can be positive or negative and the sum of the
difference scores is always zero.
The third manipulation is to square the difference score to make all
the terms positive, as shown in Column C.
Next the squared difference scores are summed.
Finally, the predictable dispersion or standard deviation (SD or s) can
be calculated as follows:
= [132.10/(10-1)]1/2 = 3.83](https://image.slidesharecdn.com/internalqualitycontrol-160531105854/85/Internal-quality-control-9-320.jpg)
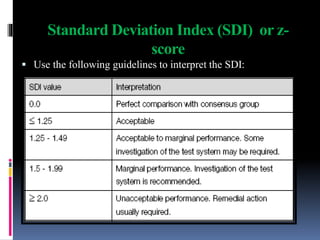
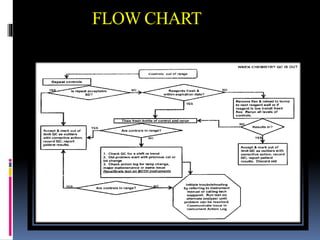
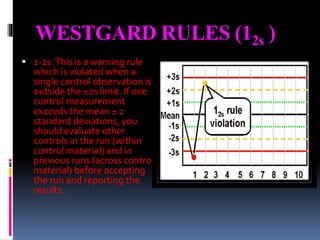
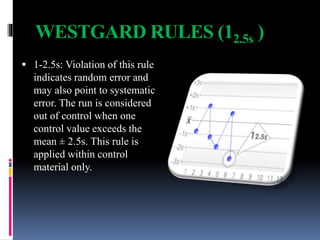
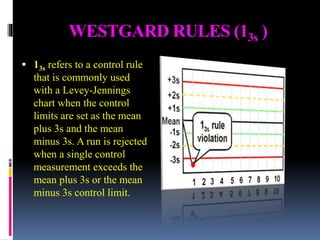
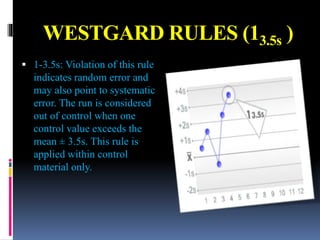
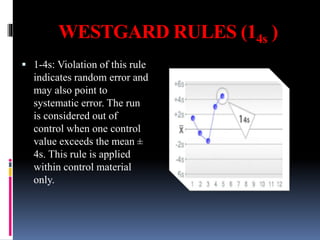
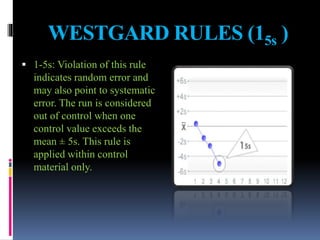
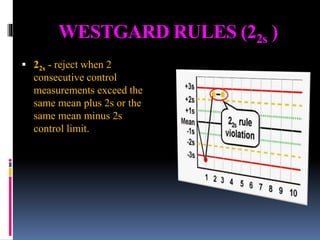


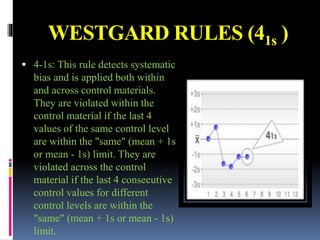
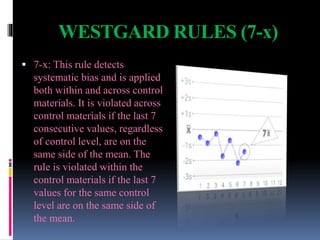
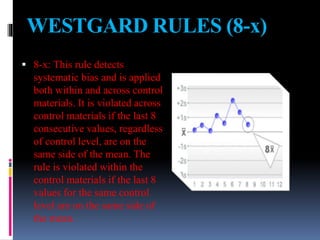
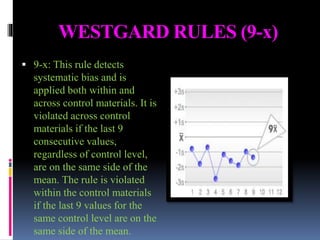
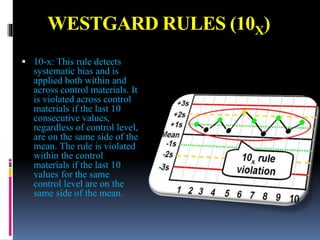
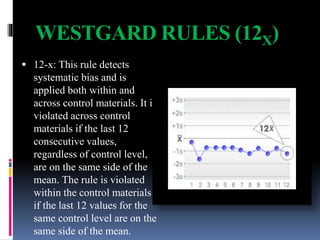
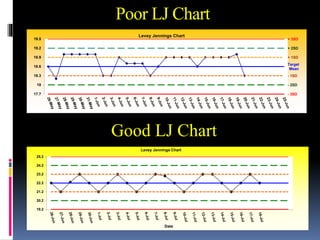


The document discusses the procedures and metrics involved in quality control within medical laboratories, emphasizing the importance of monitoring analytical processes to avoid reporting incorrect patient results. It defines key terms such as accuracy, precision, bias, and various error types, while also detailing how to compute and interpret statistical measures like mean, standard deviation, and coefficient of variation. Additionally, it outlines specific Westgard rules that assist in identifying systematic and random errors in quality control data.


