Downloaded 3,146 times
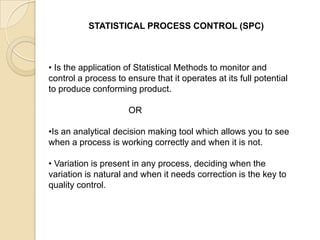
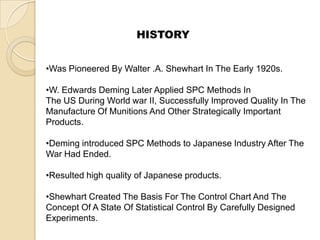


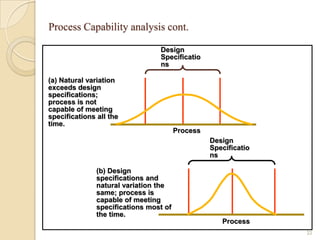
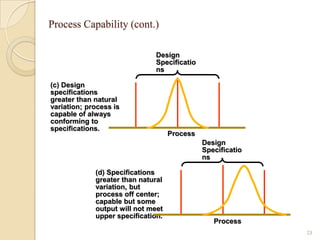


Statistical process control (SPC) involves using statistical methods to monitor and control processes to ensure they produce conforming products. Variation exists in all processes, and SPC helps determine when variation is normal versus requiring correction. Key SPC tools include control charts, which graph process data over time to identify special causes of variation needing addressing. Process capability analysis also examines whether a process can meet specifications under natural variation. Together these tools help processes run at full potential with minimal waste.