


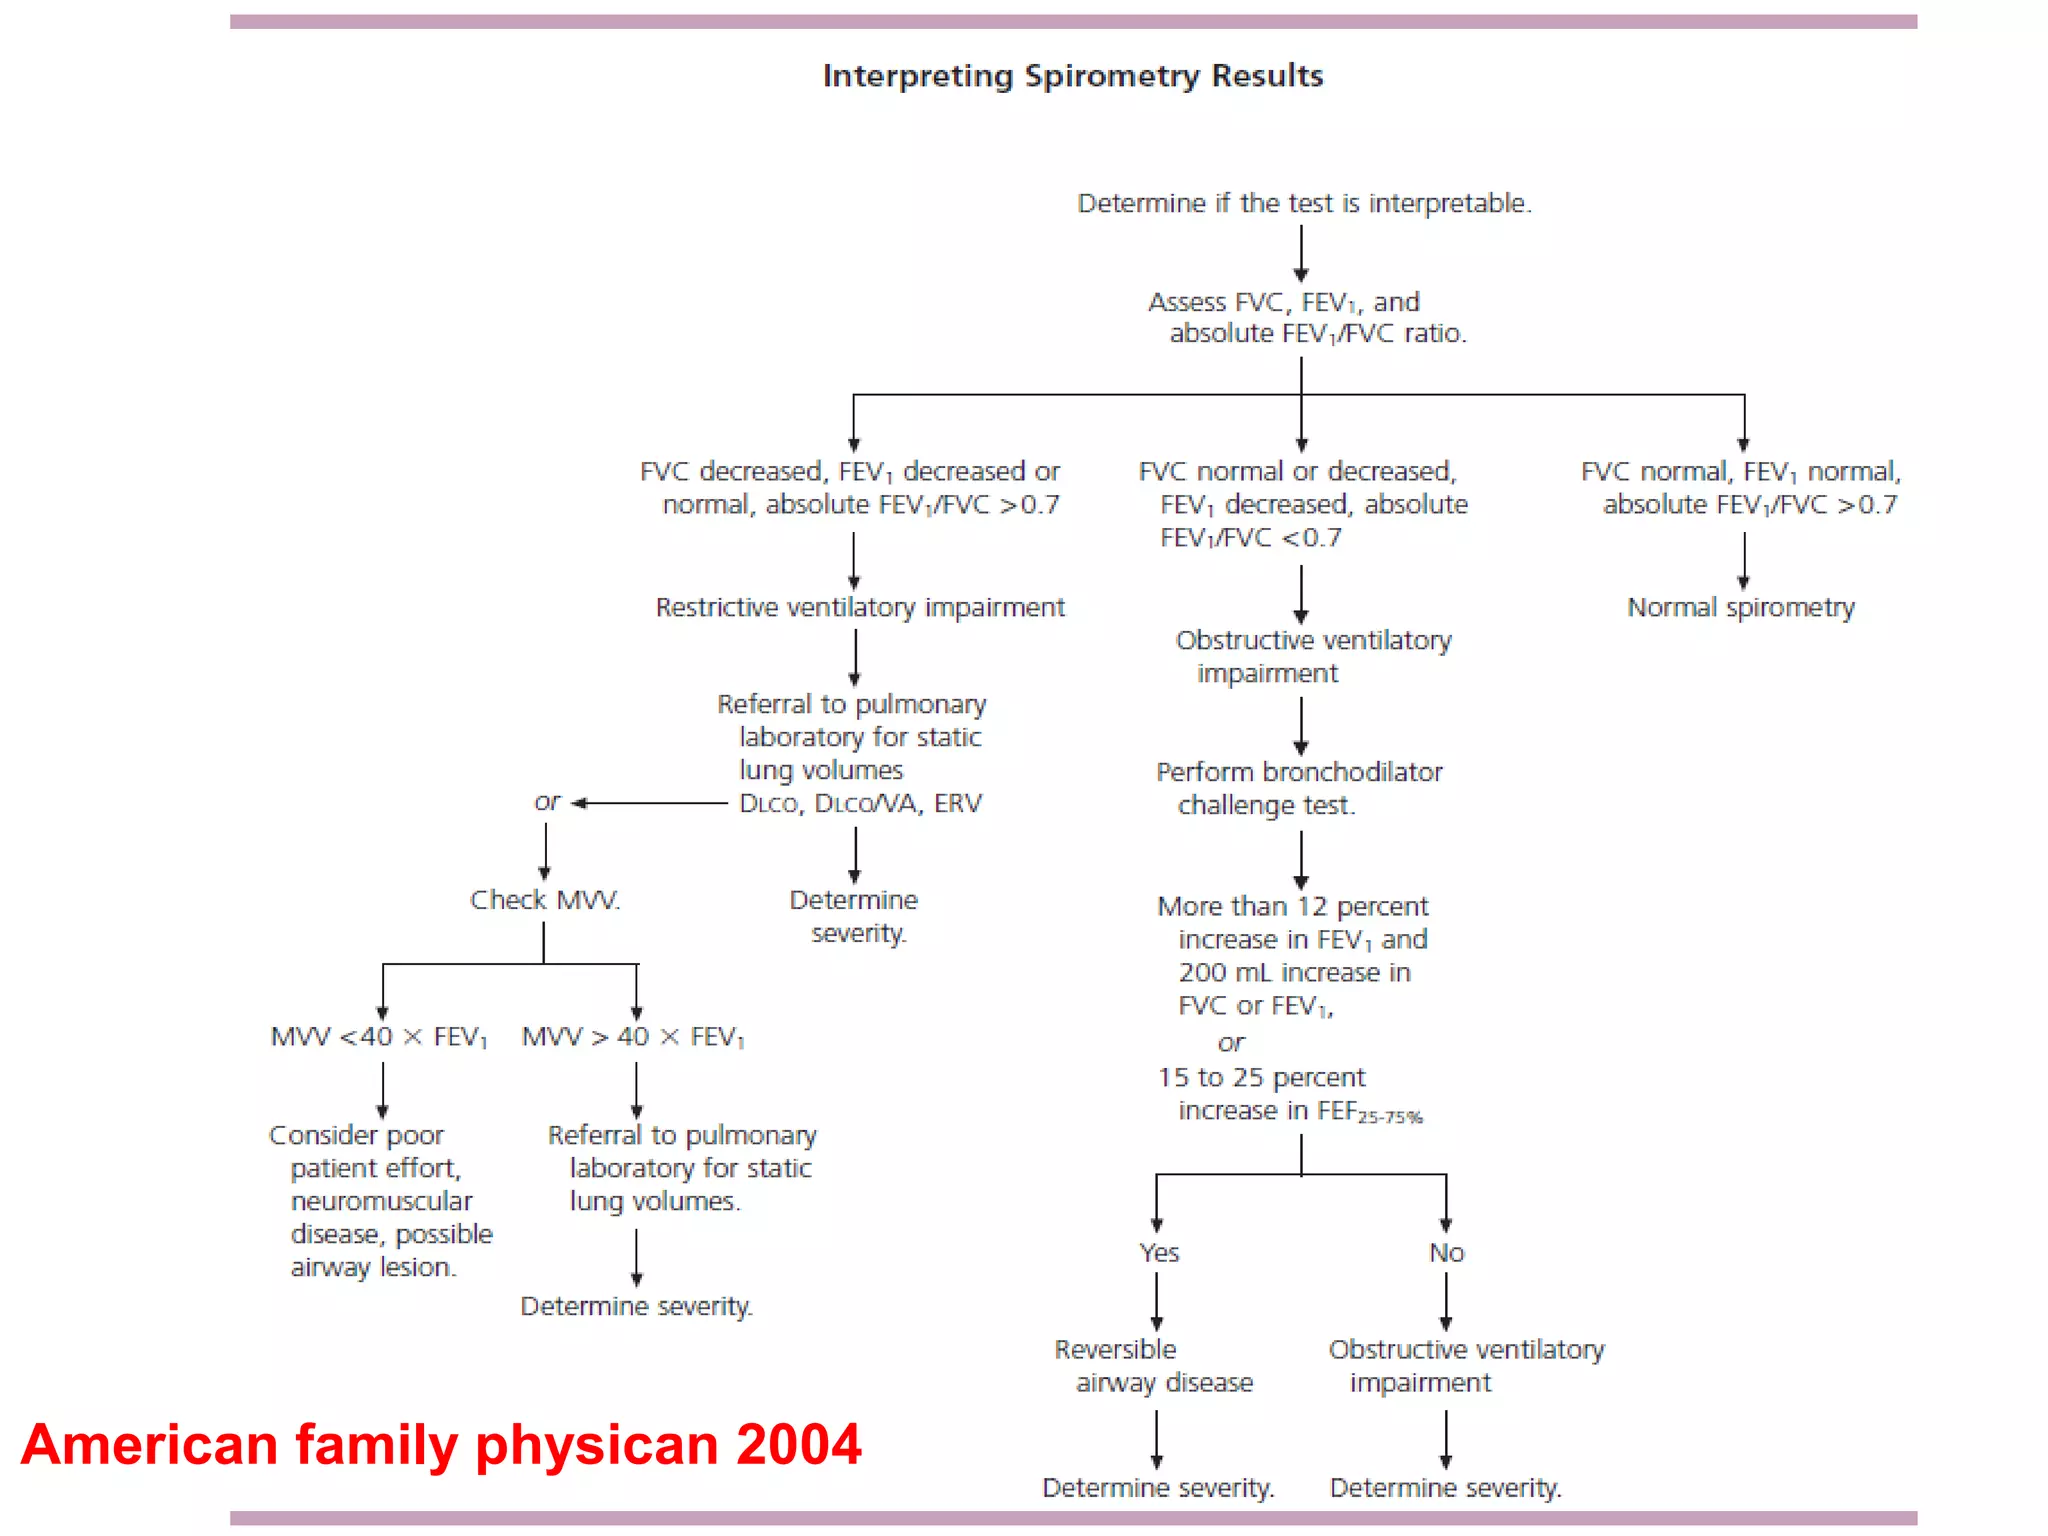


The document discusses interpretation of spirometry data. It provides normal values for measures like FEV1, FVC and FEF25-75. An obstructive pattern is defined as a decreased FEV1/FVC ratio below 0.7, with decreased FEV1 and possibly decreased FVC. A restrictive pattern shows a normal or mildly reduced FEV1 but reduced FVC. Acceptability and repeatability criteria for spirometry tests are outlined.
Introduction to spirometry and its interpretation.
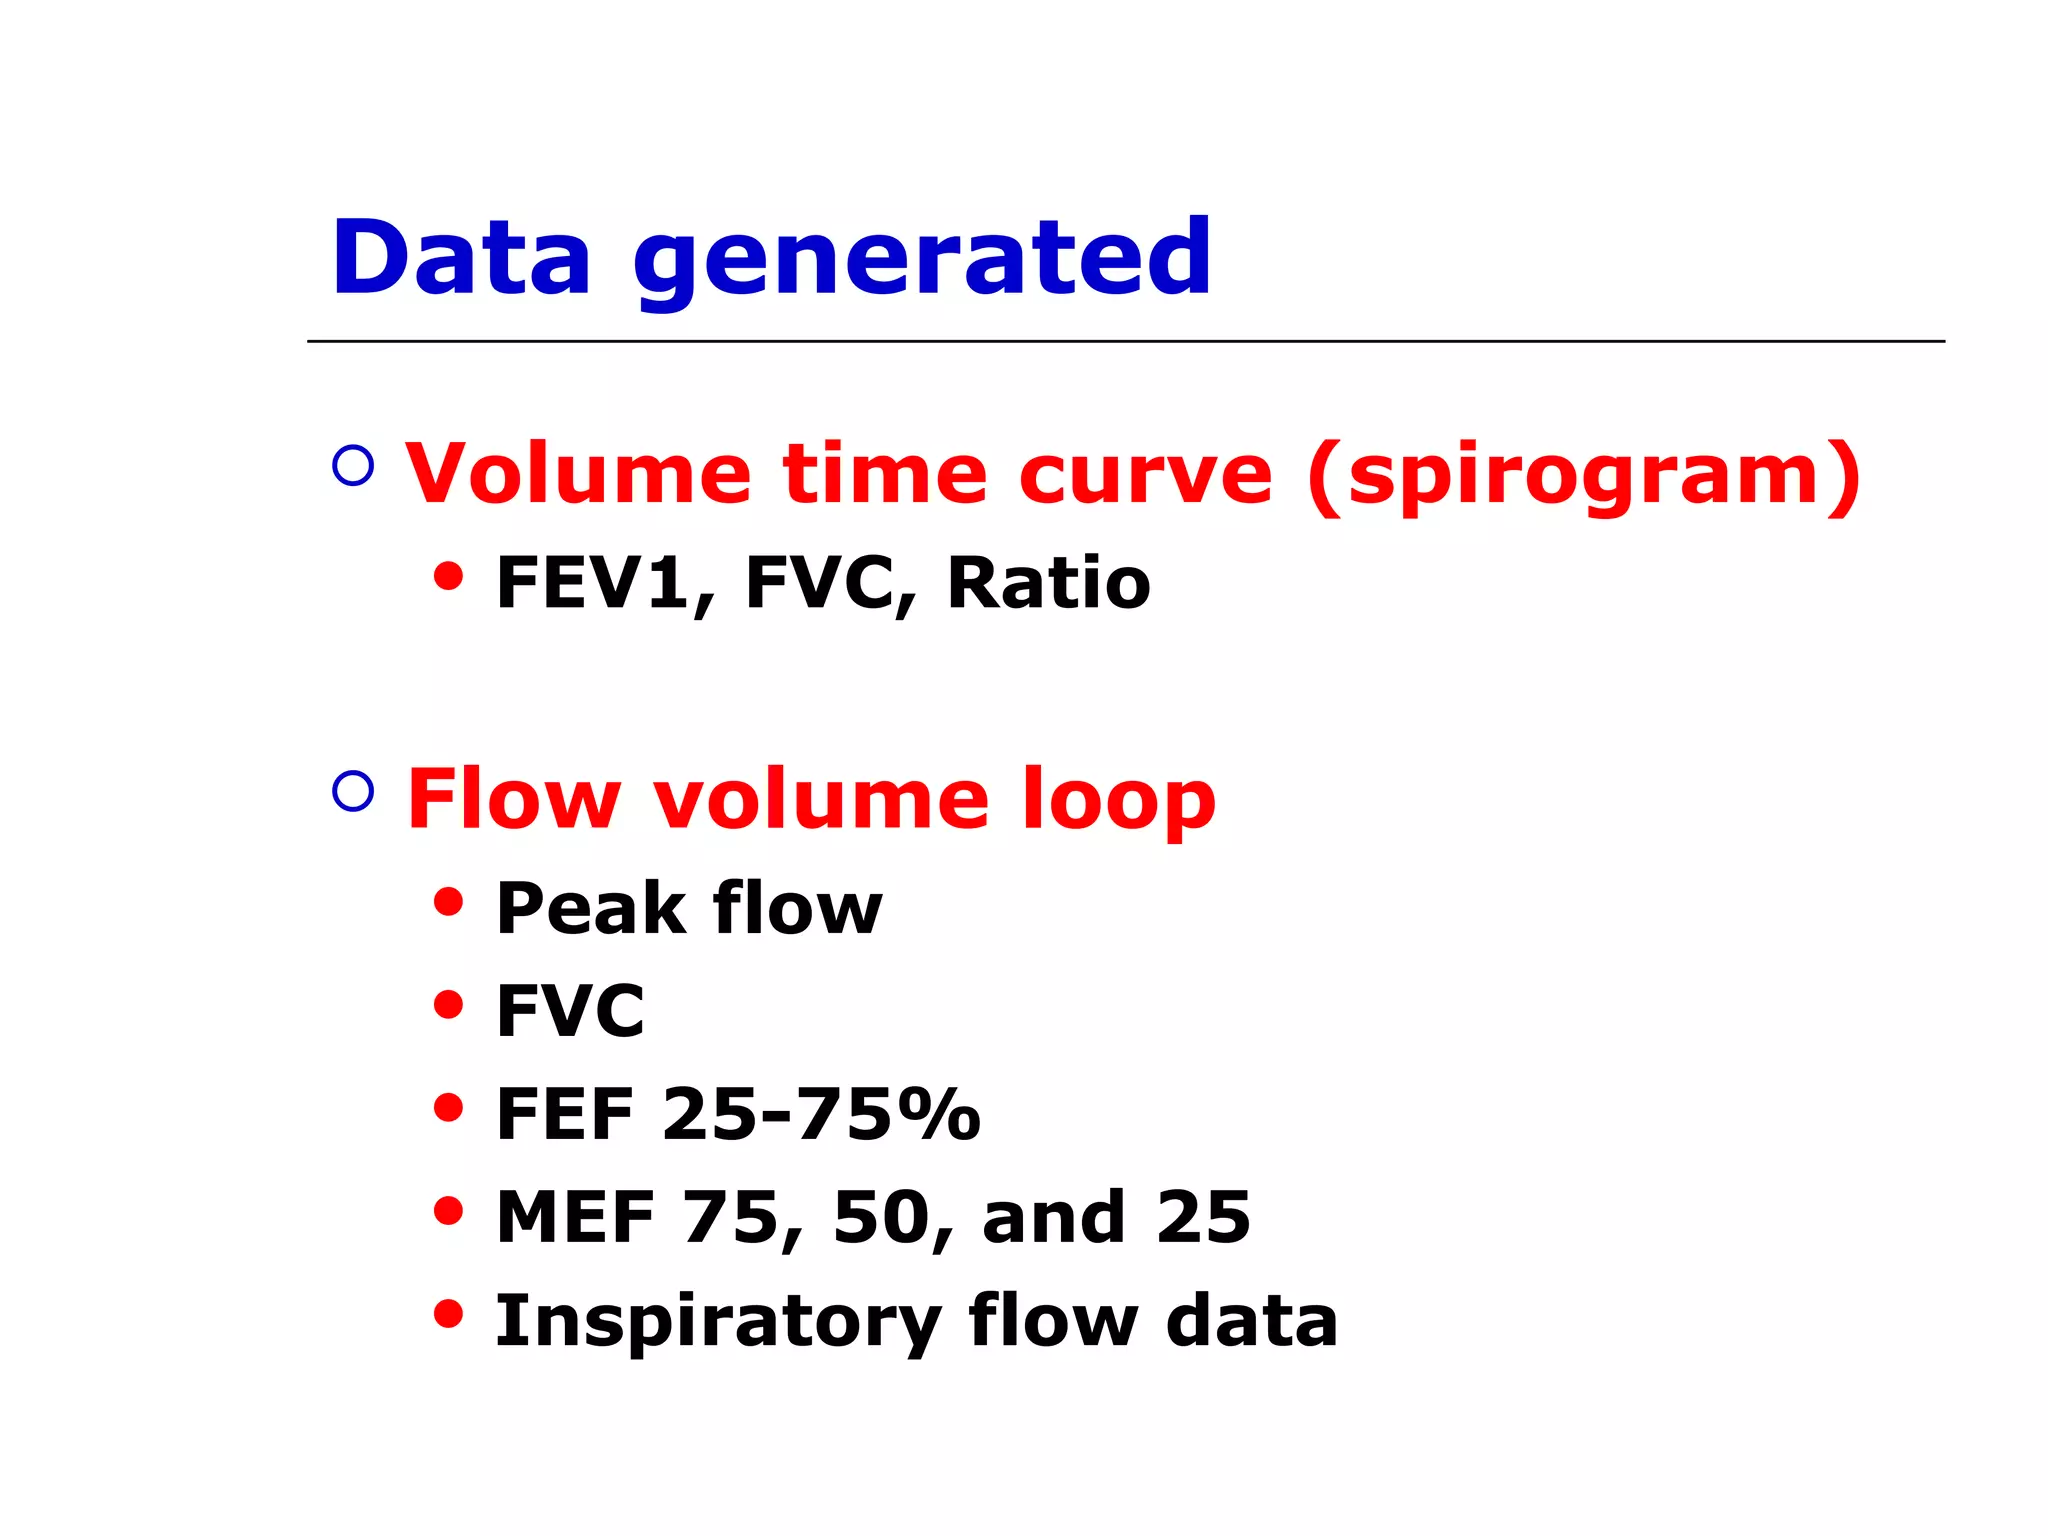
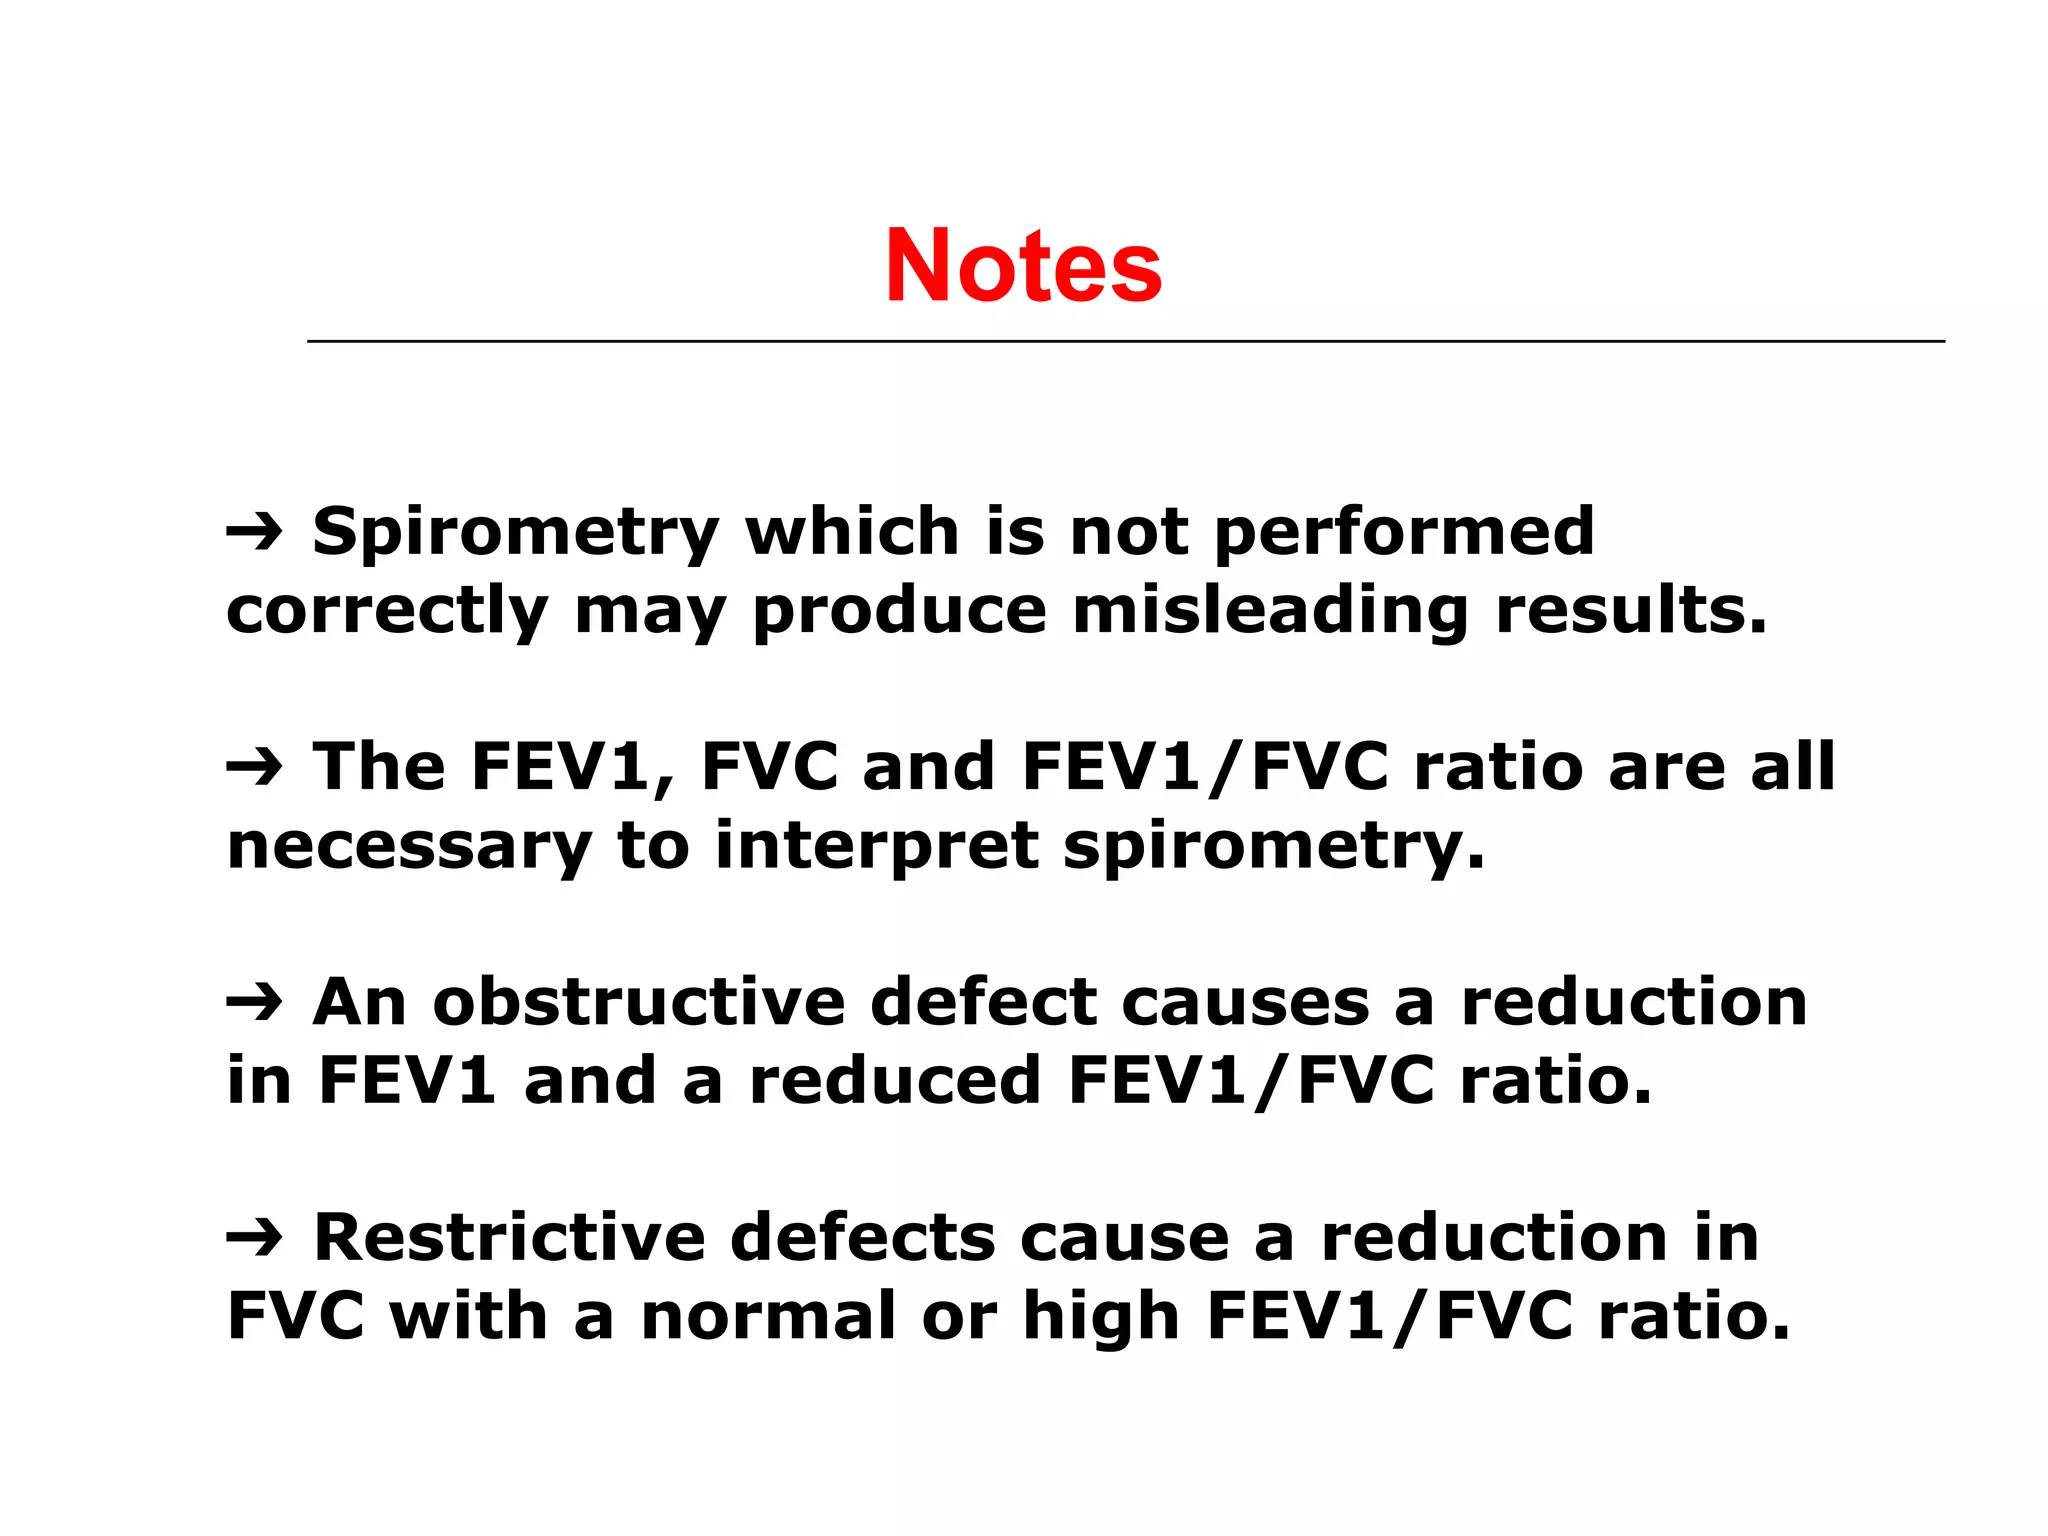
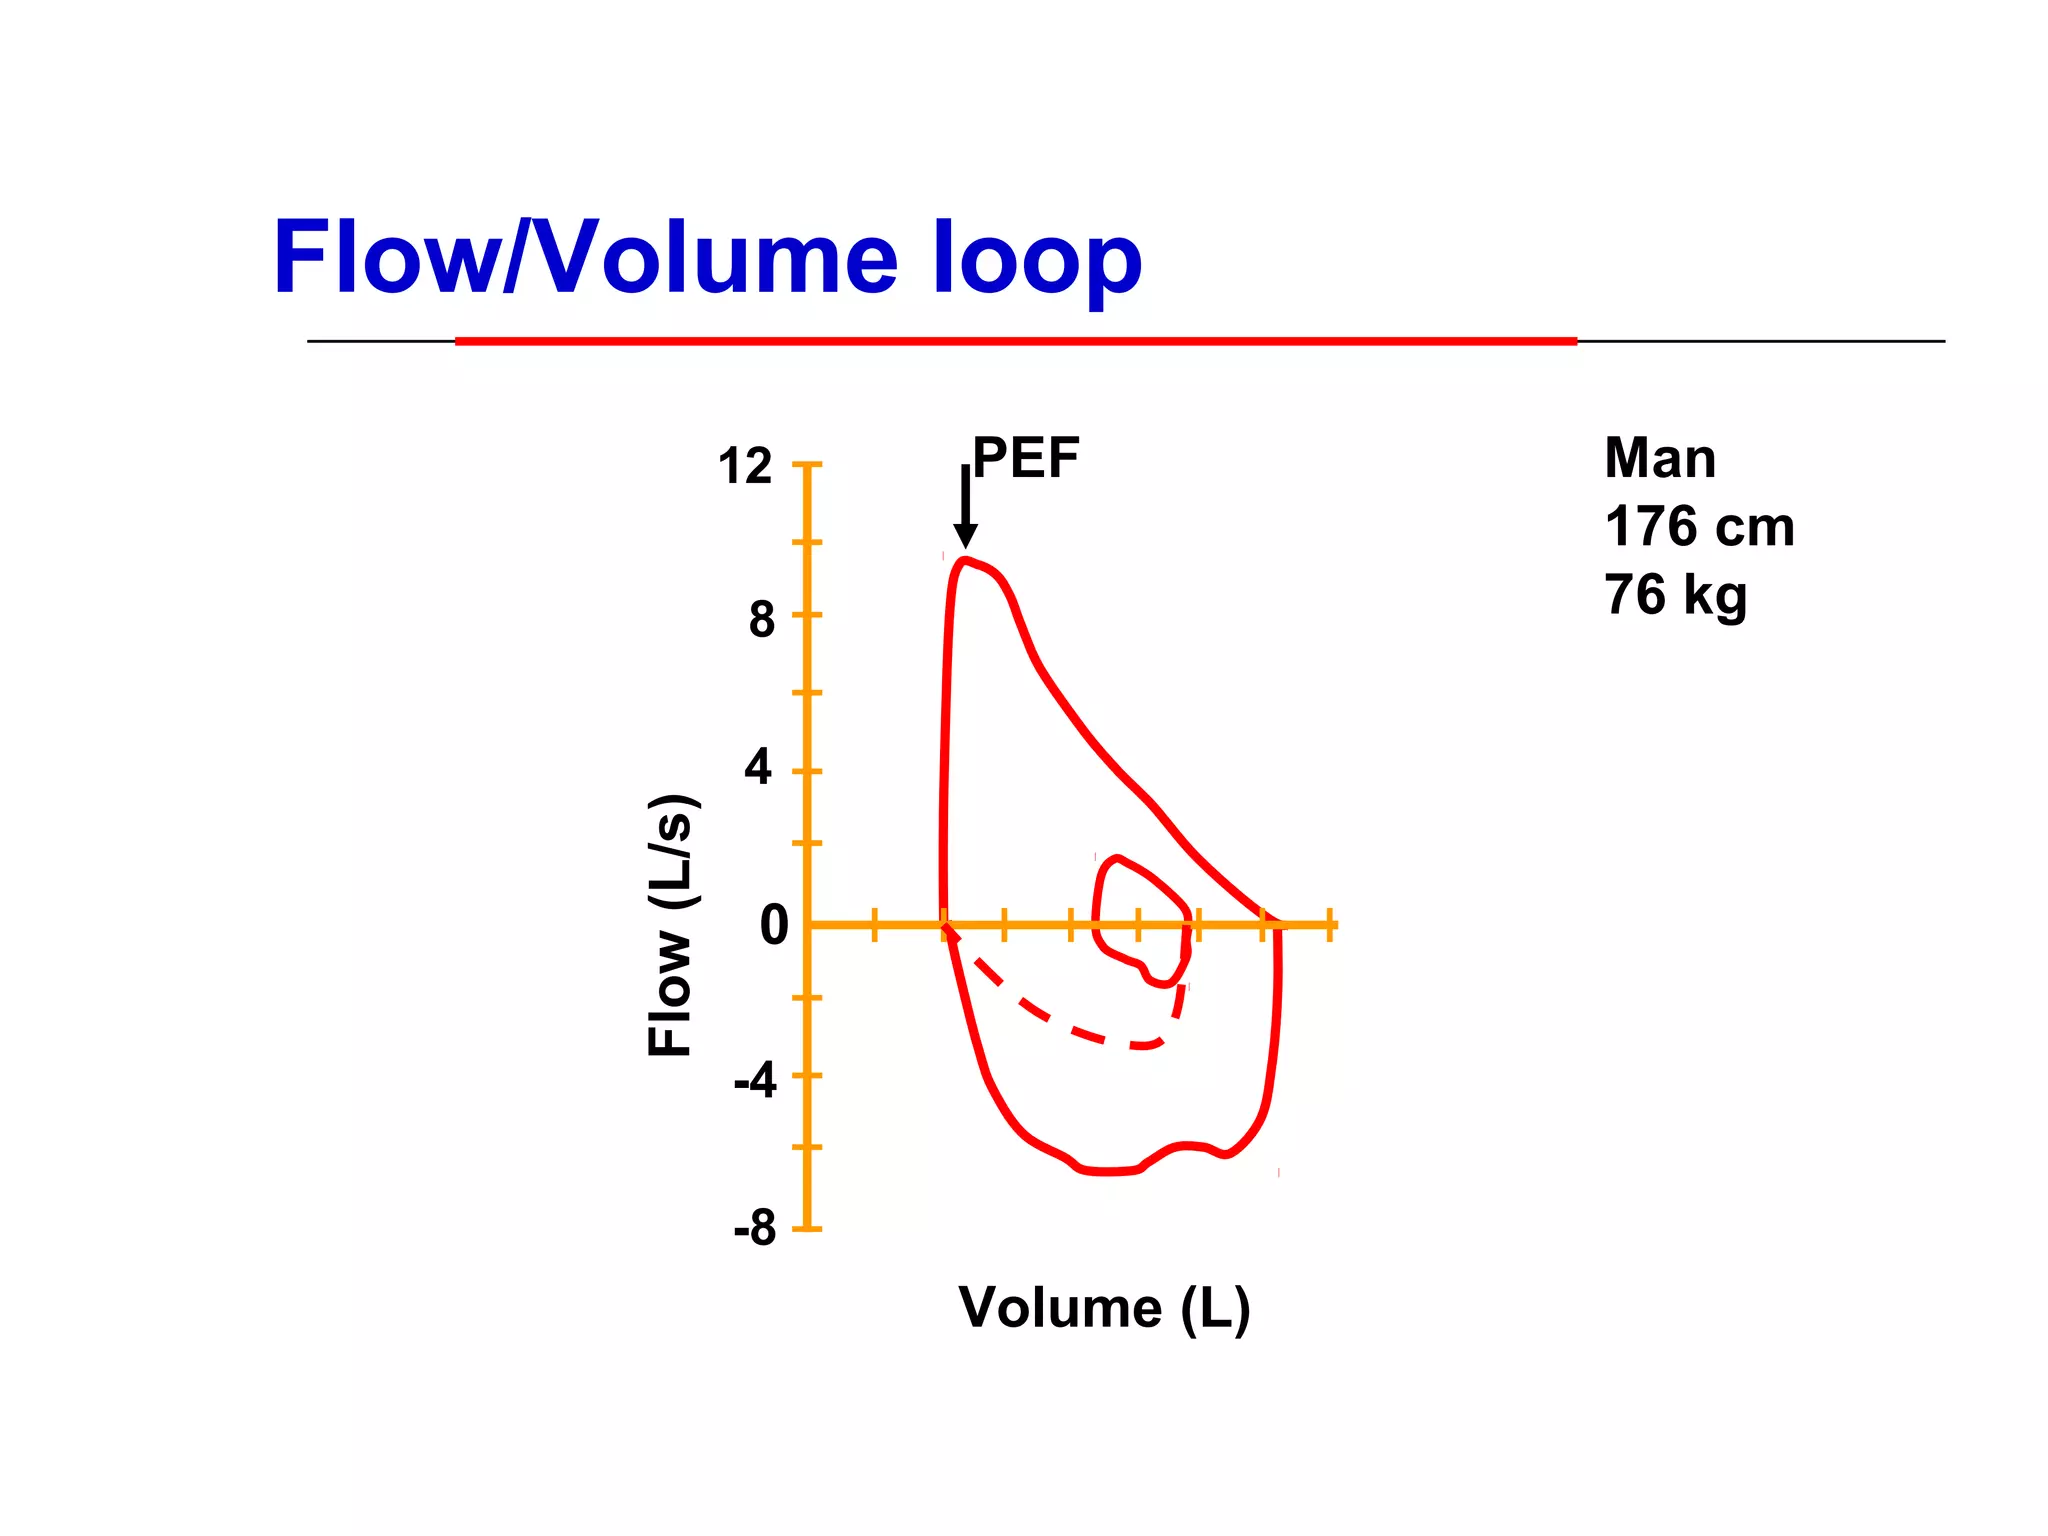
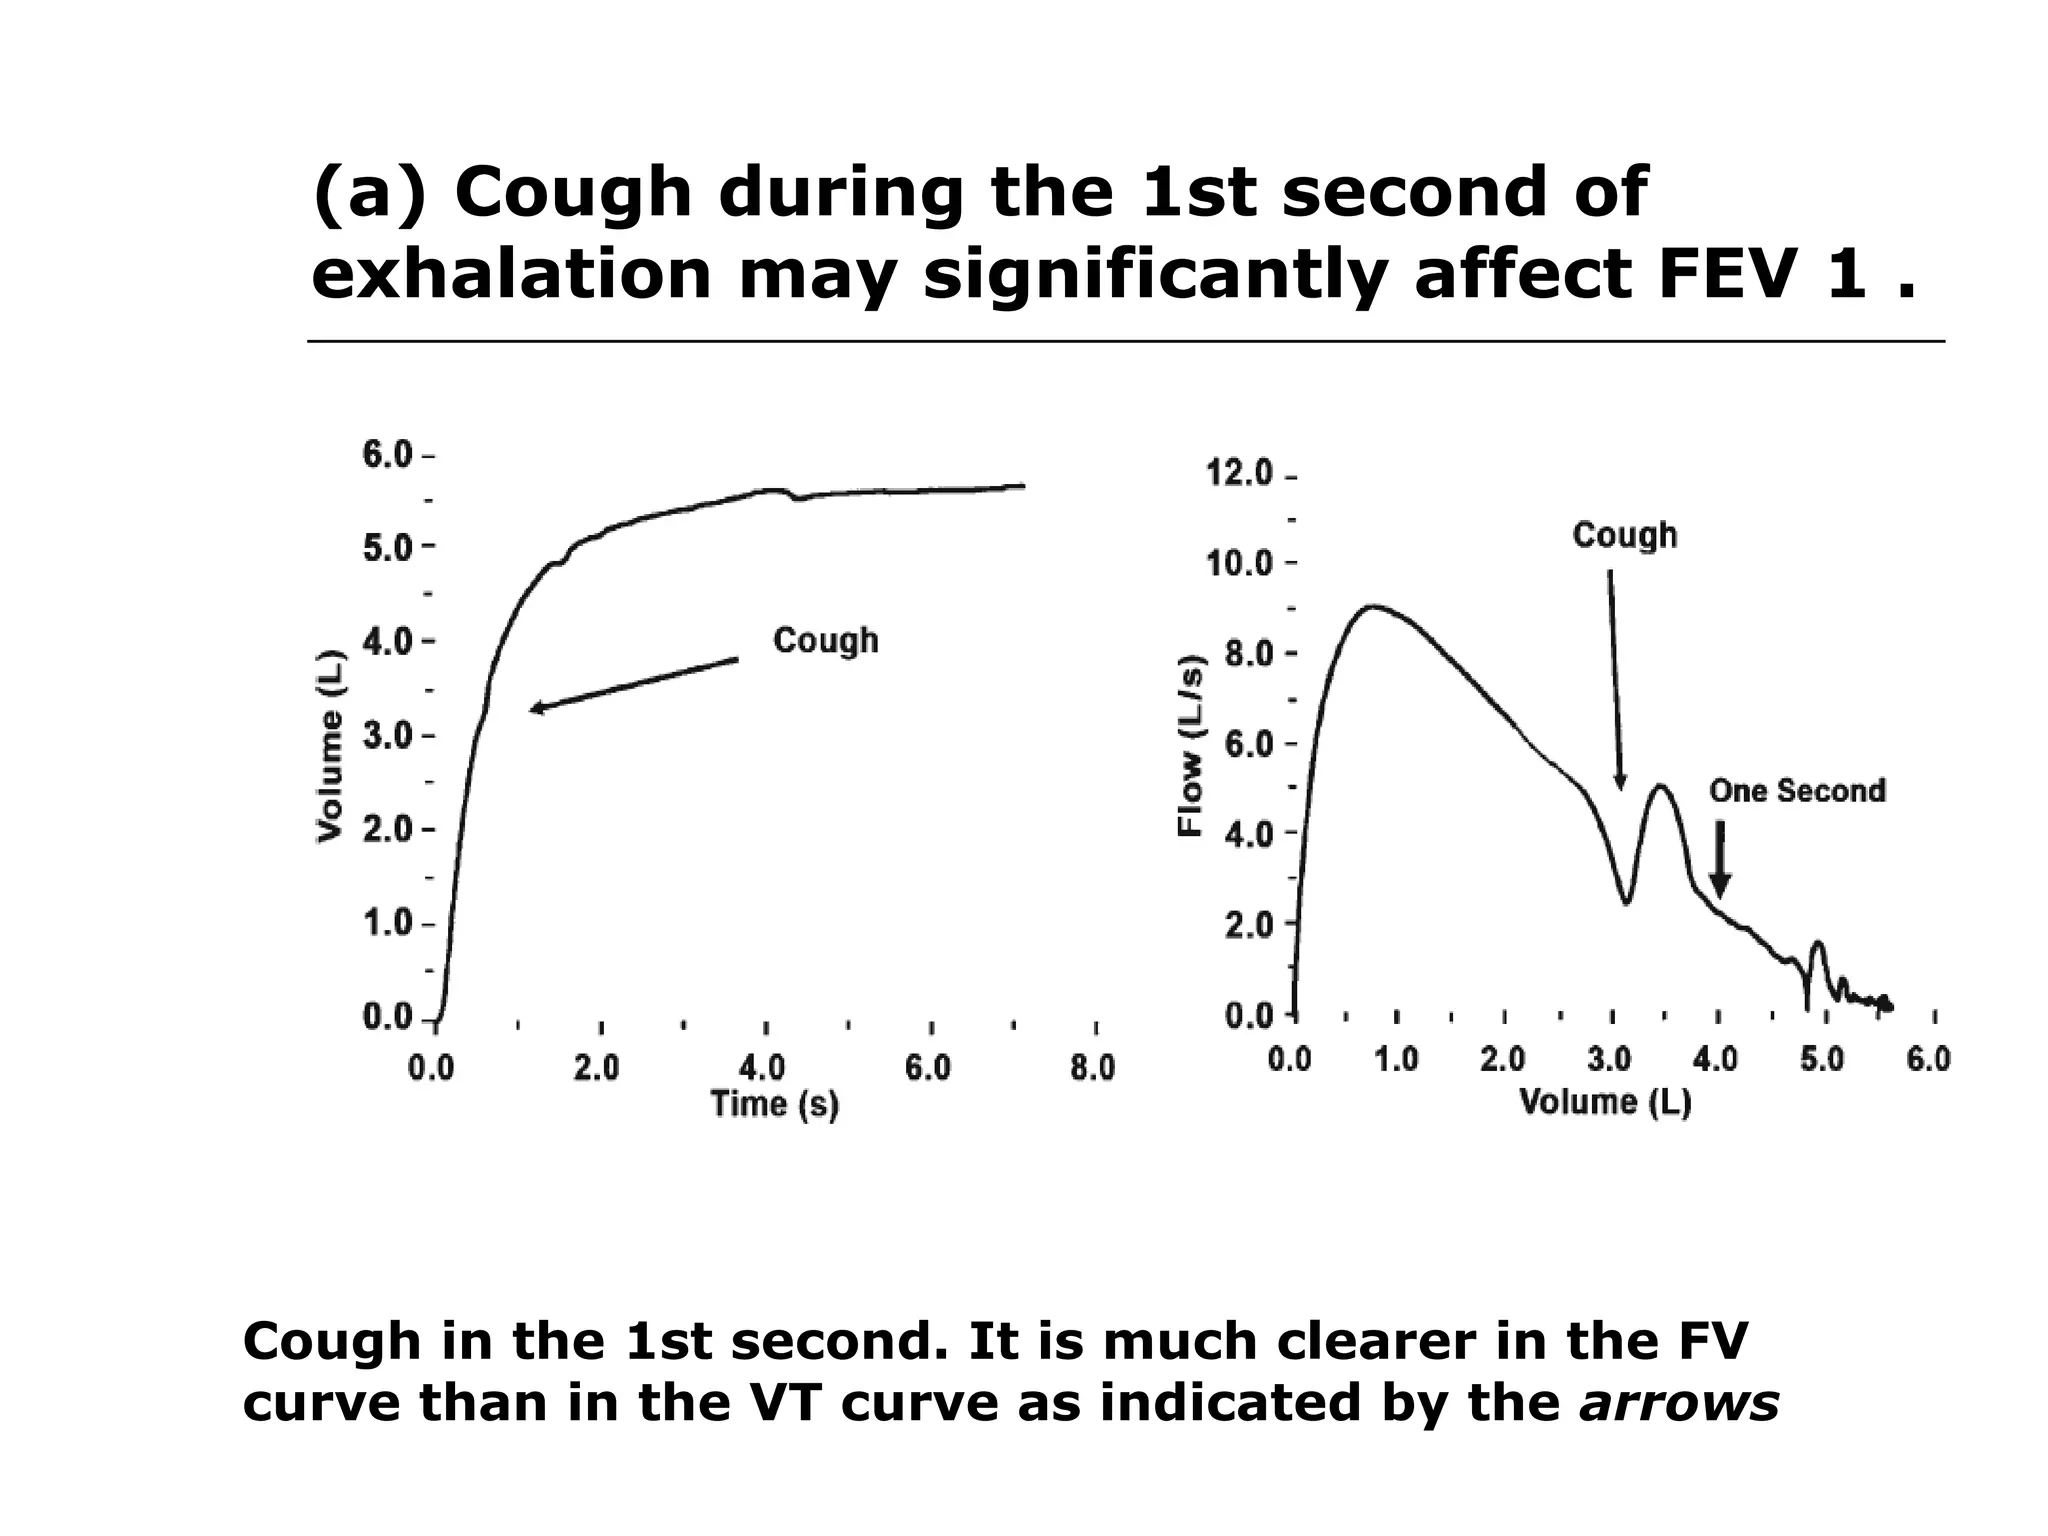
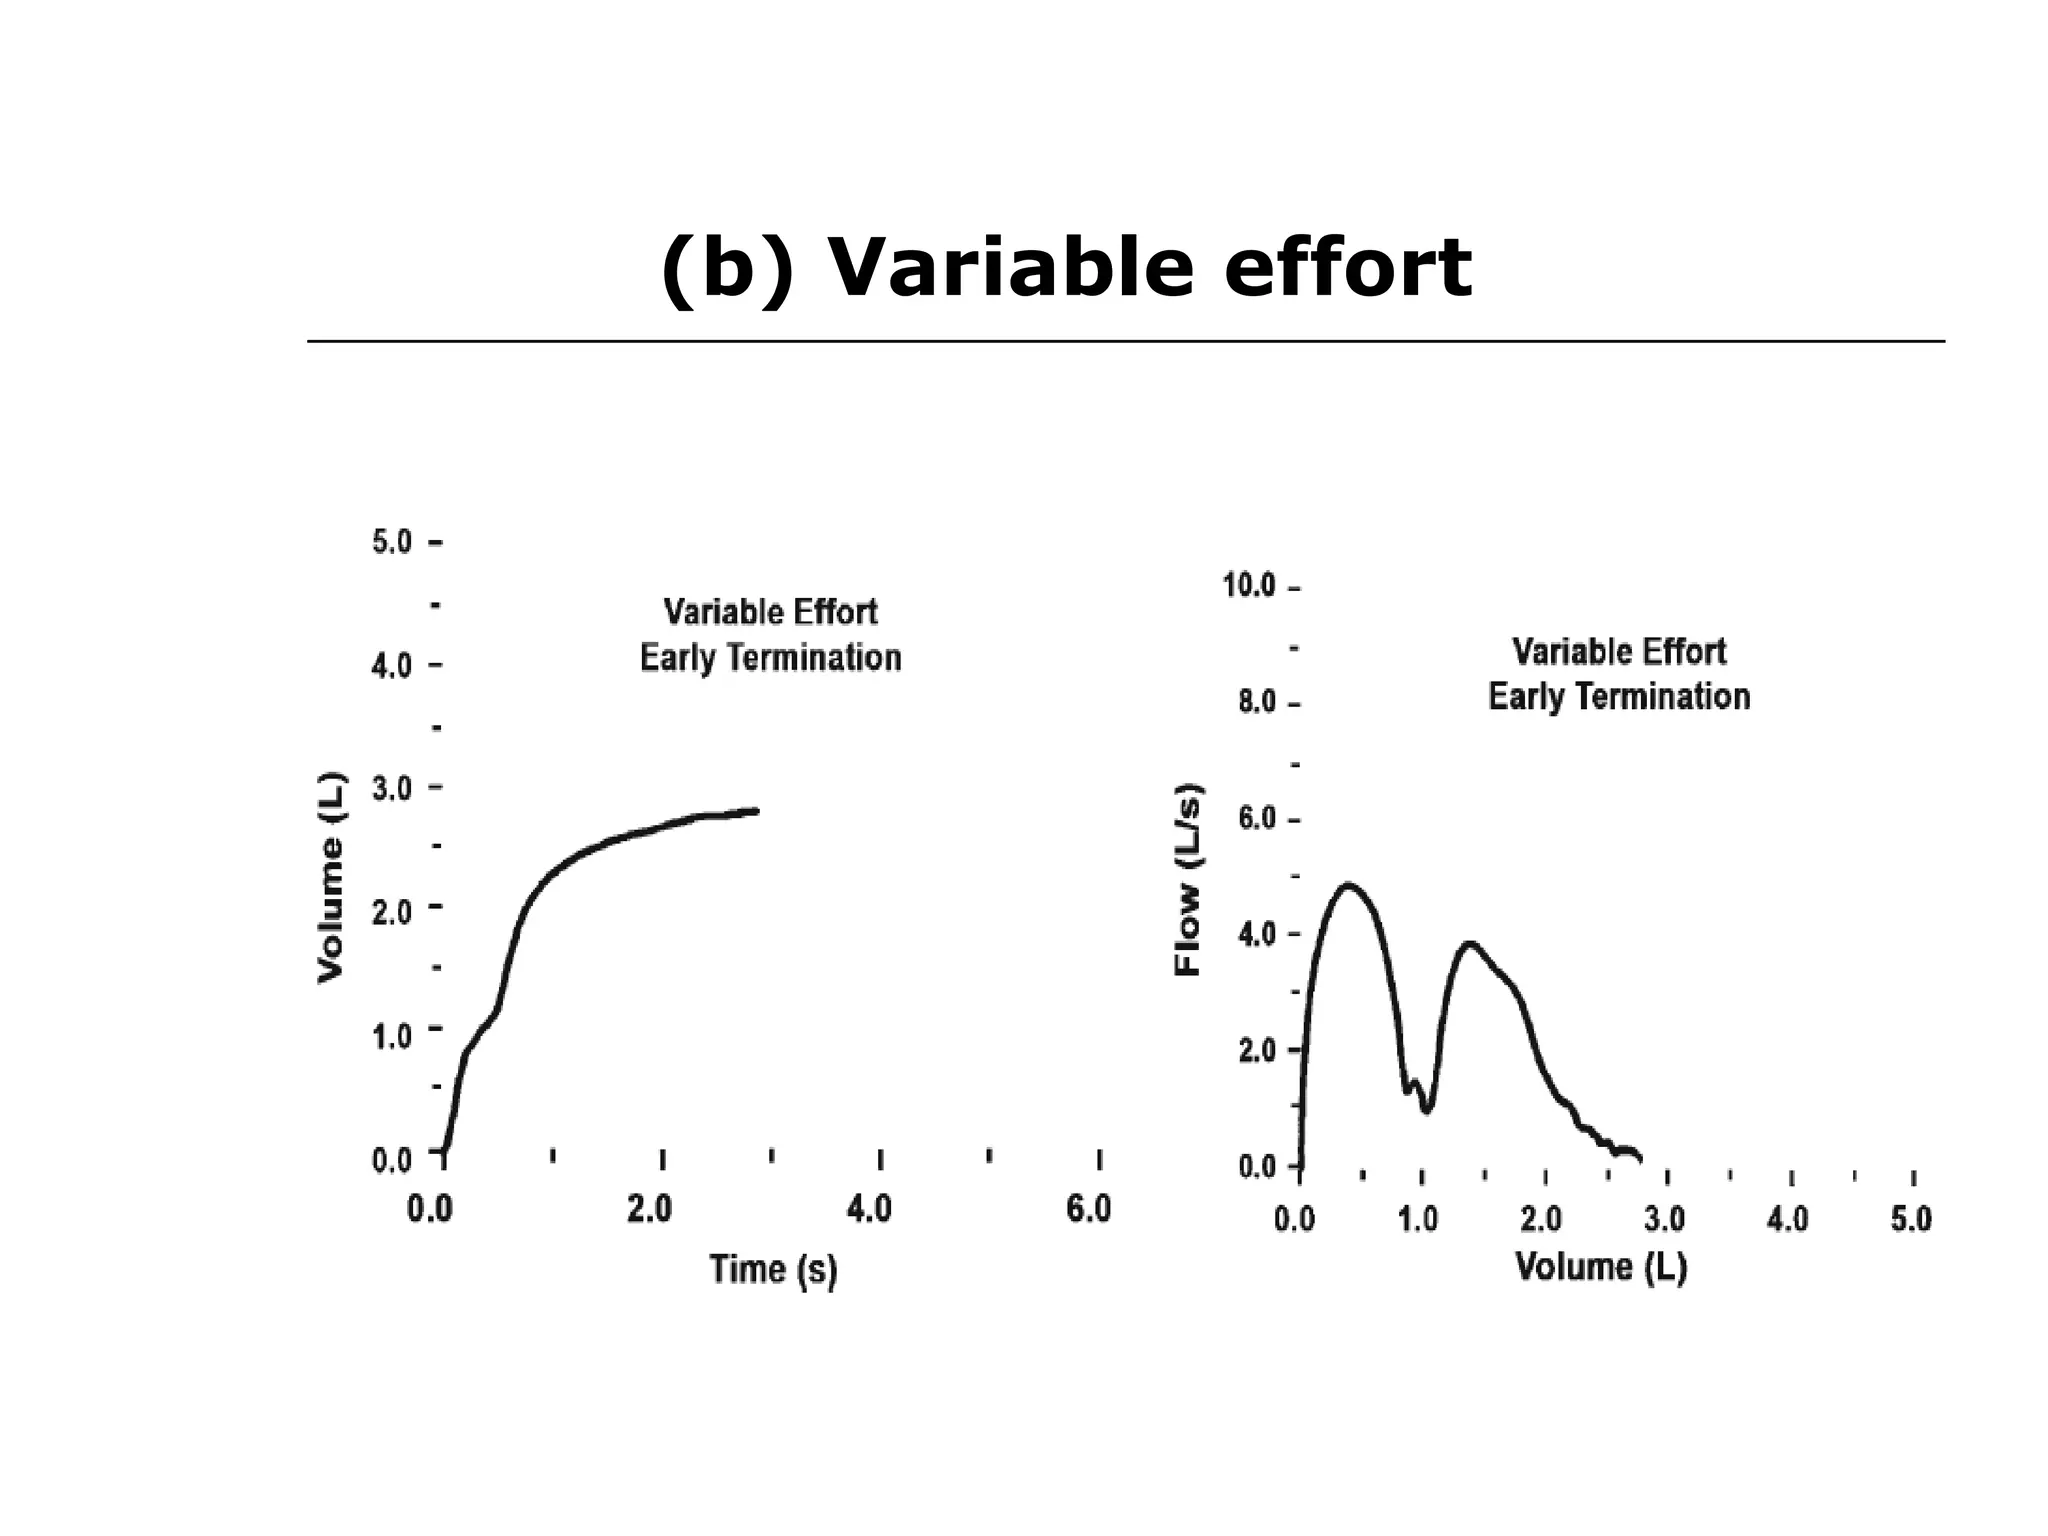
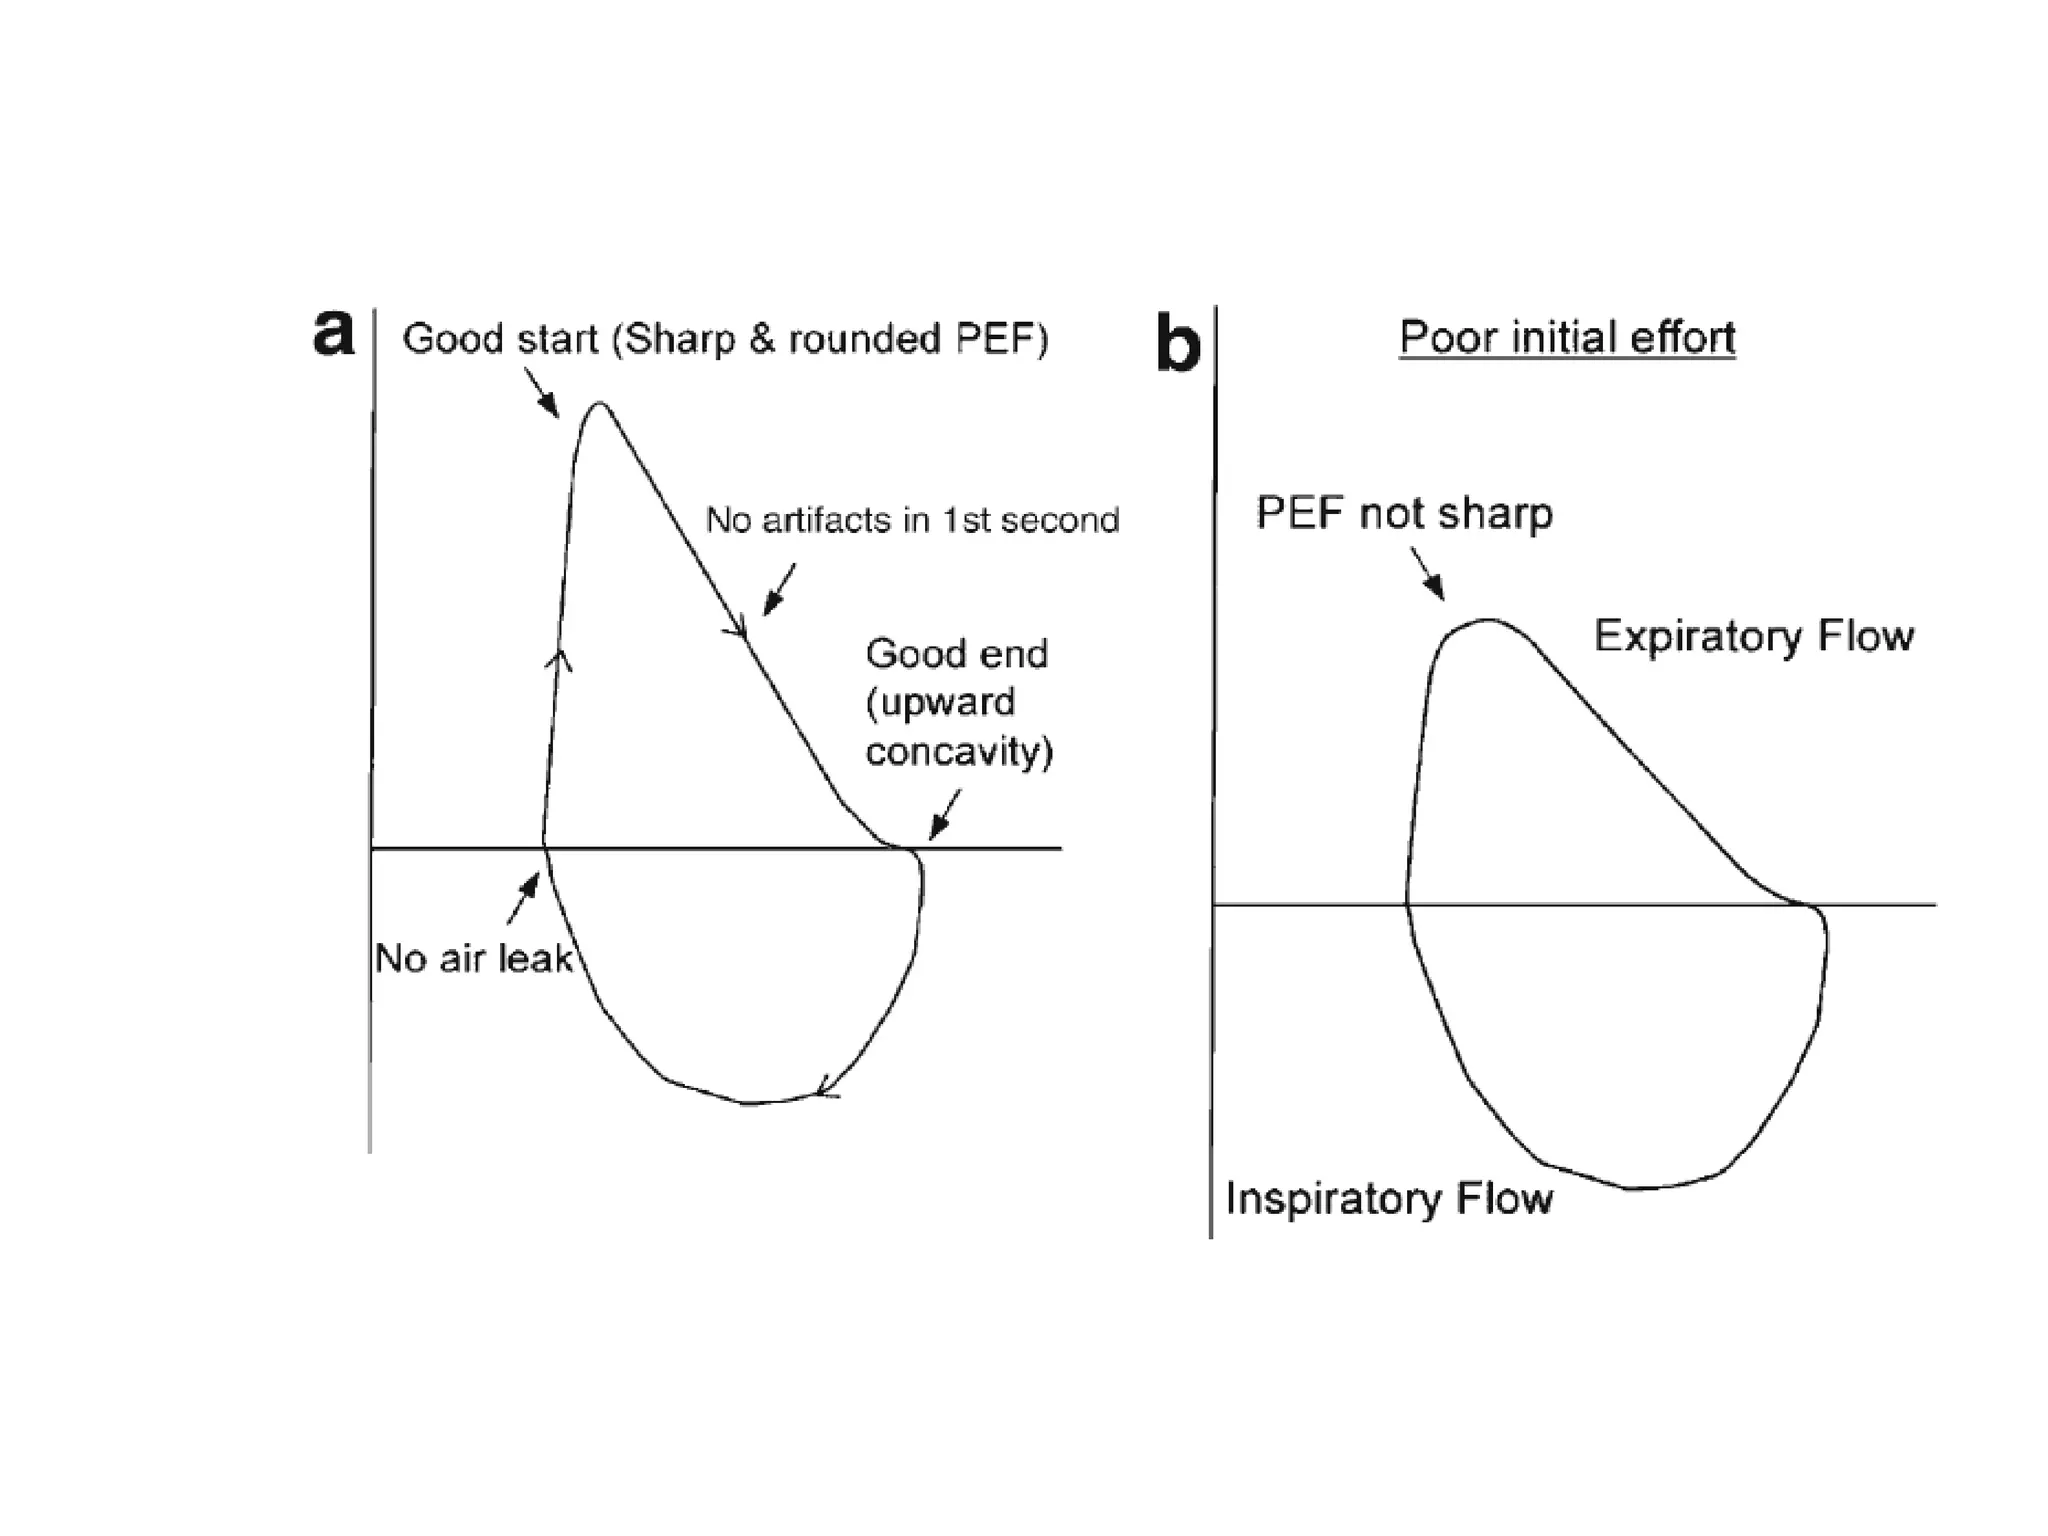
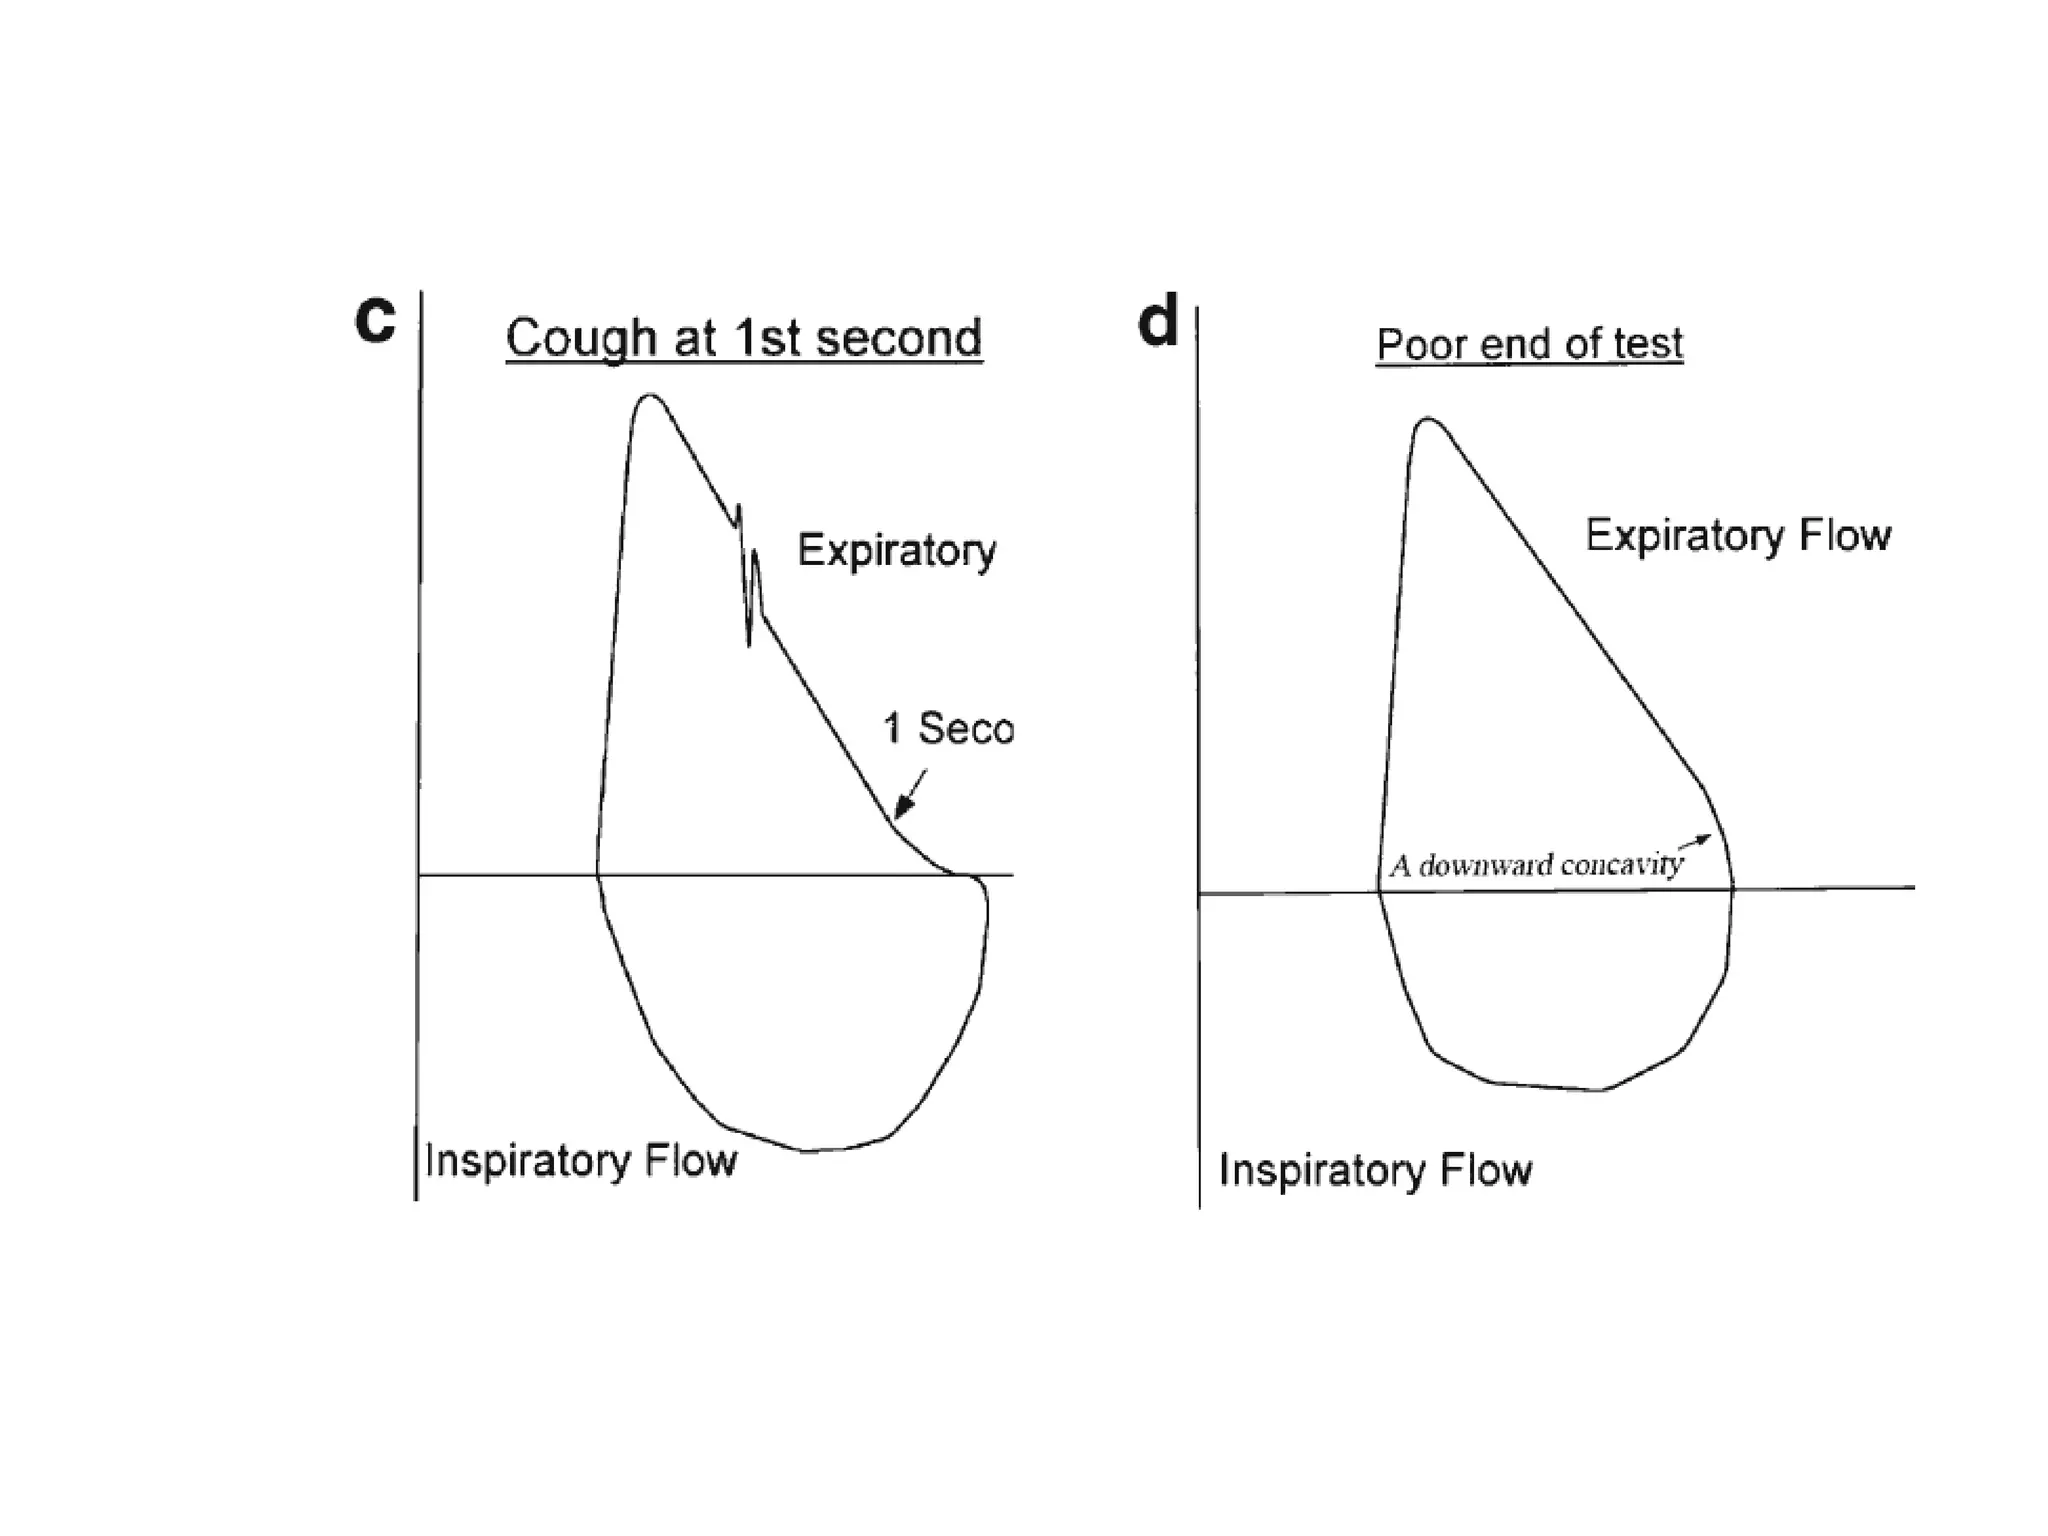
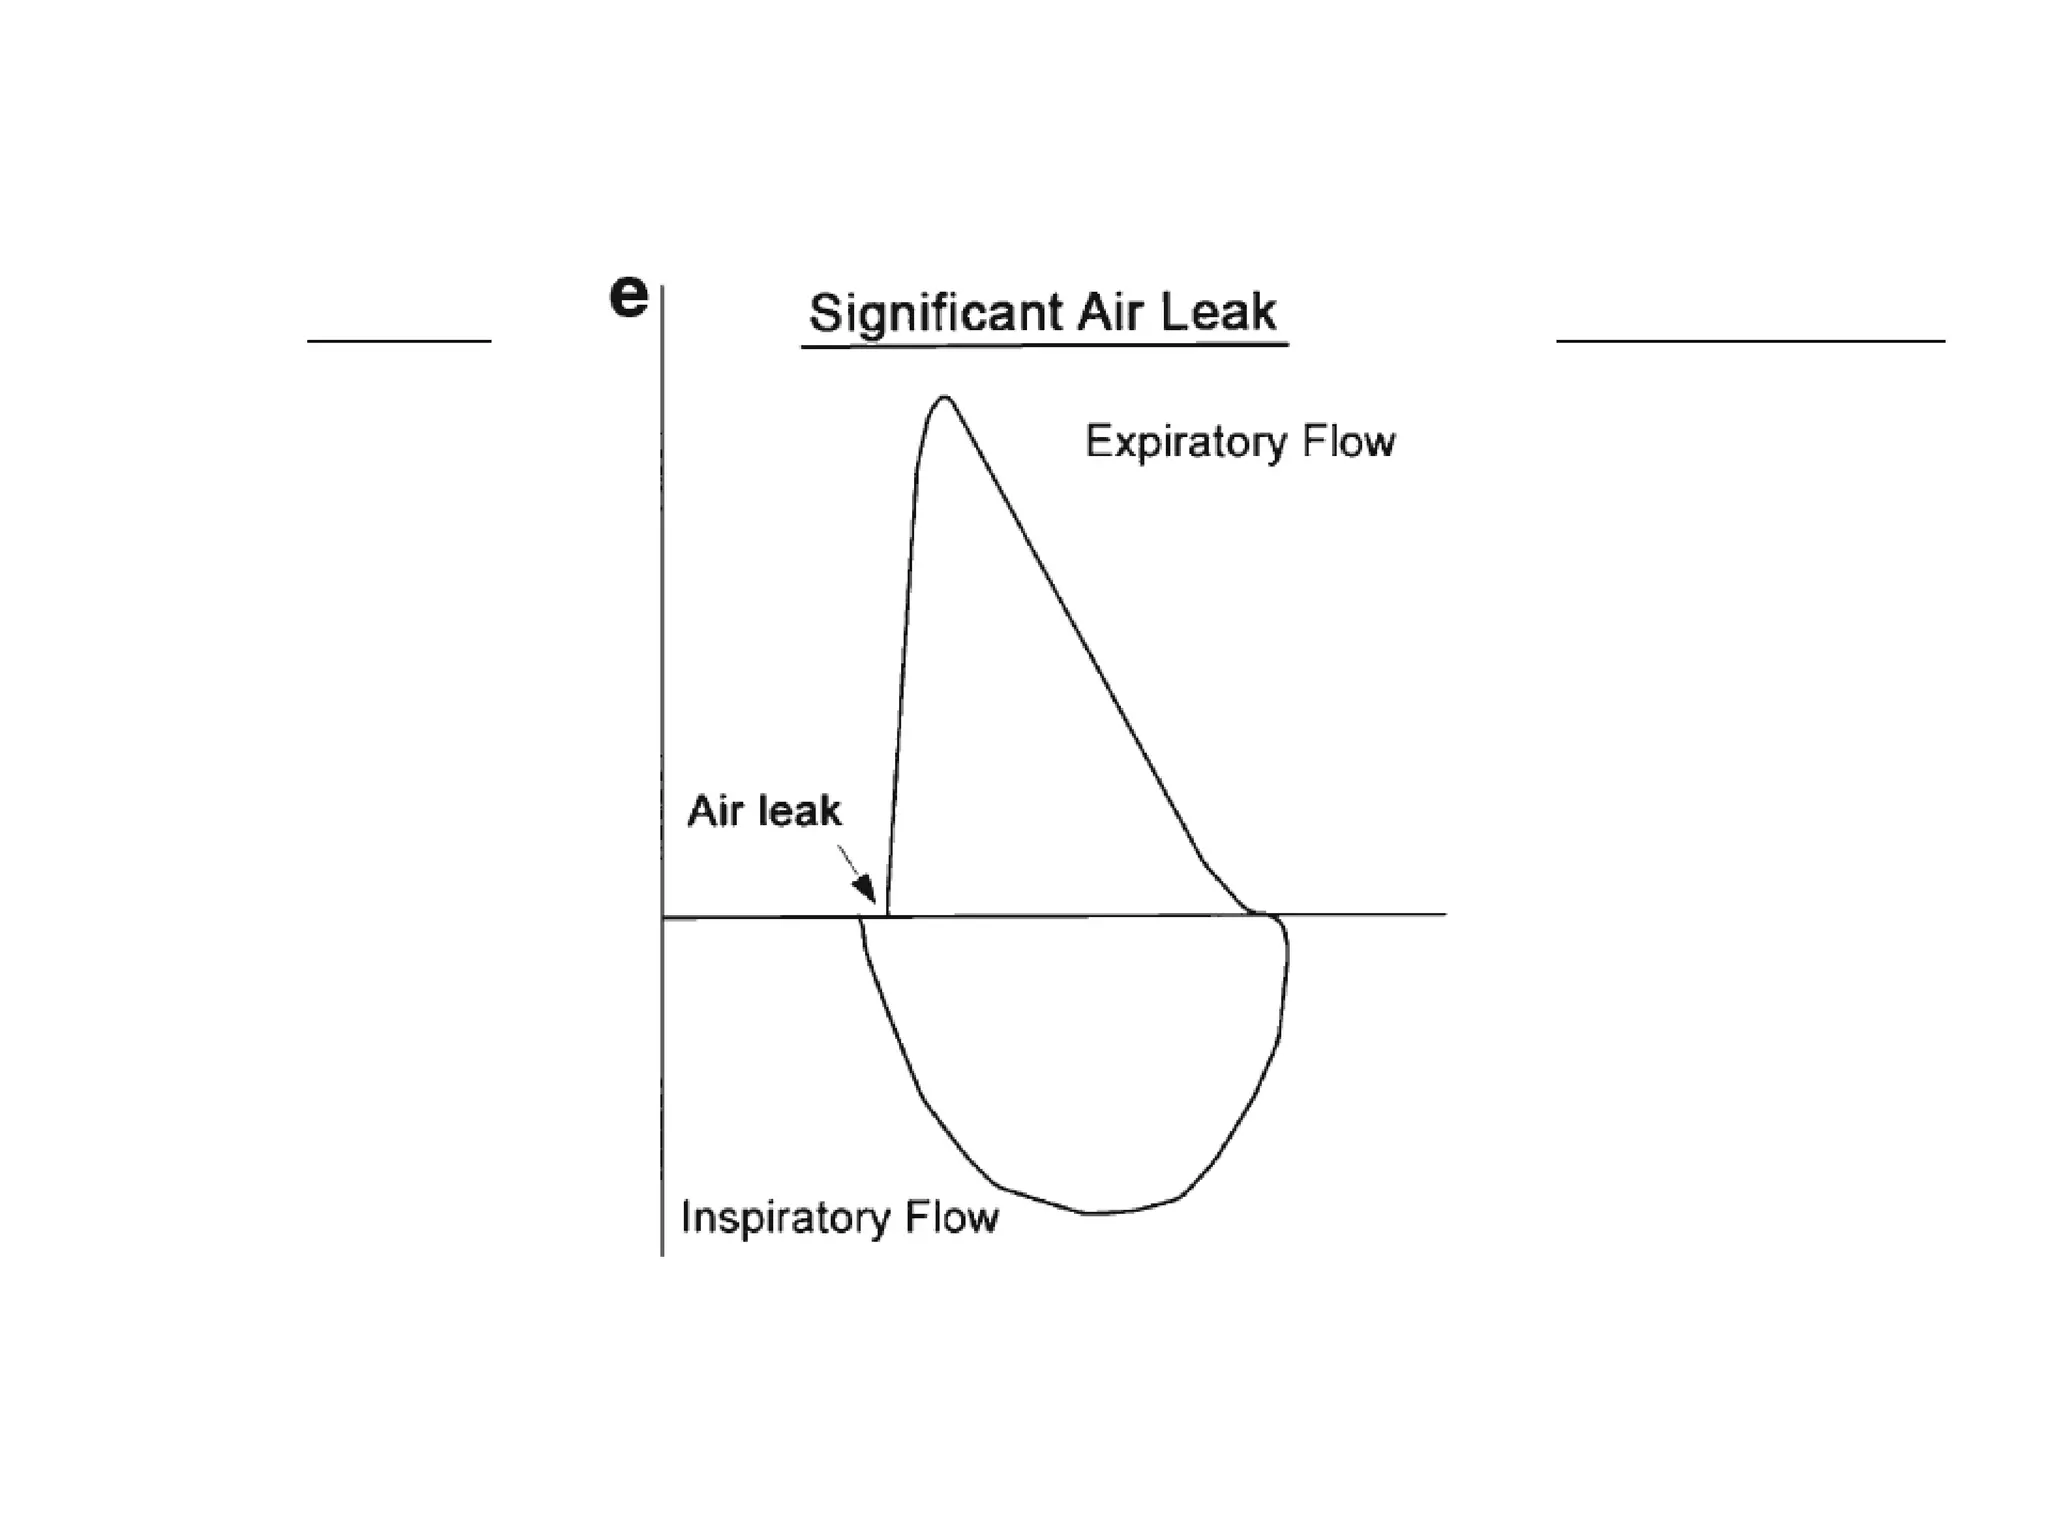
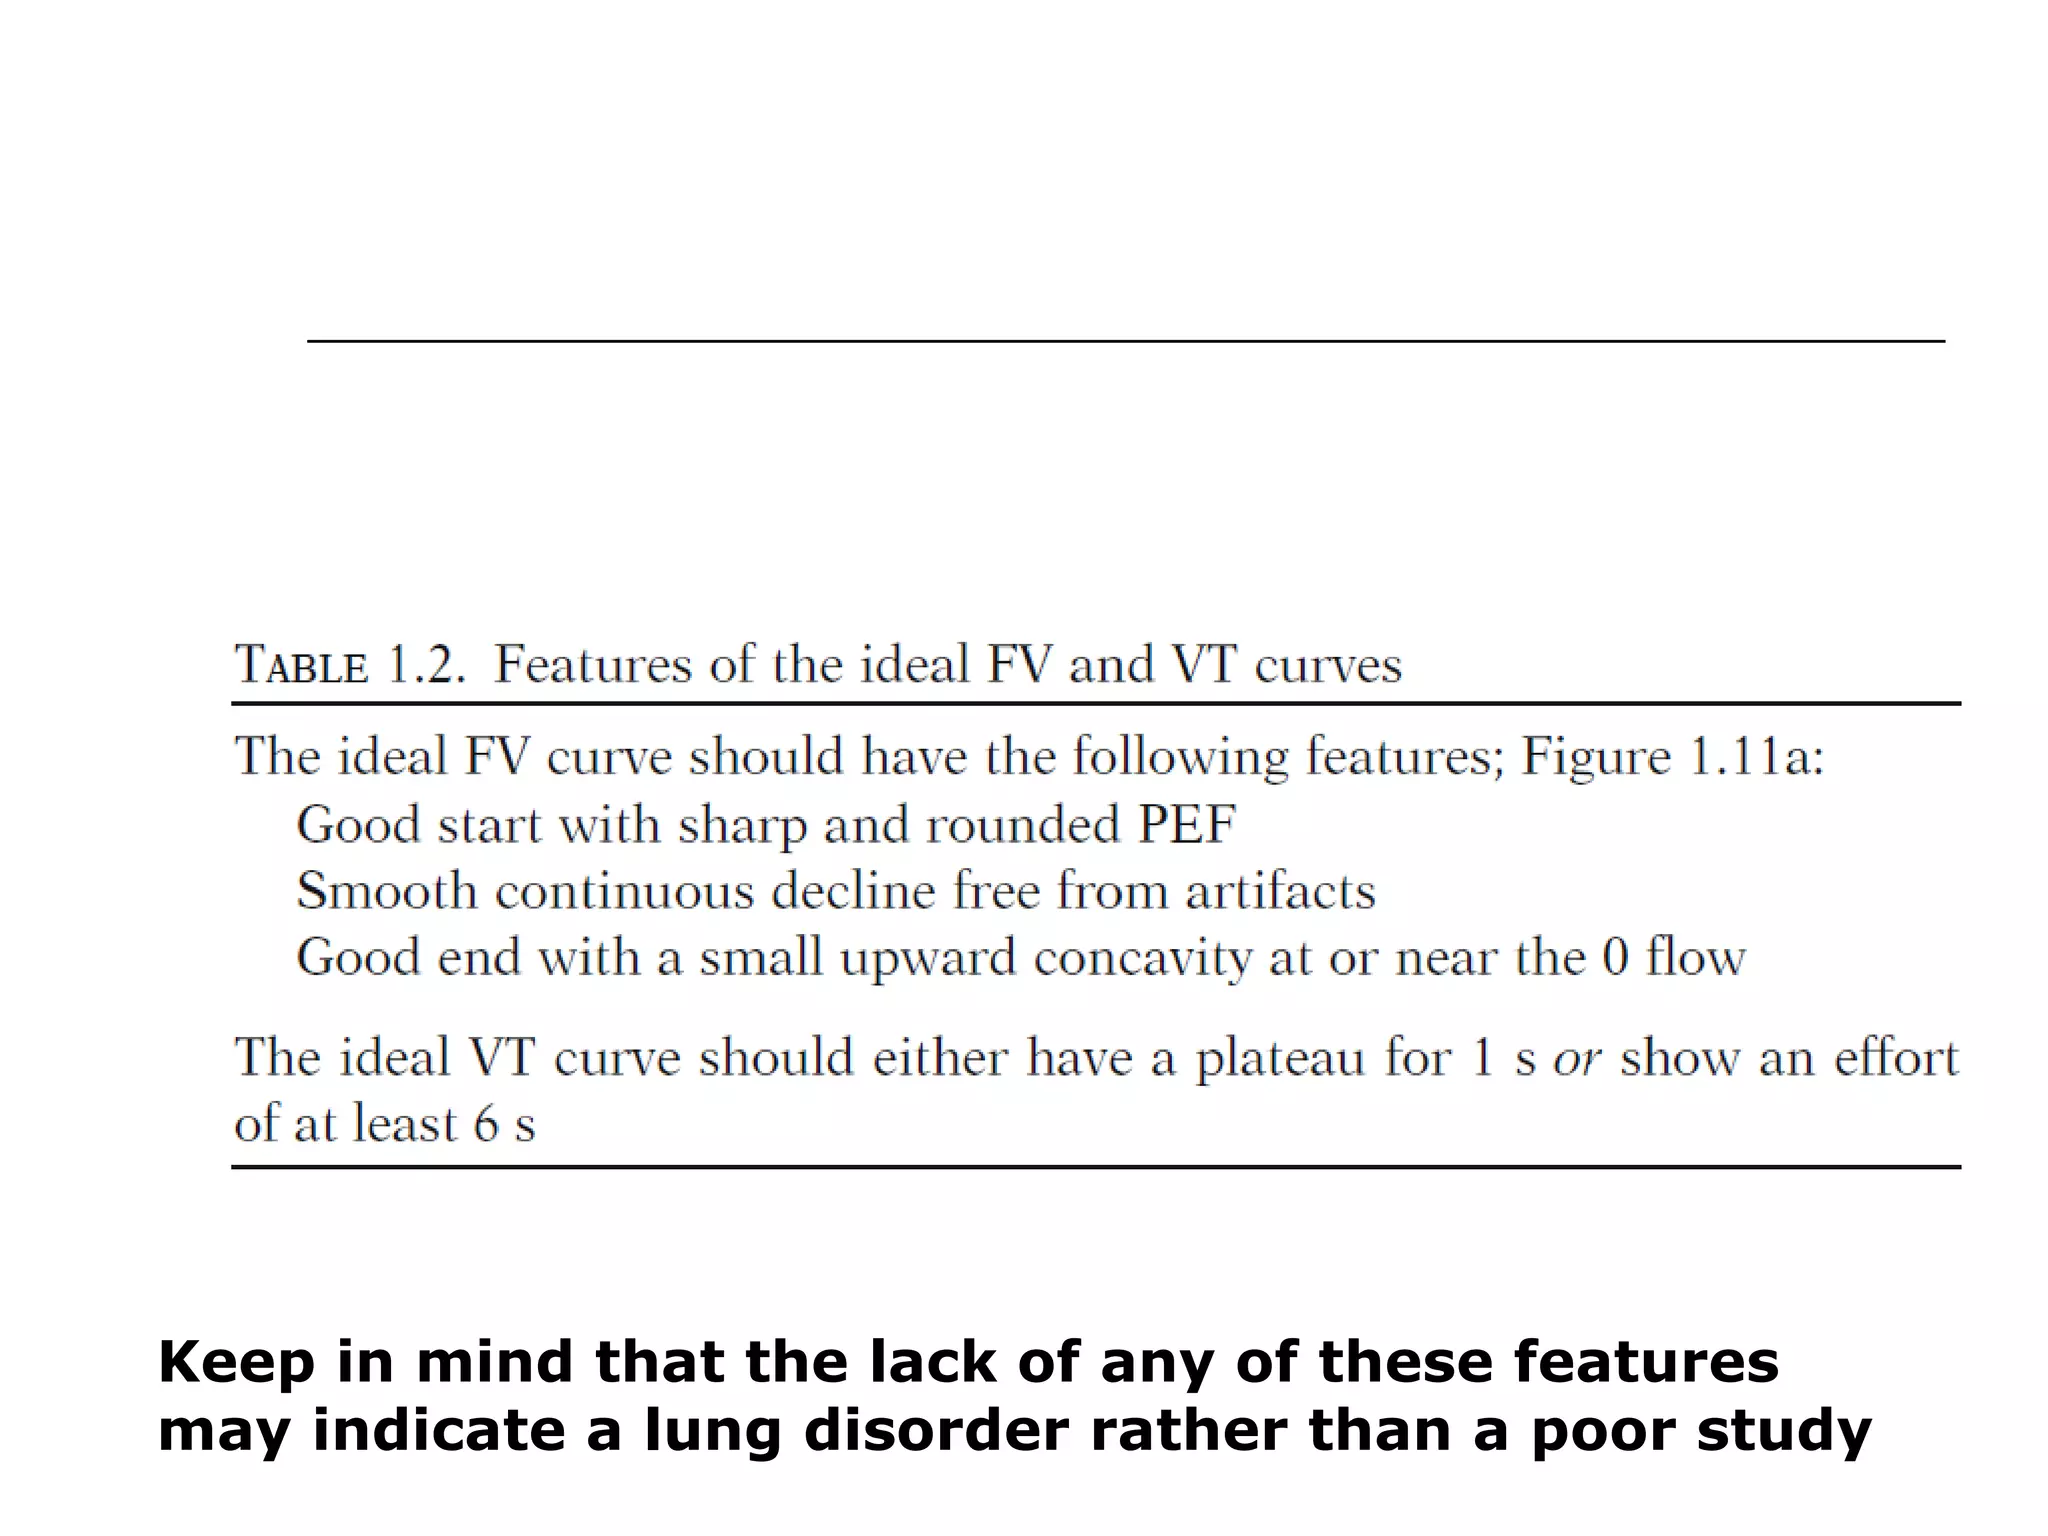
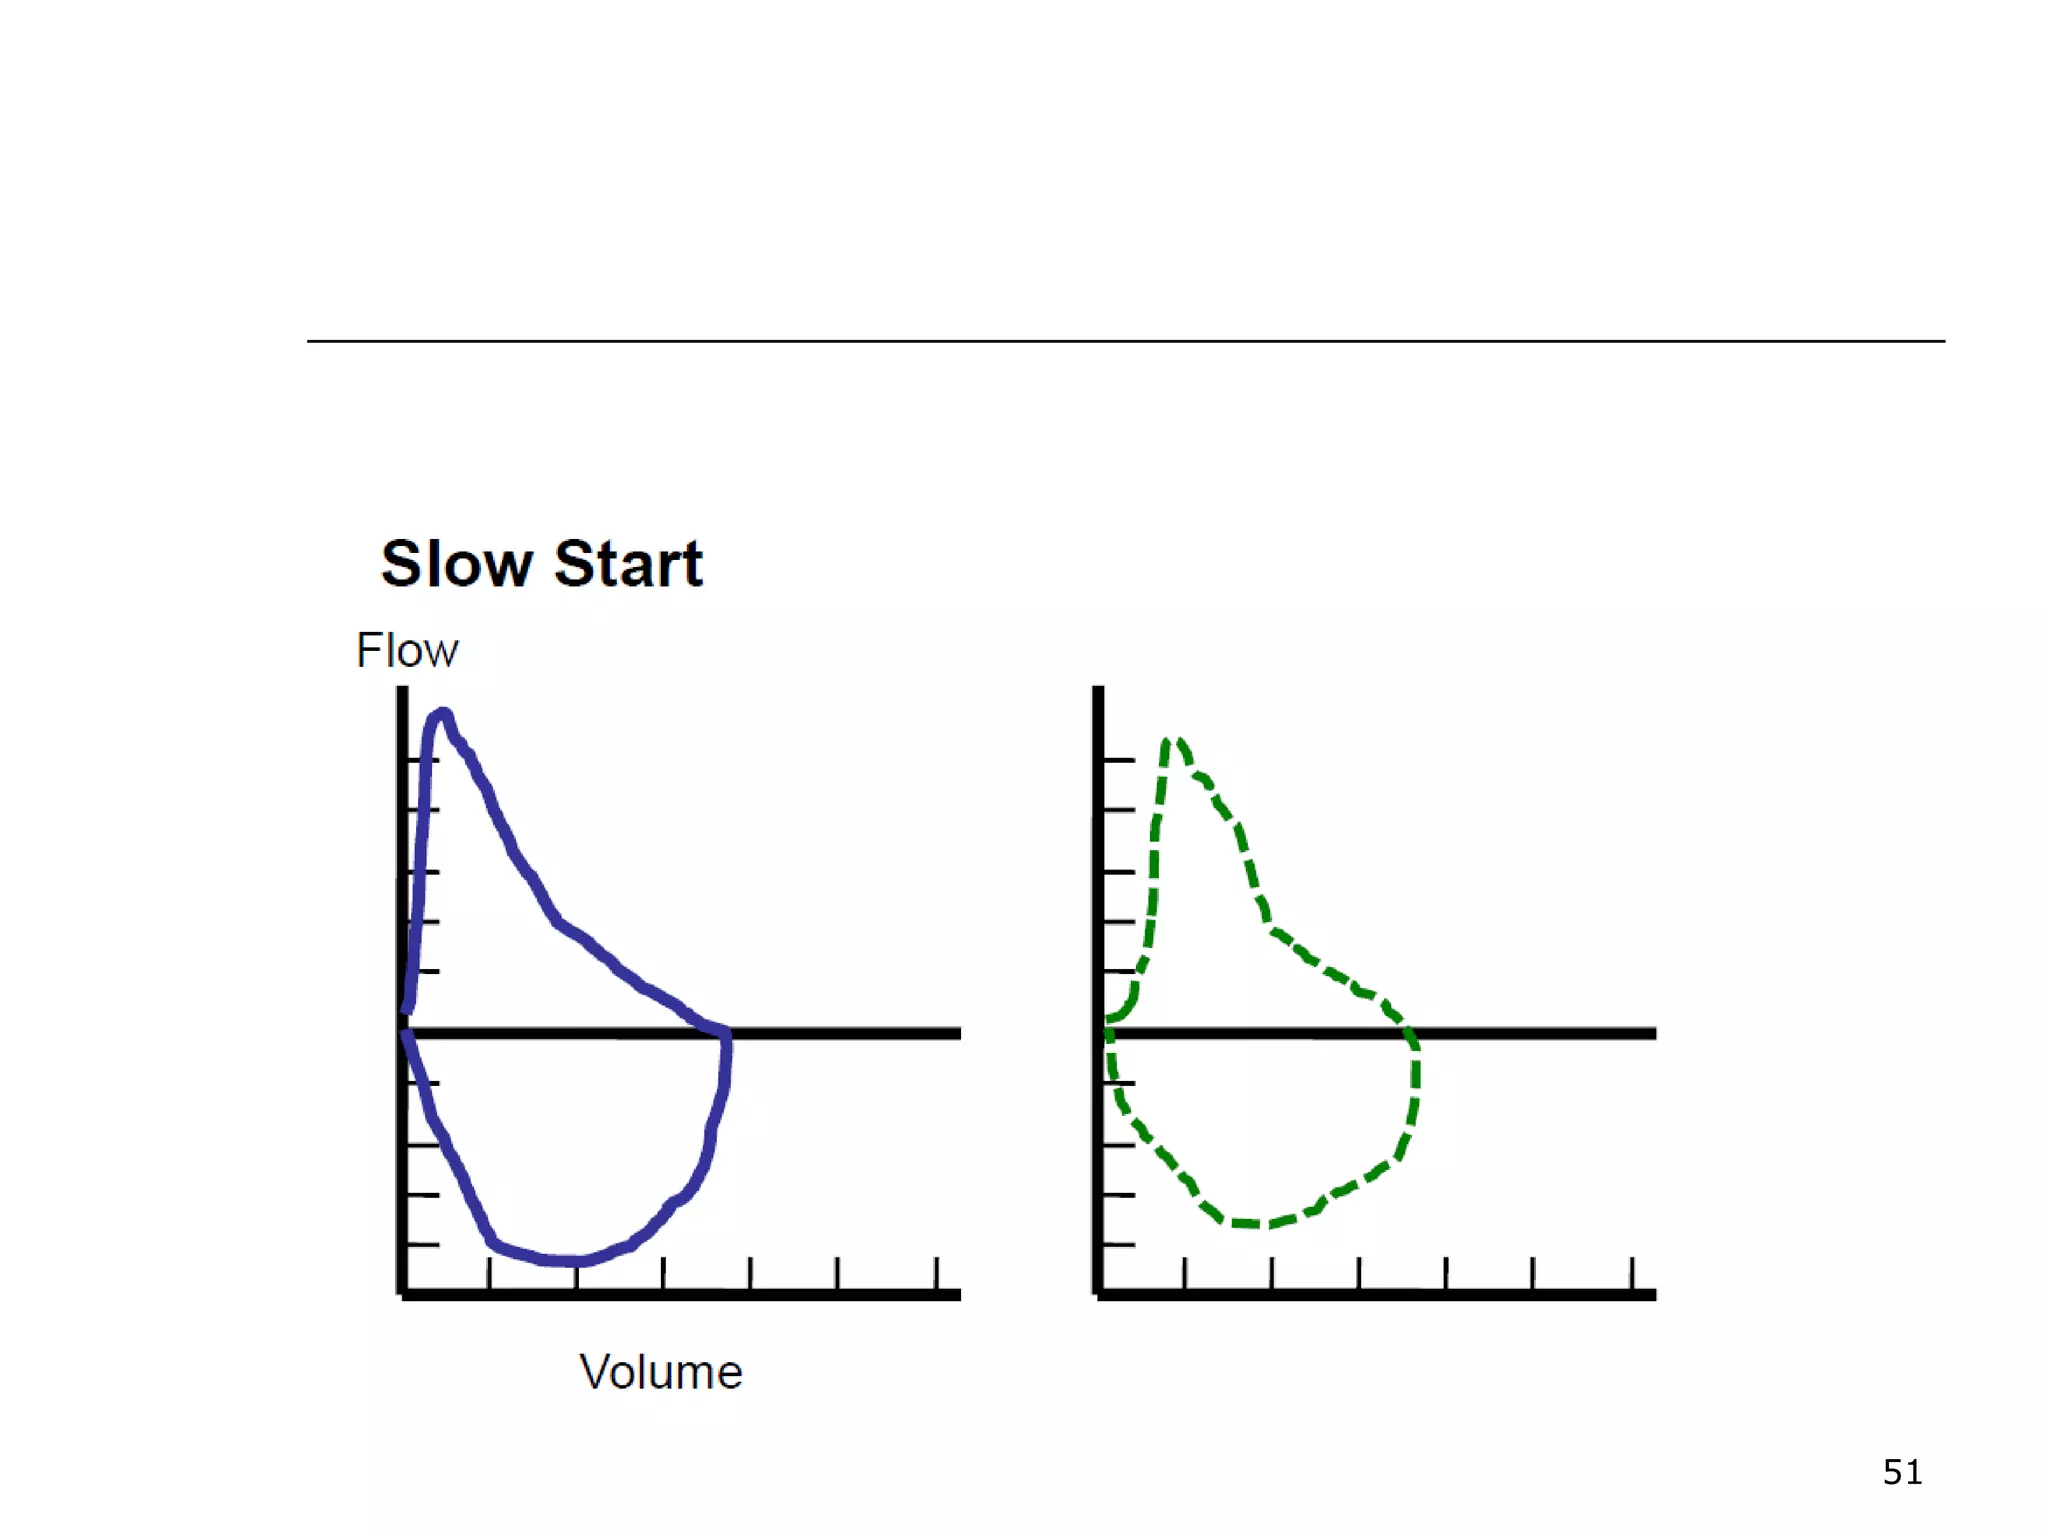
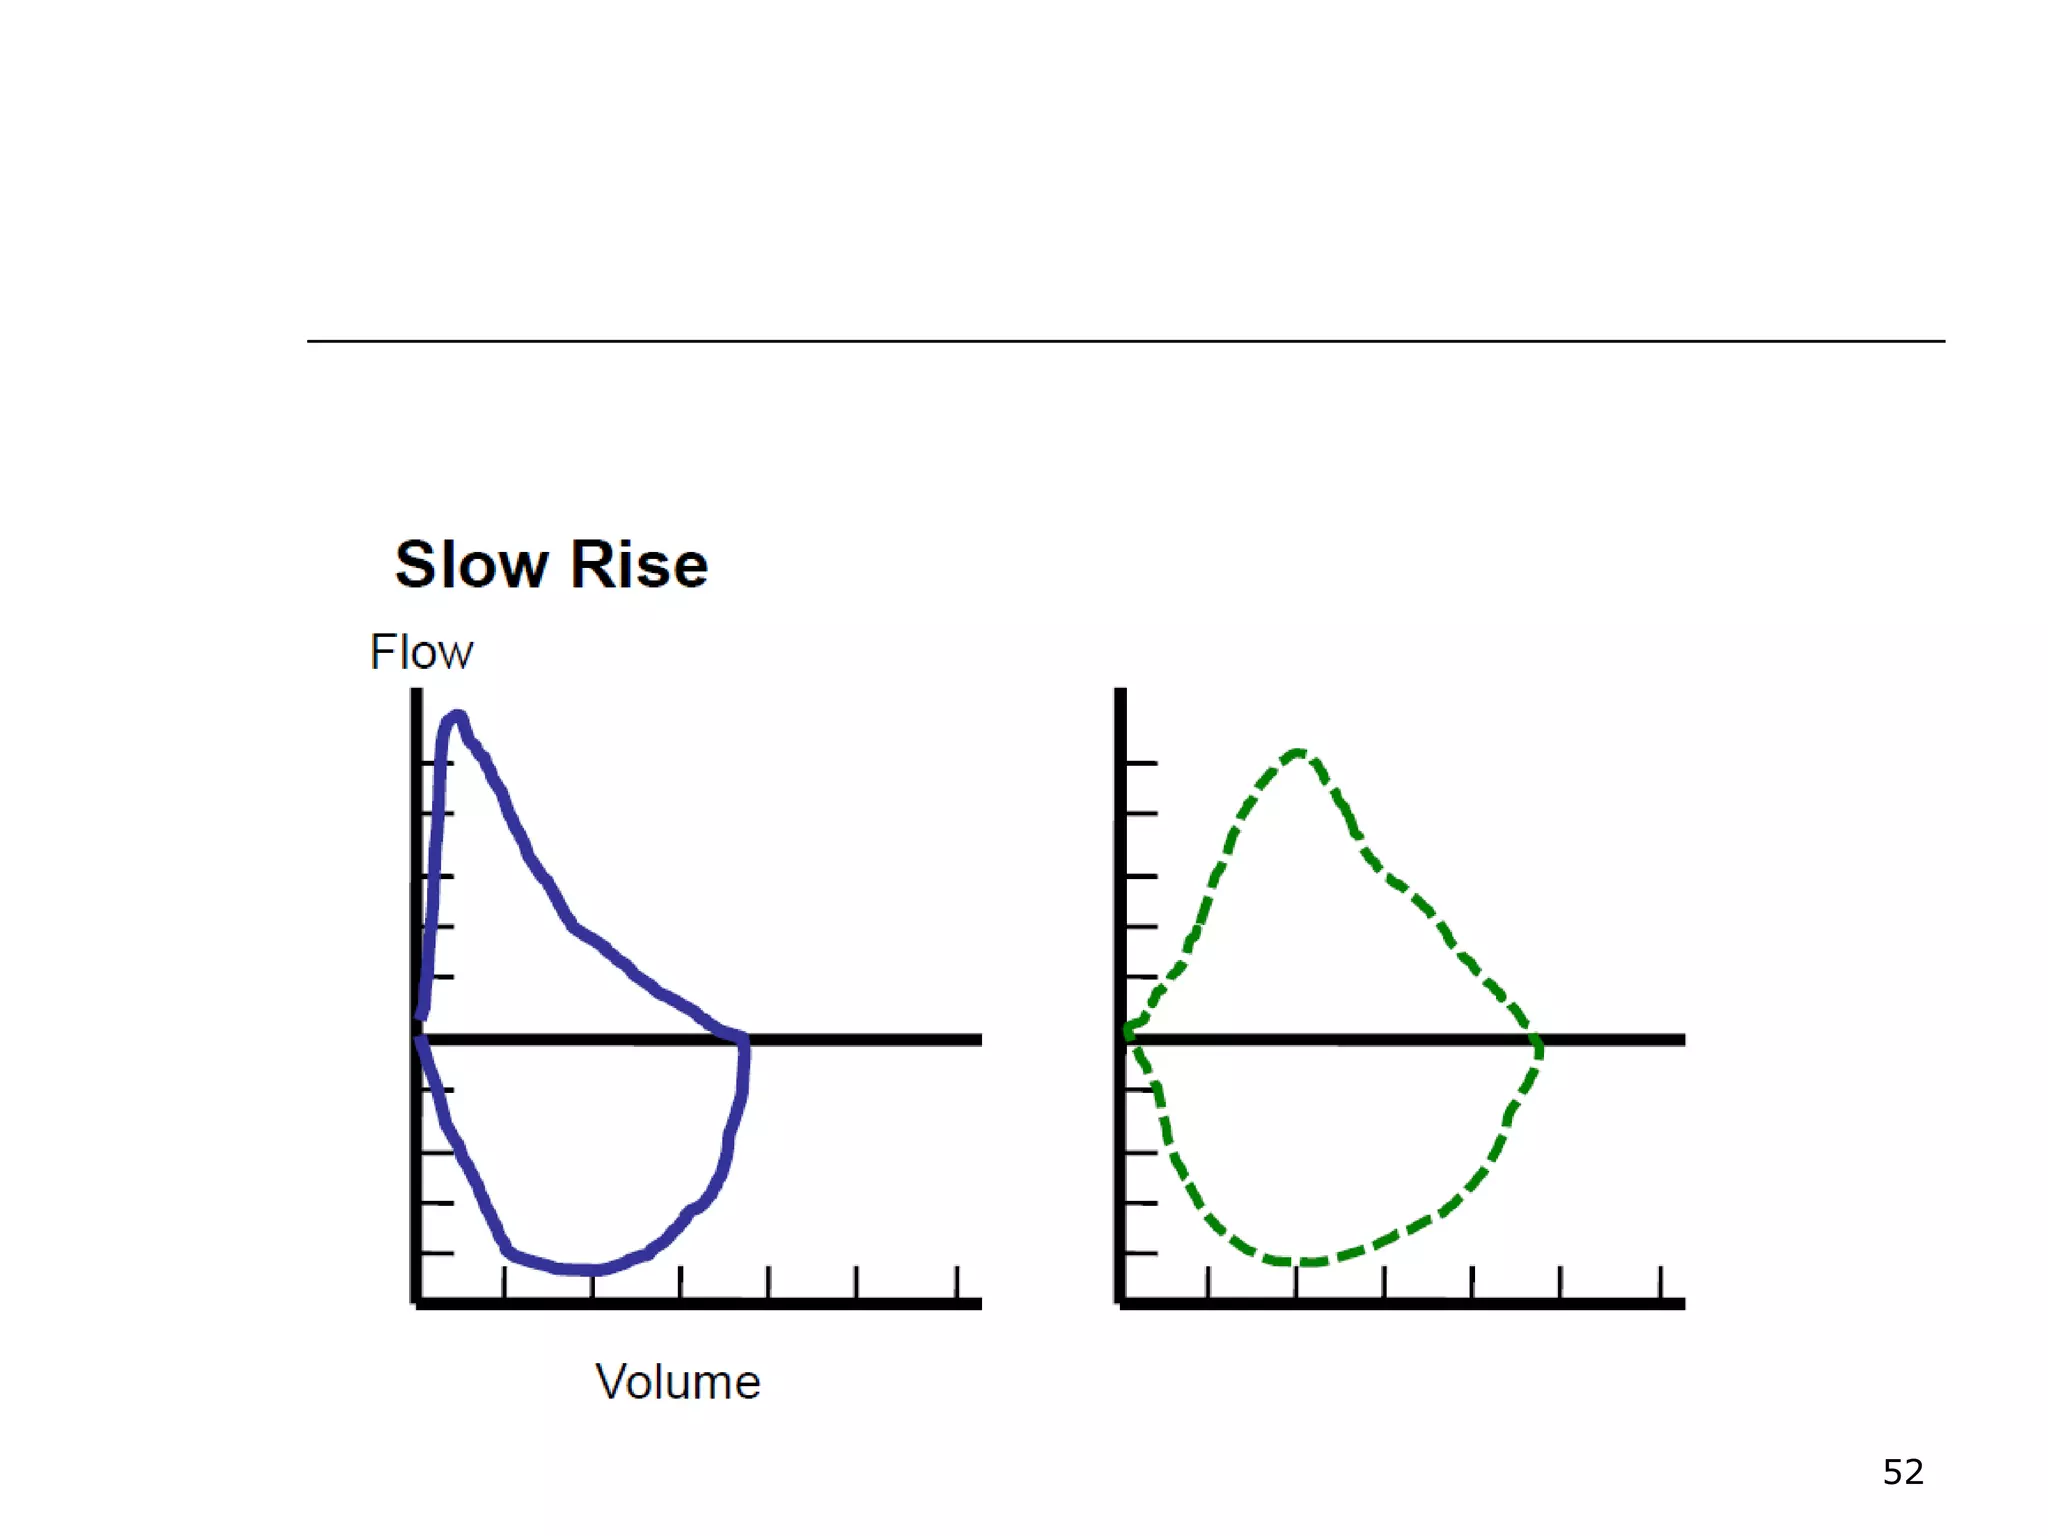
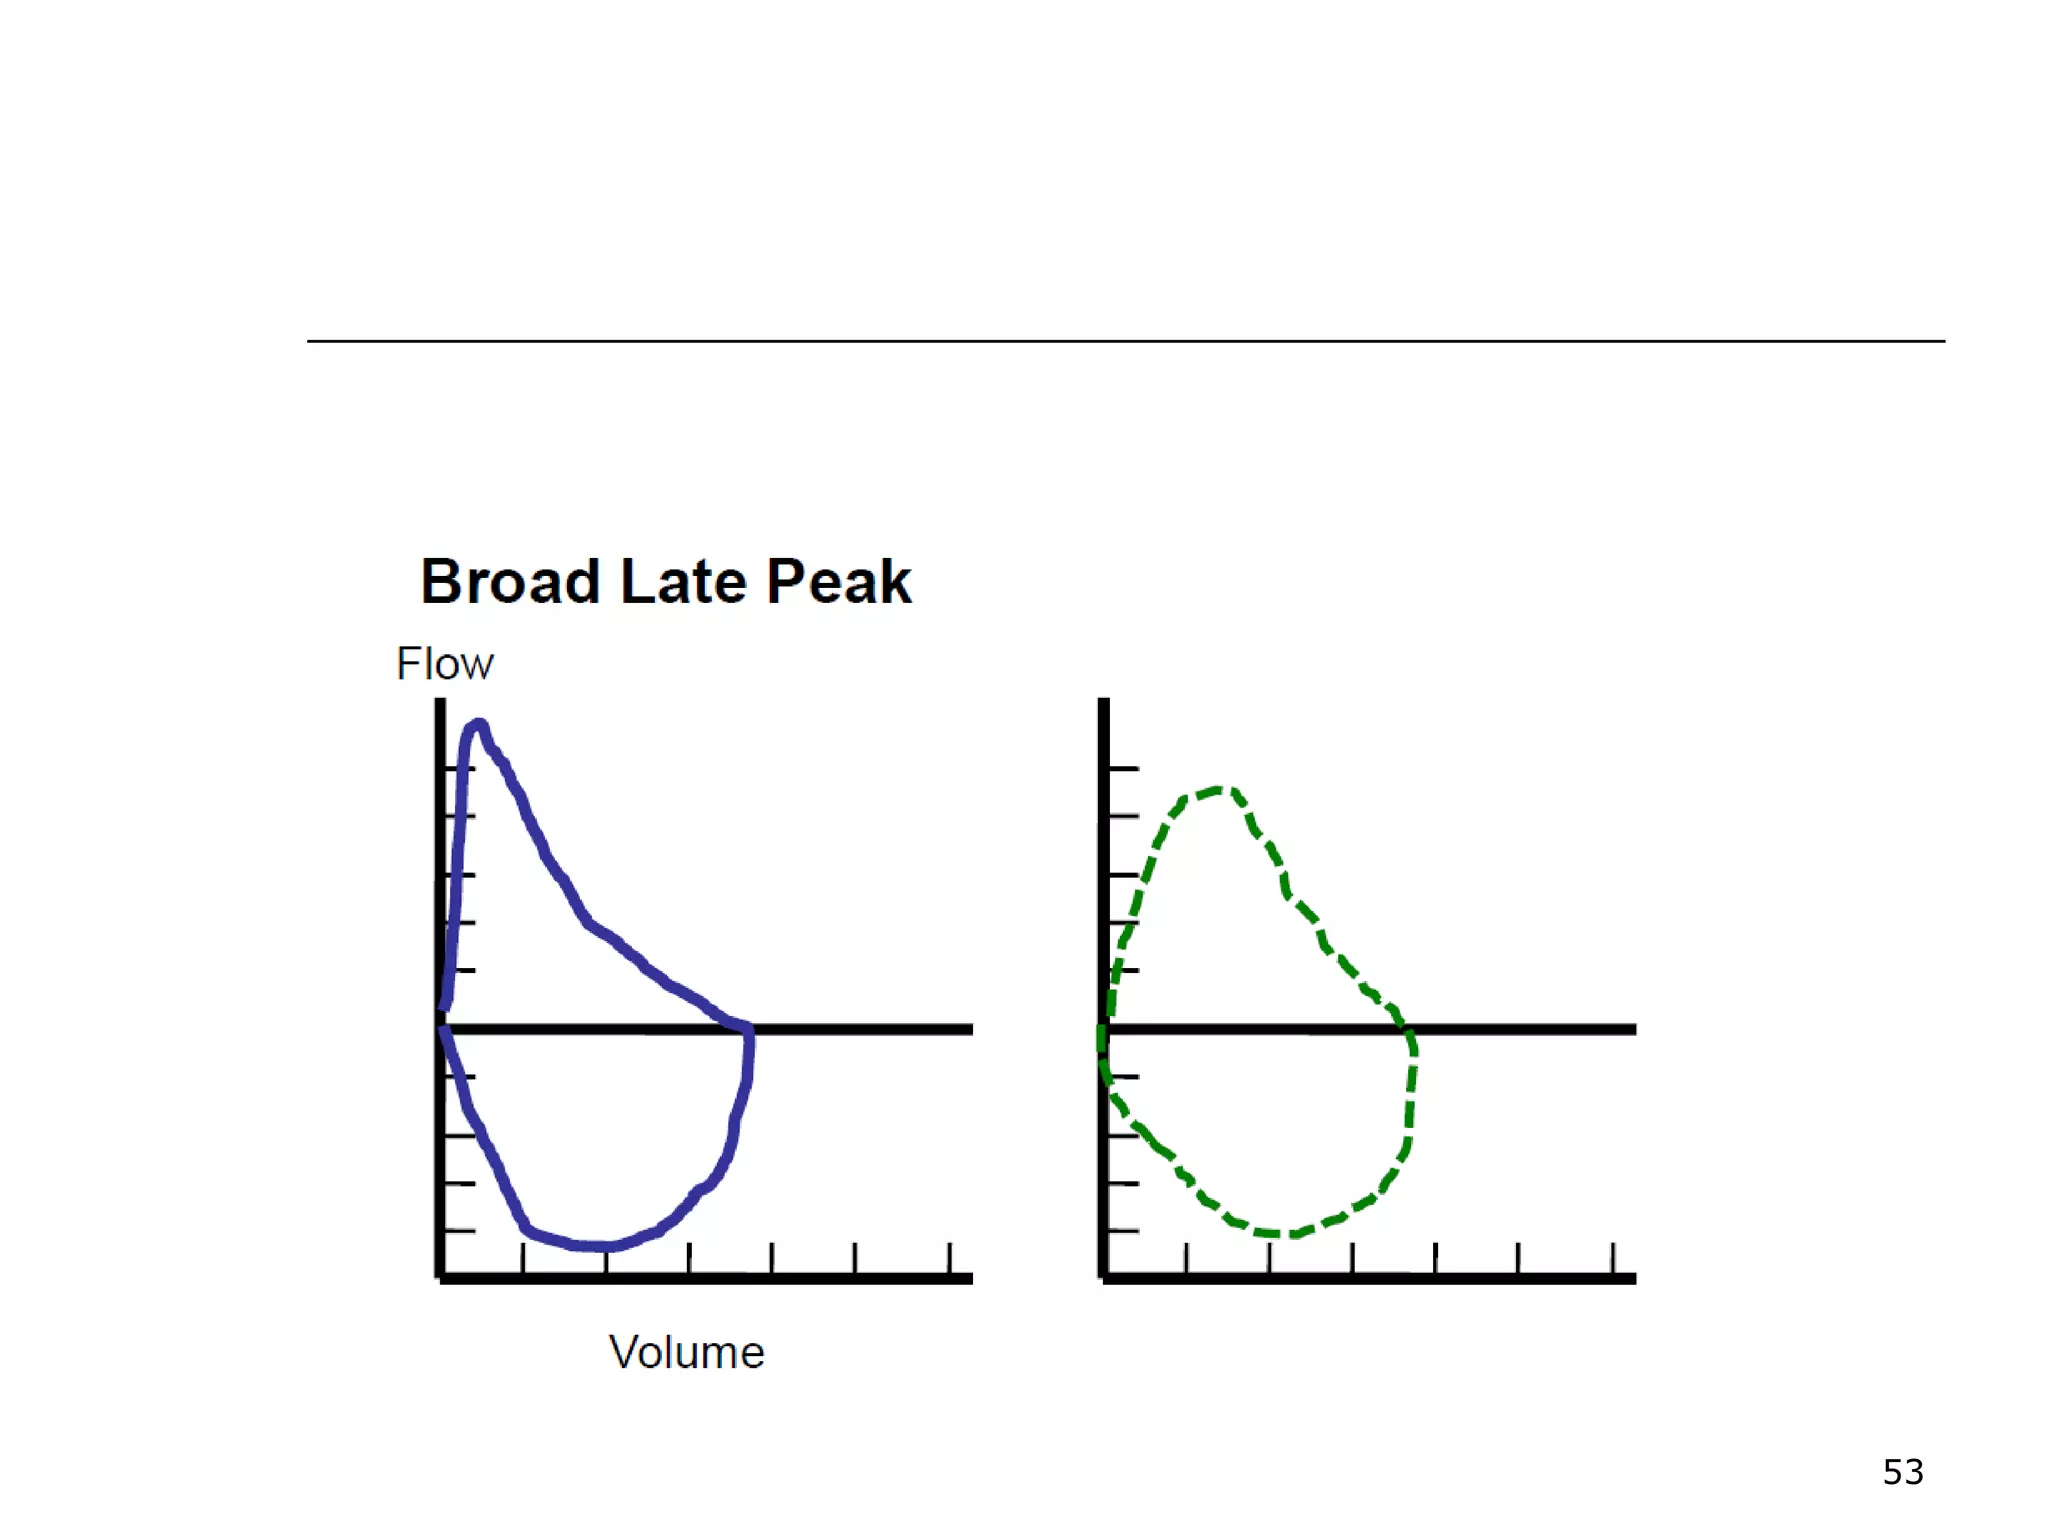
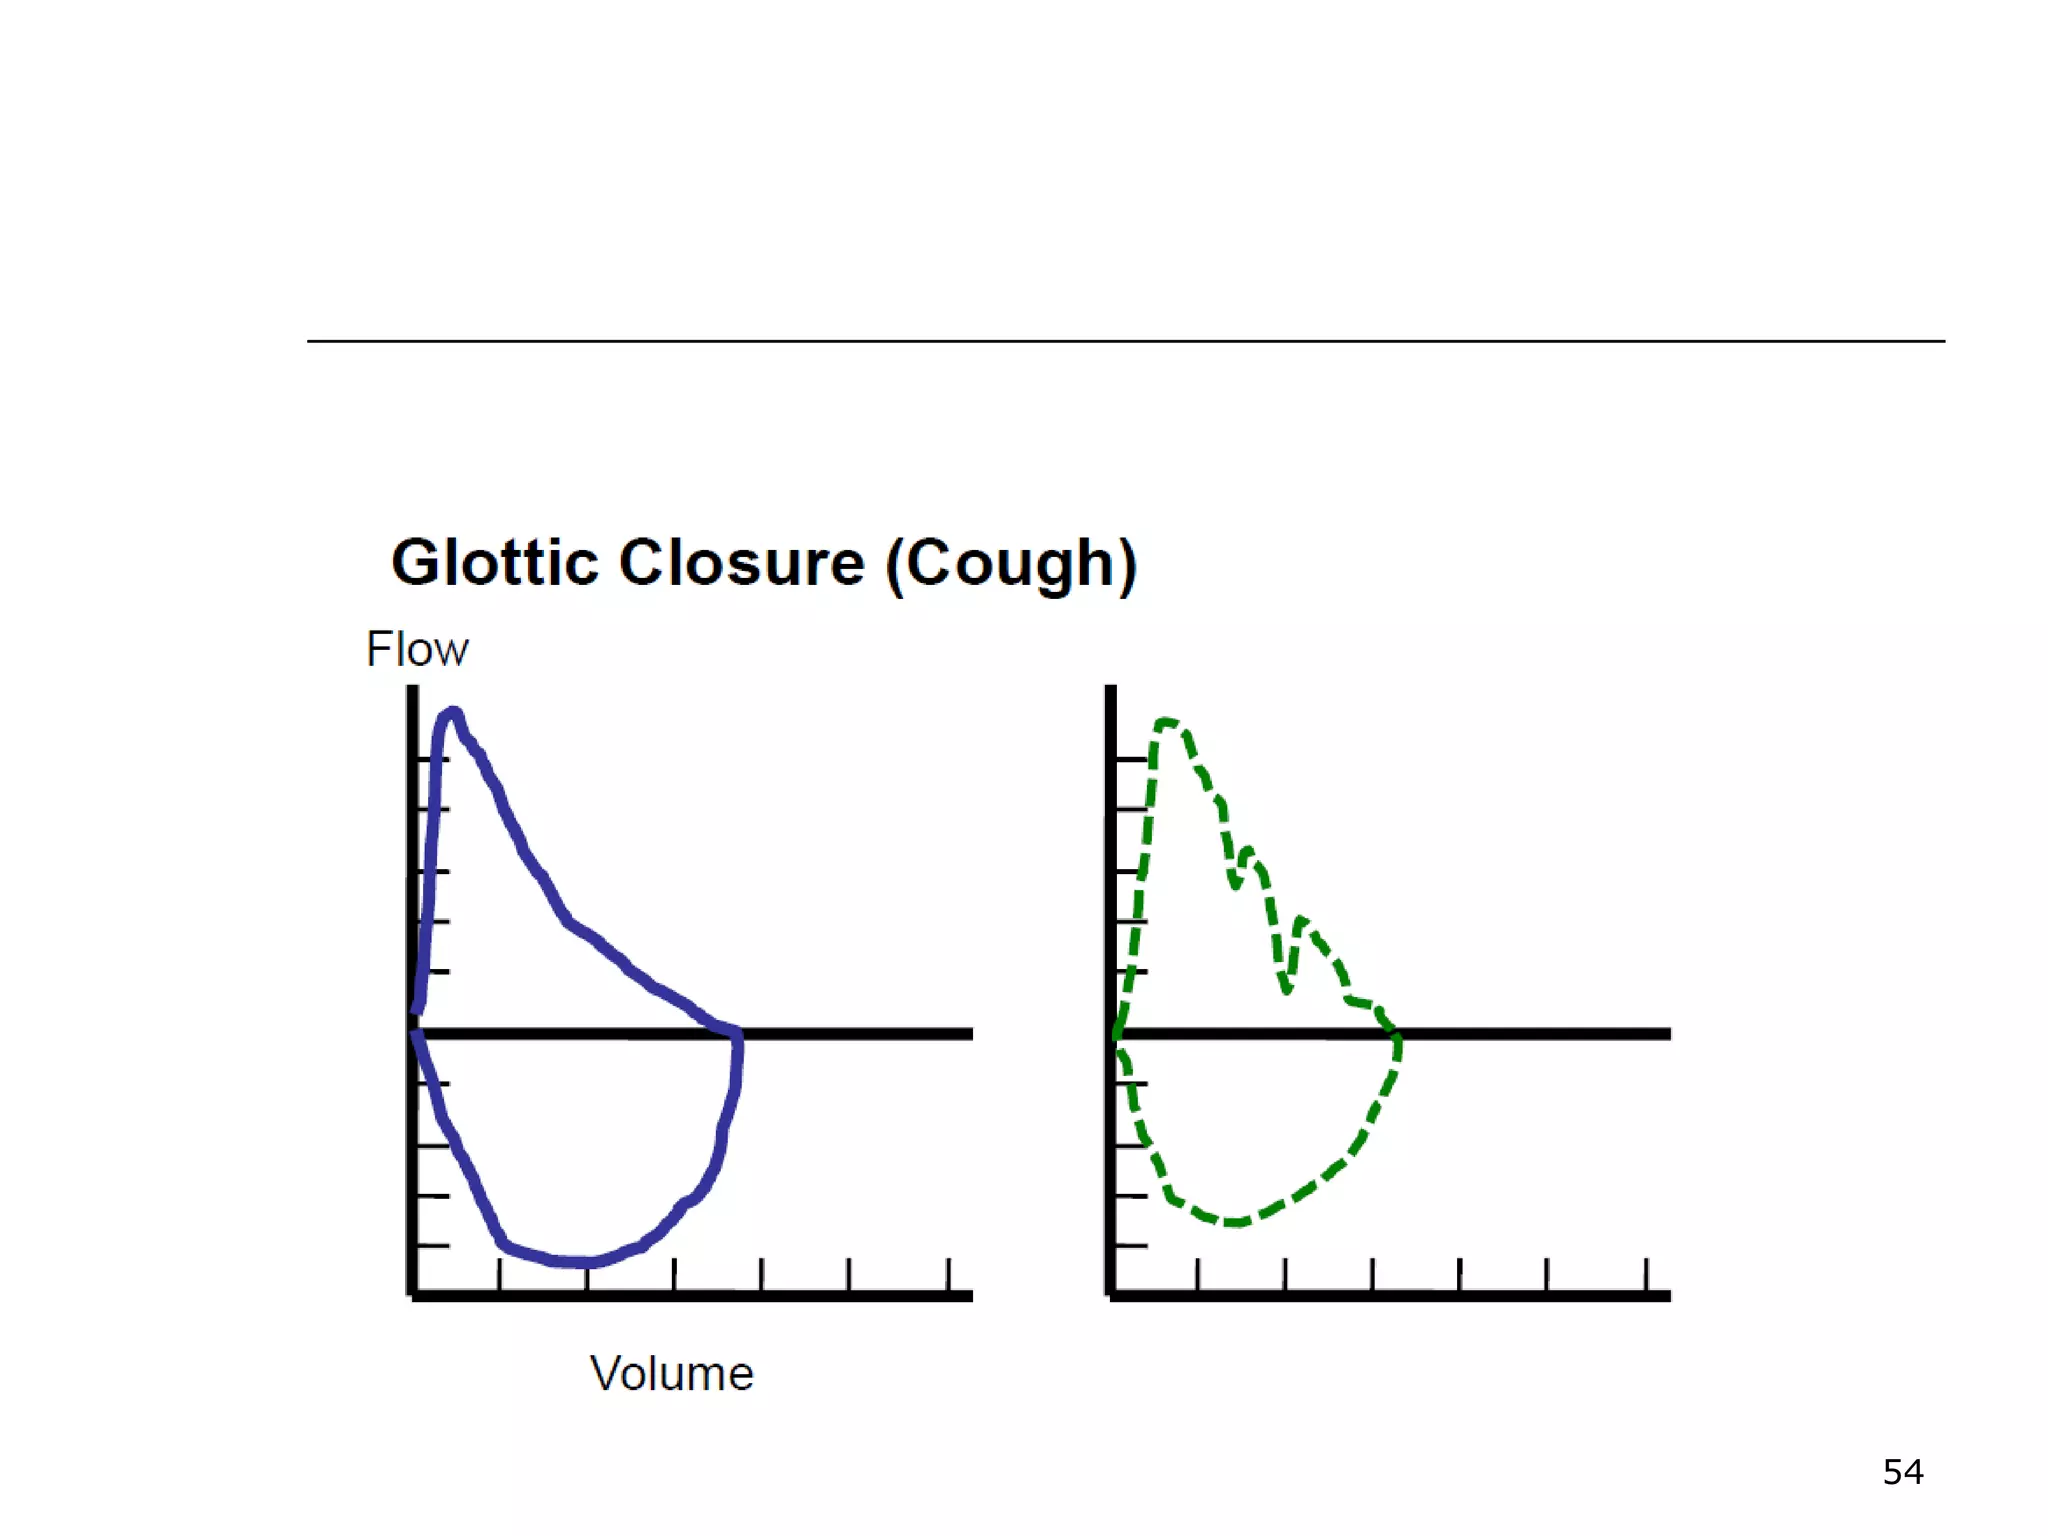
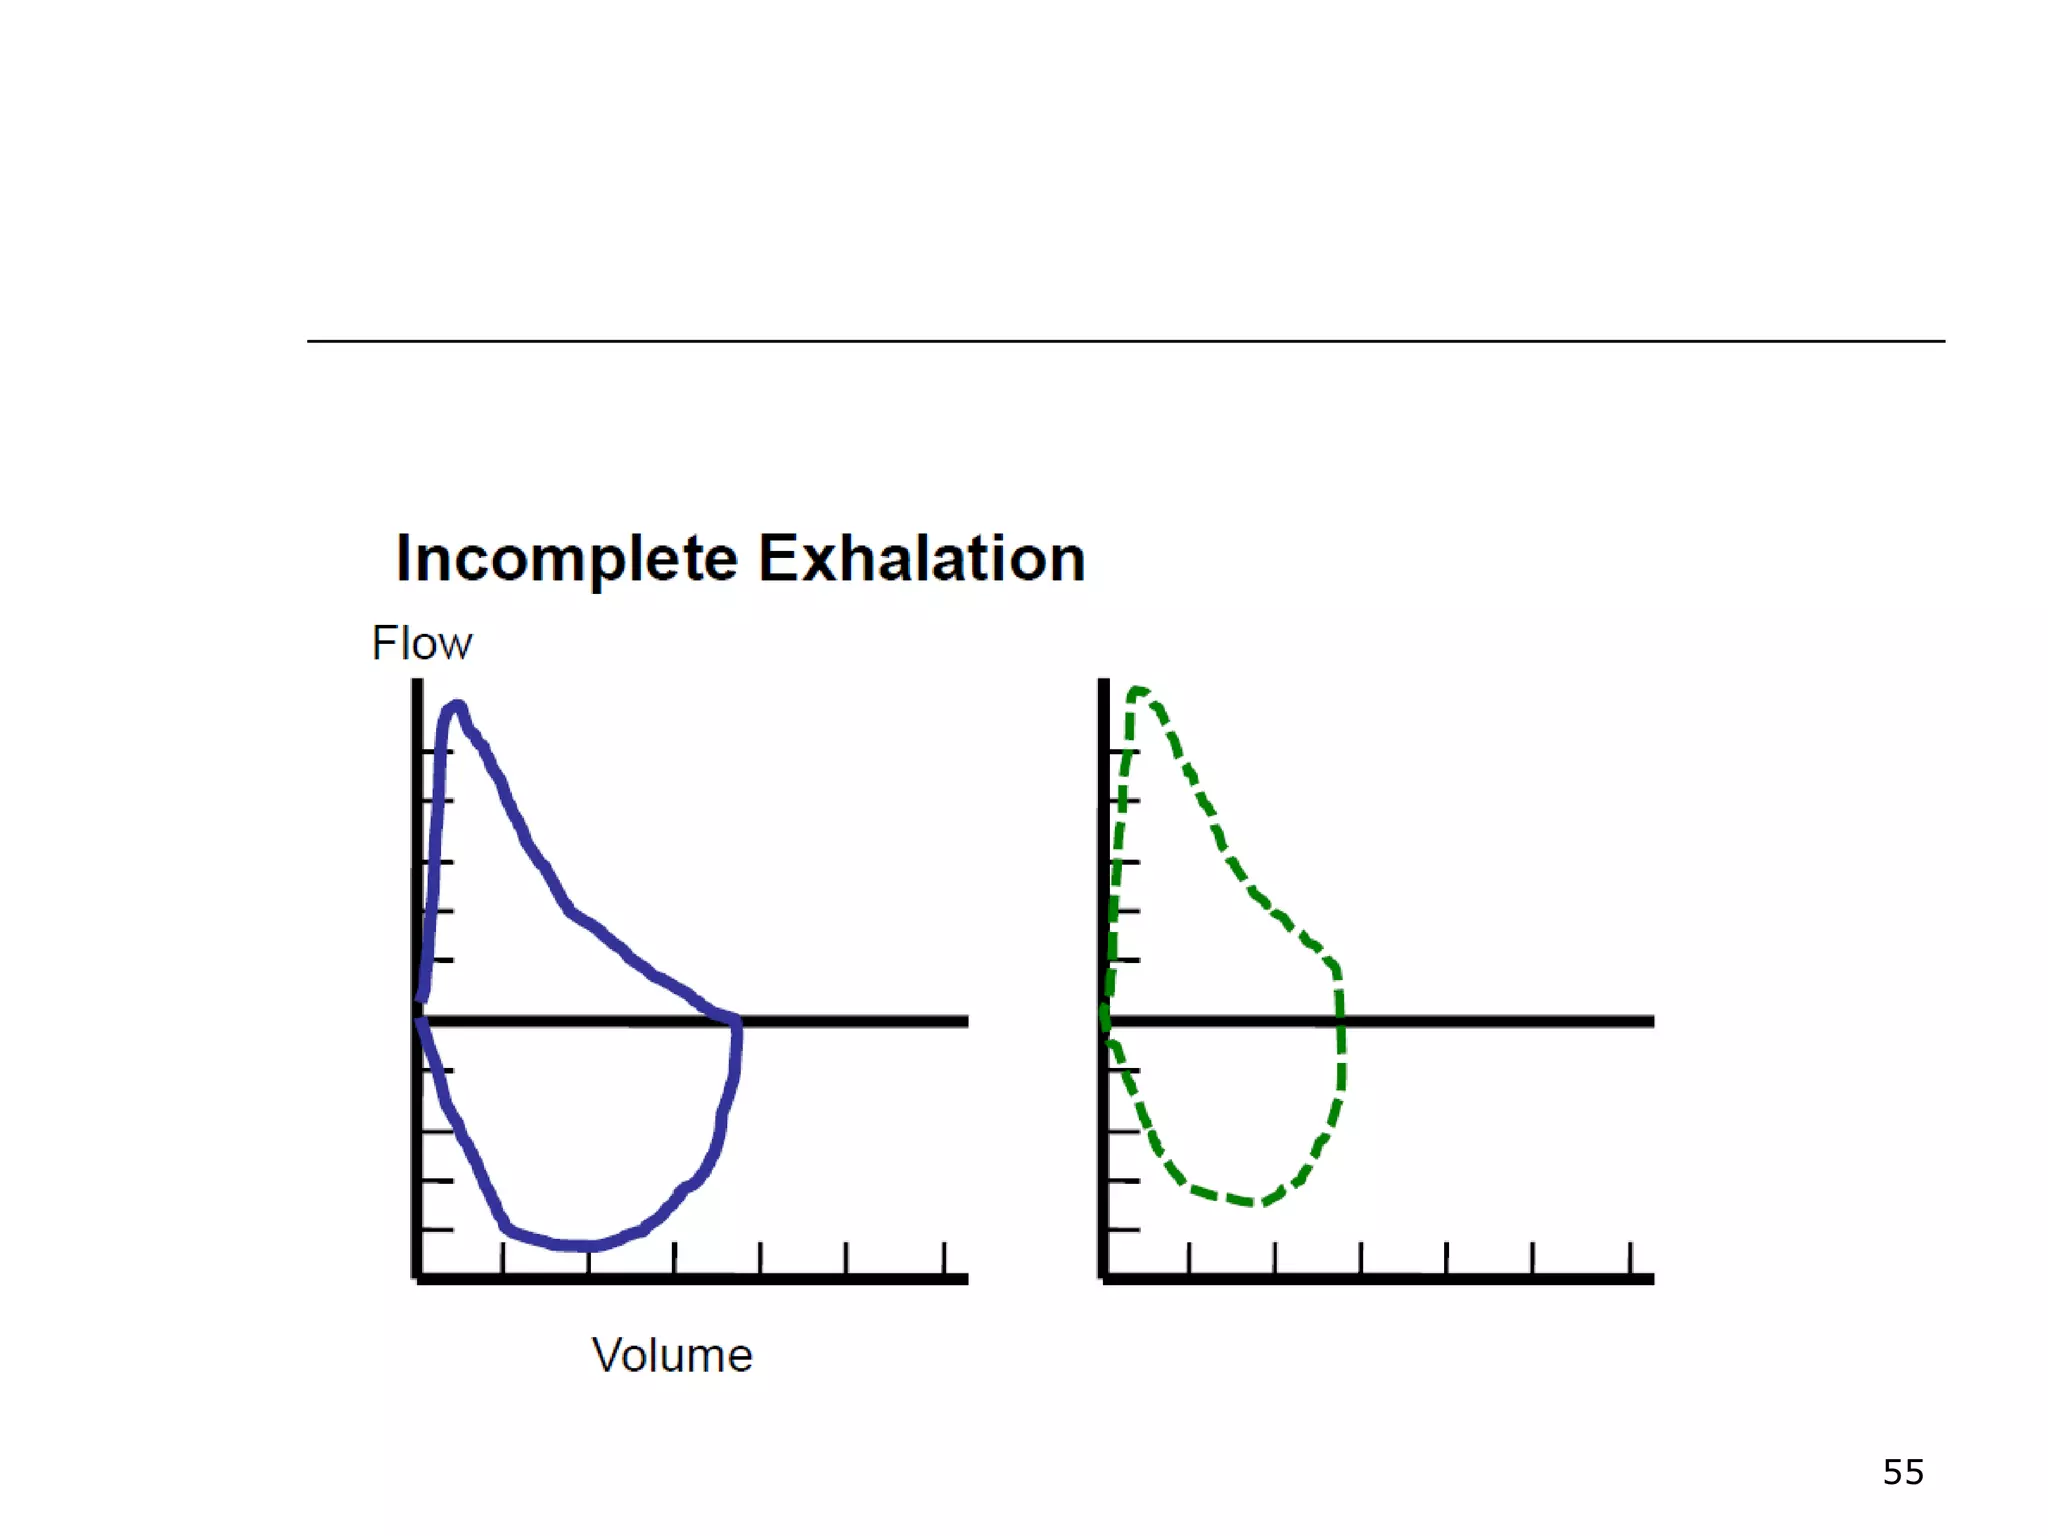
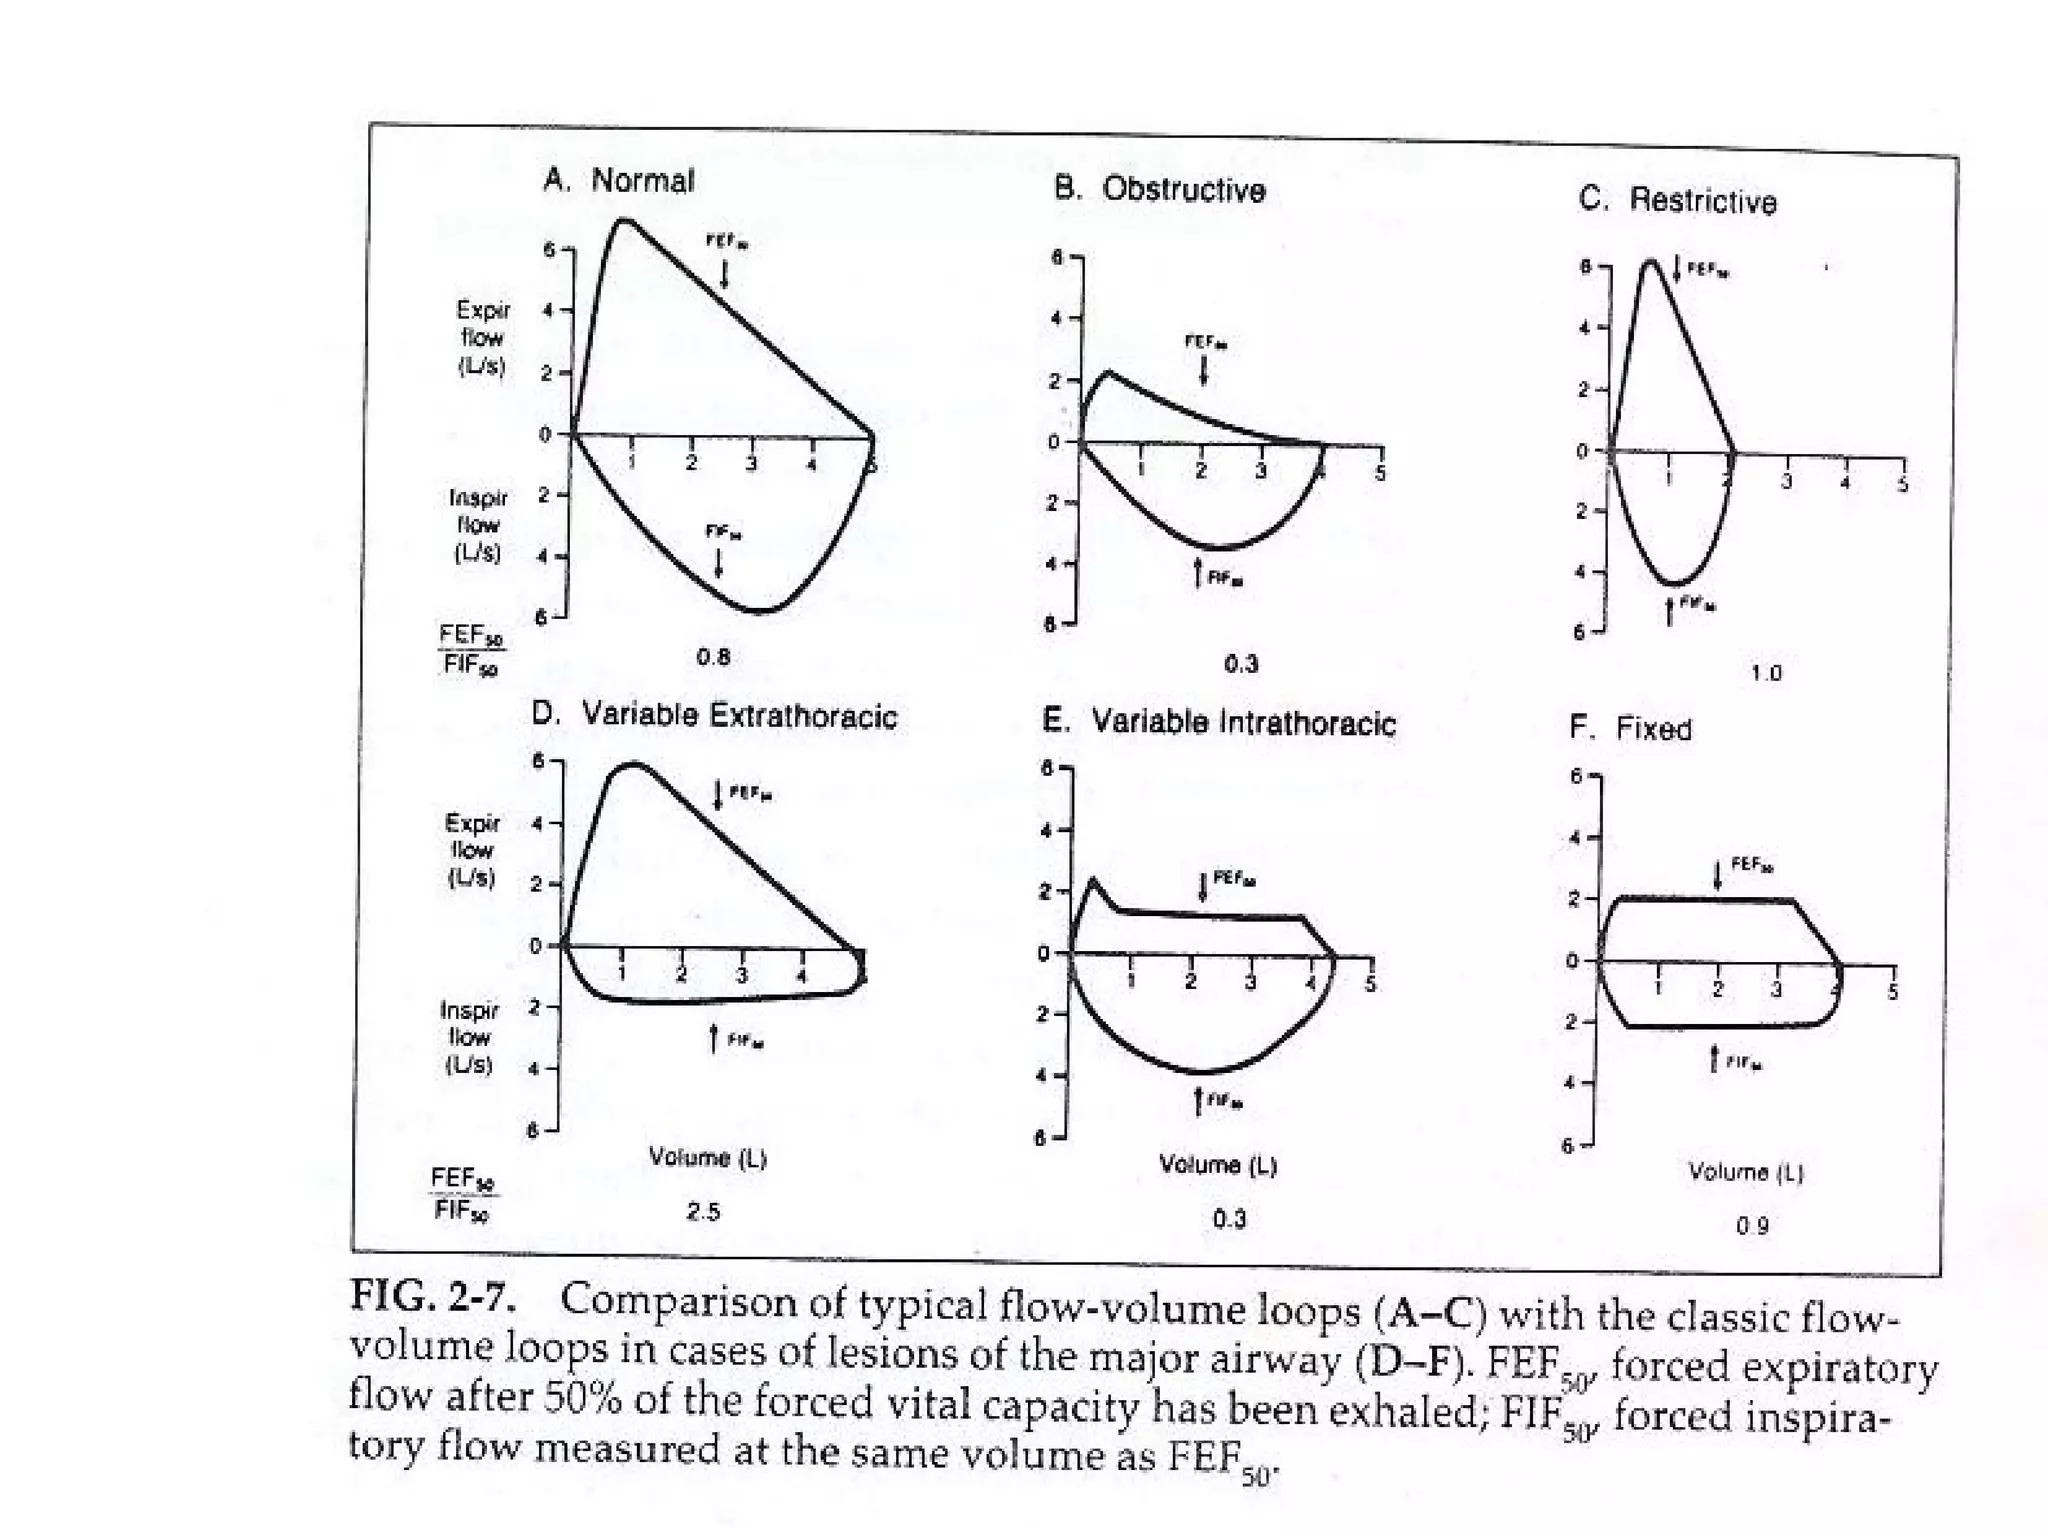
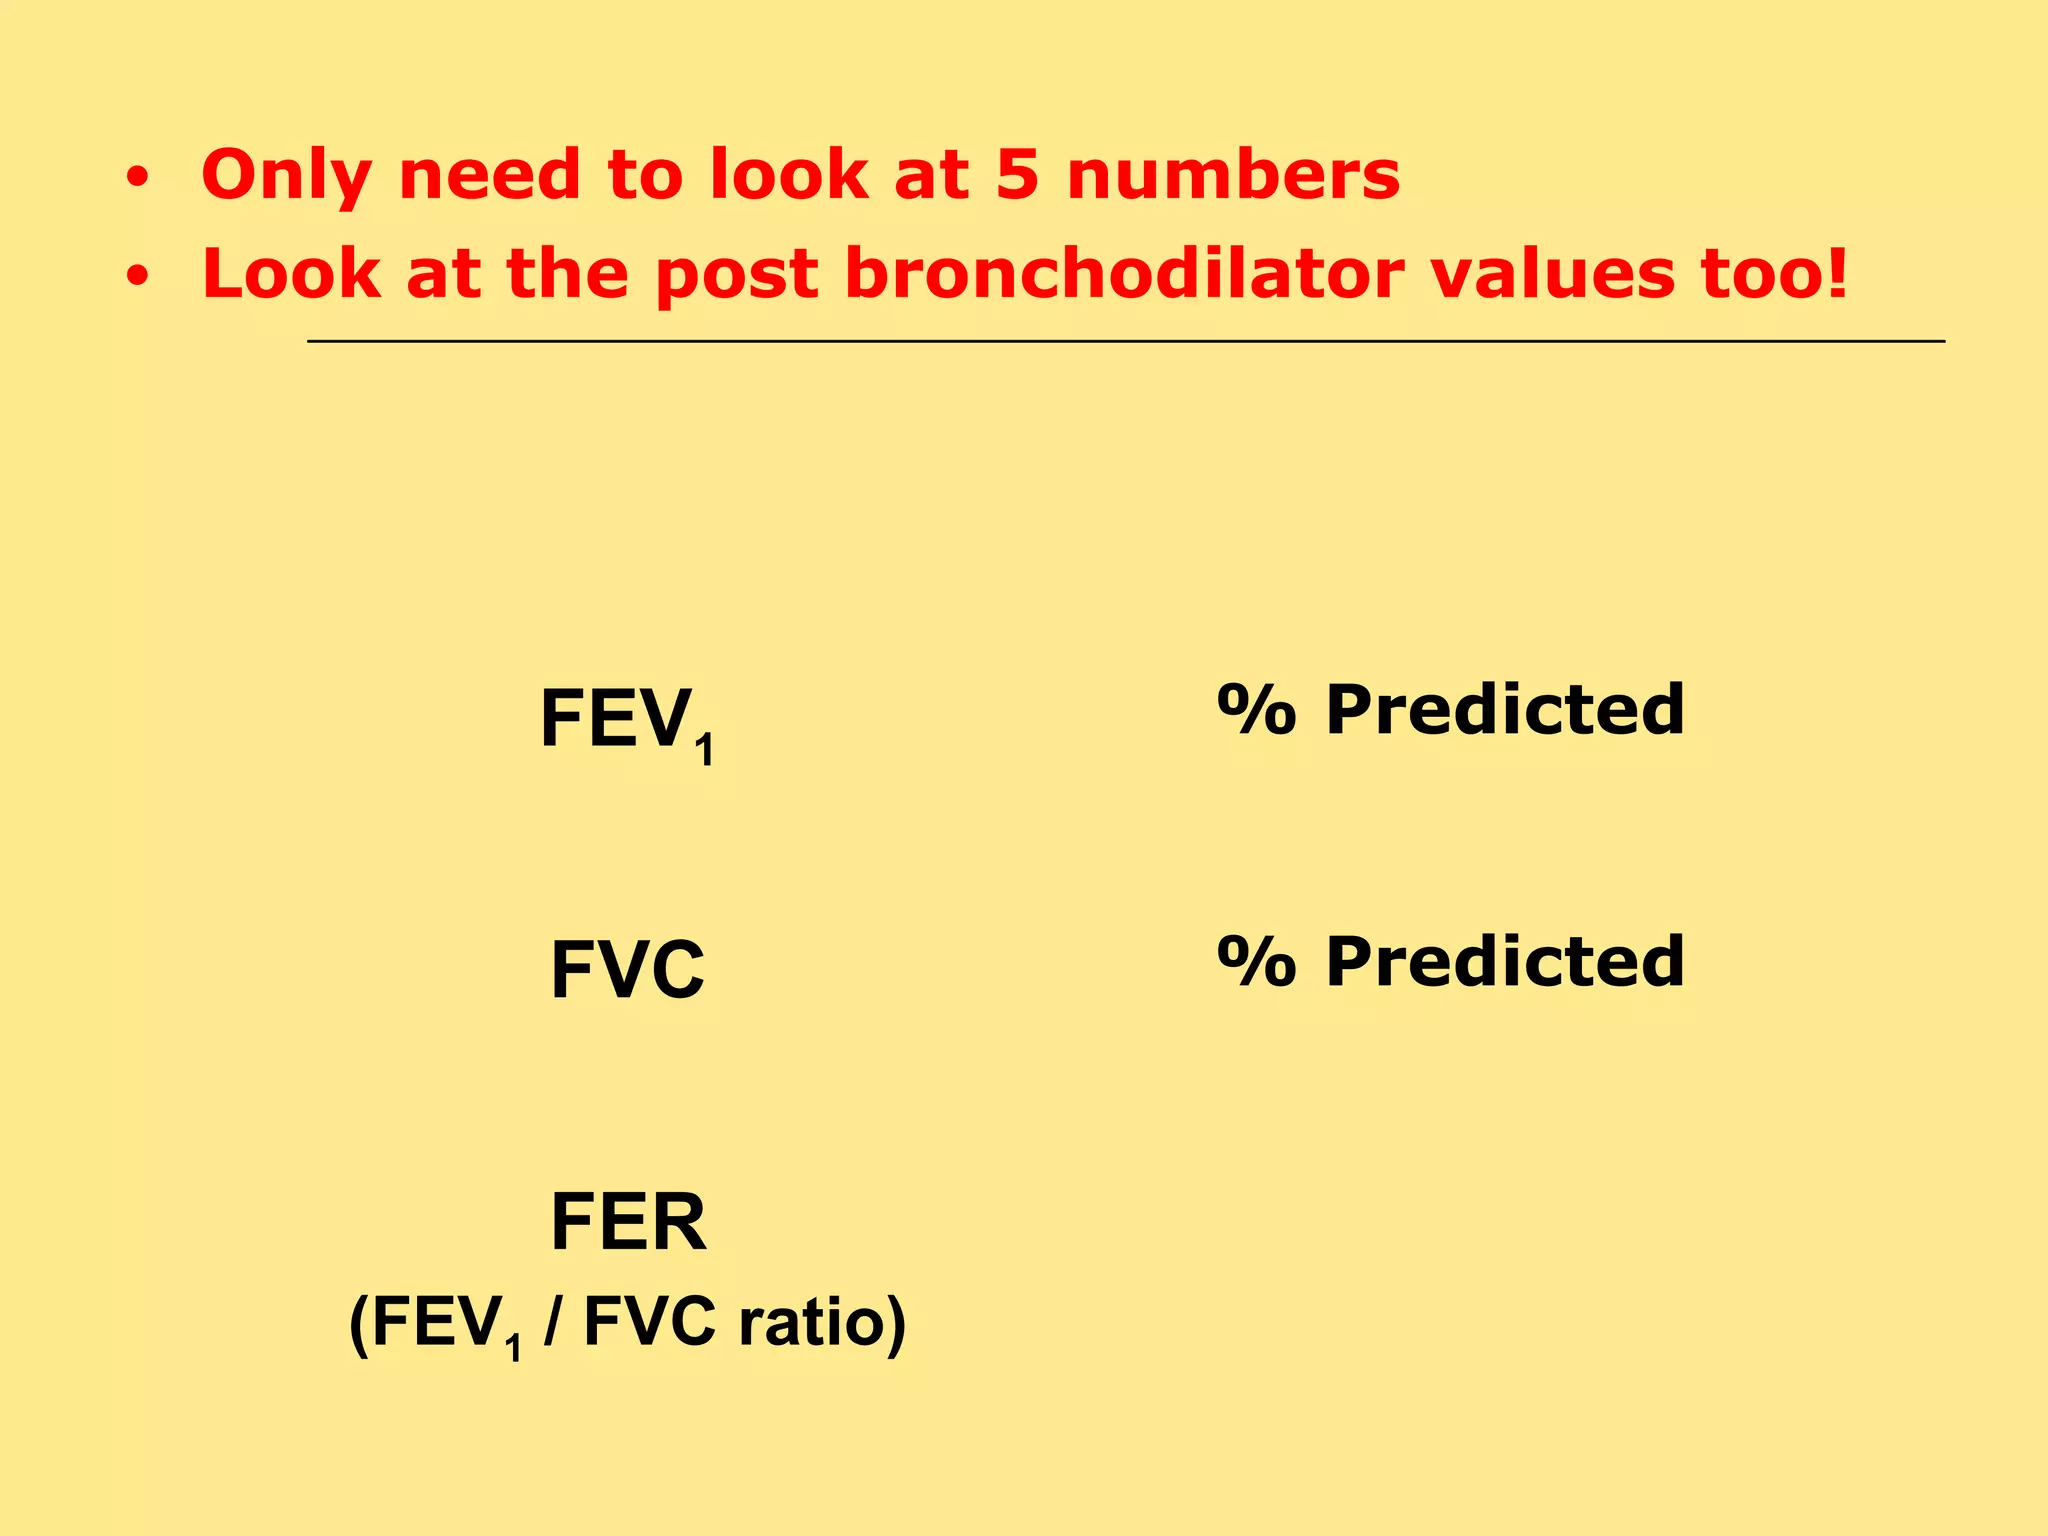
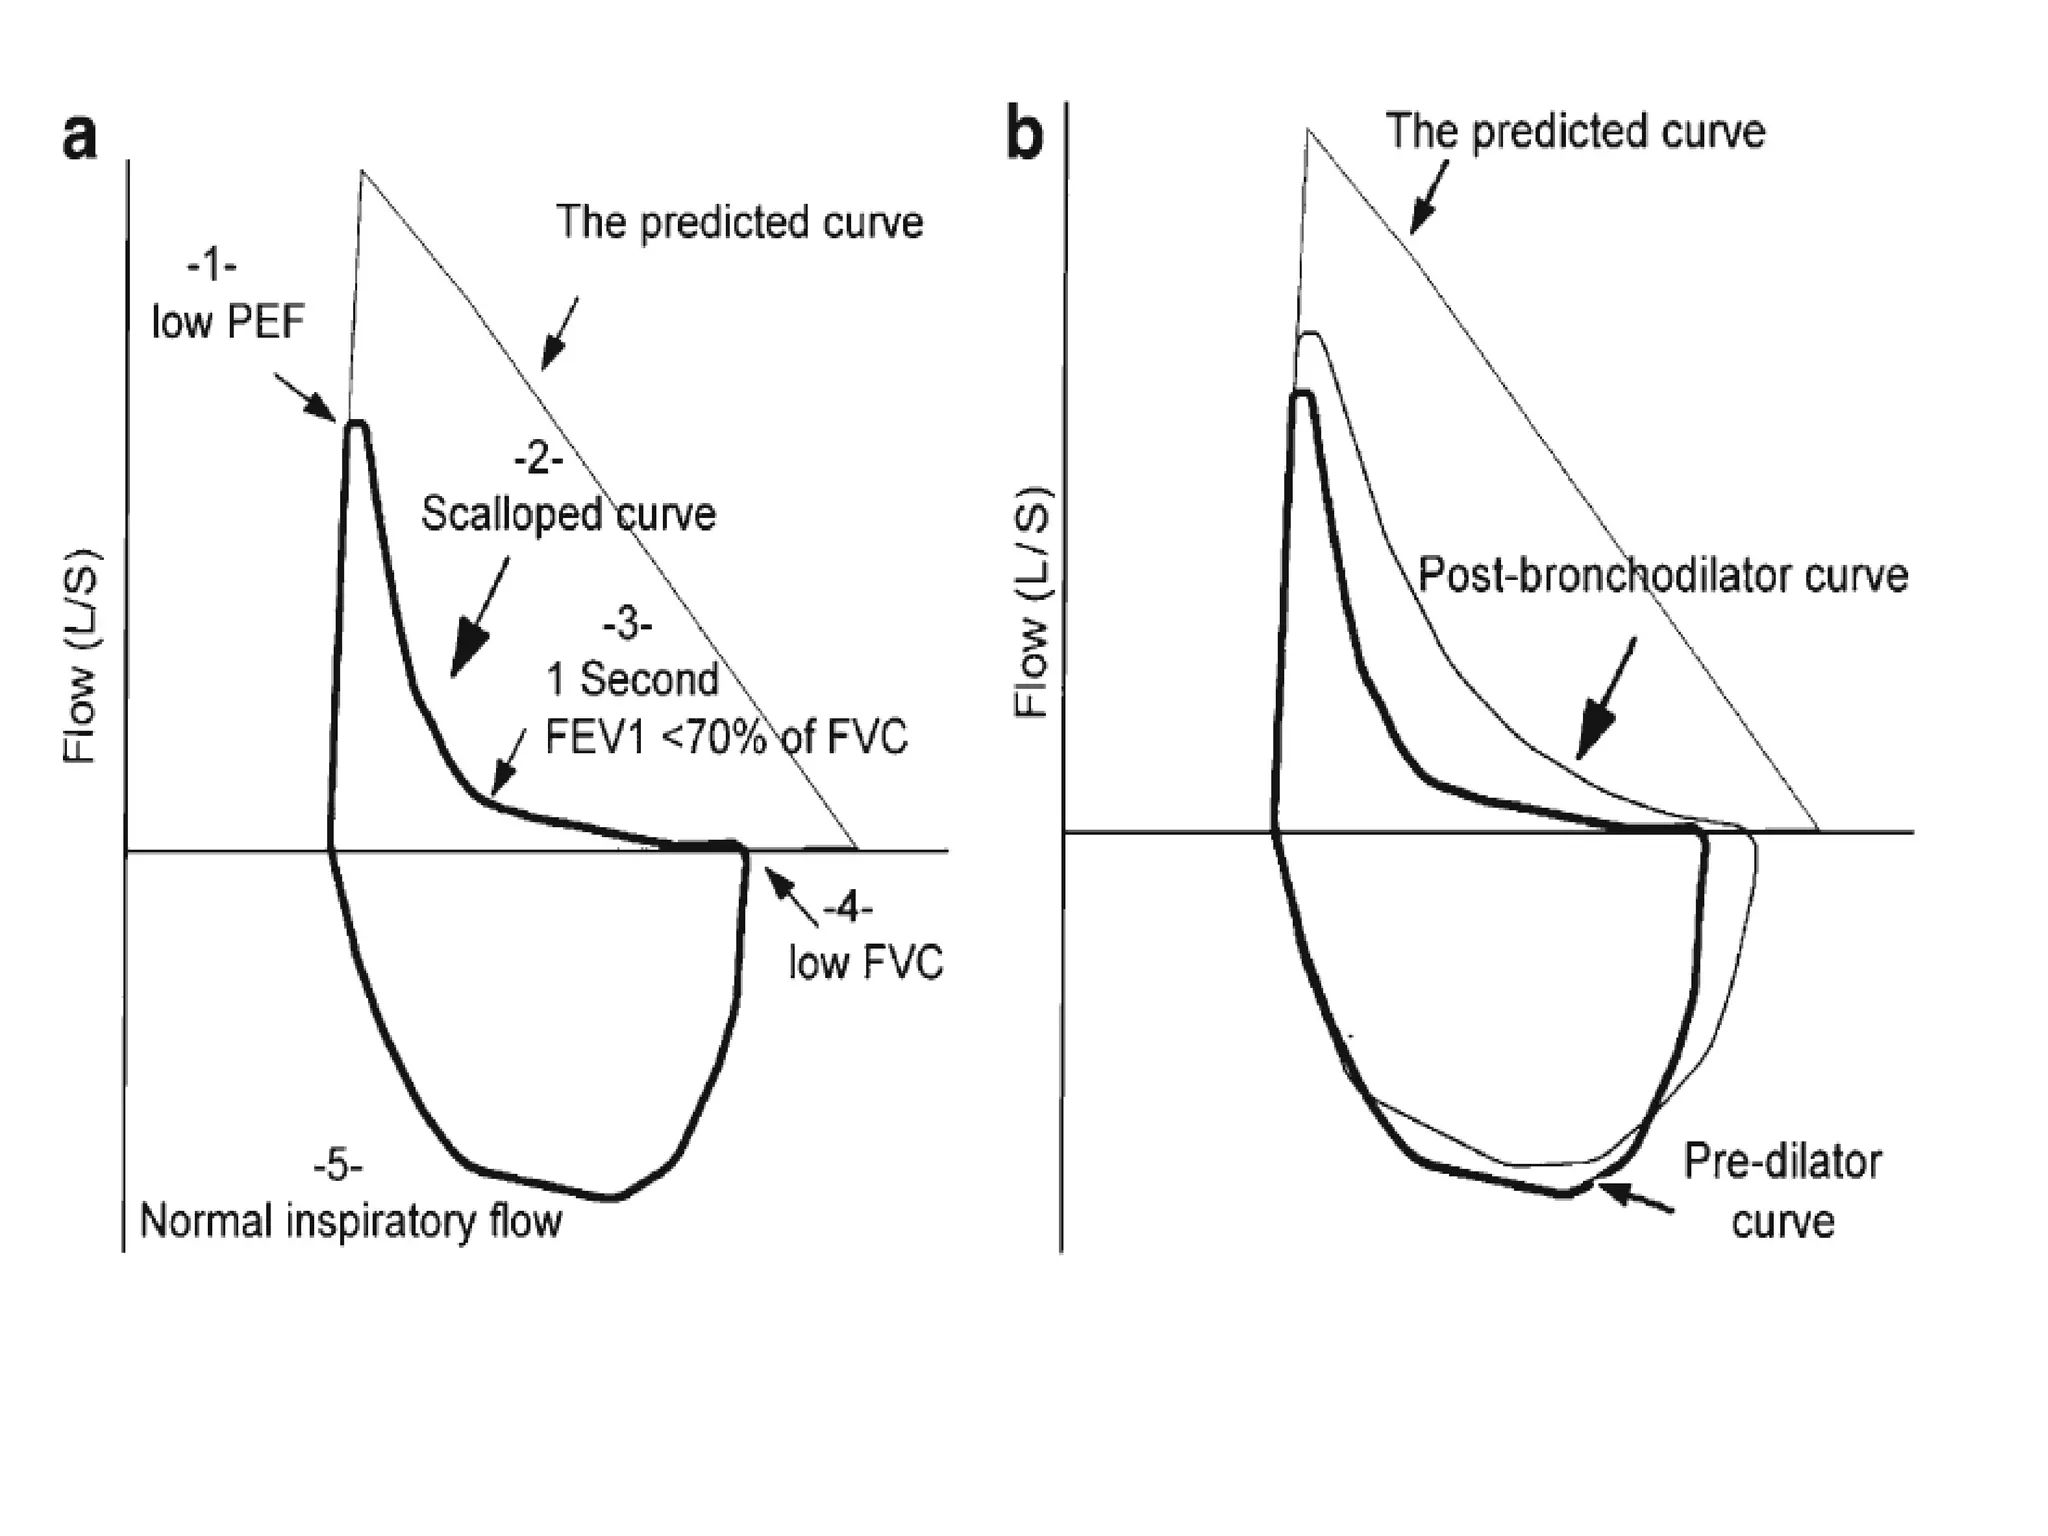
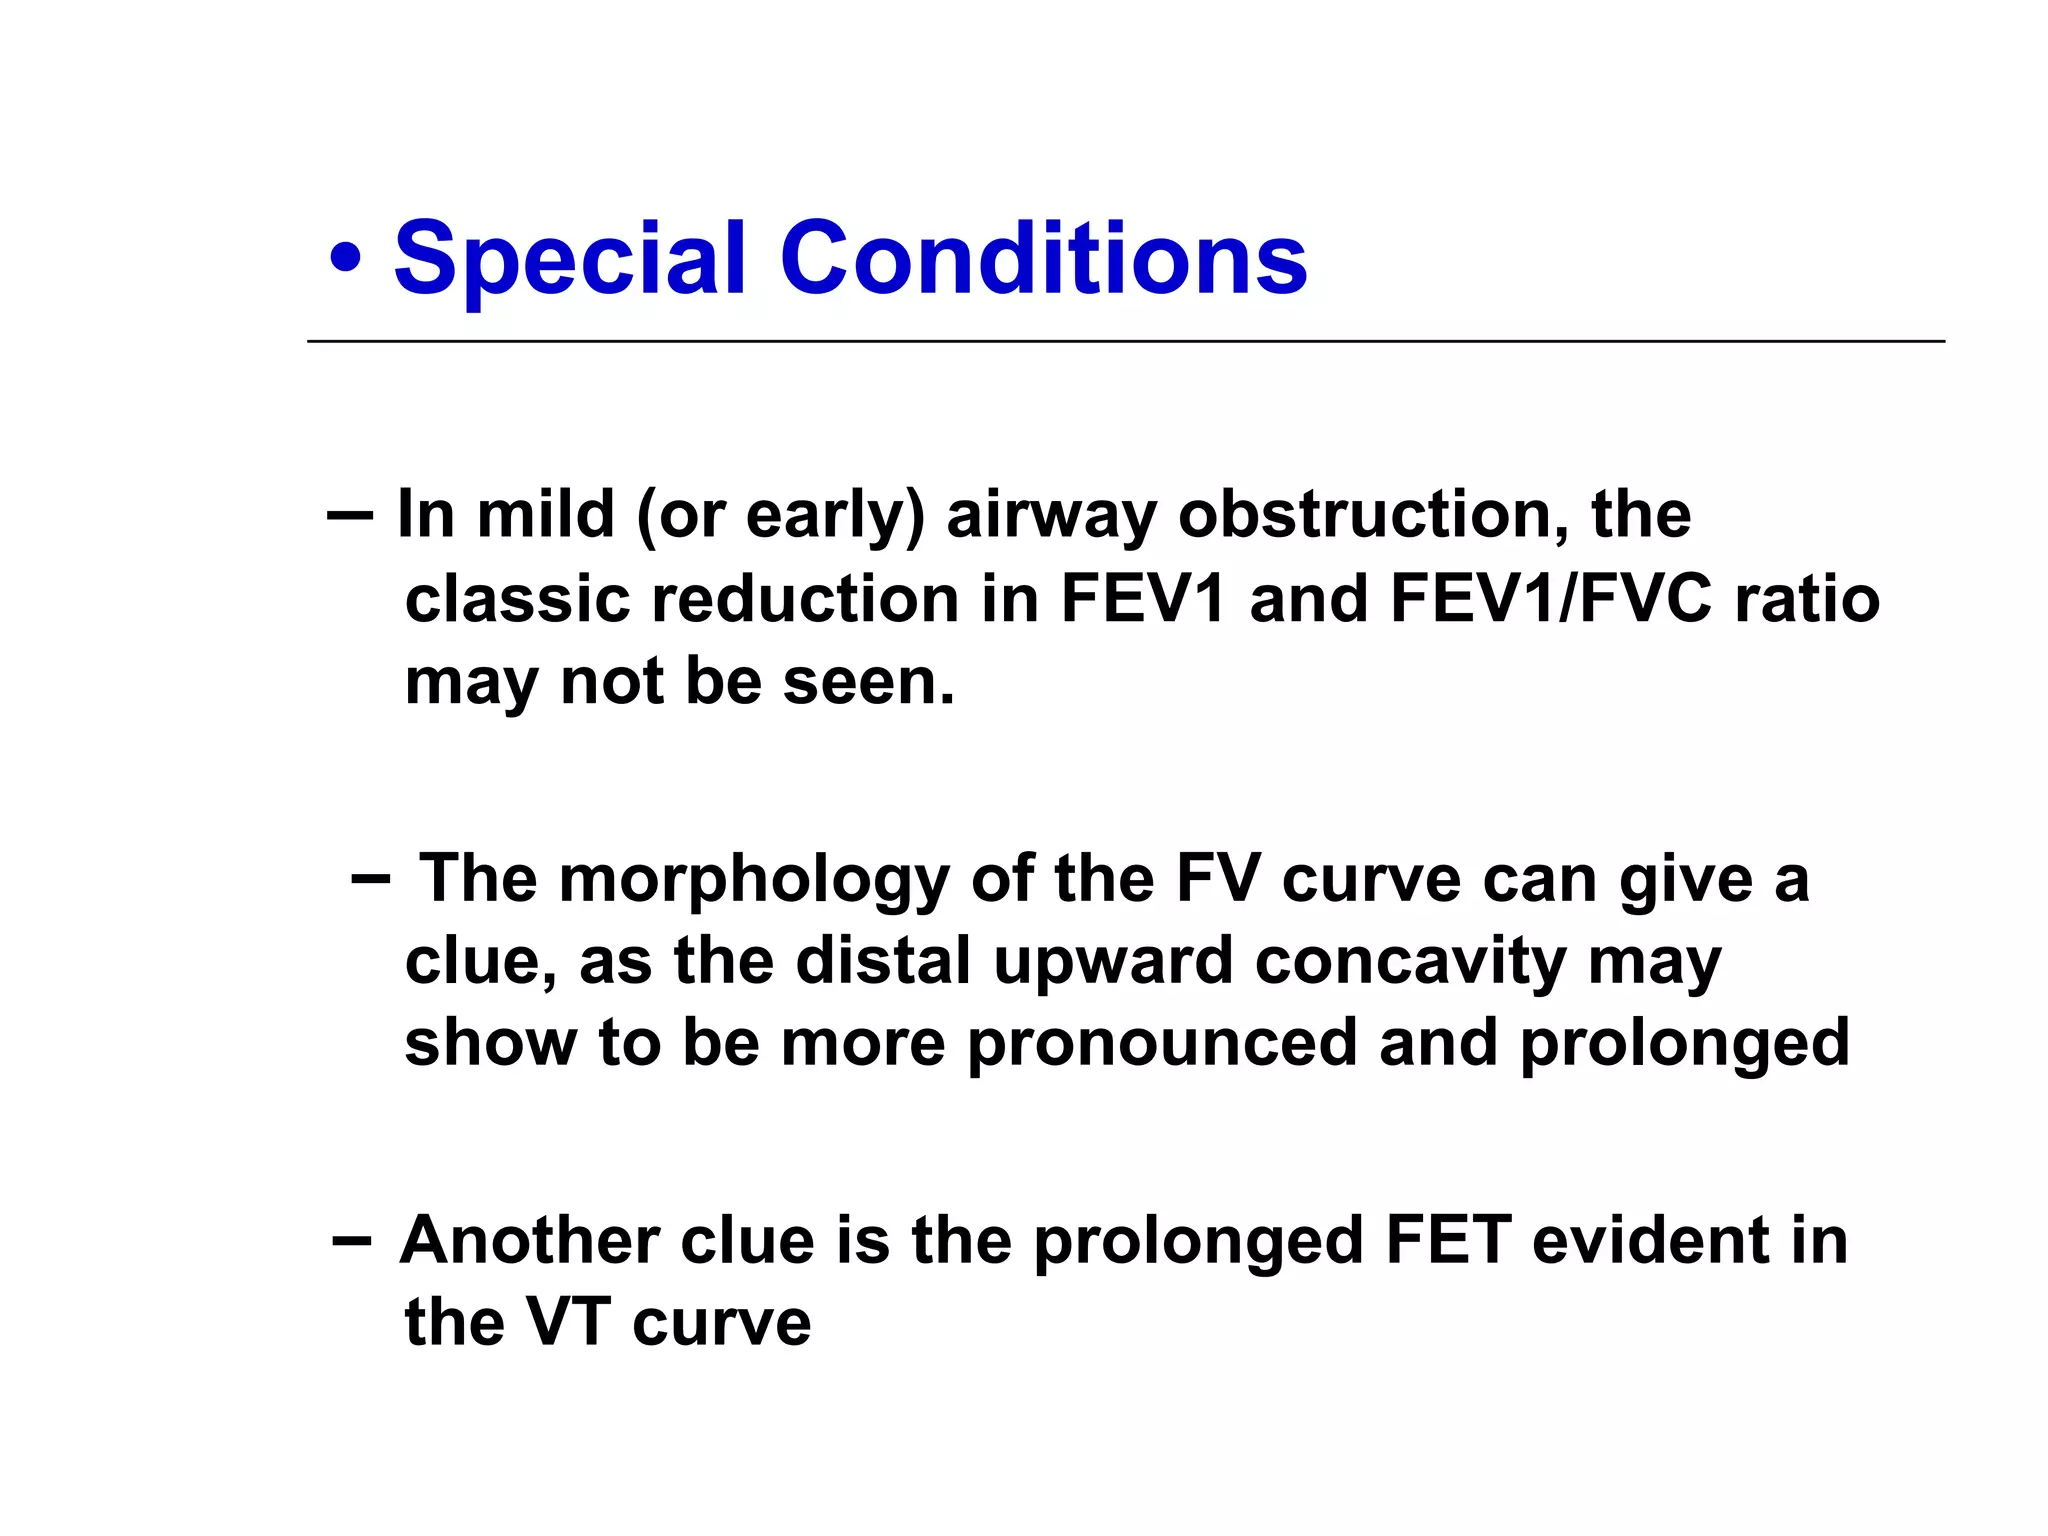
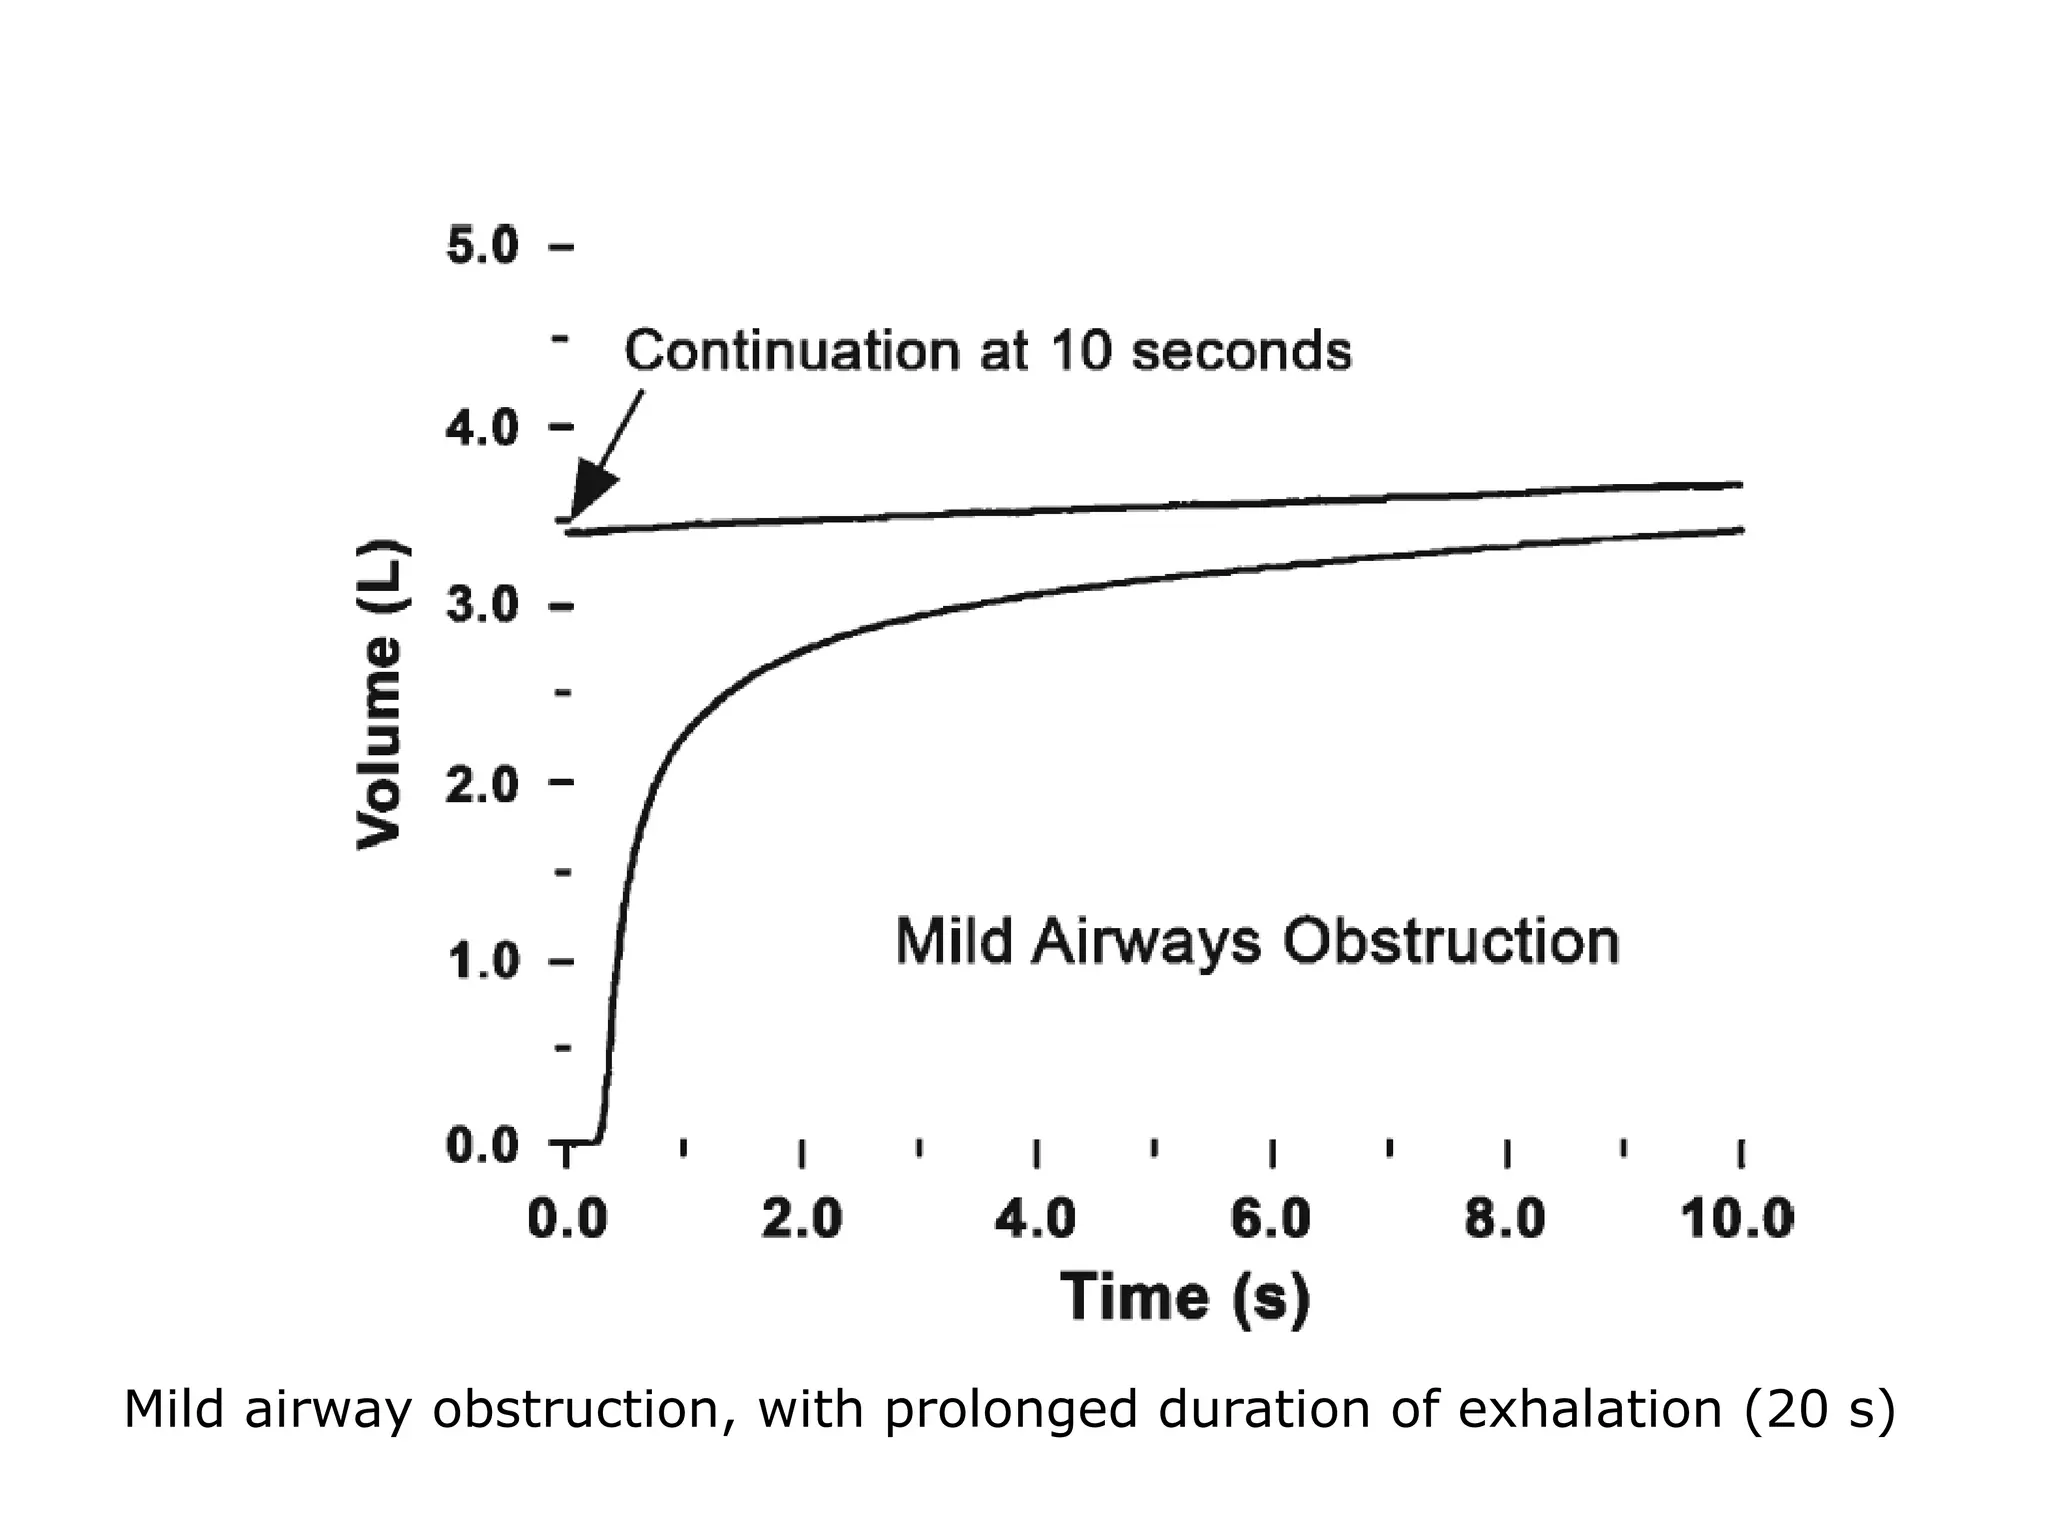
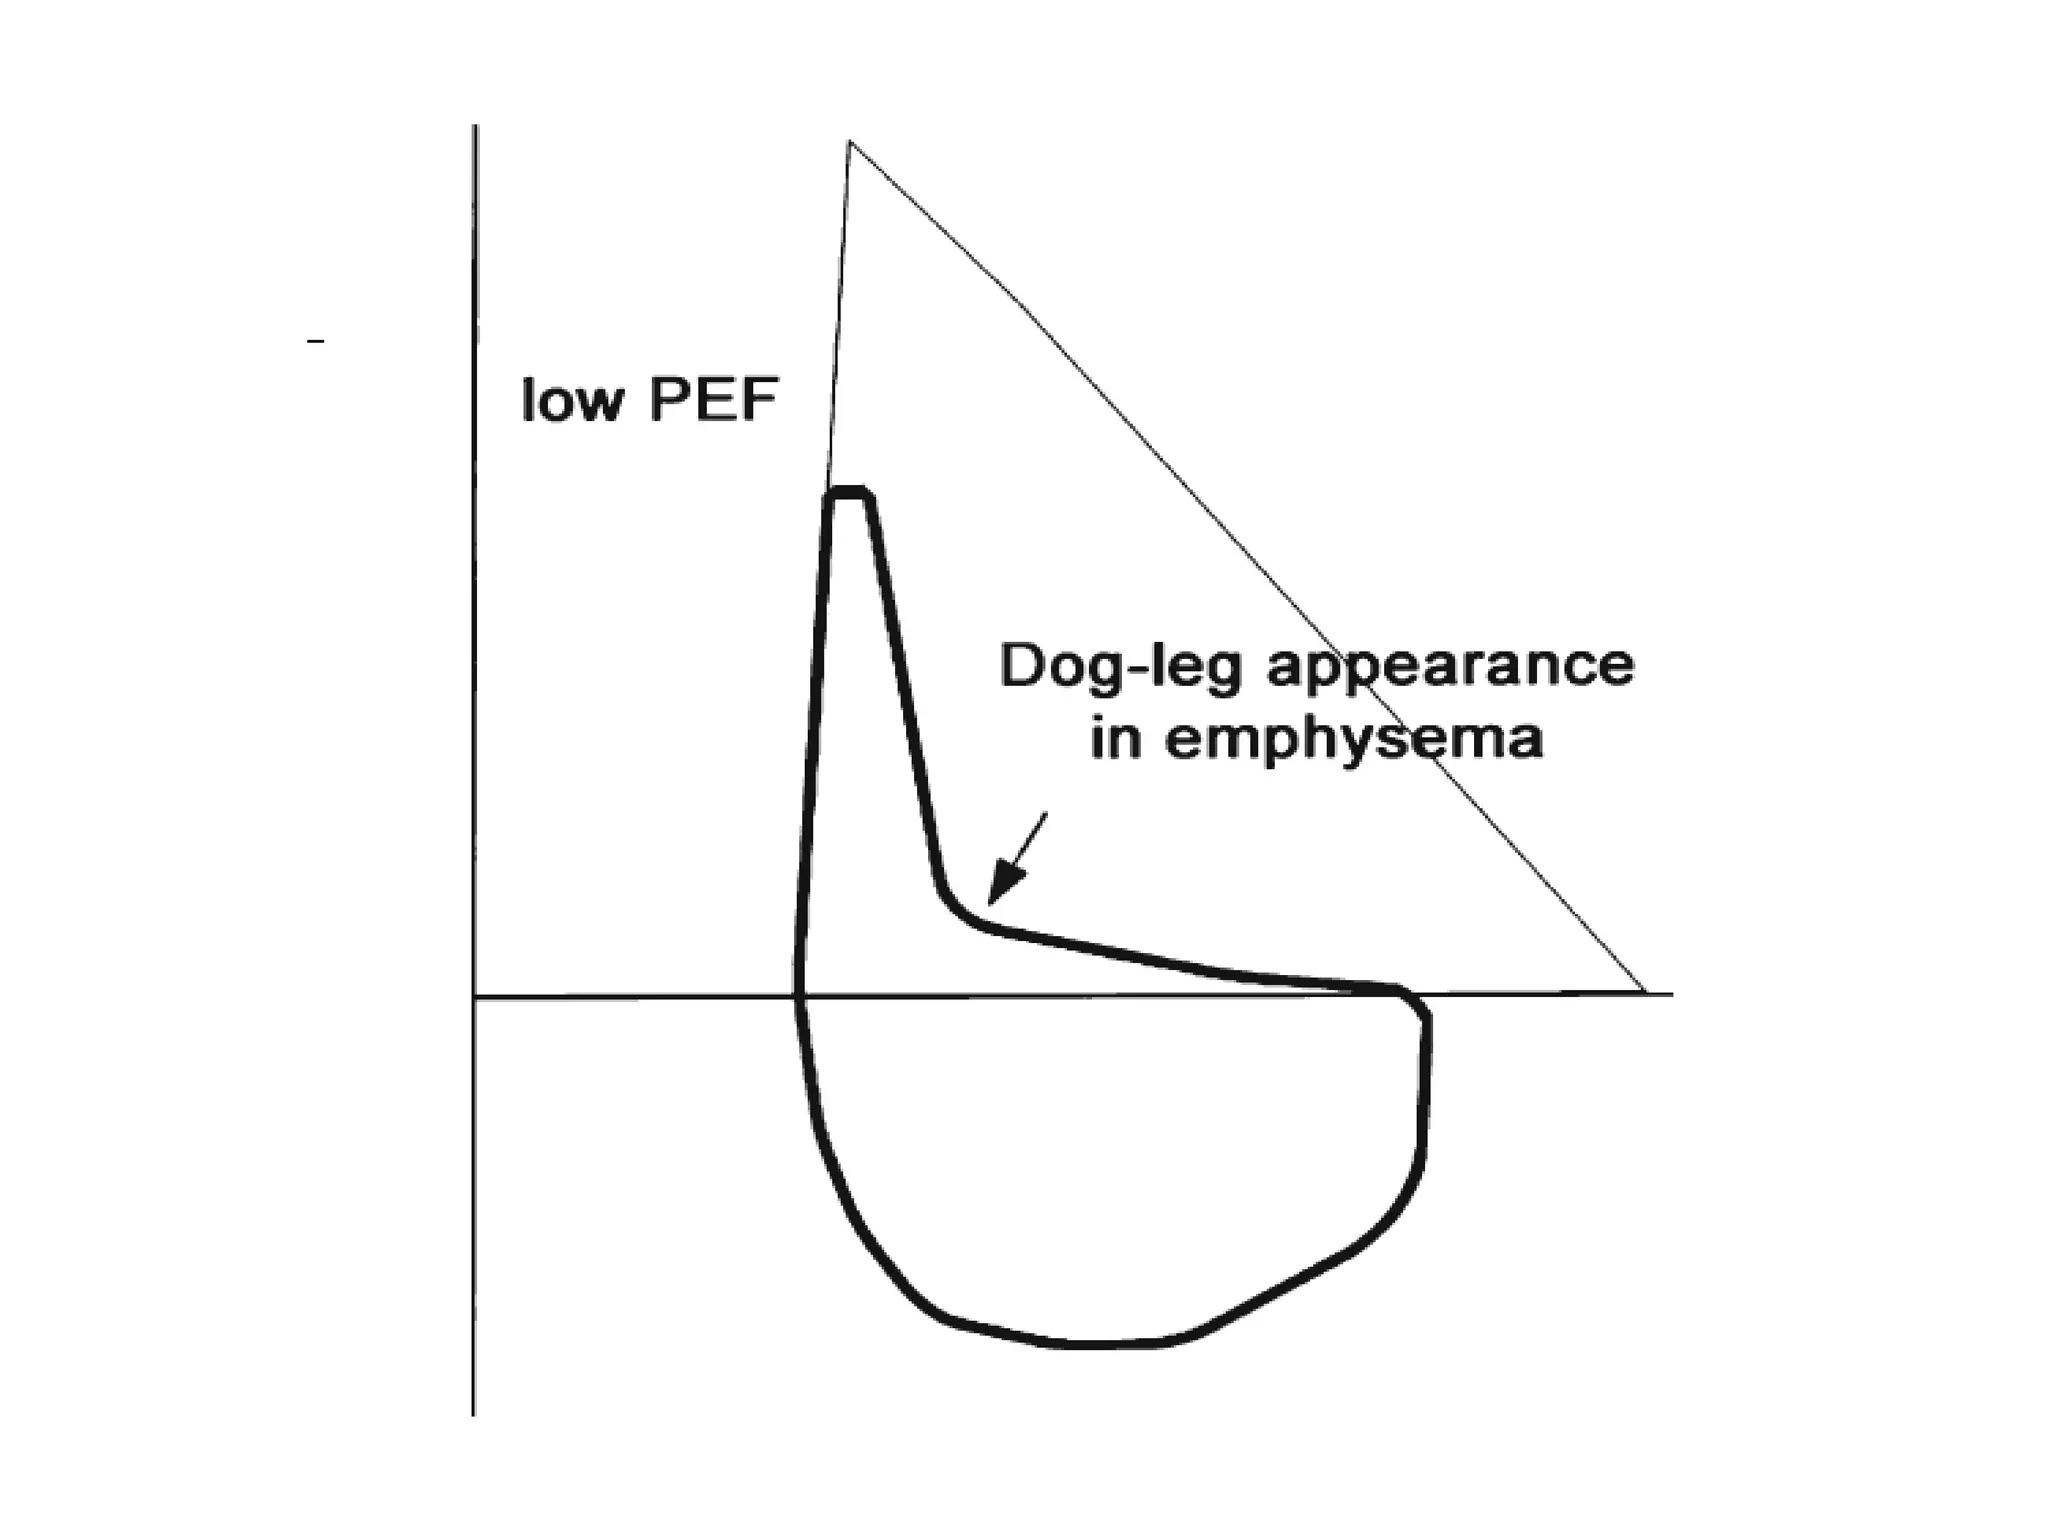
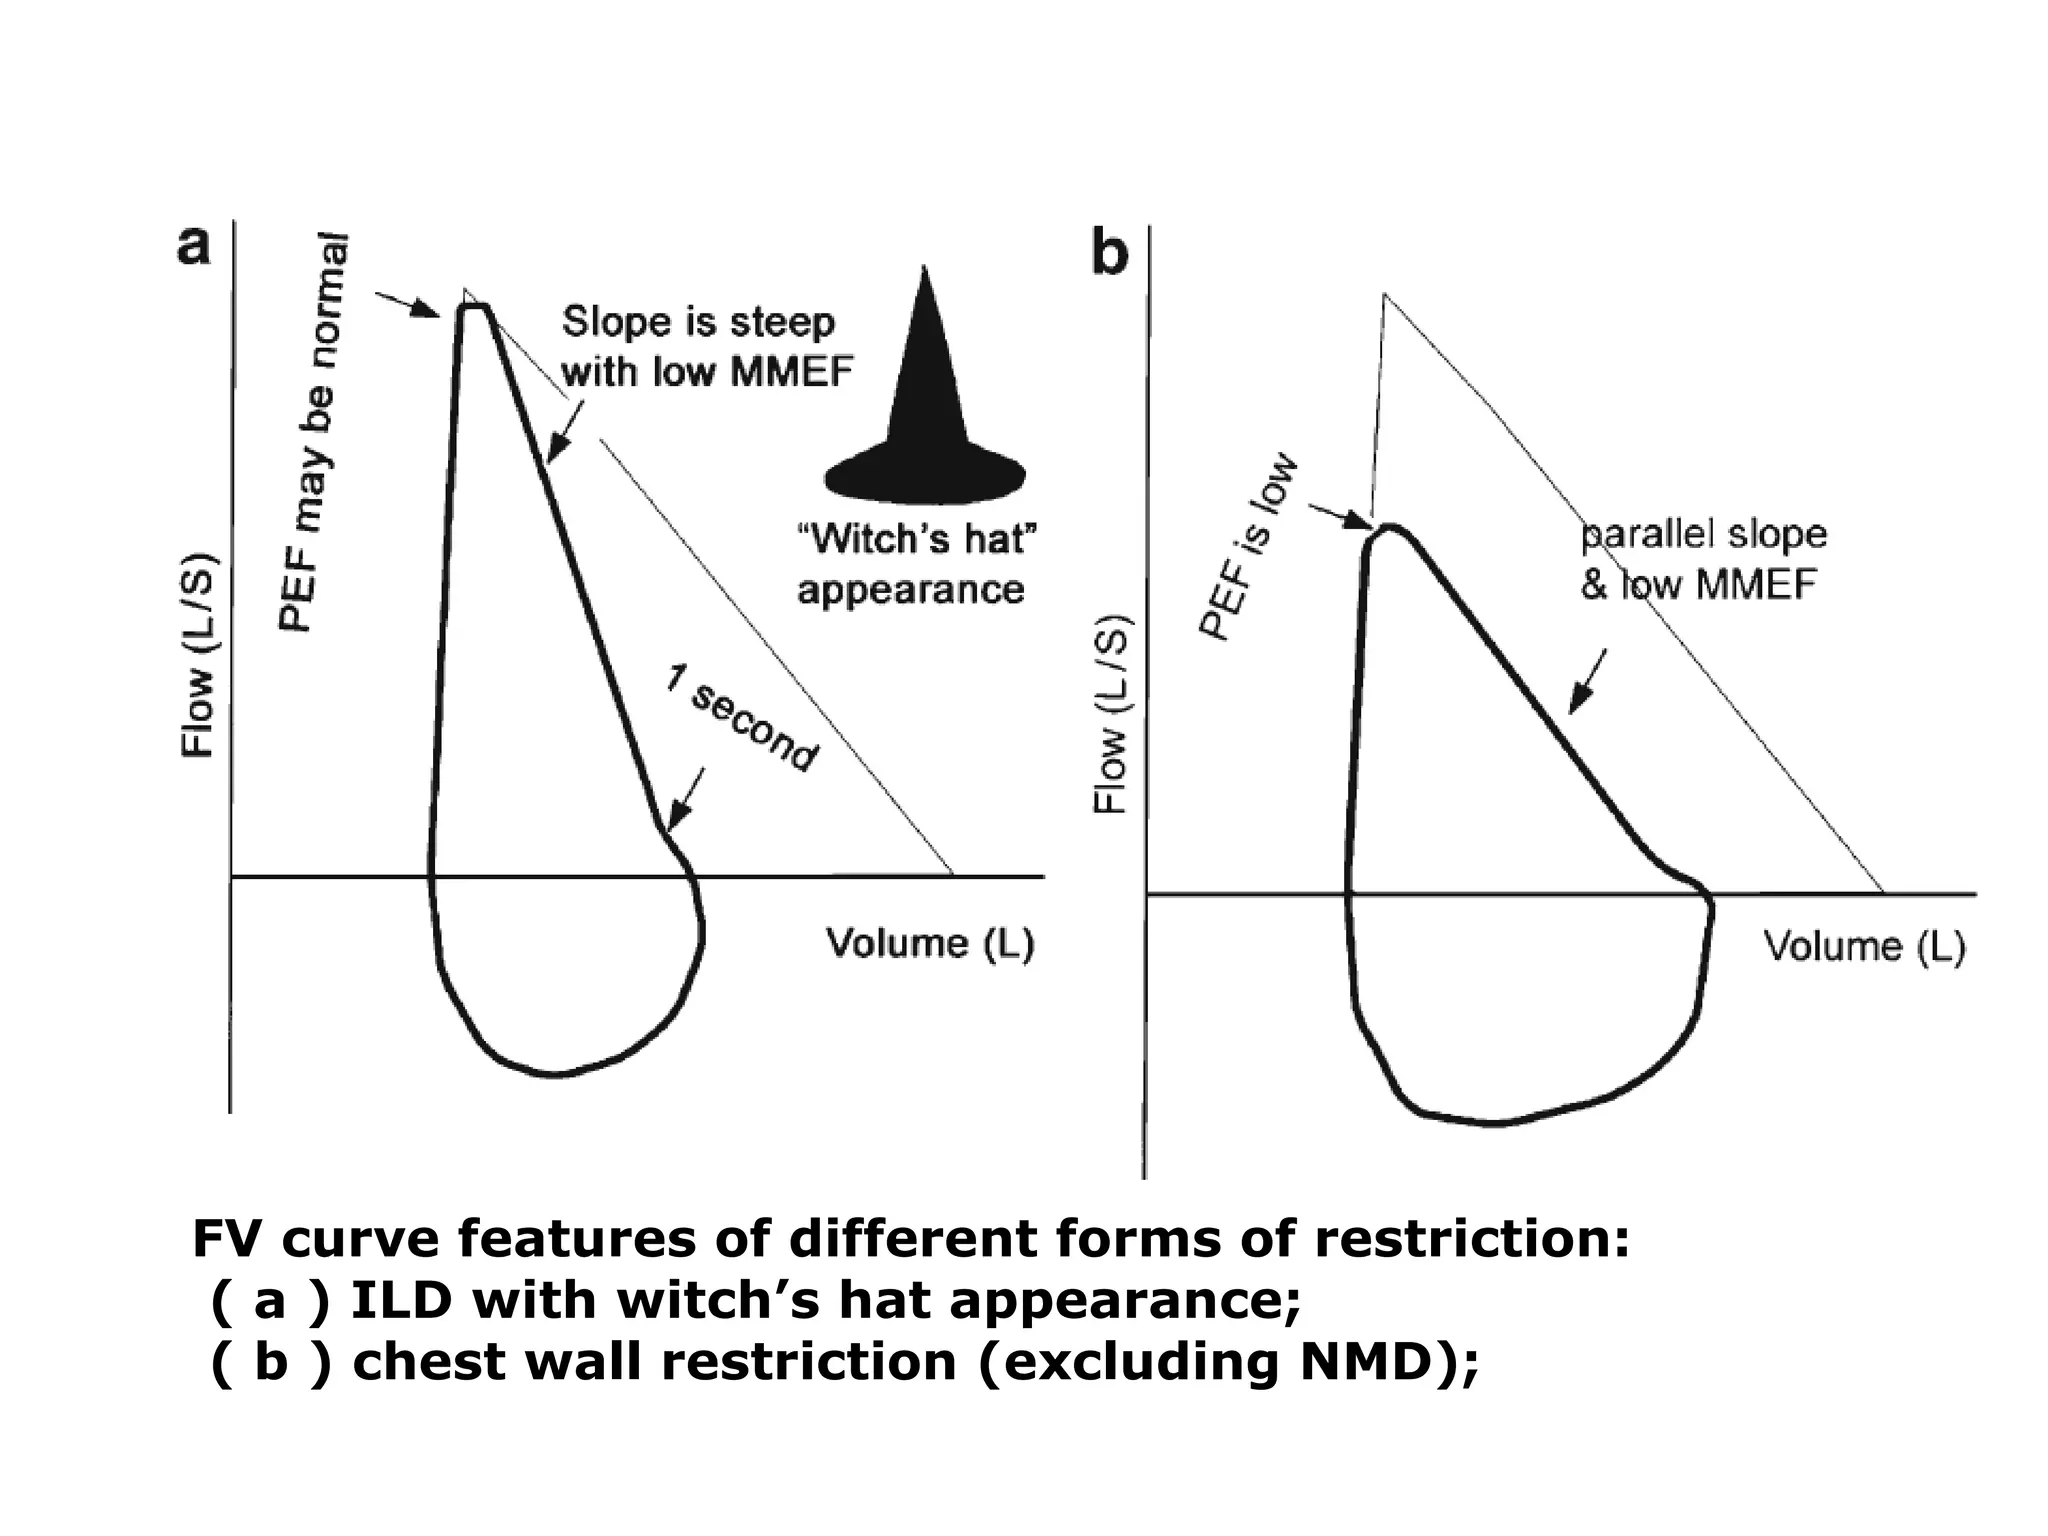
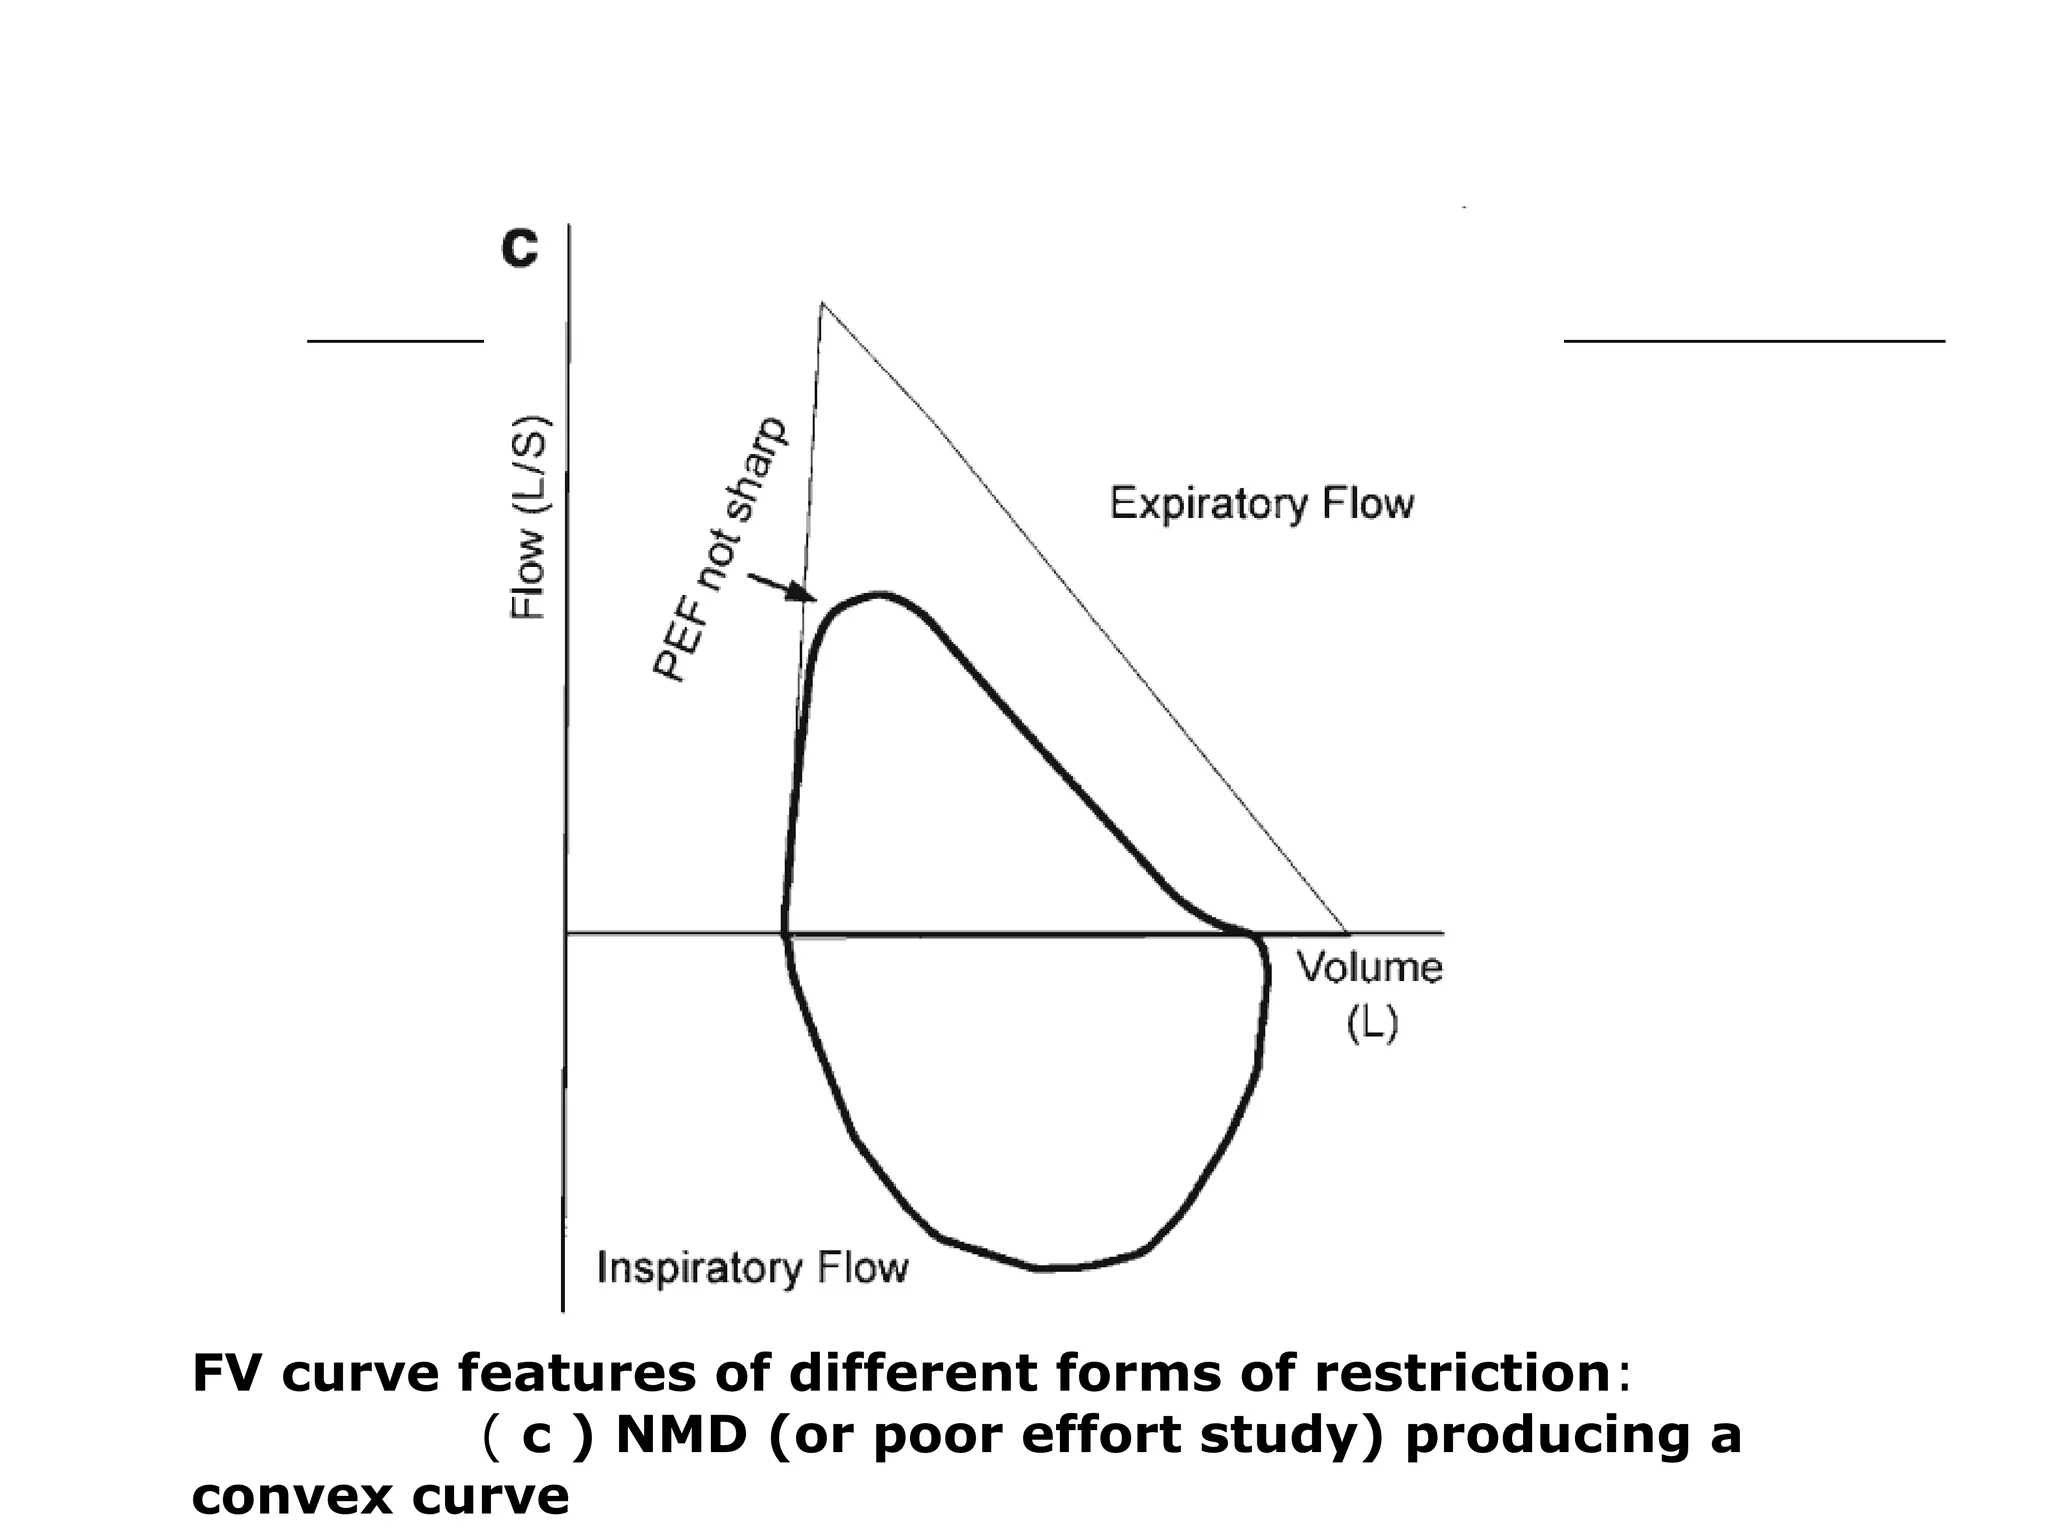
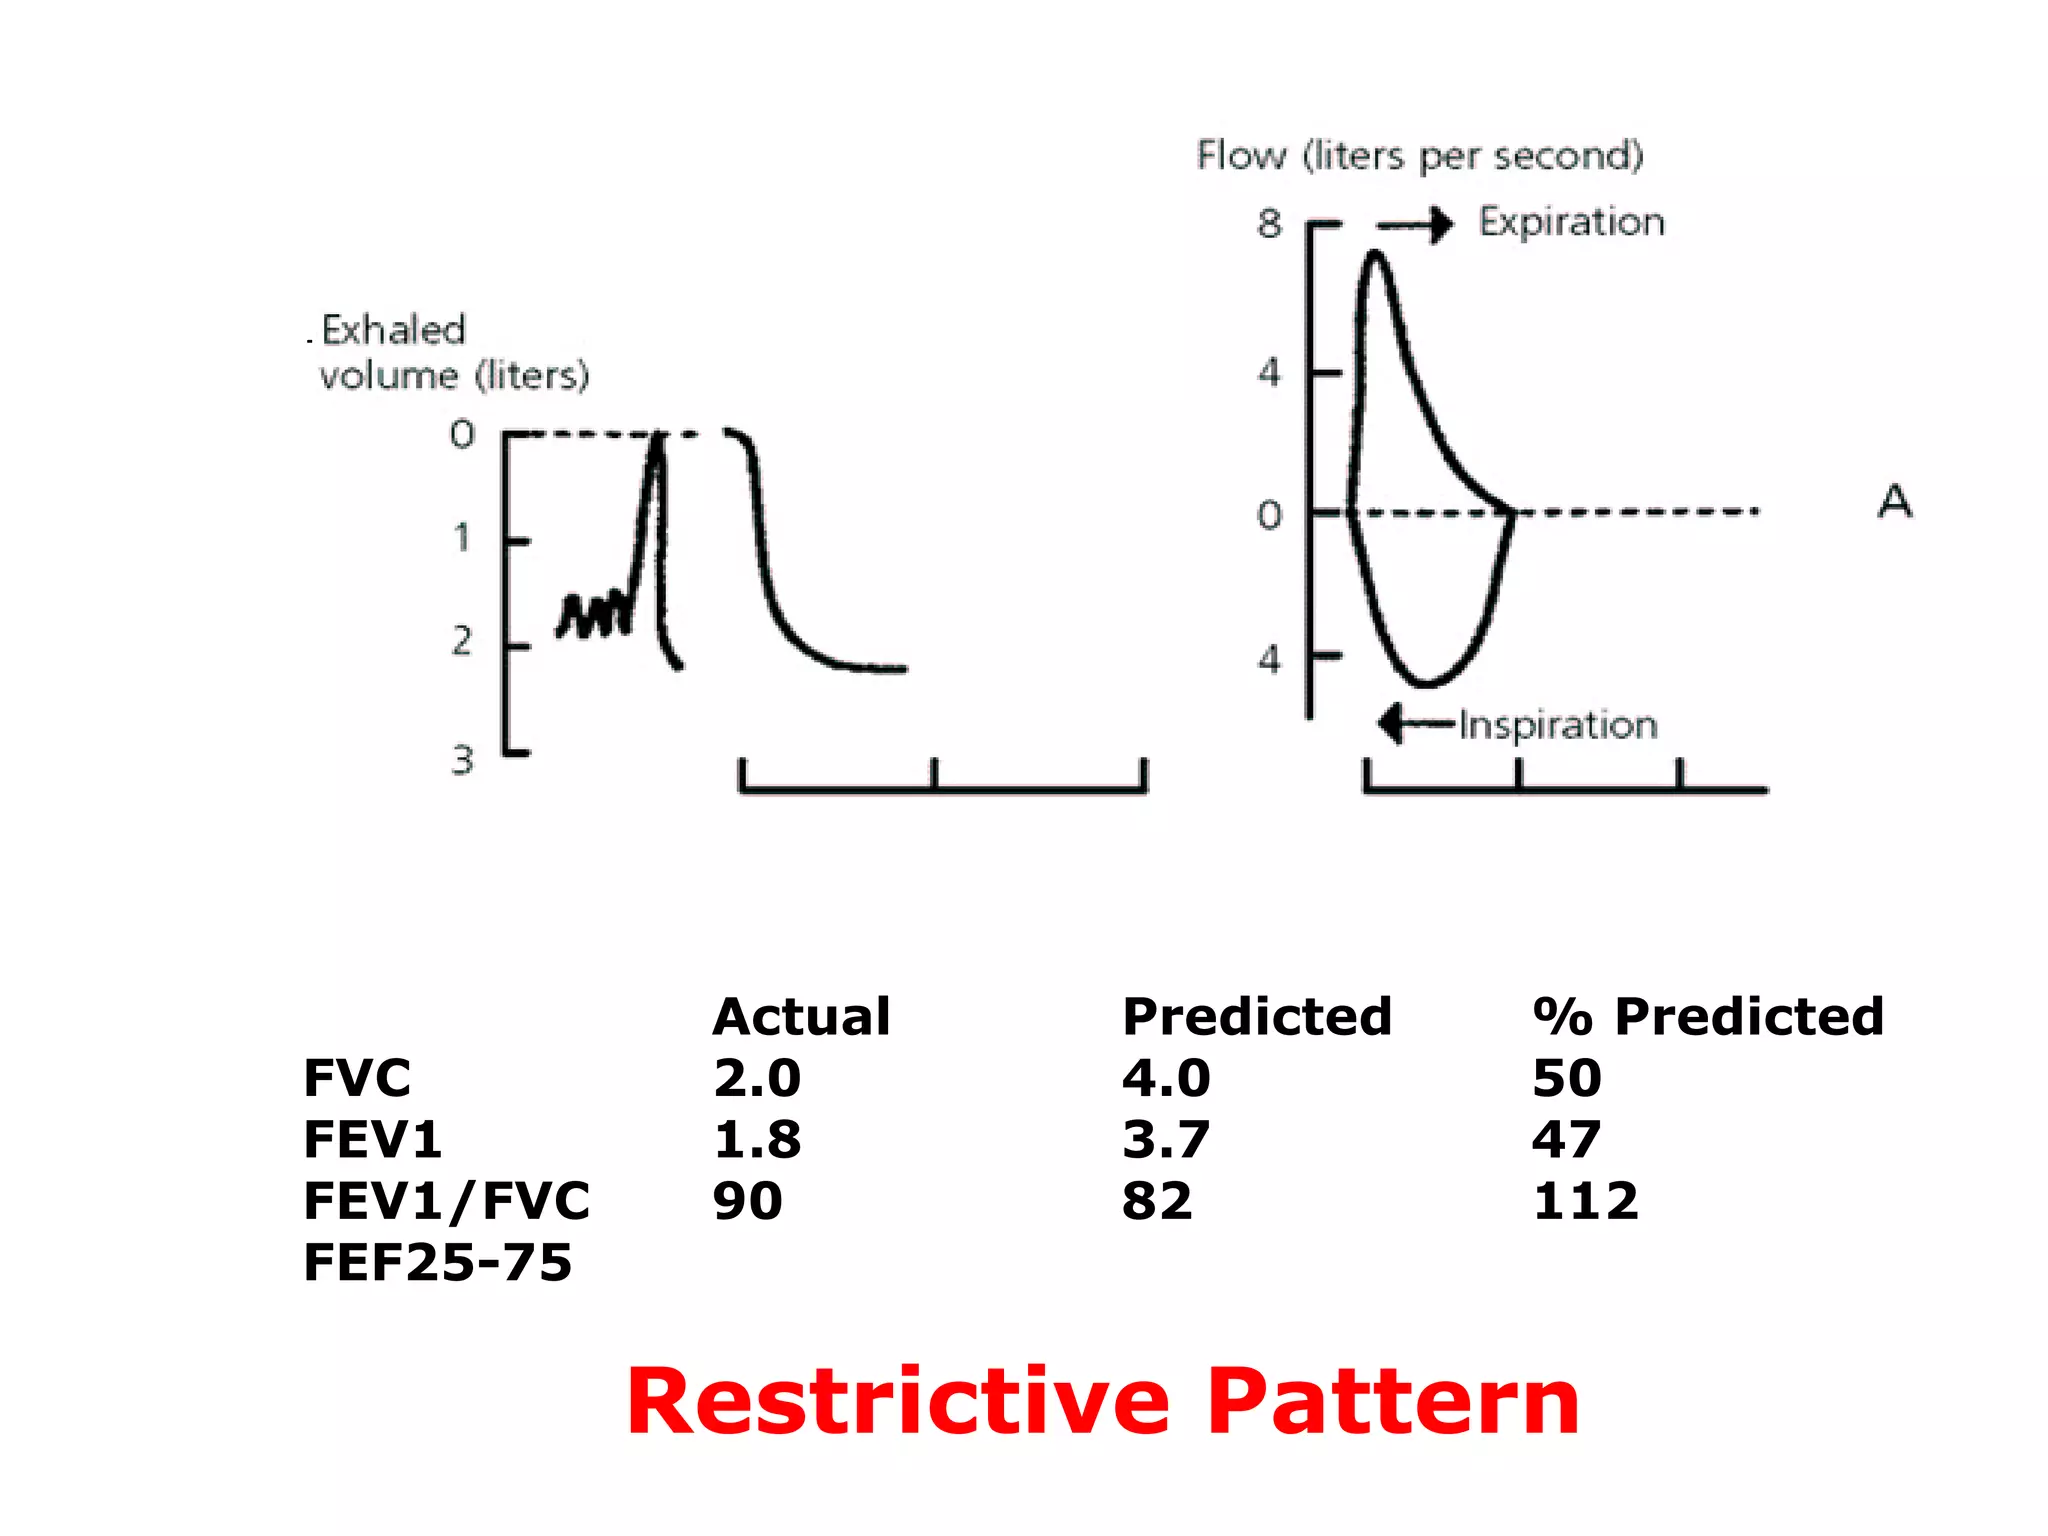
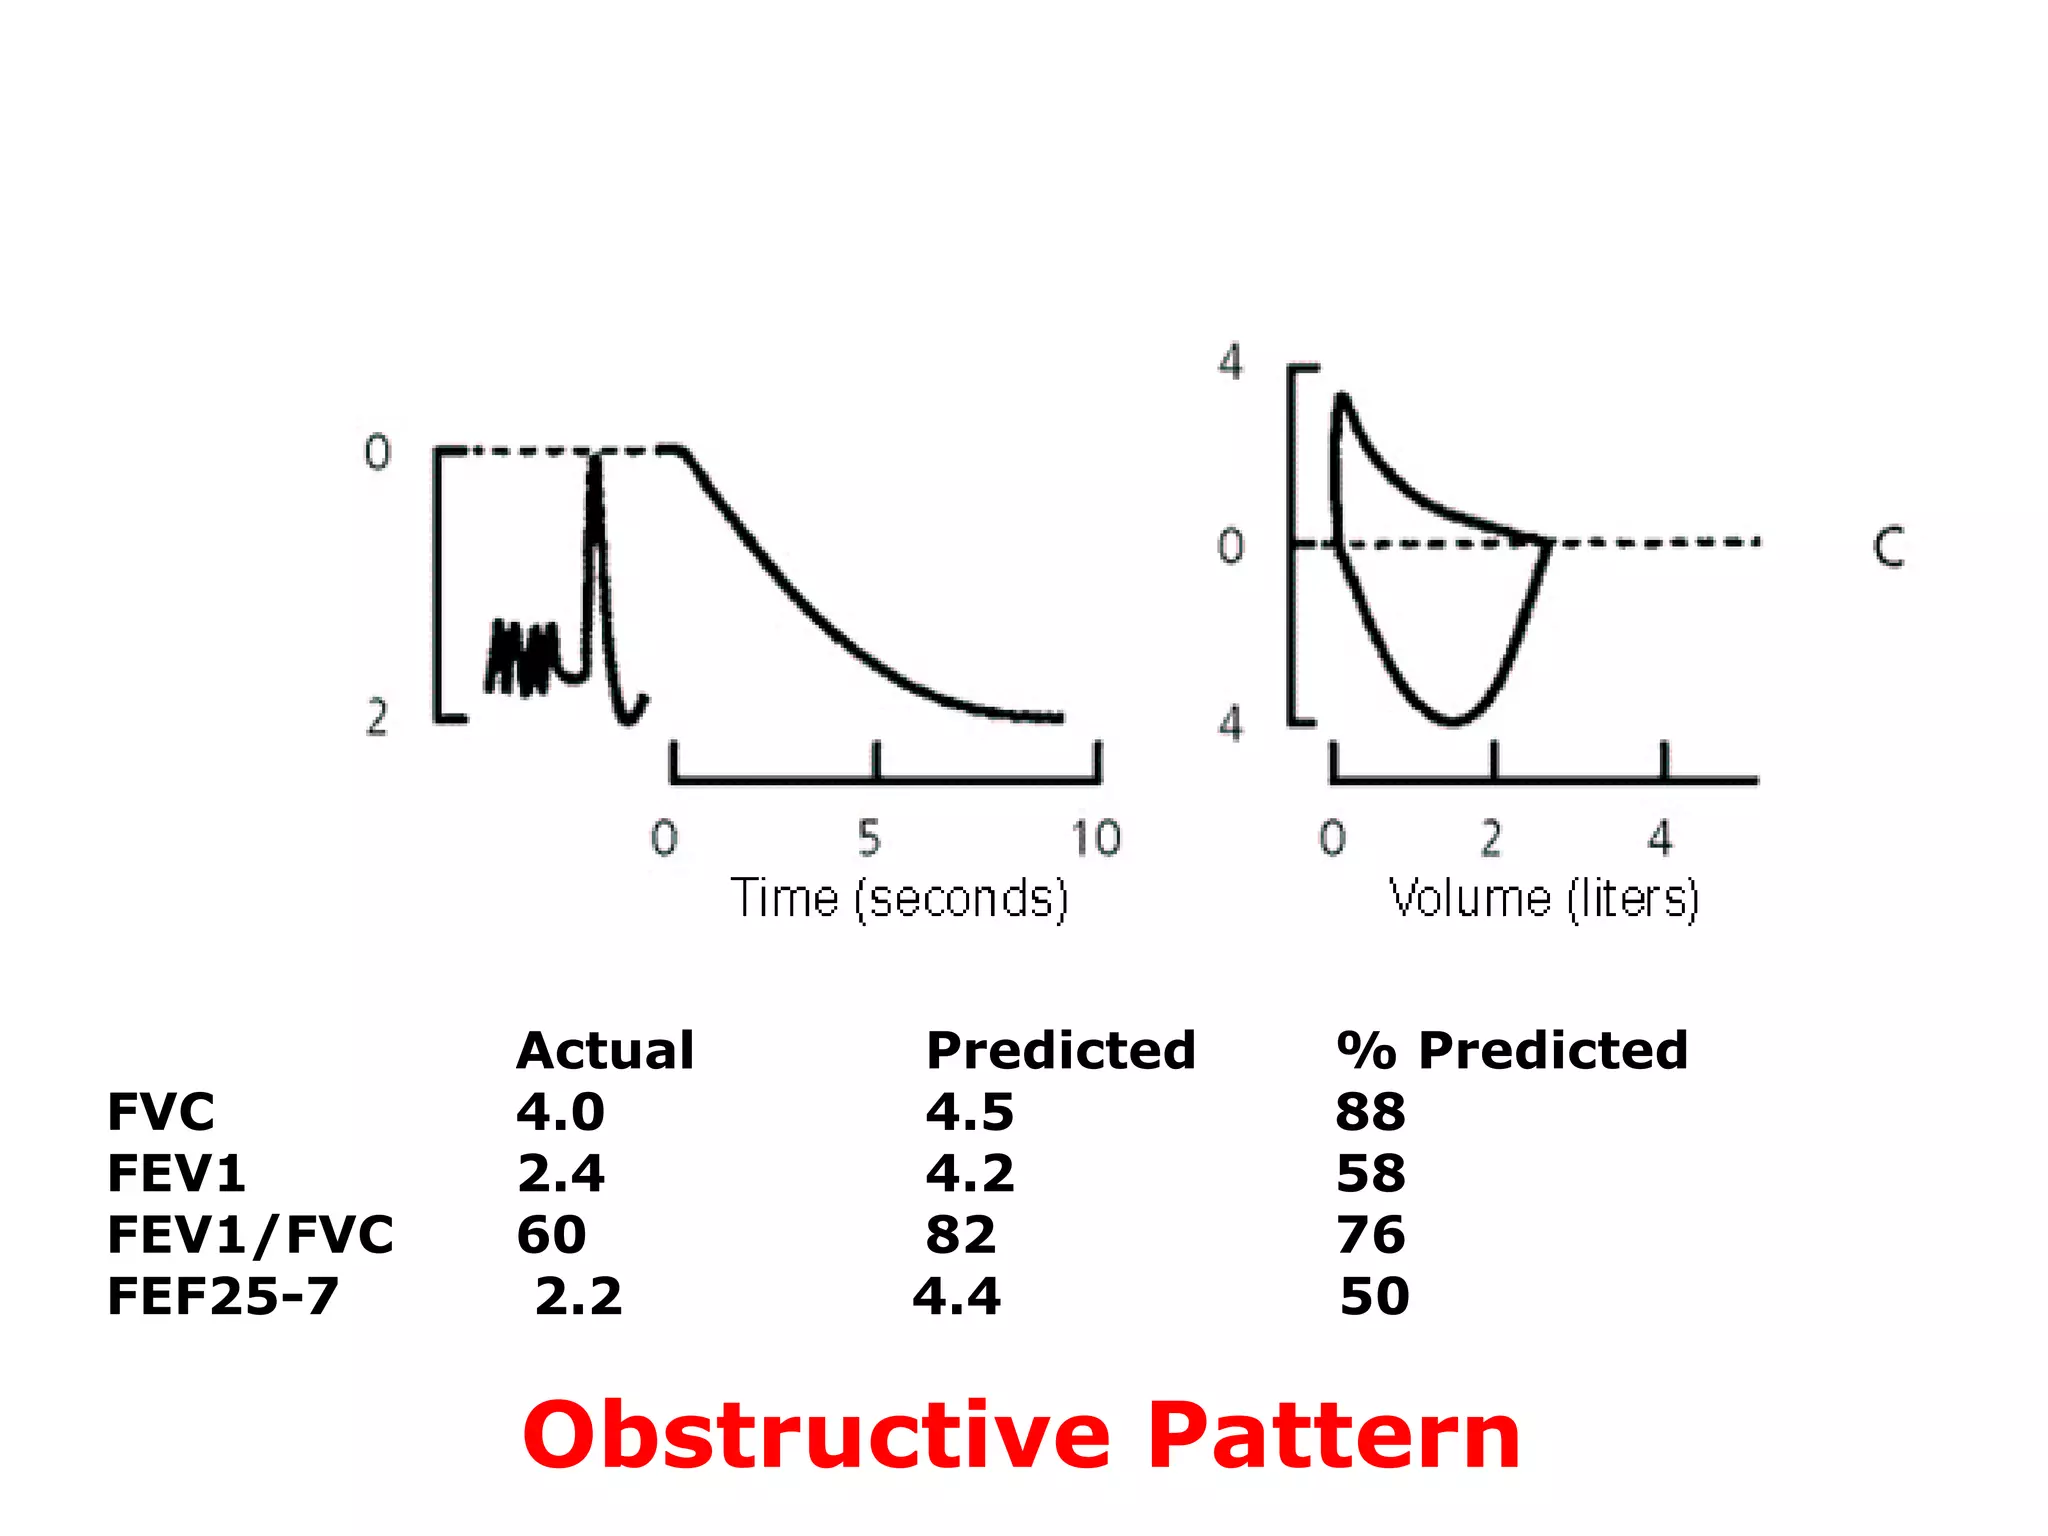
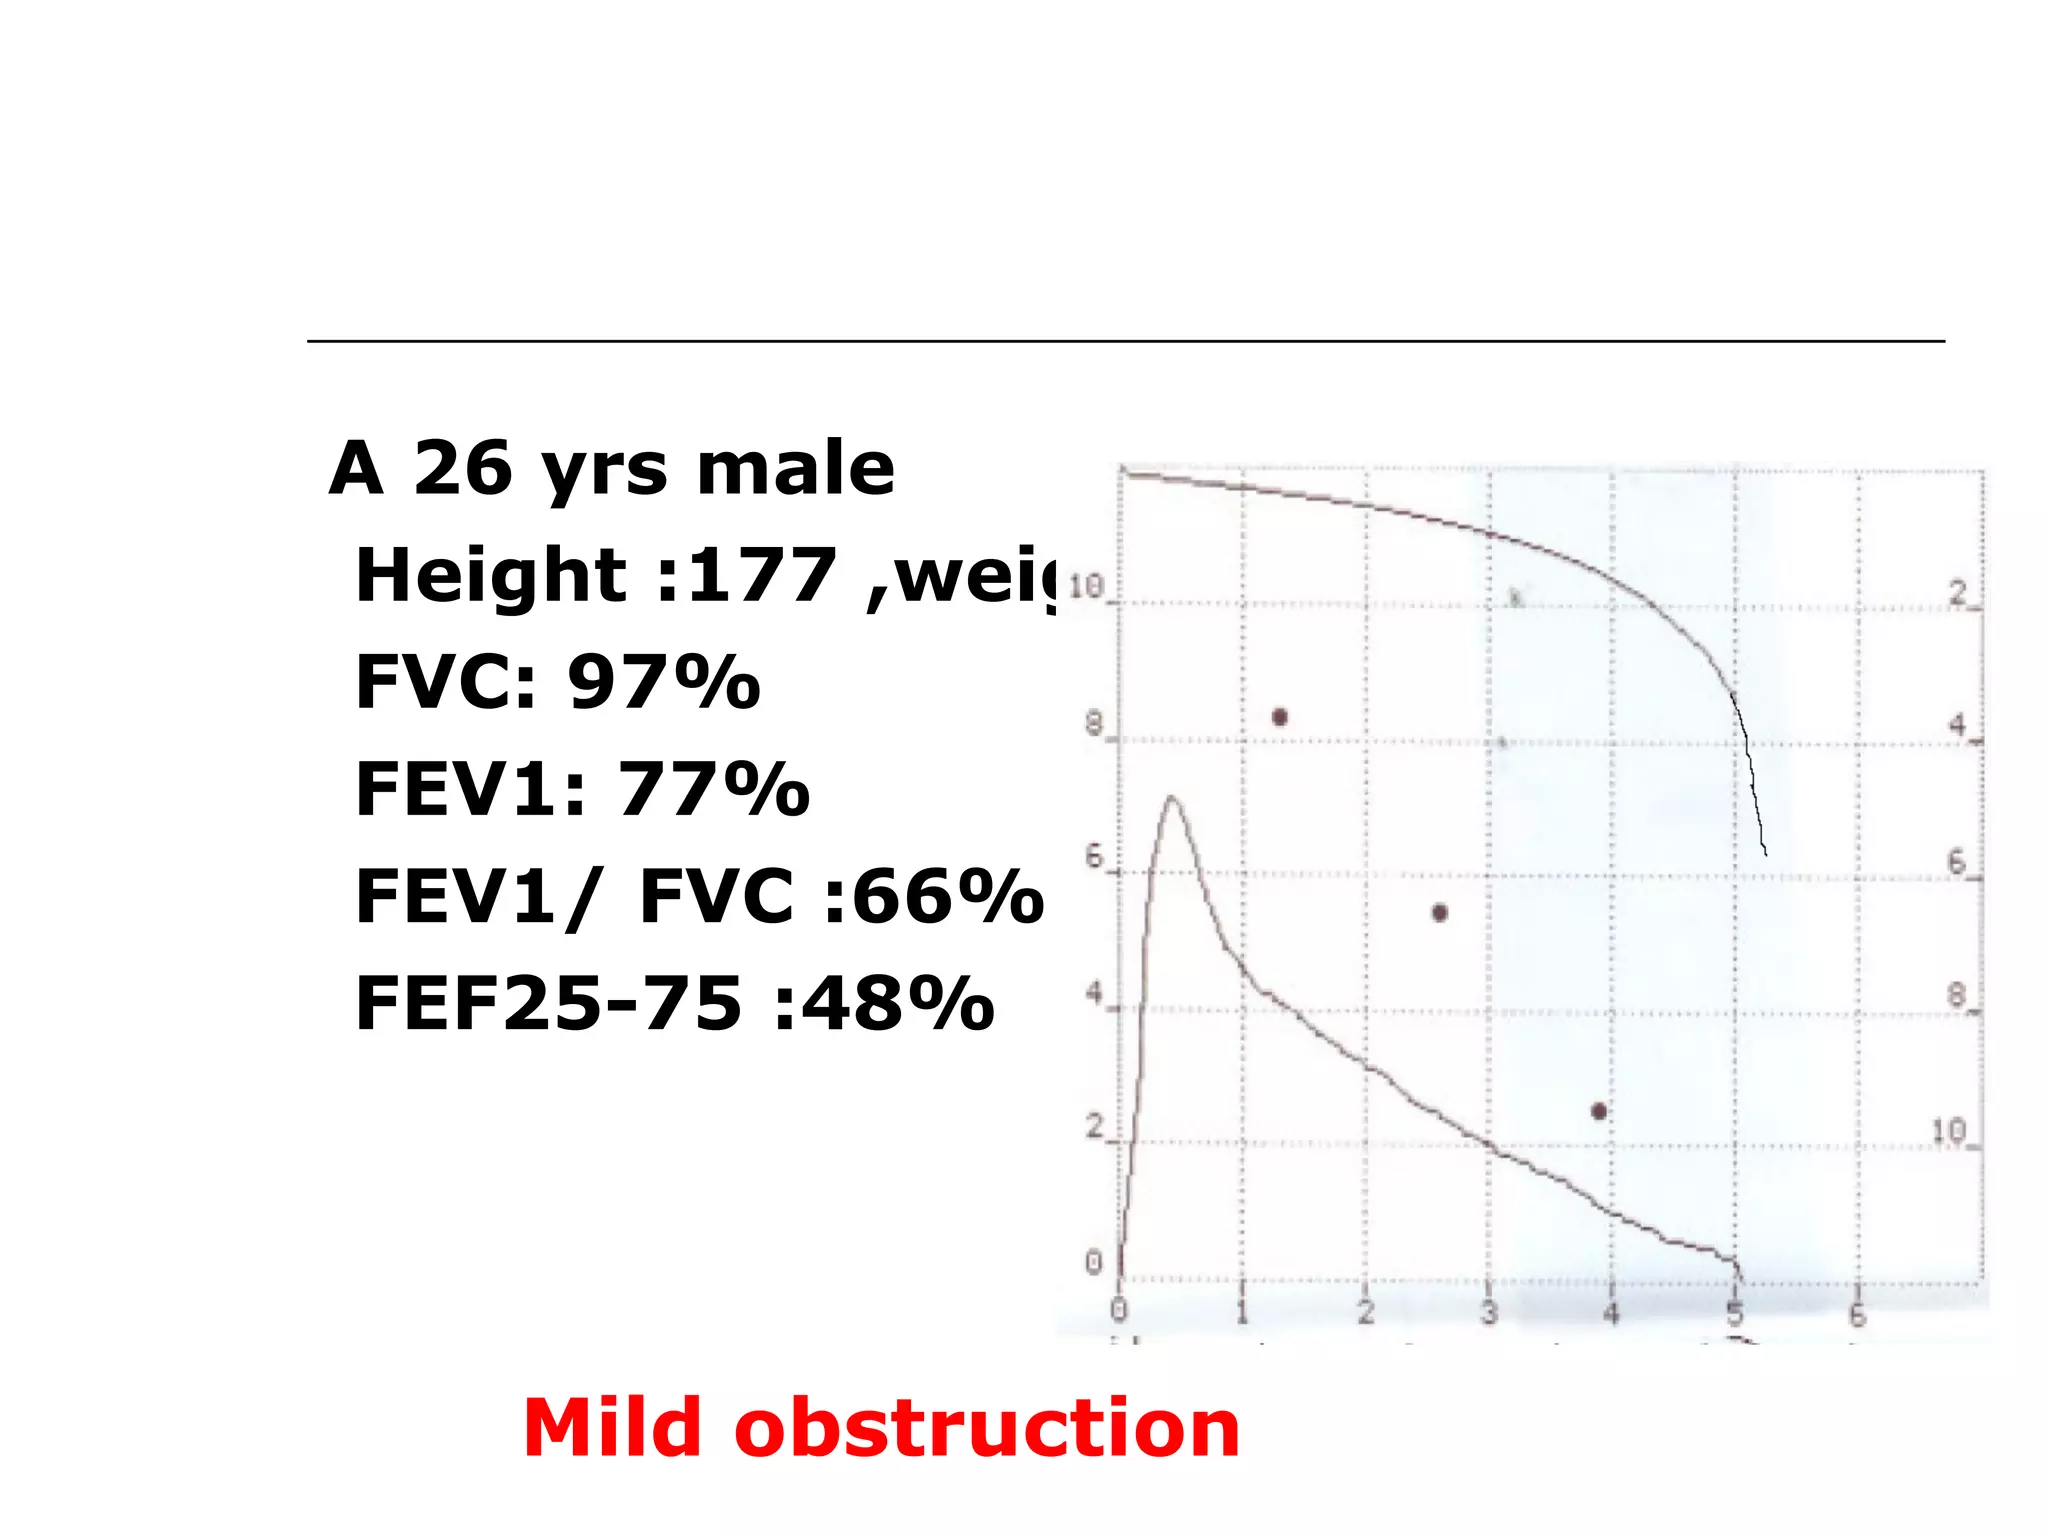
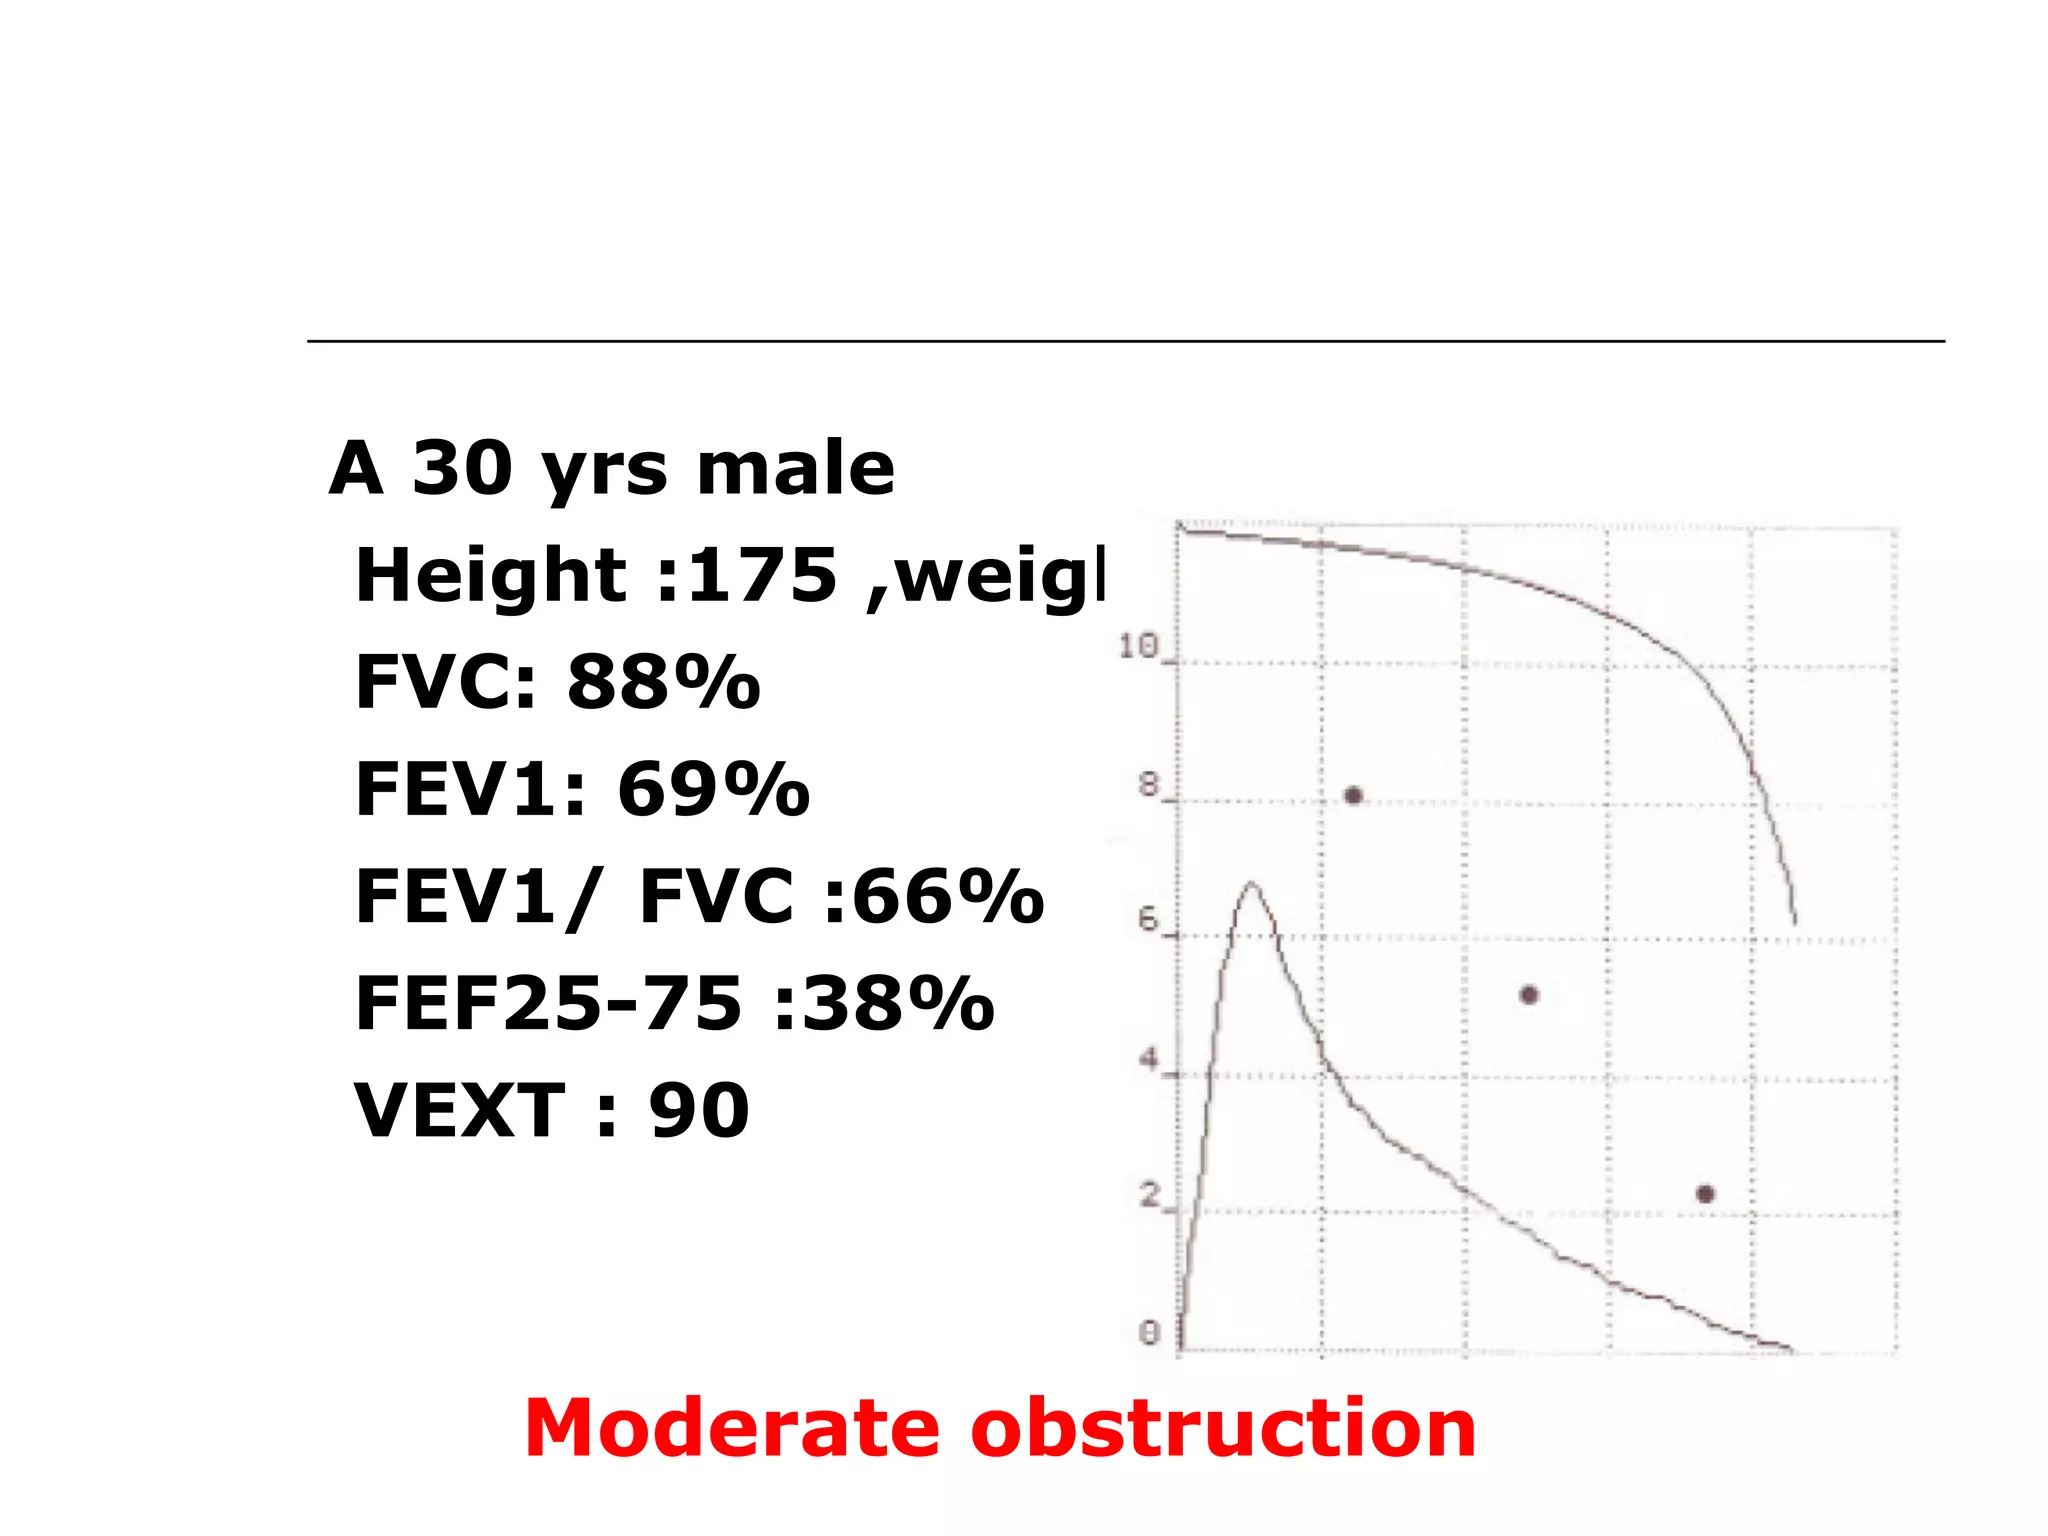
Generated data includes volume-time curve (FEV1, FVC, ratio) and flow-volume loop indicators.
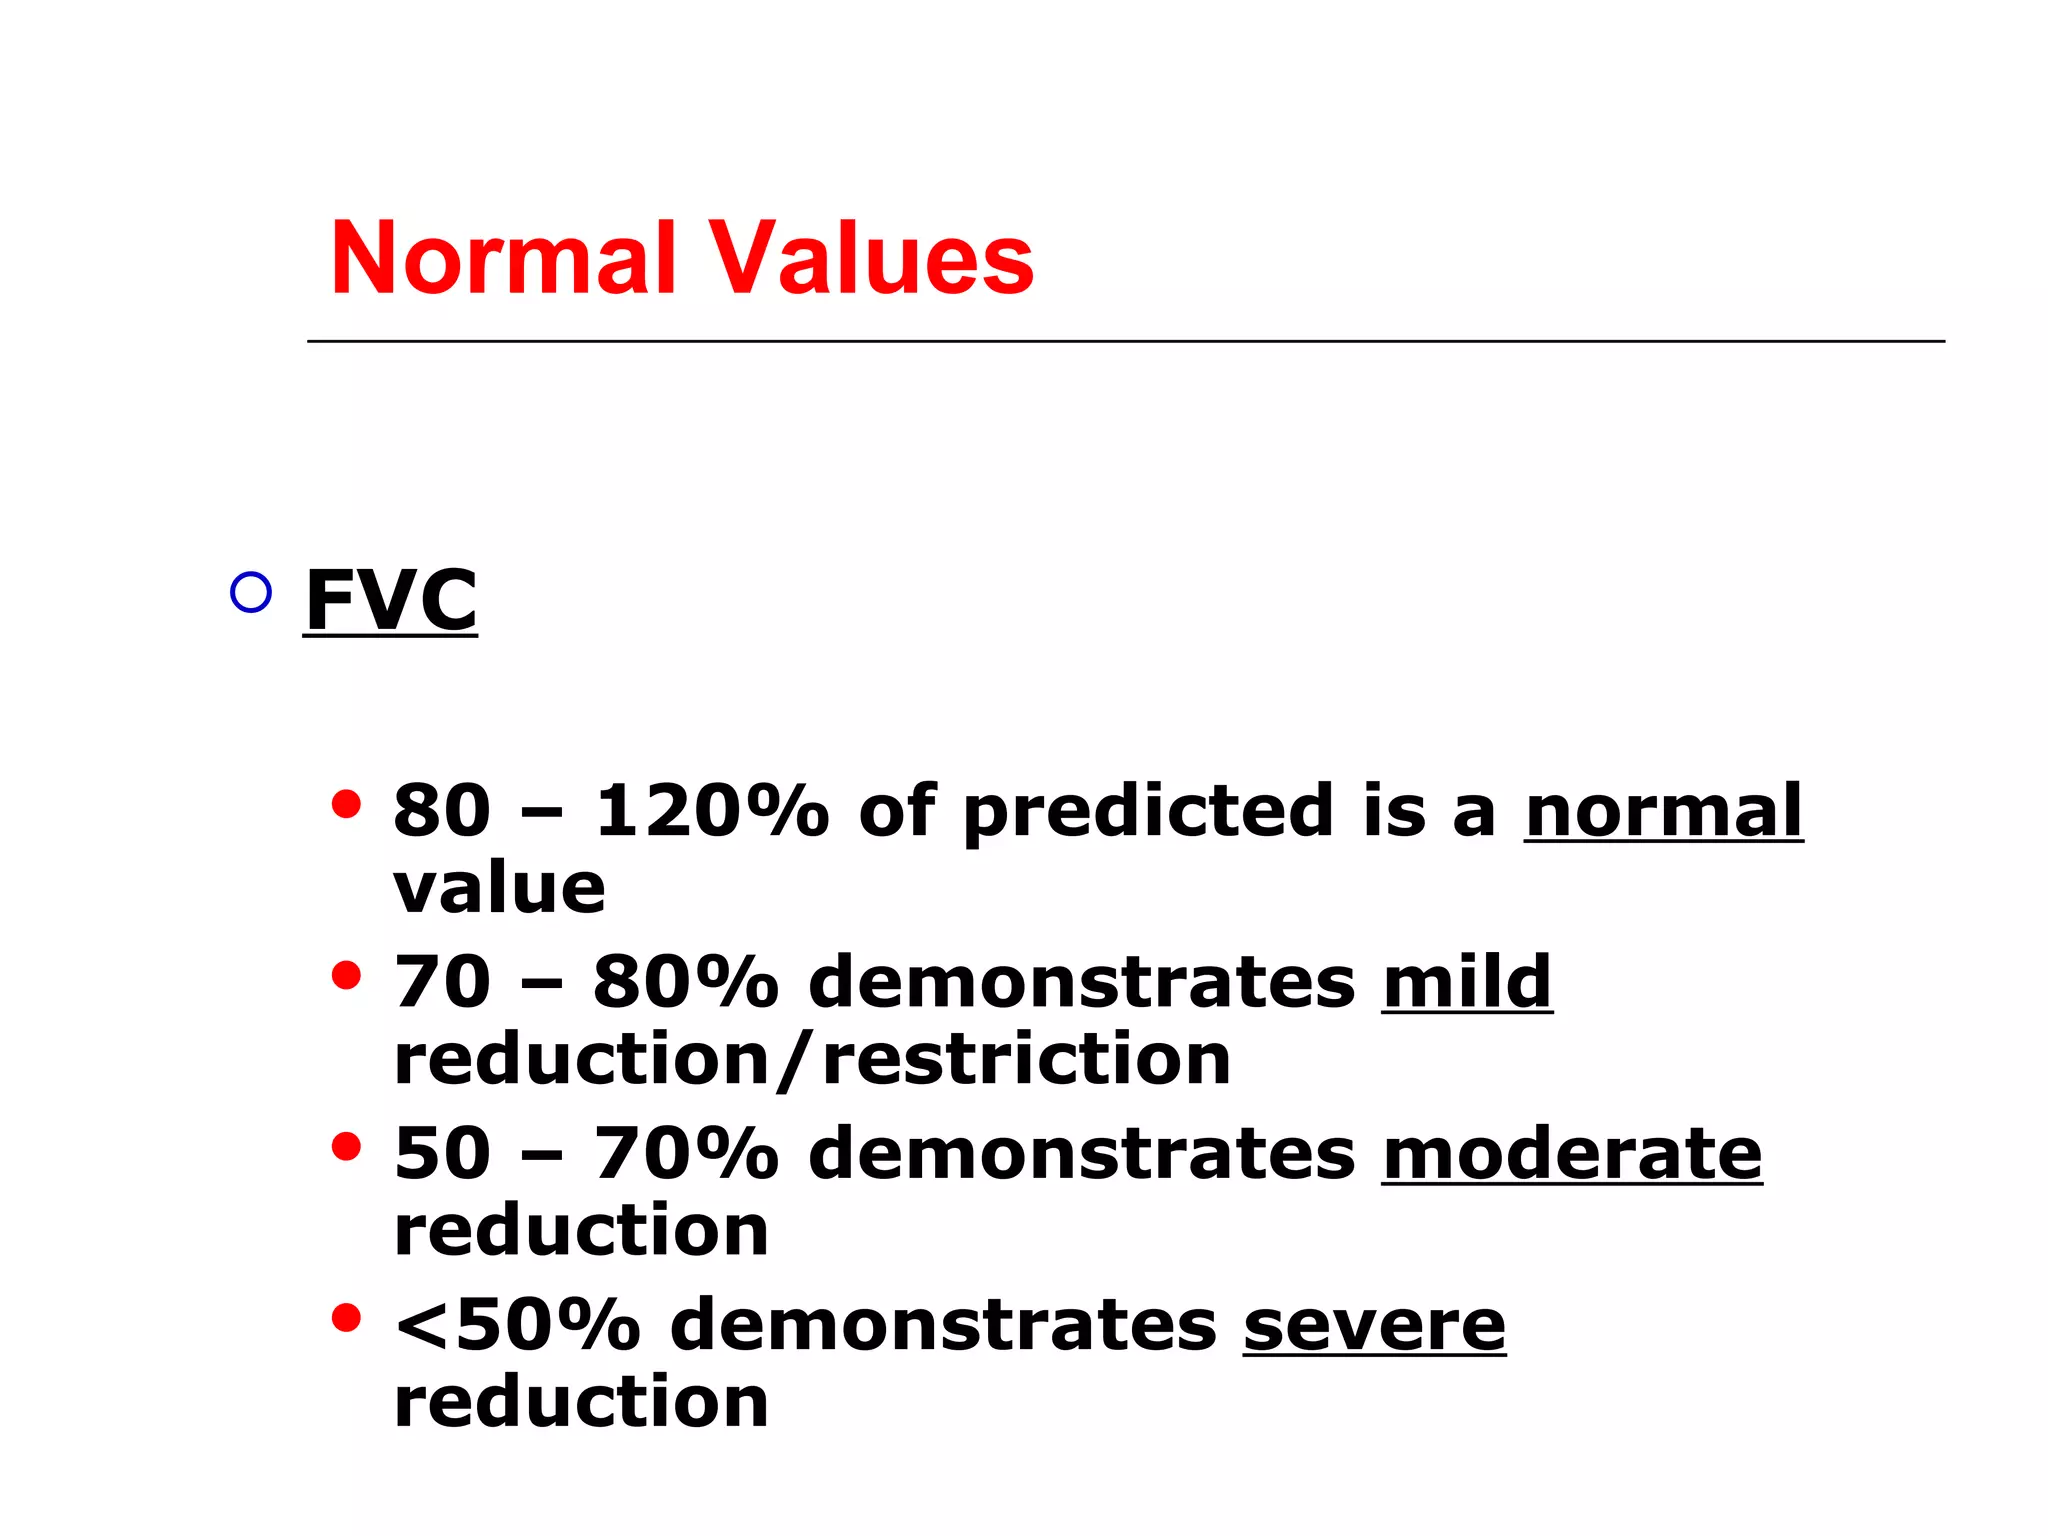
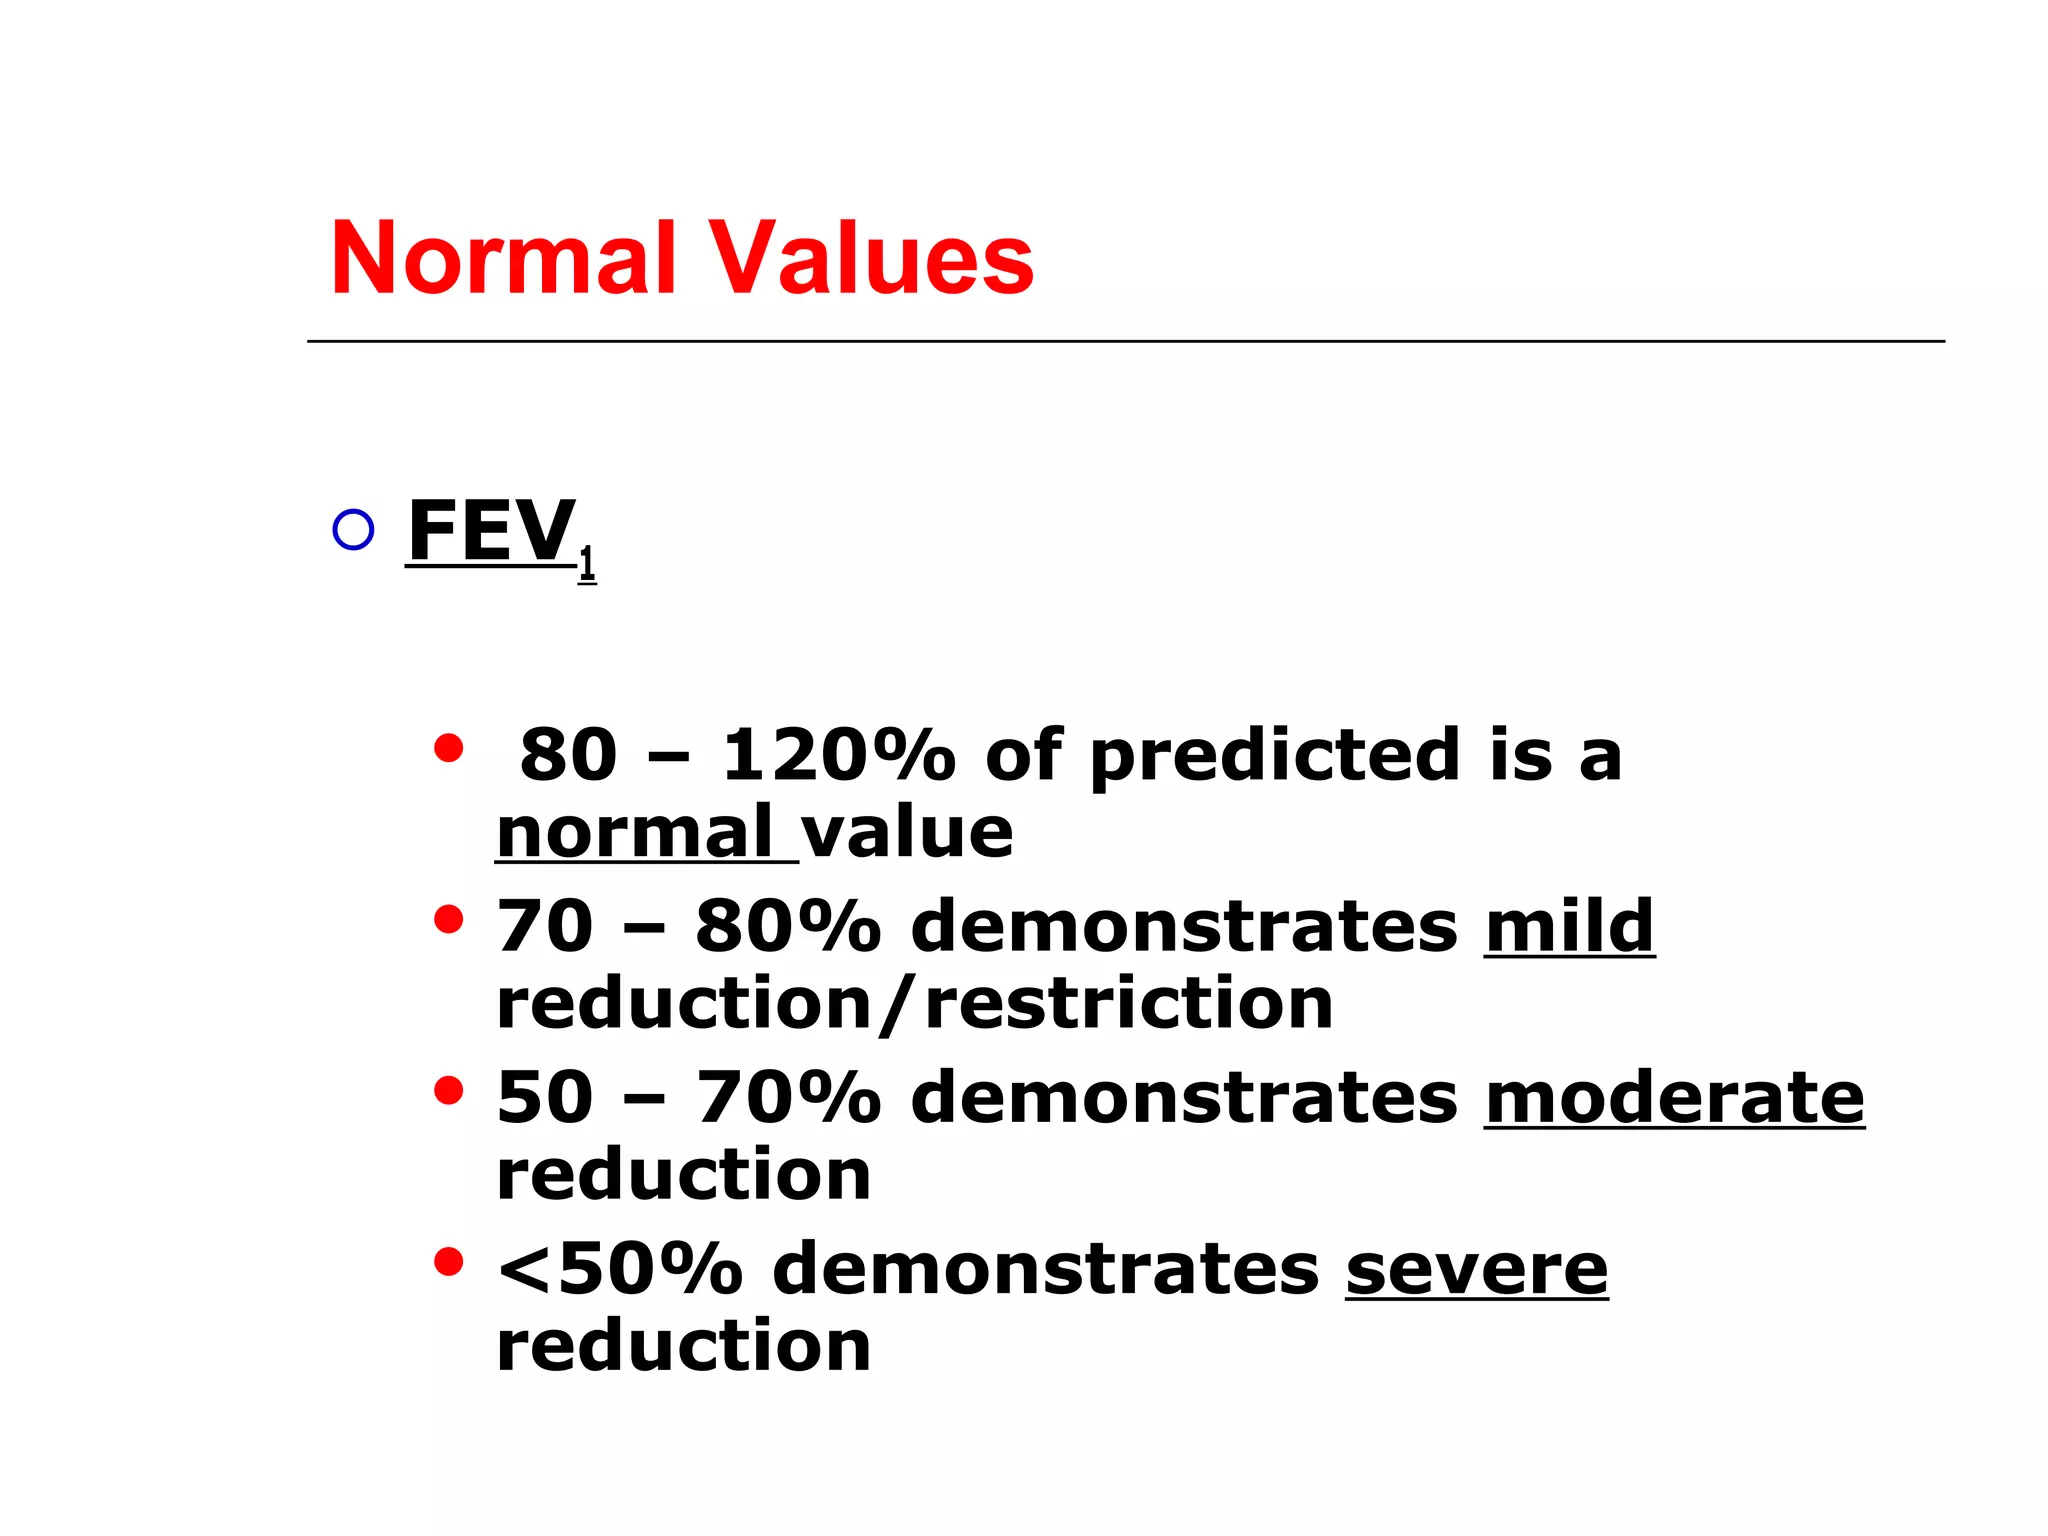
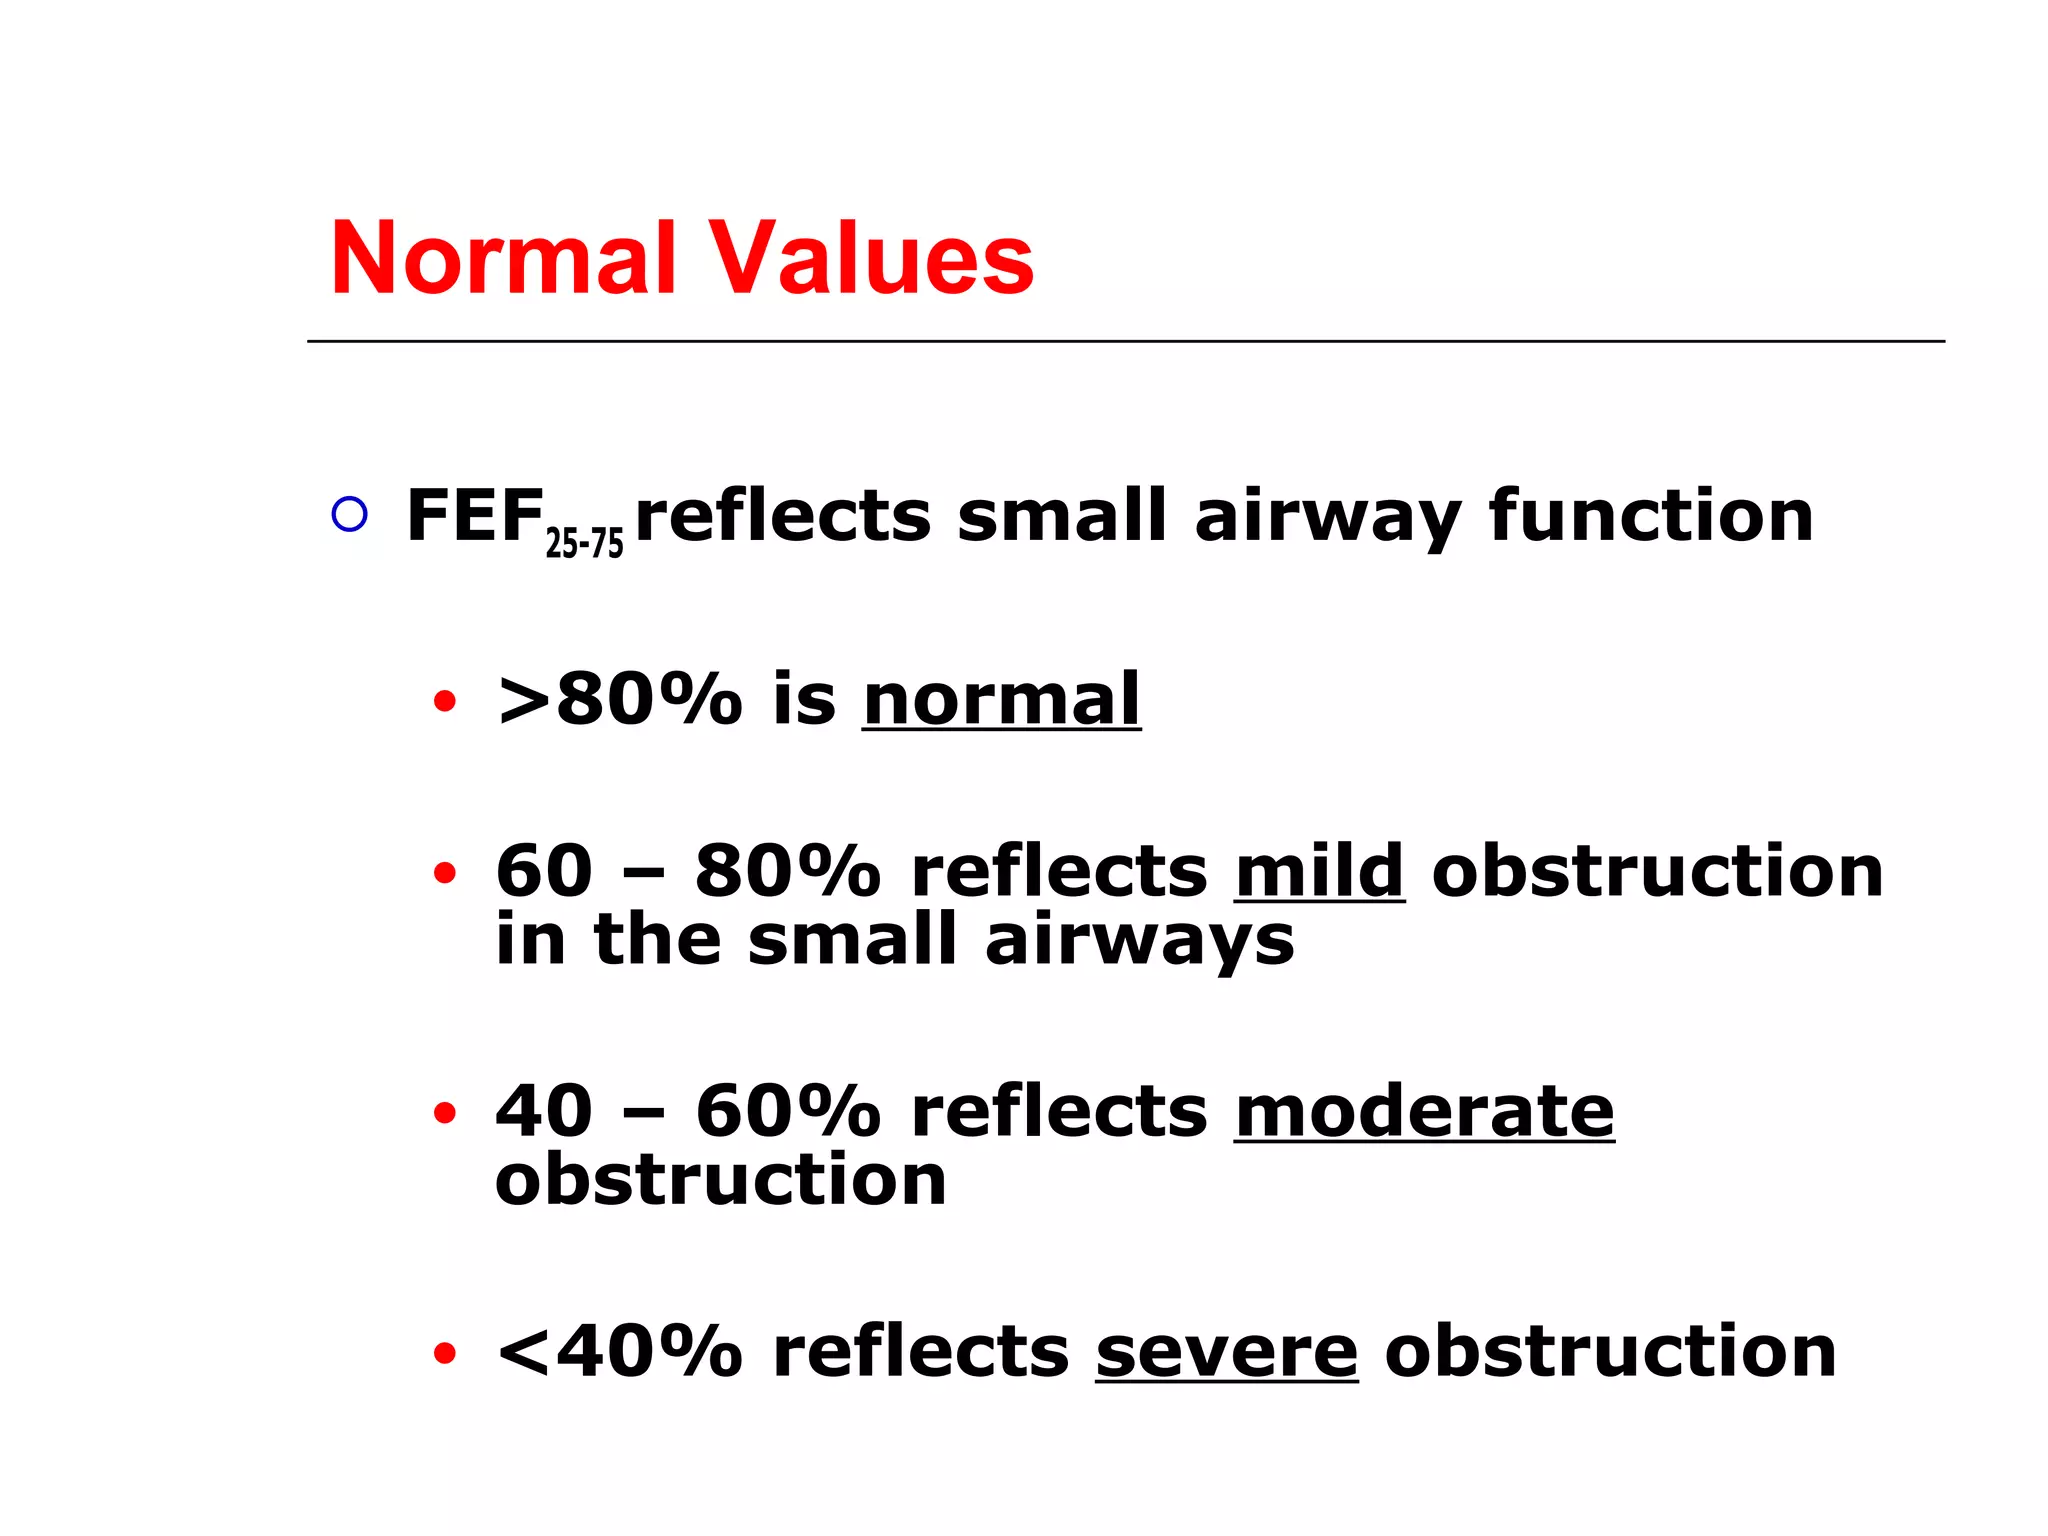
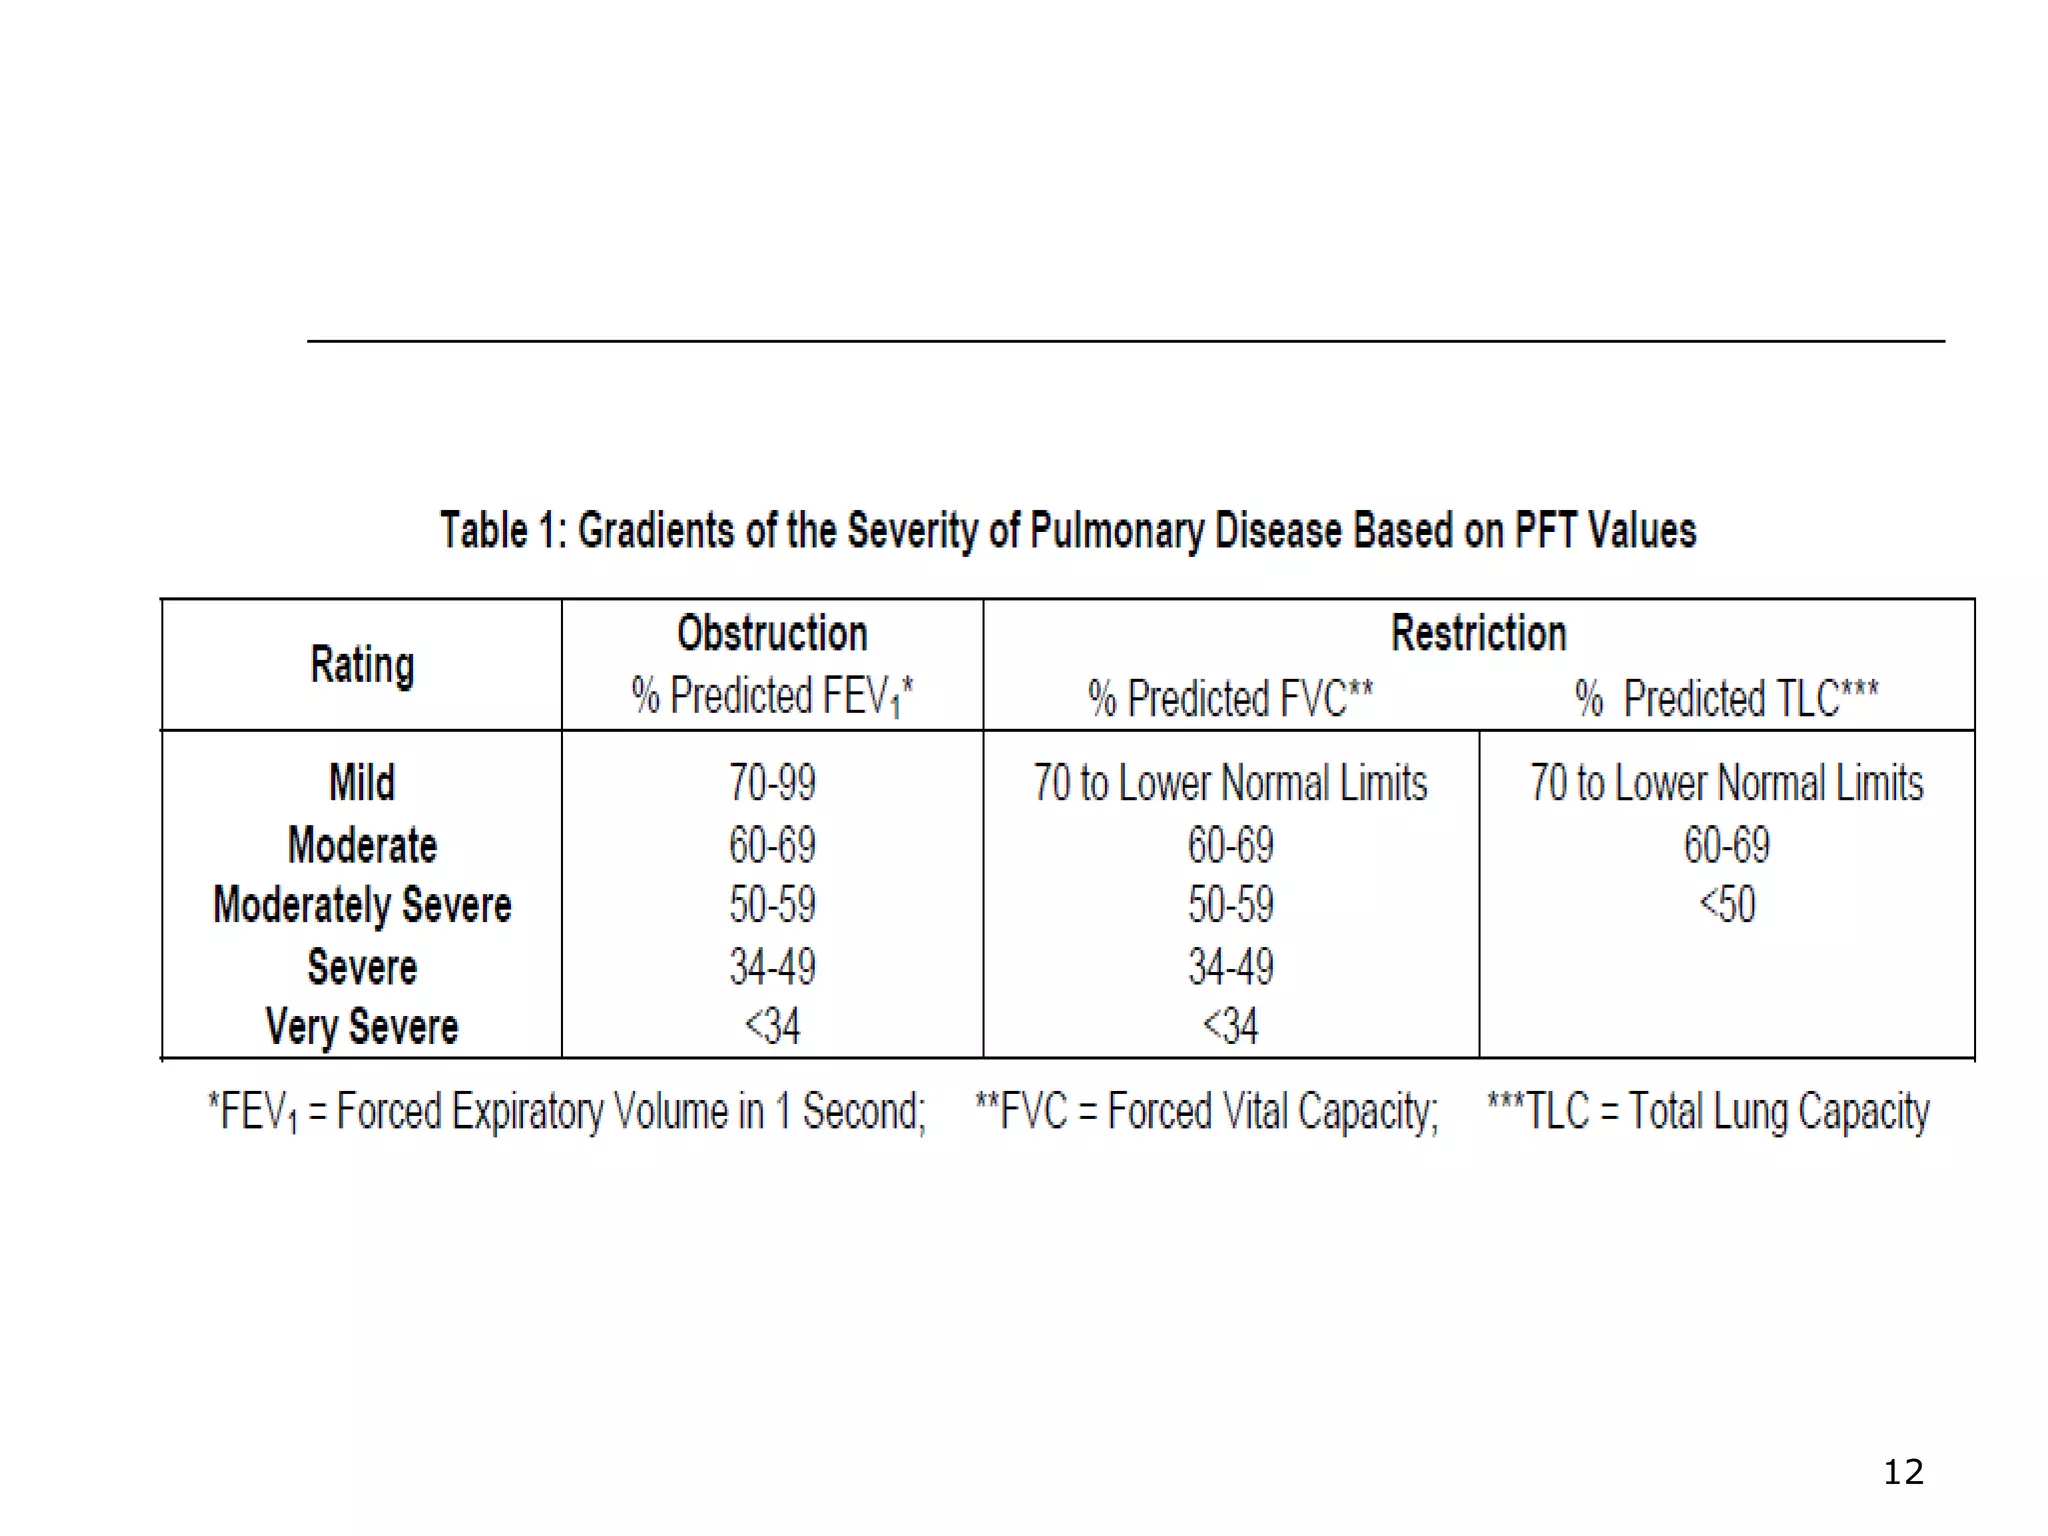
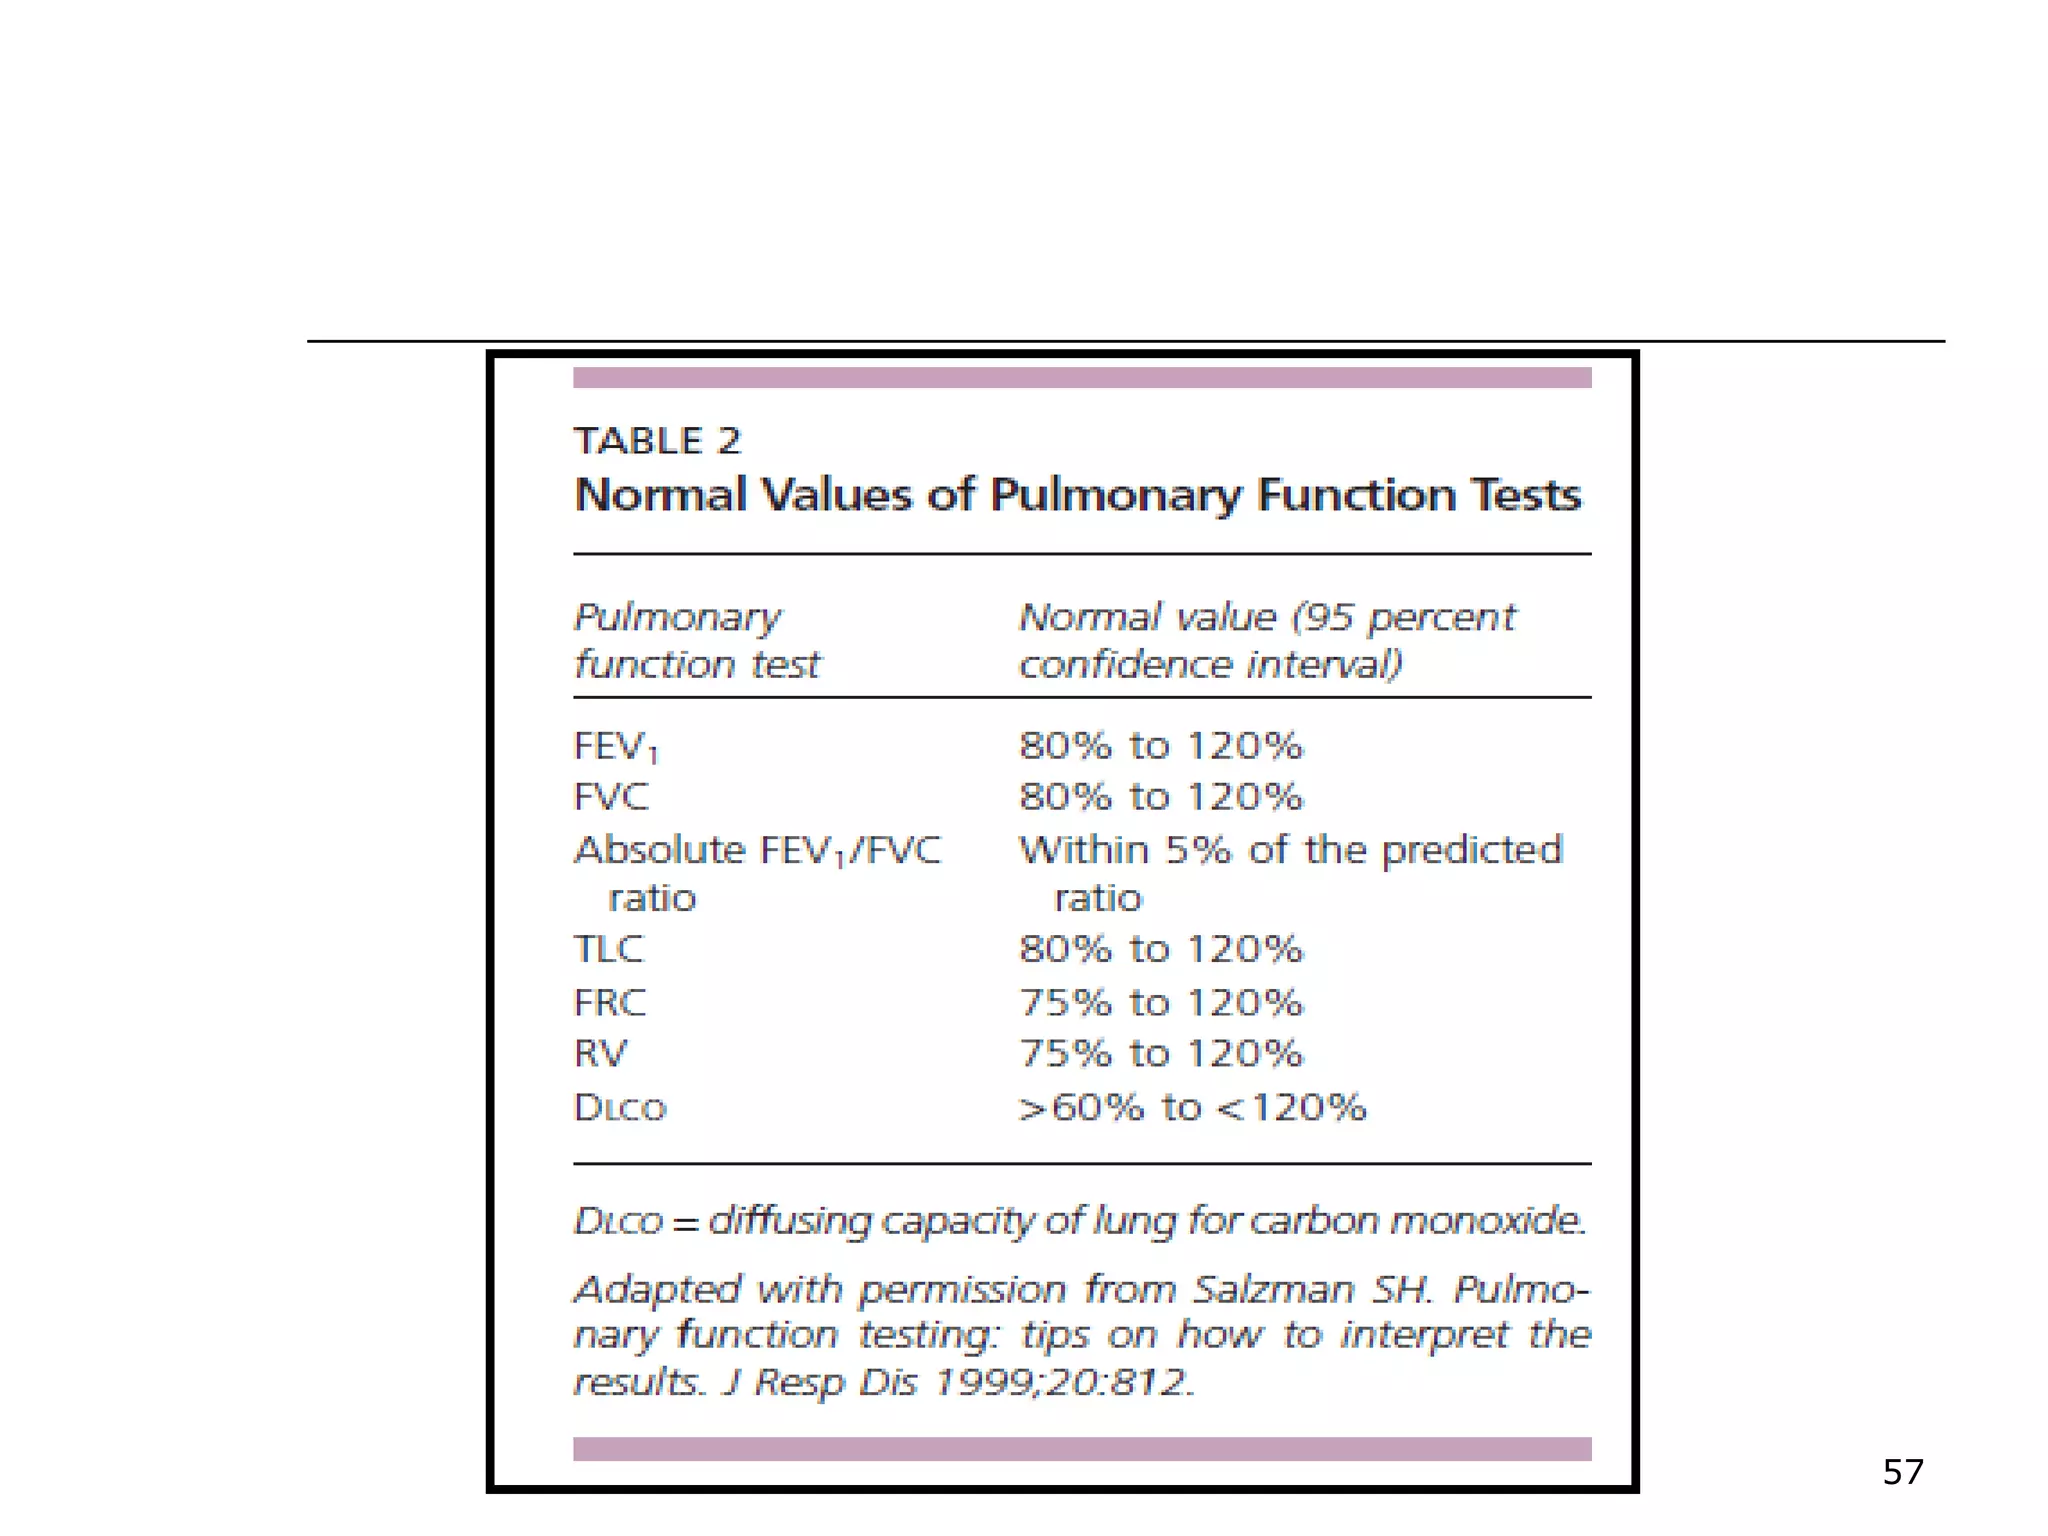
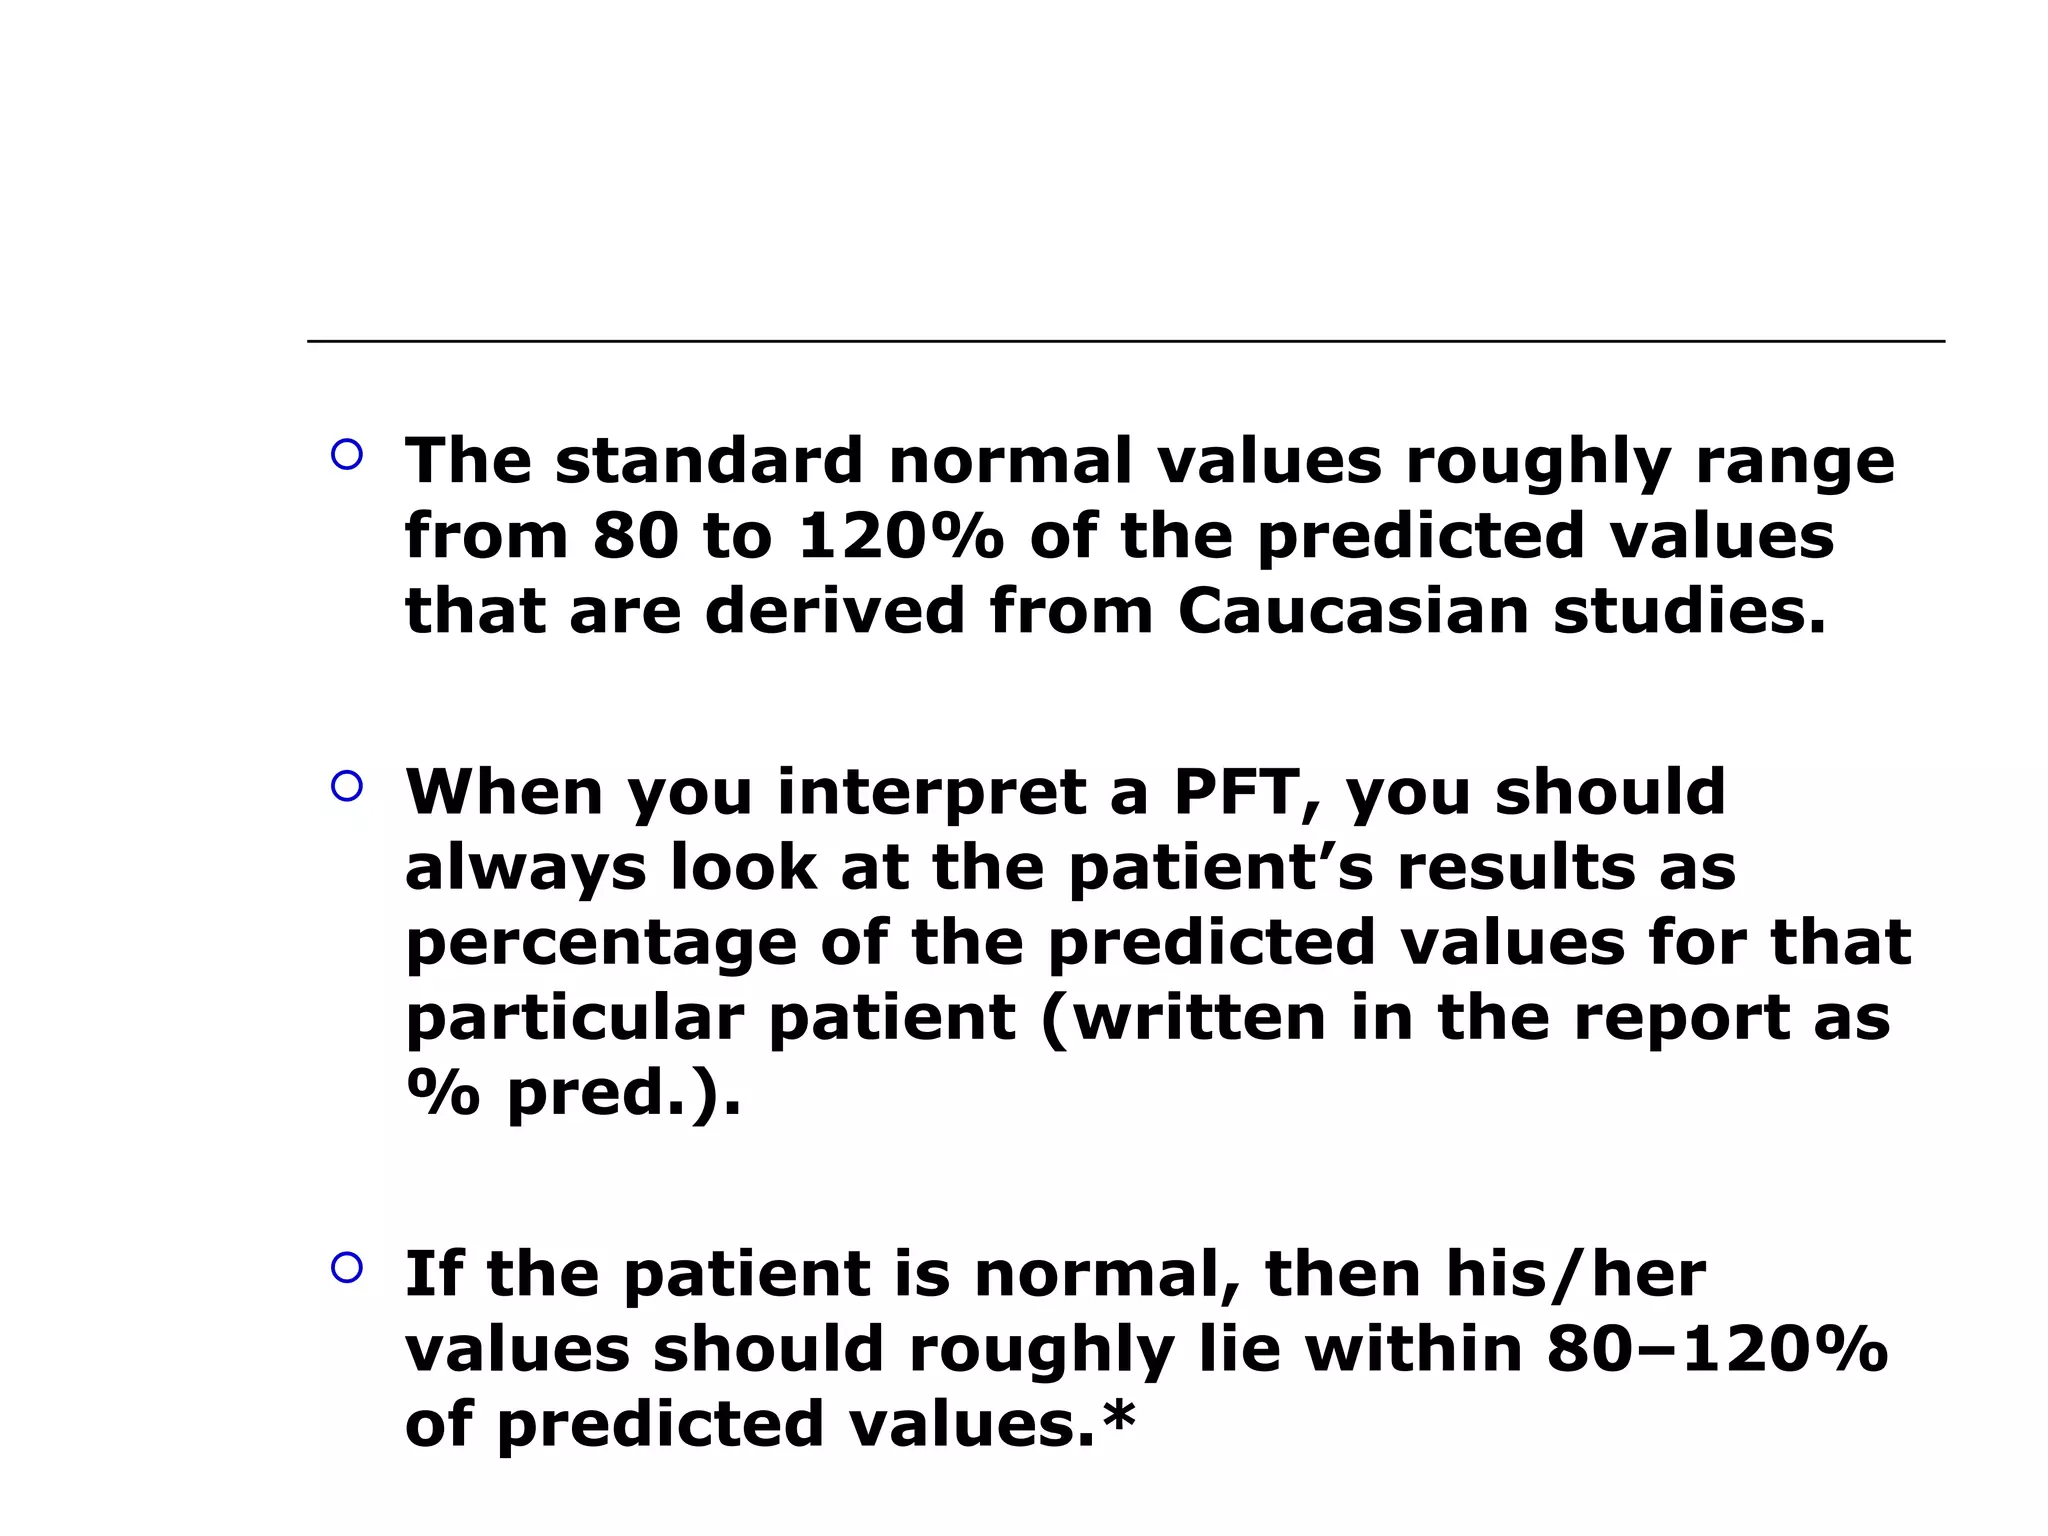
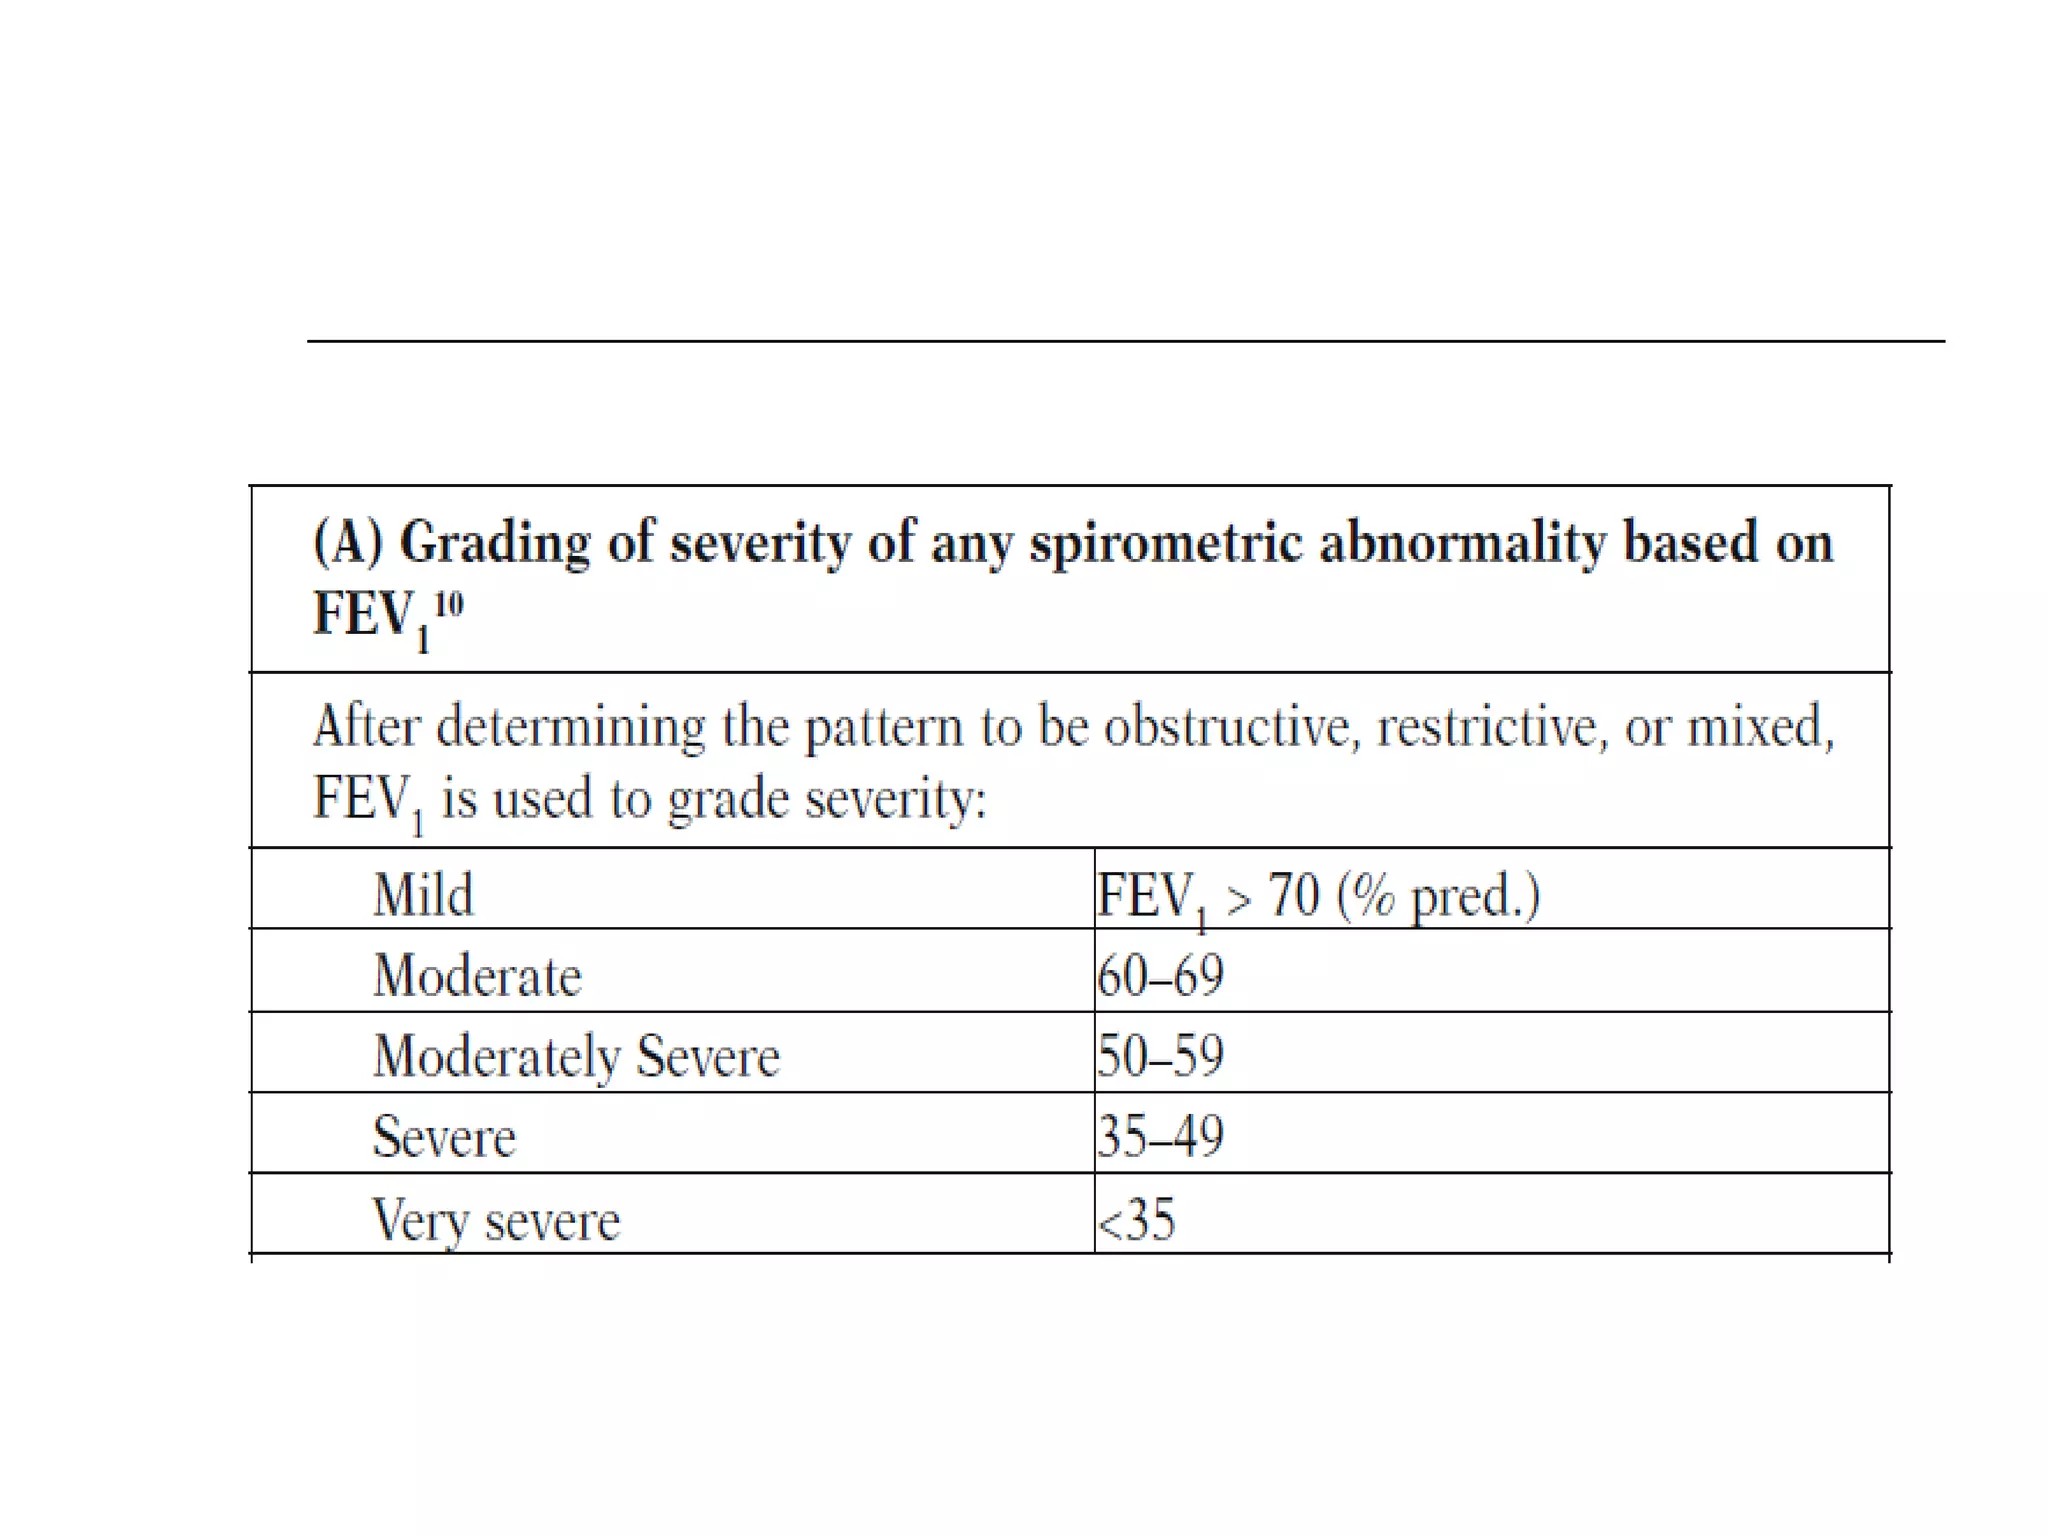
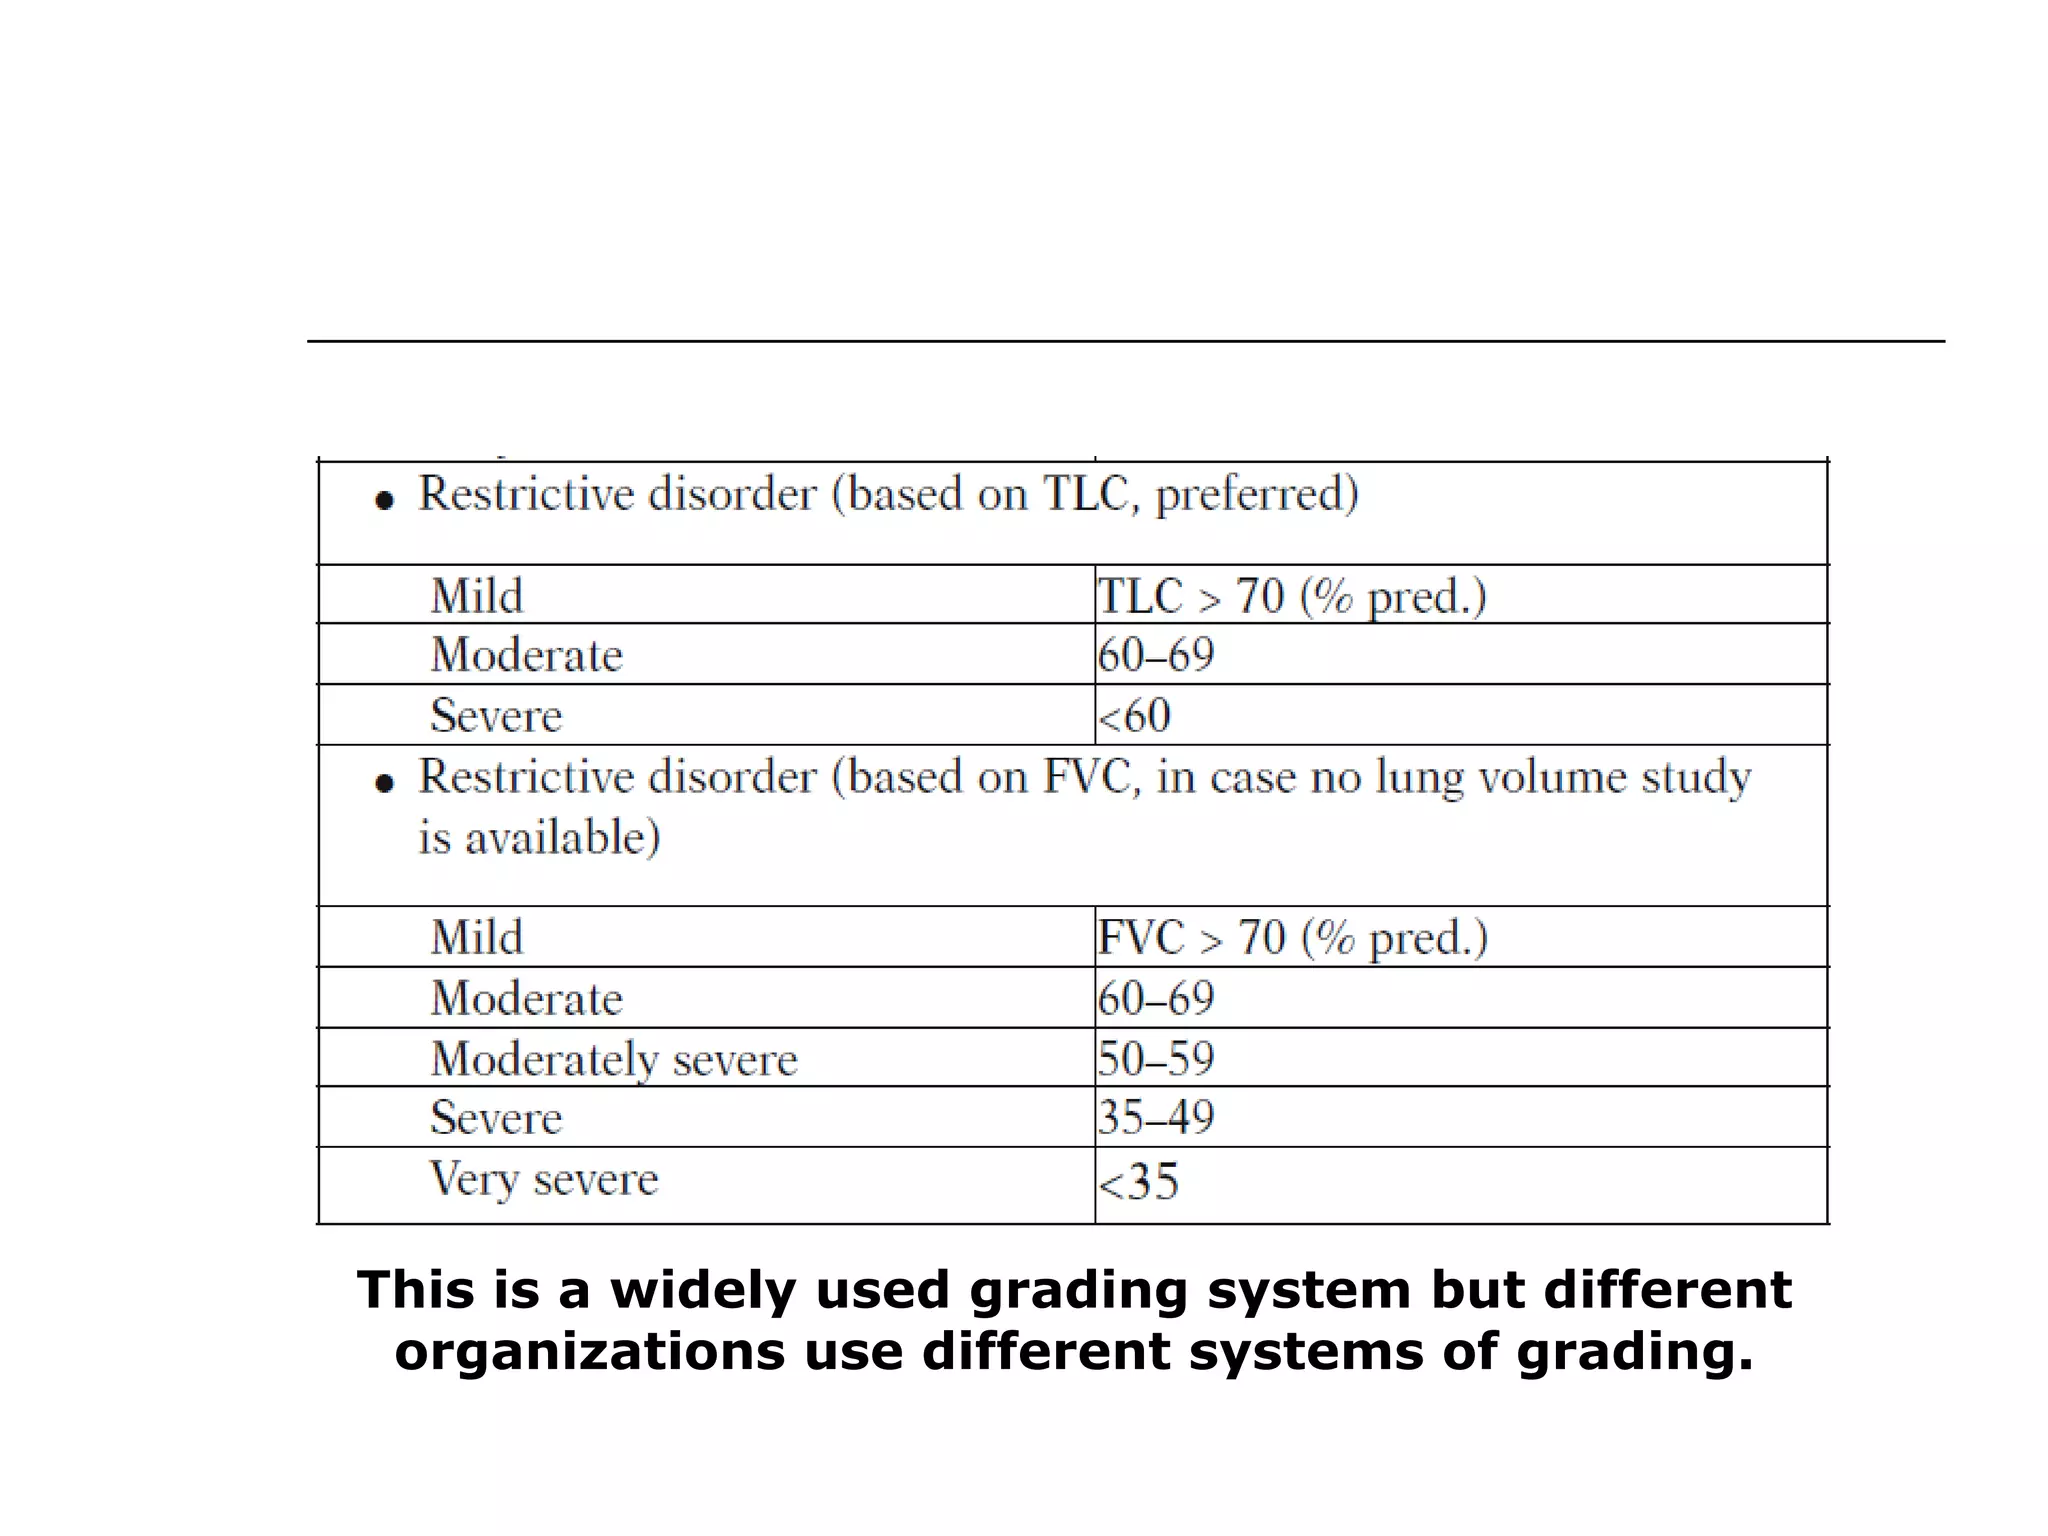
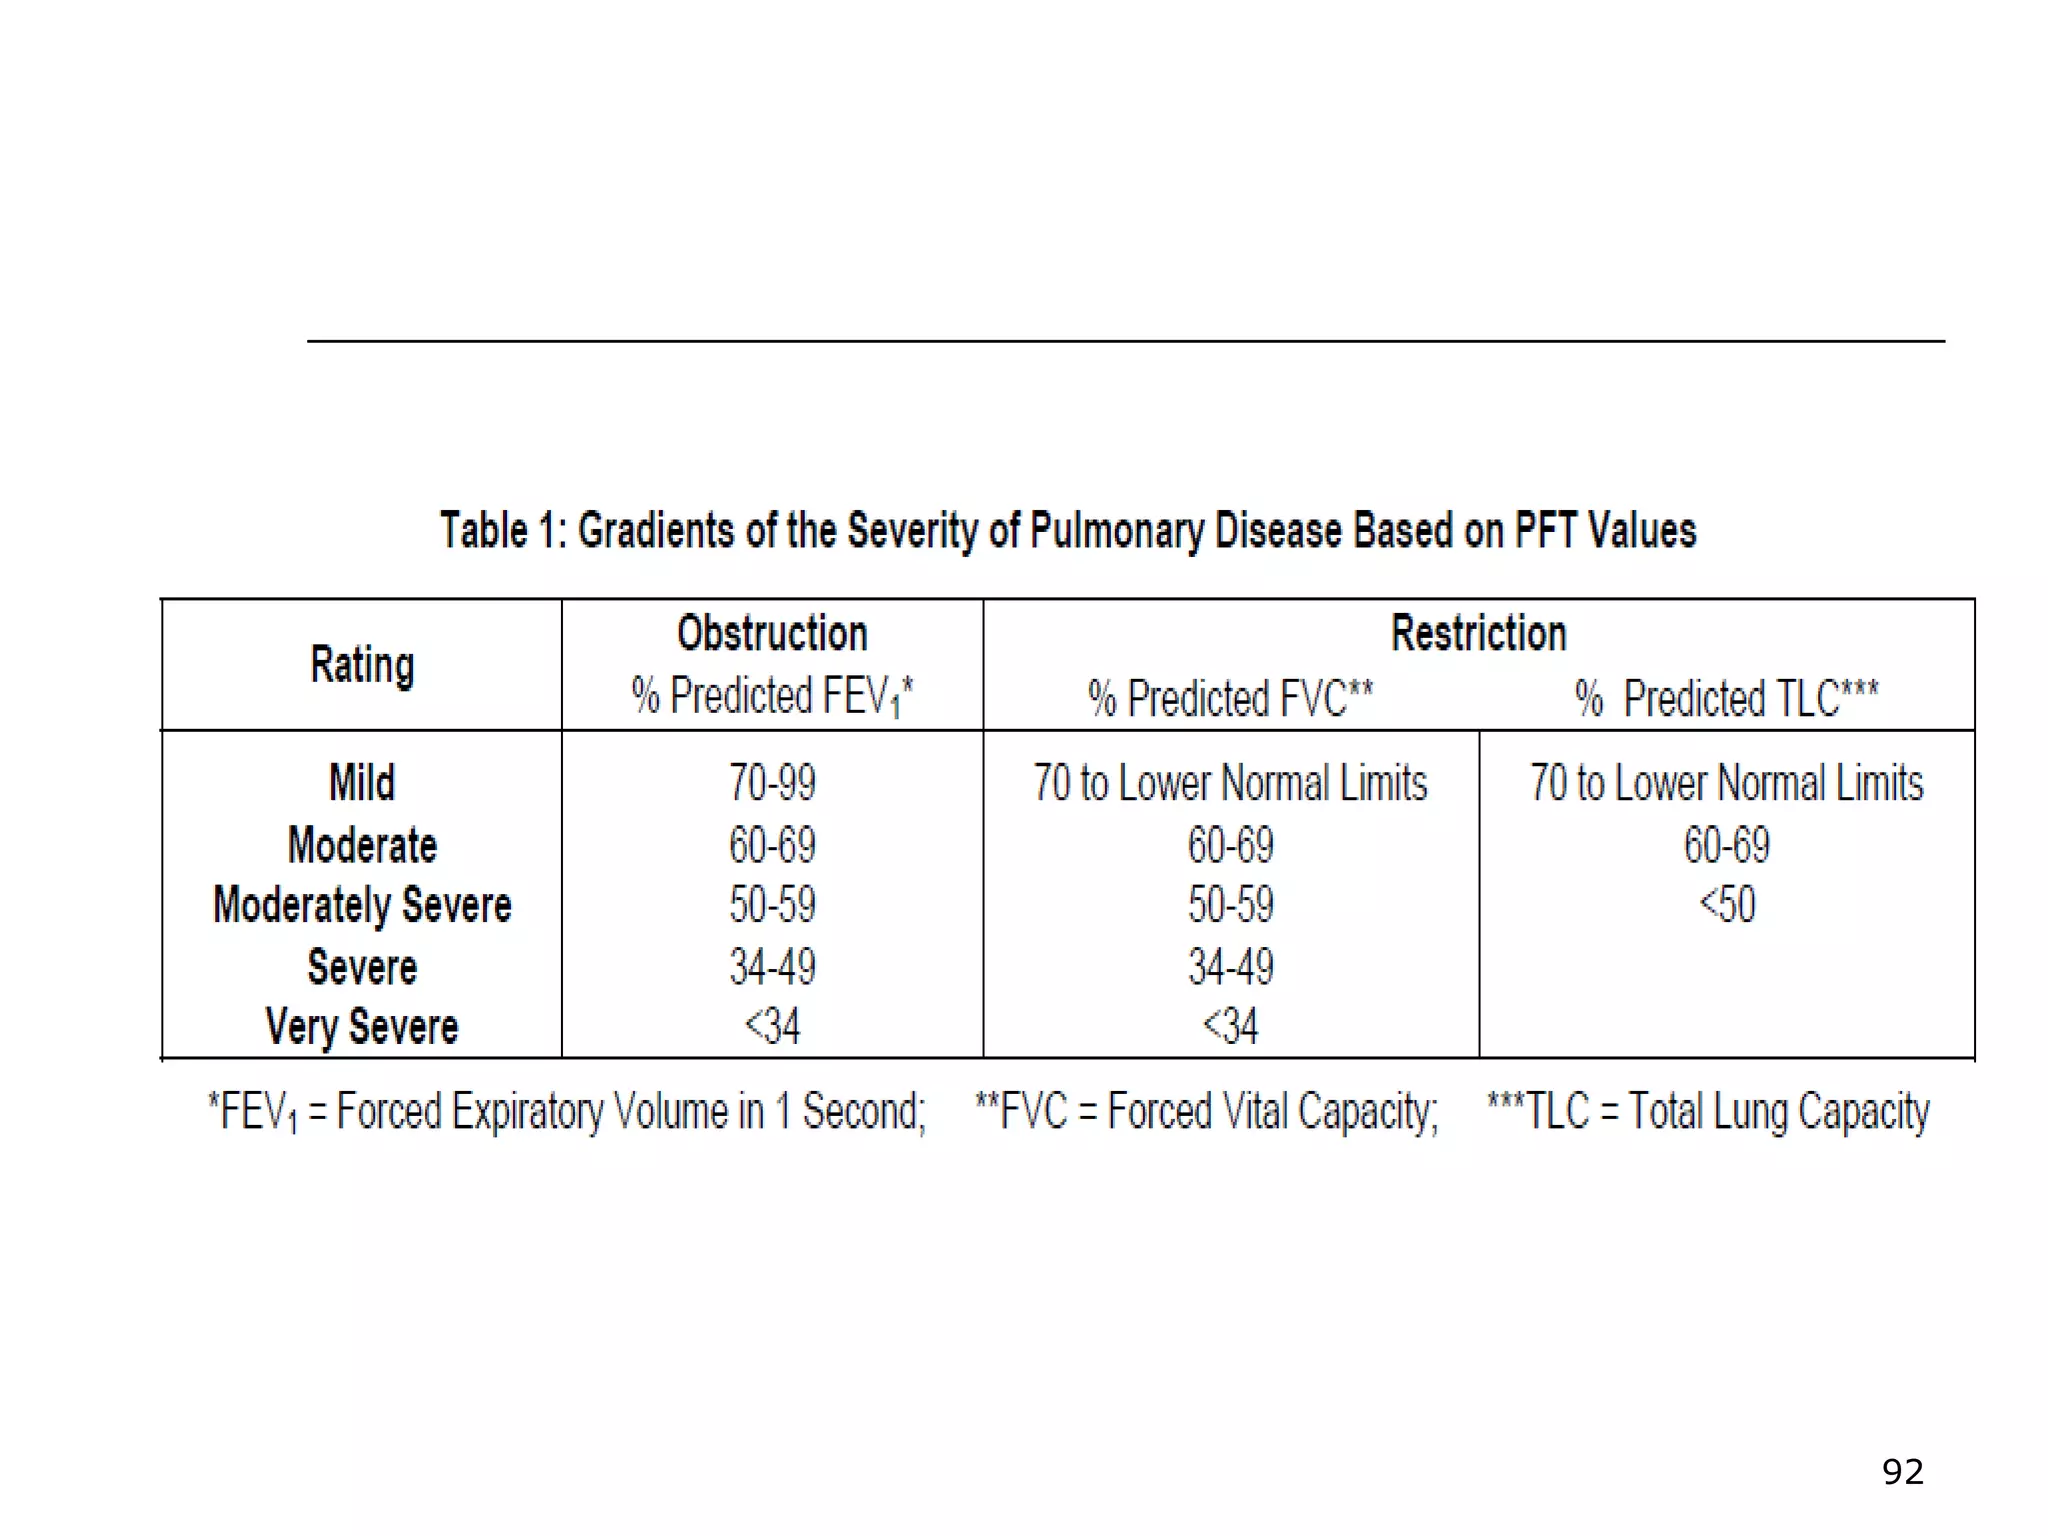
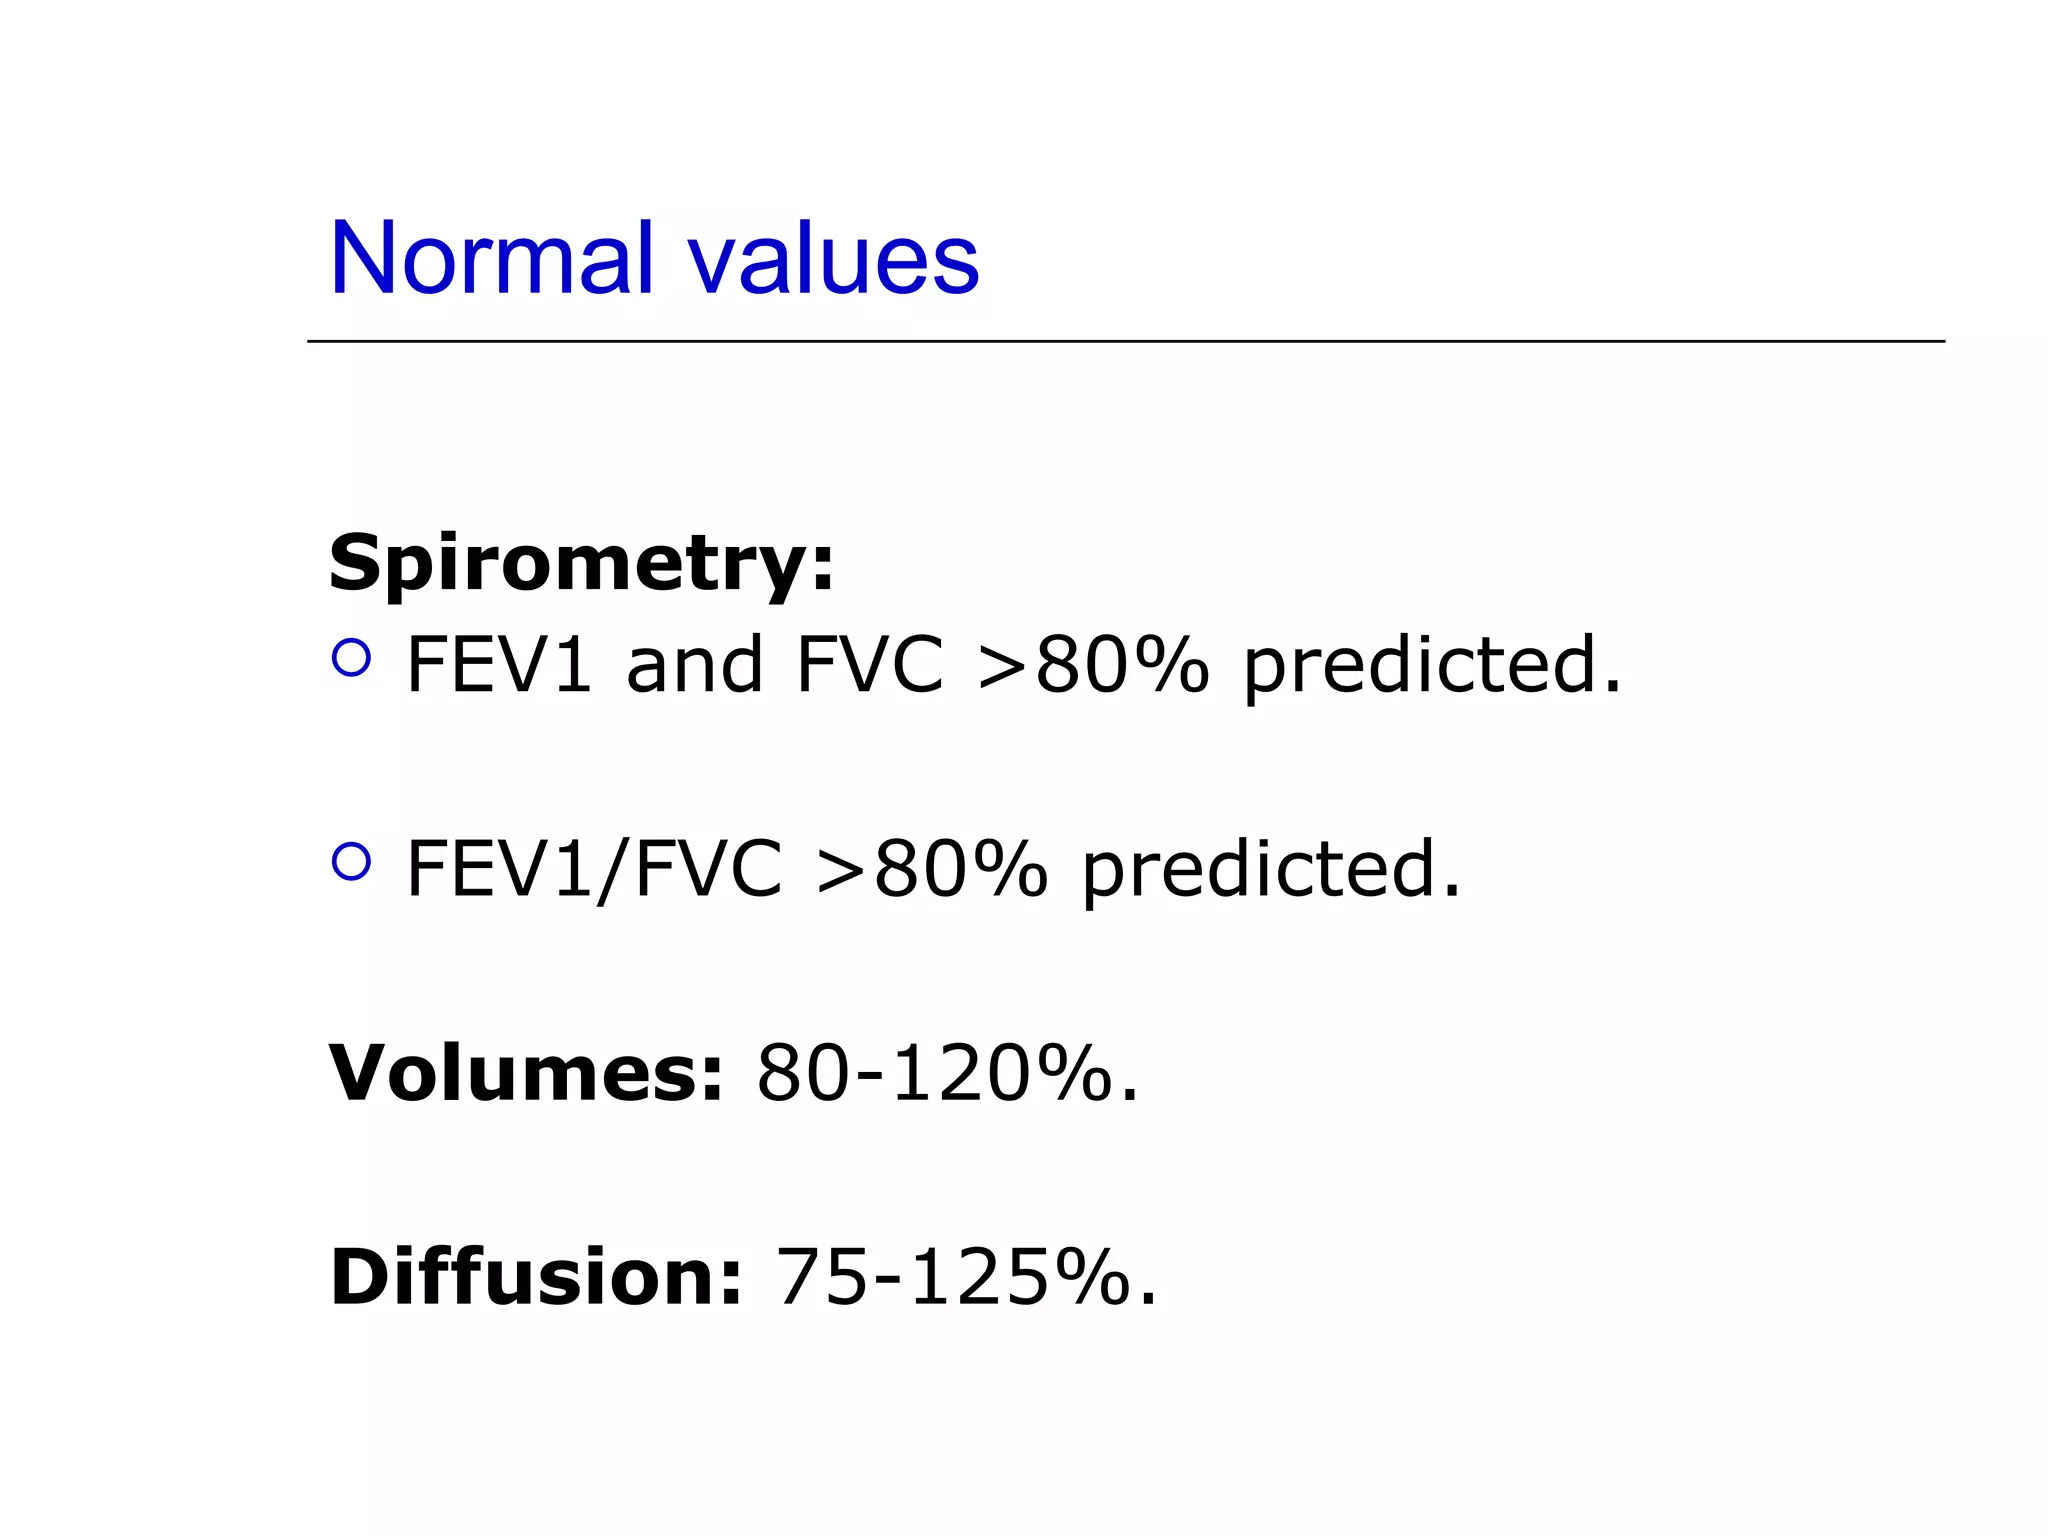
Ranges for normal FVC, FEV1, and FEF 25-75%, indicating degree of obstruction or restriction.
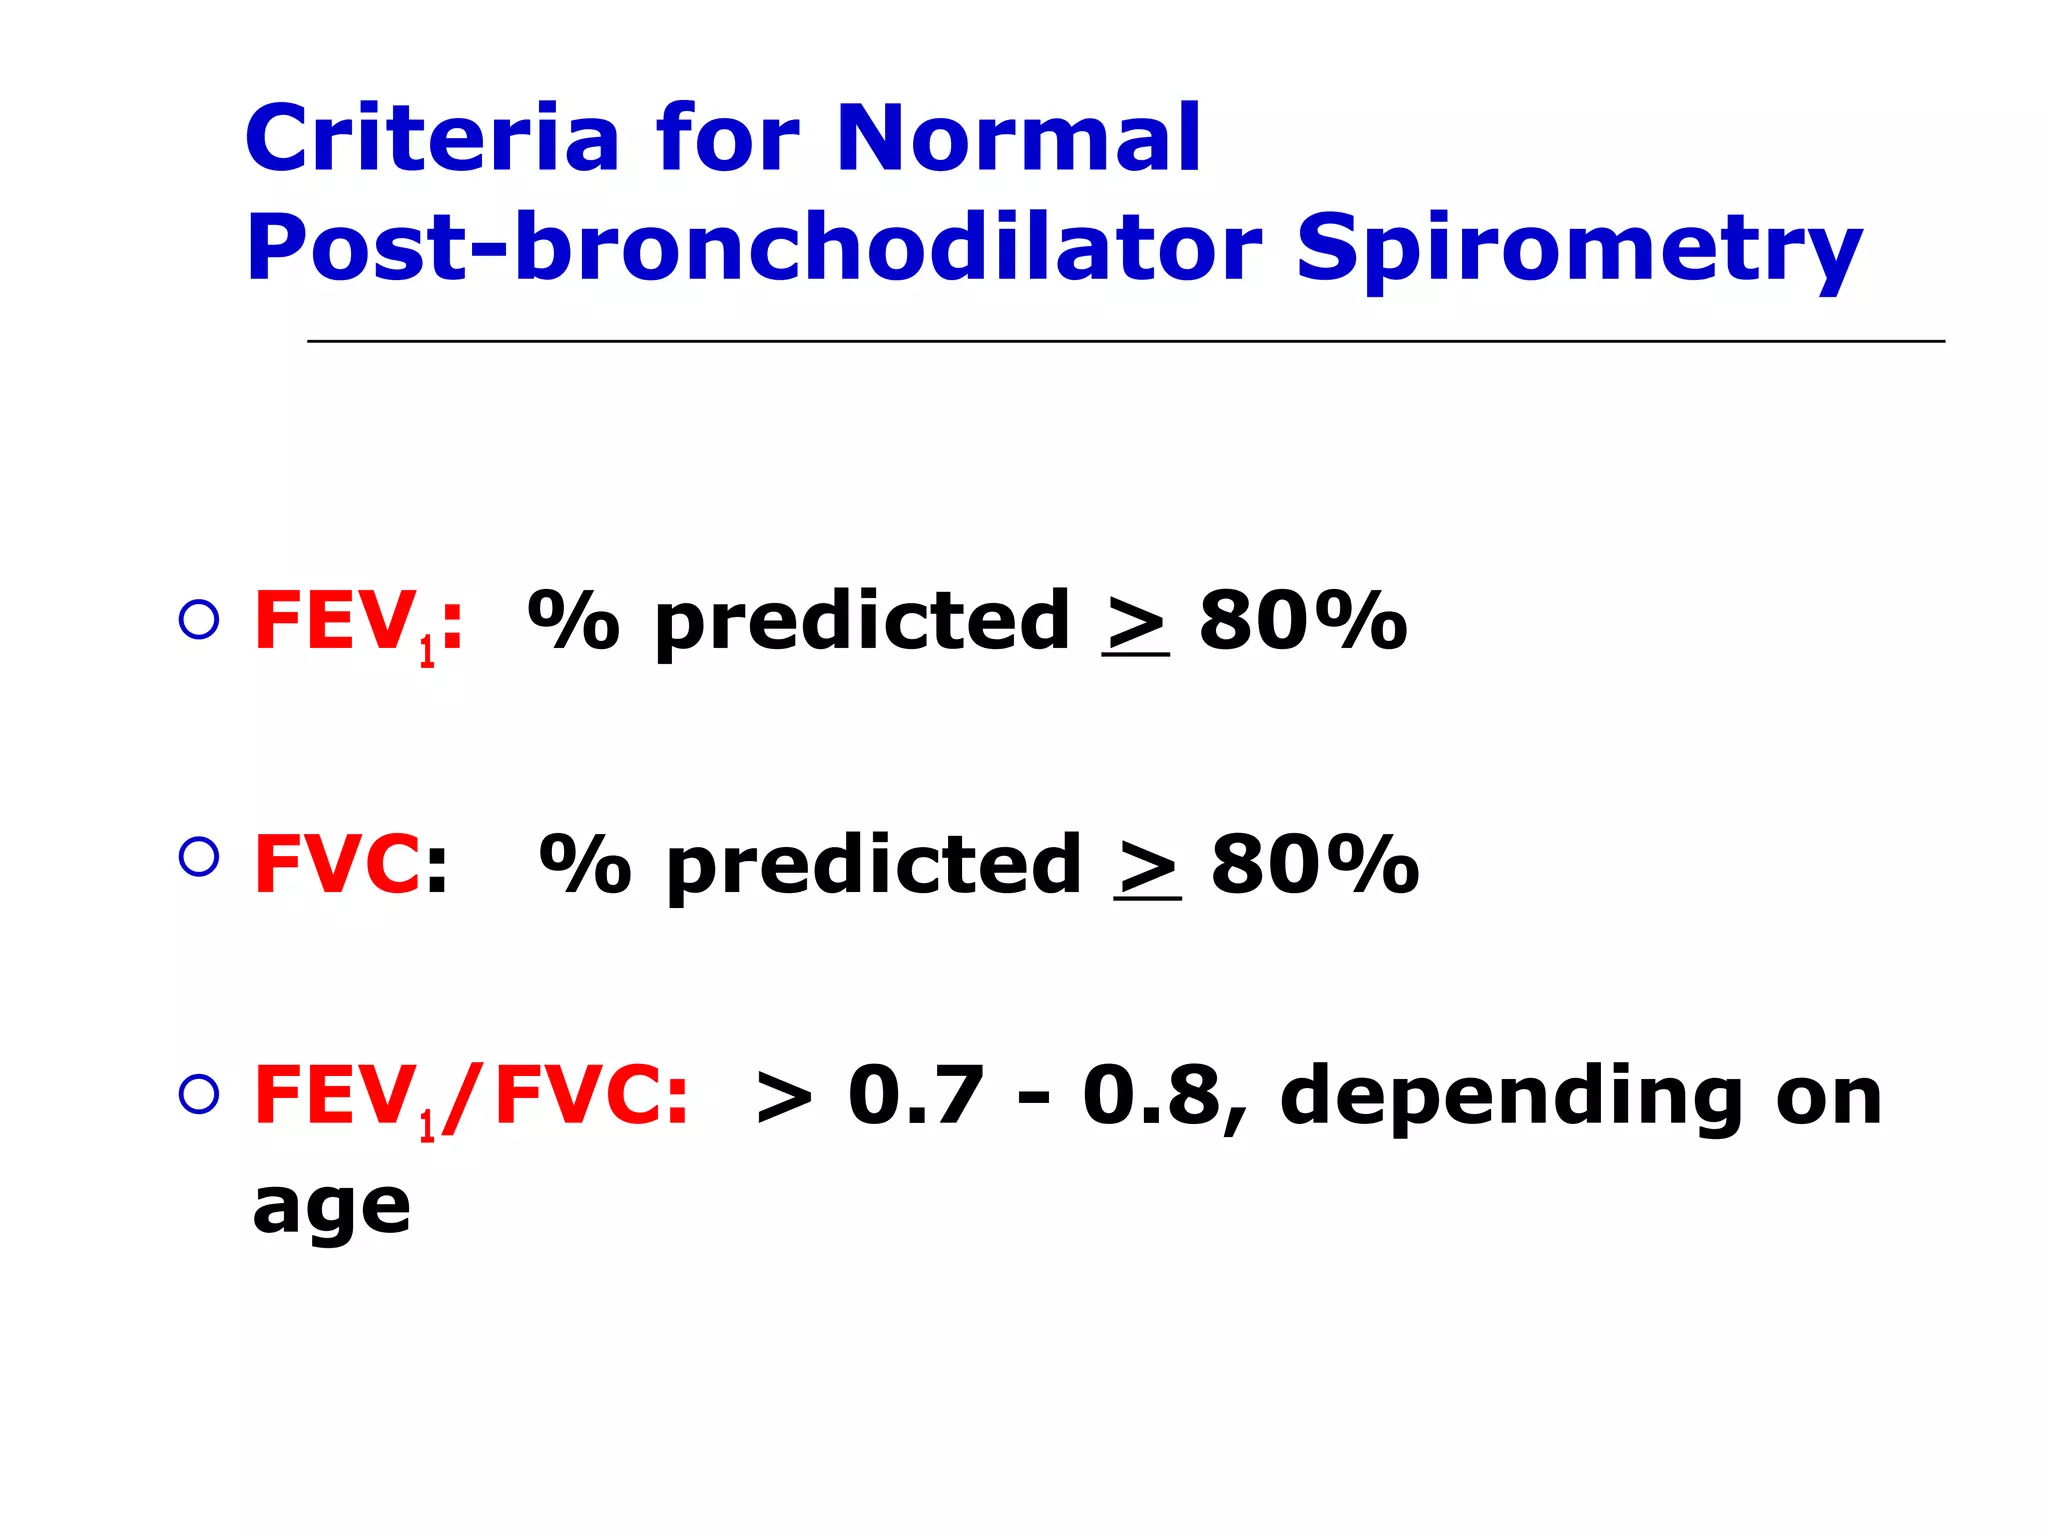
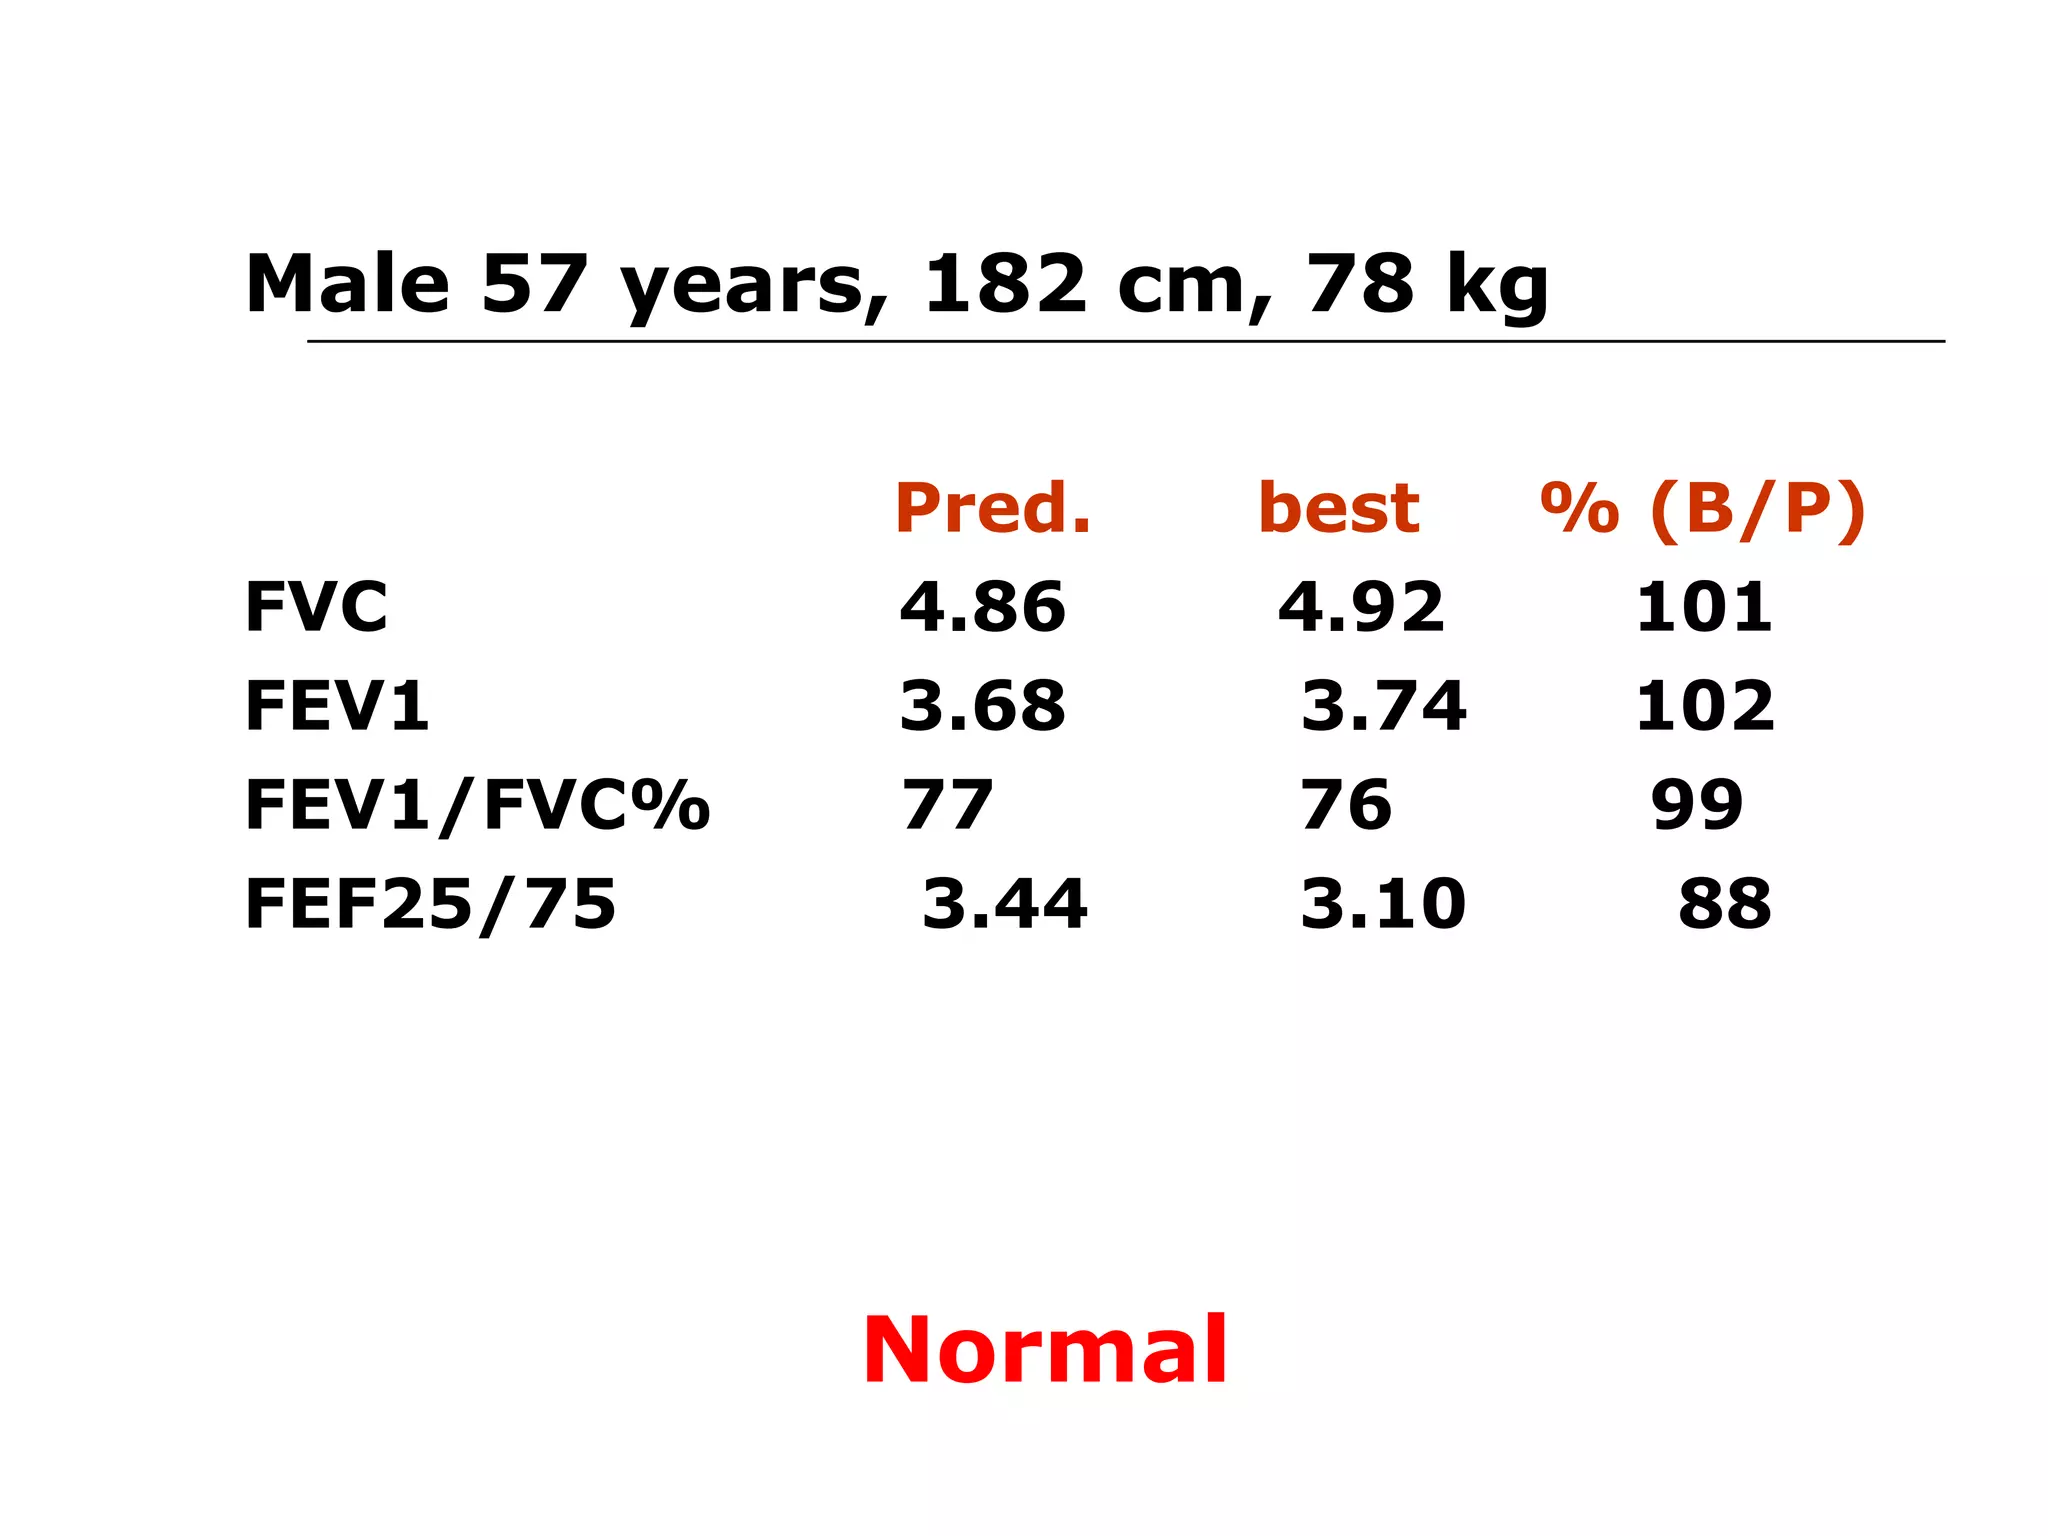
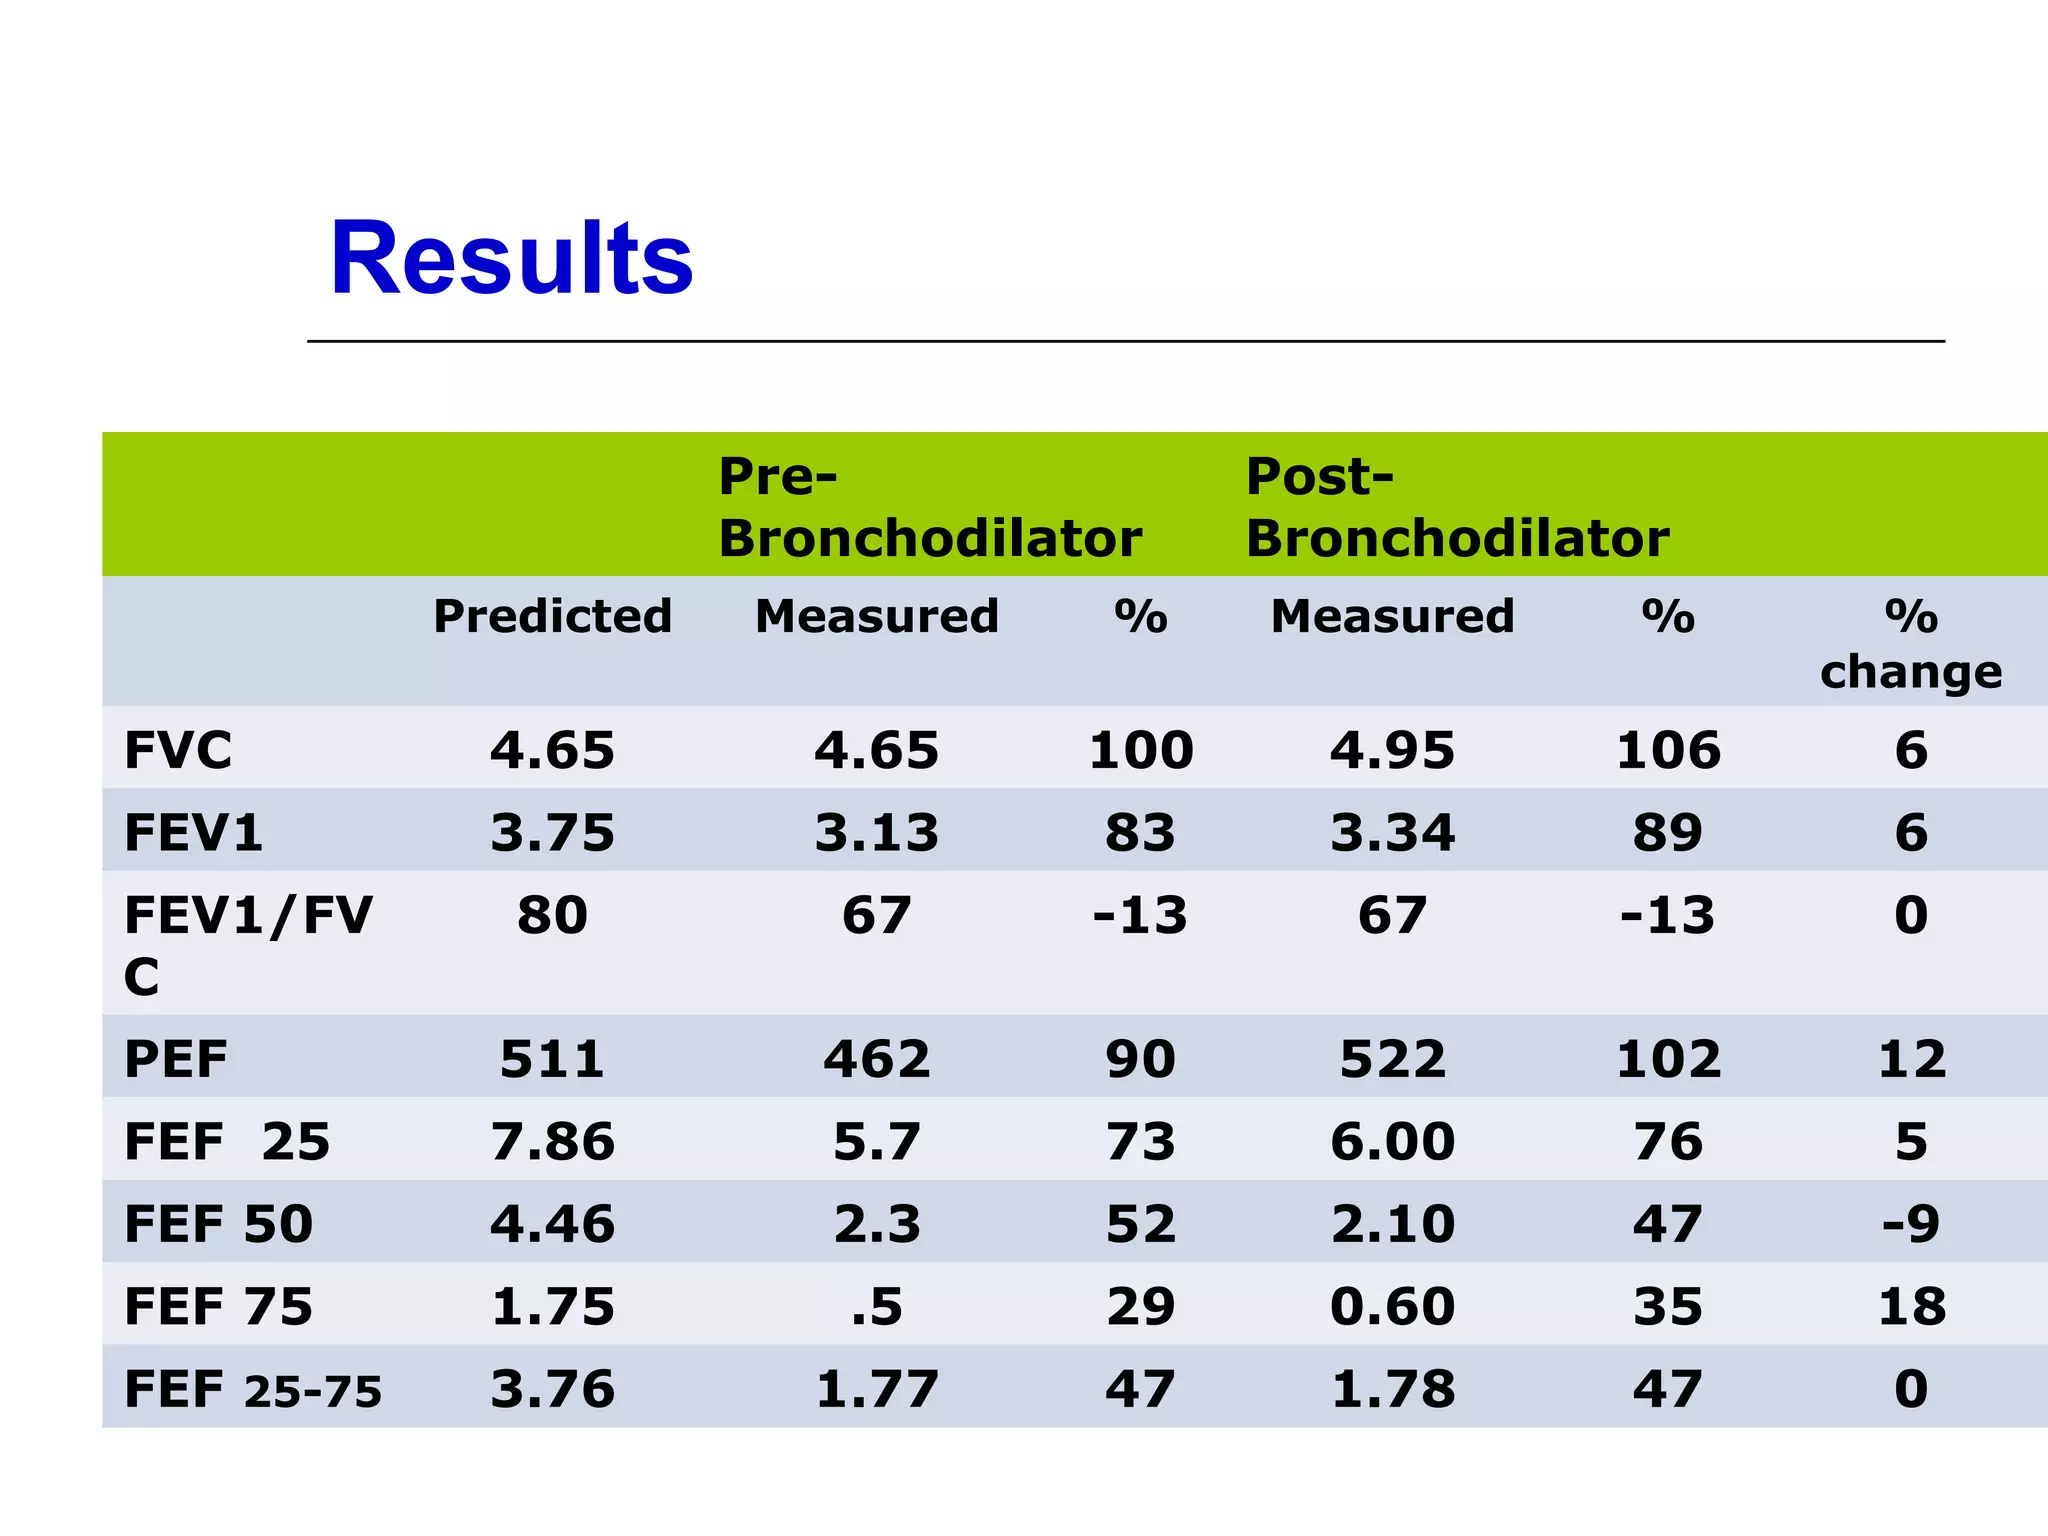
Criteria for normal post-bronchodilator spirometry: FEV1, FVC, and FEV1/FVC ratios.
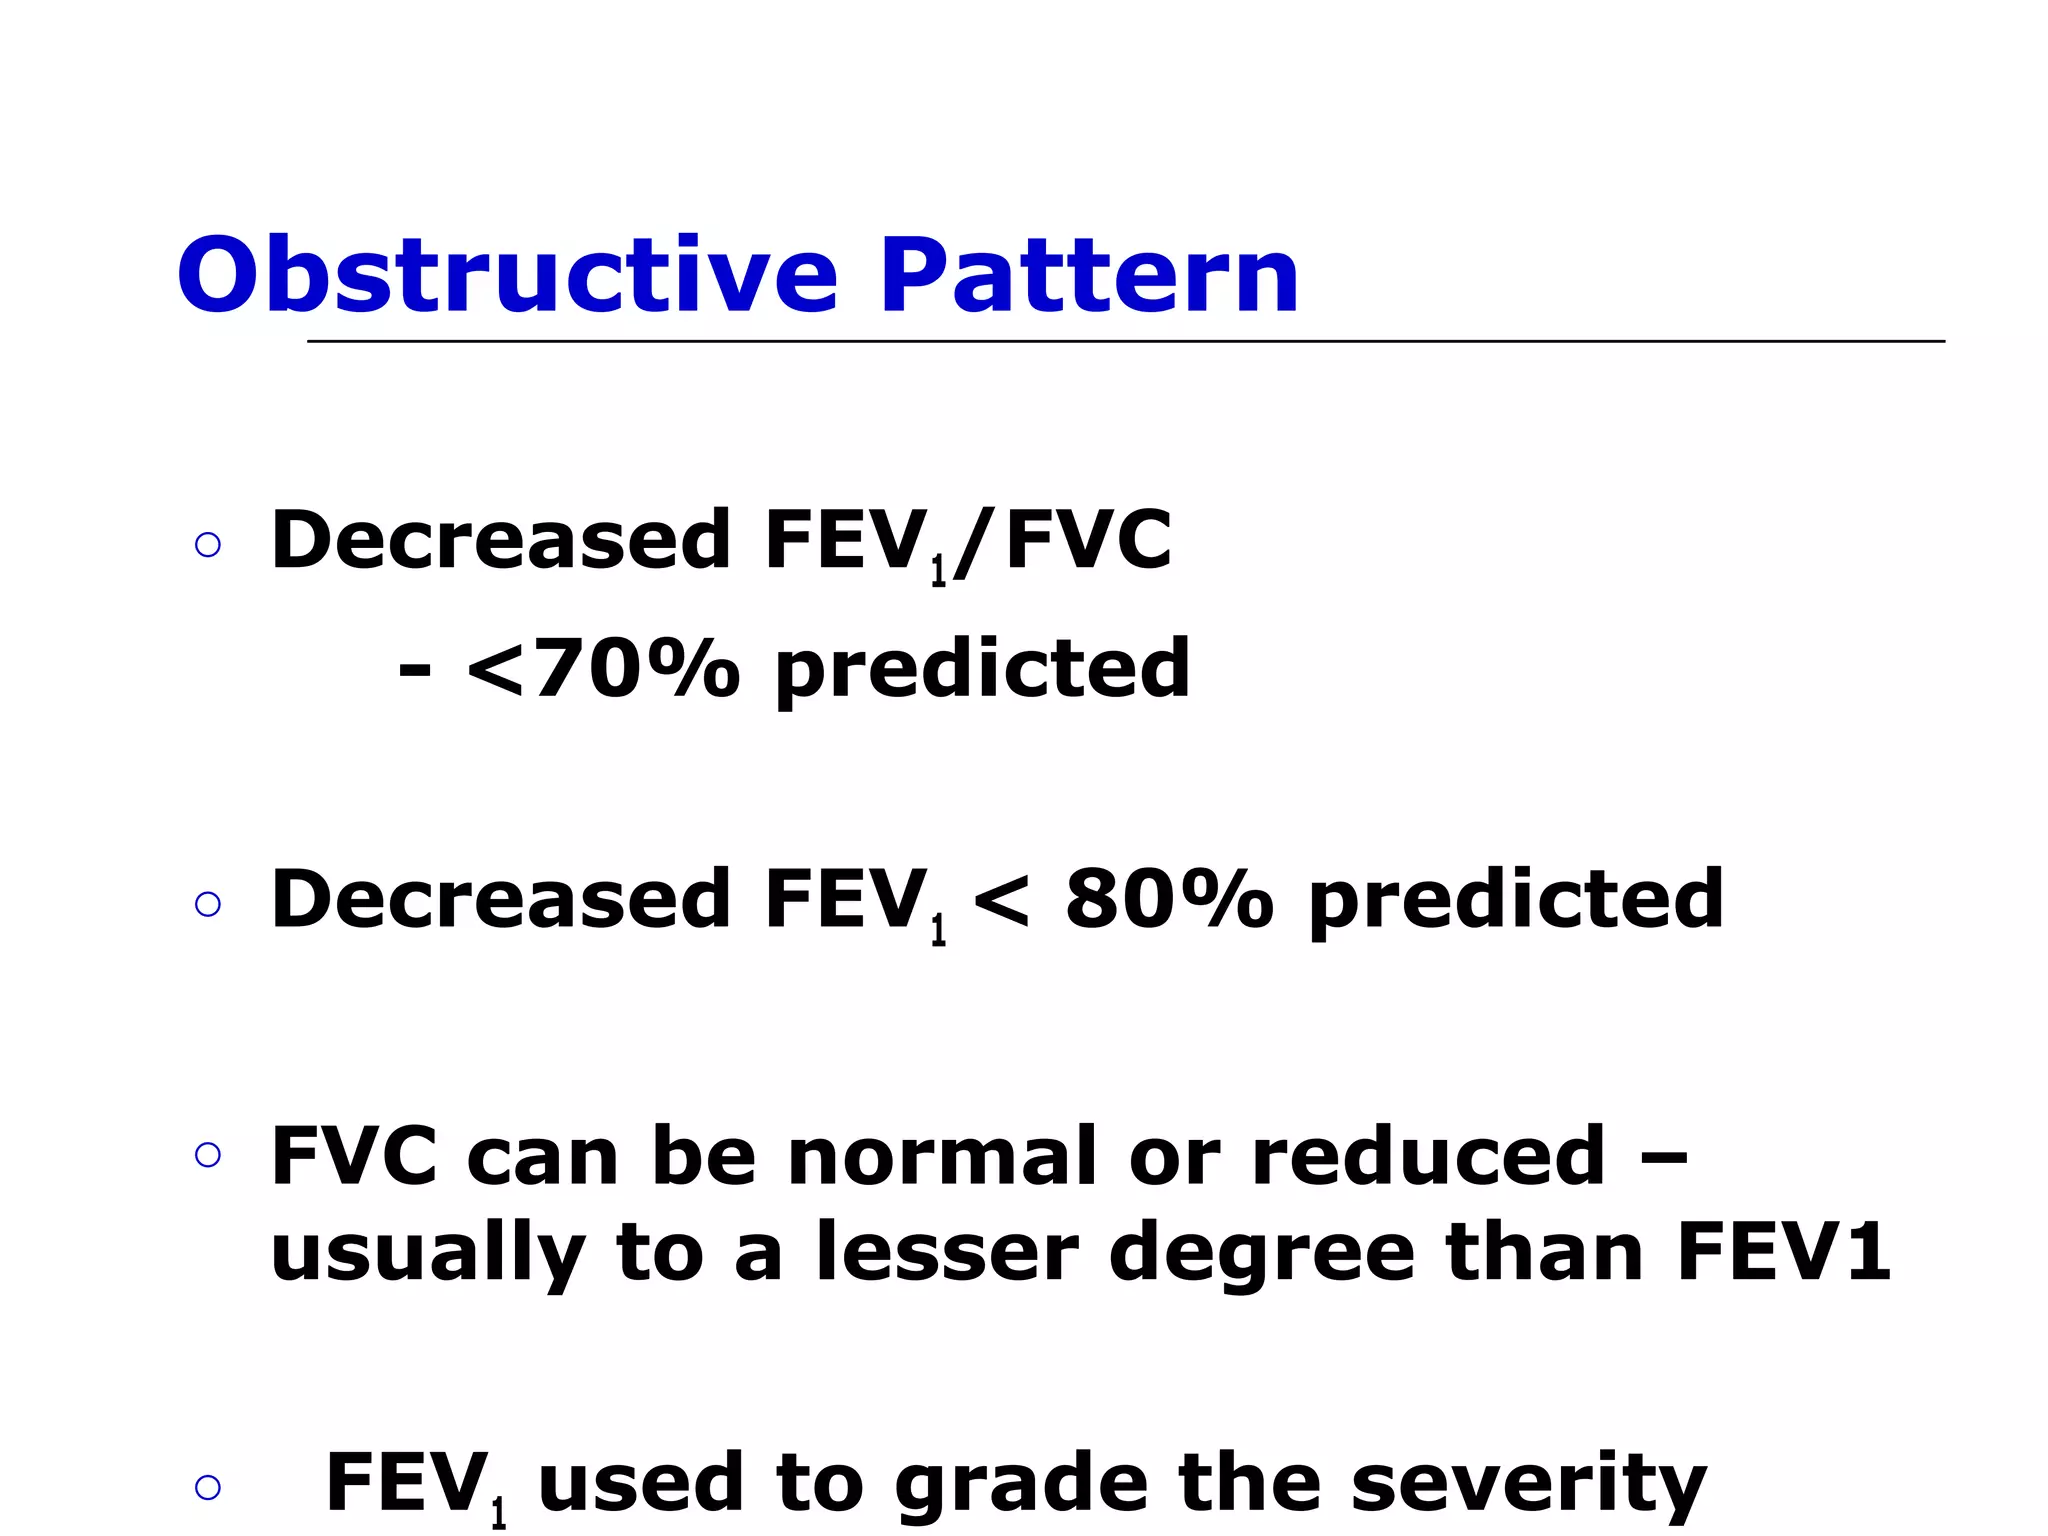
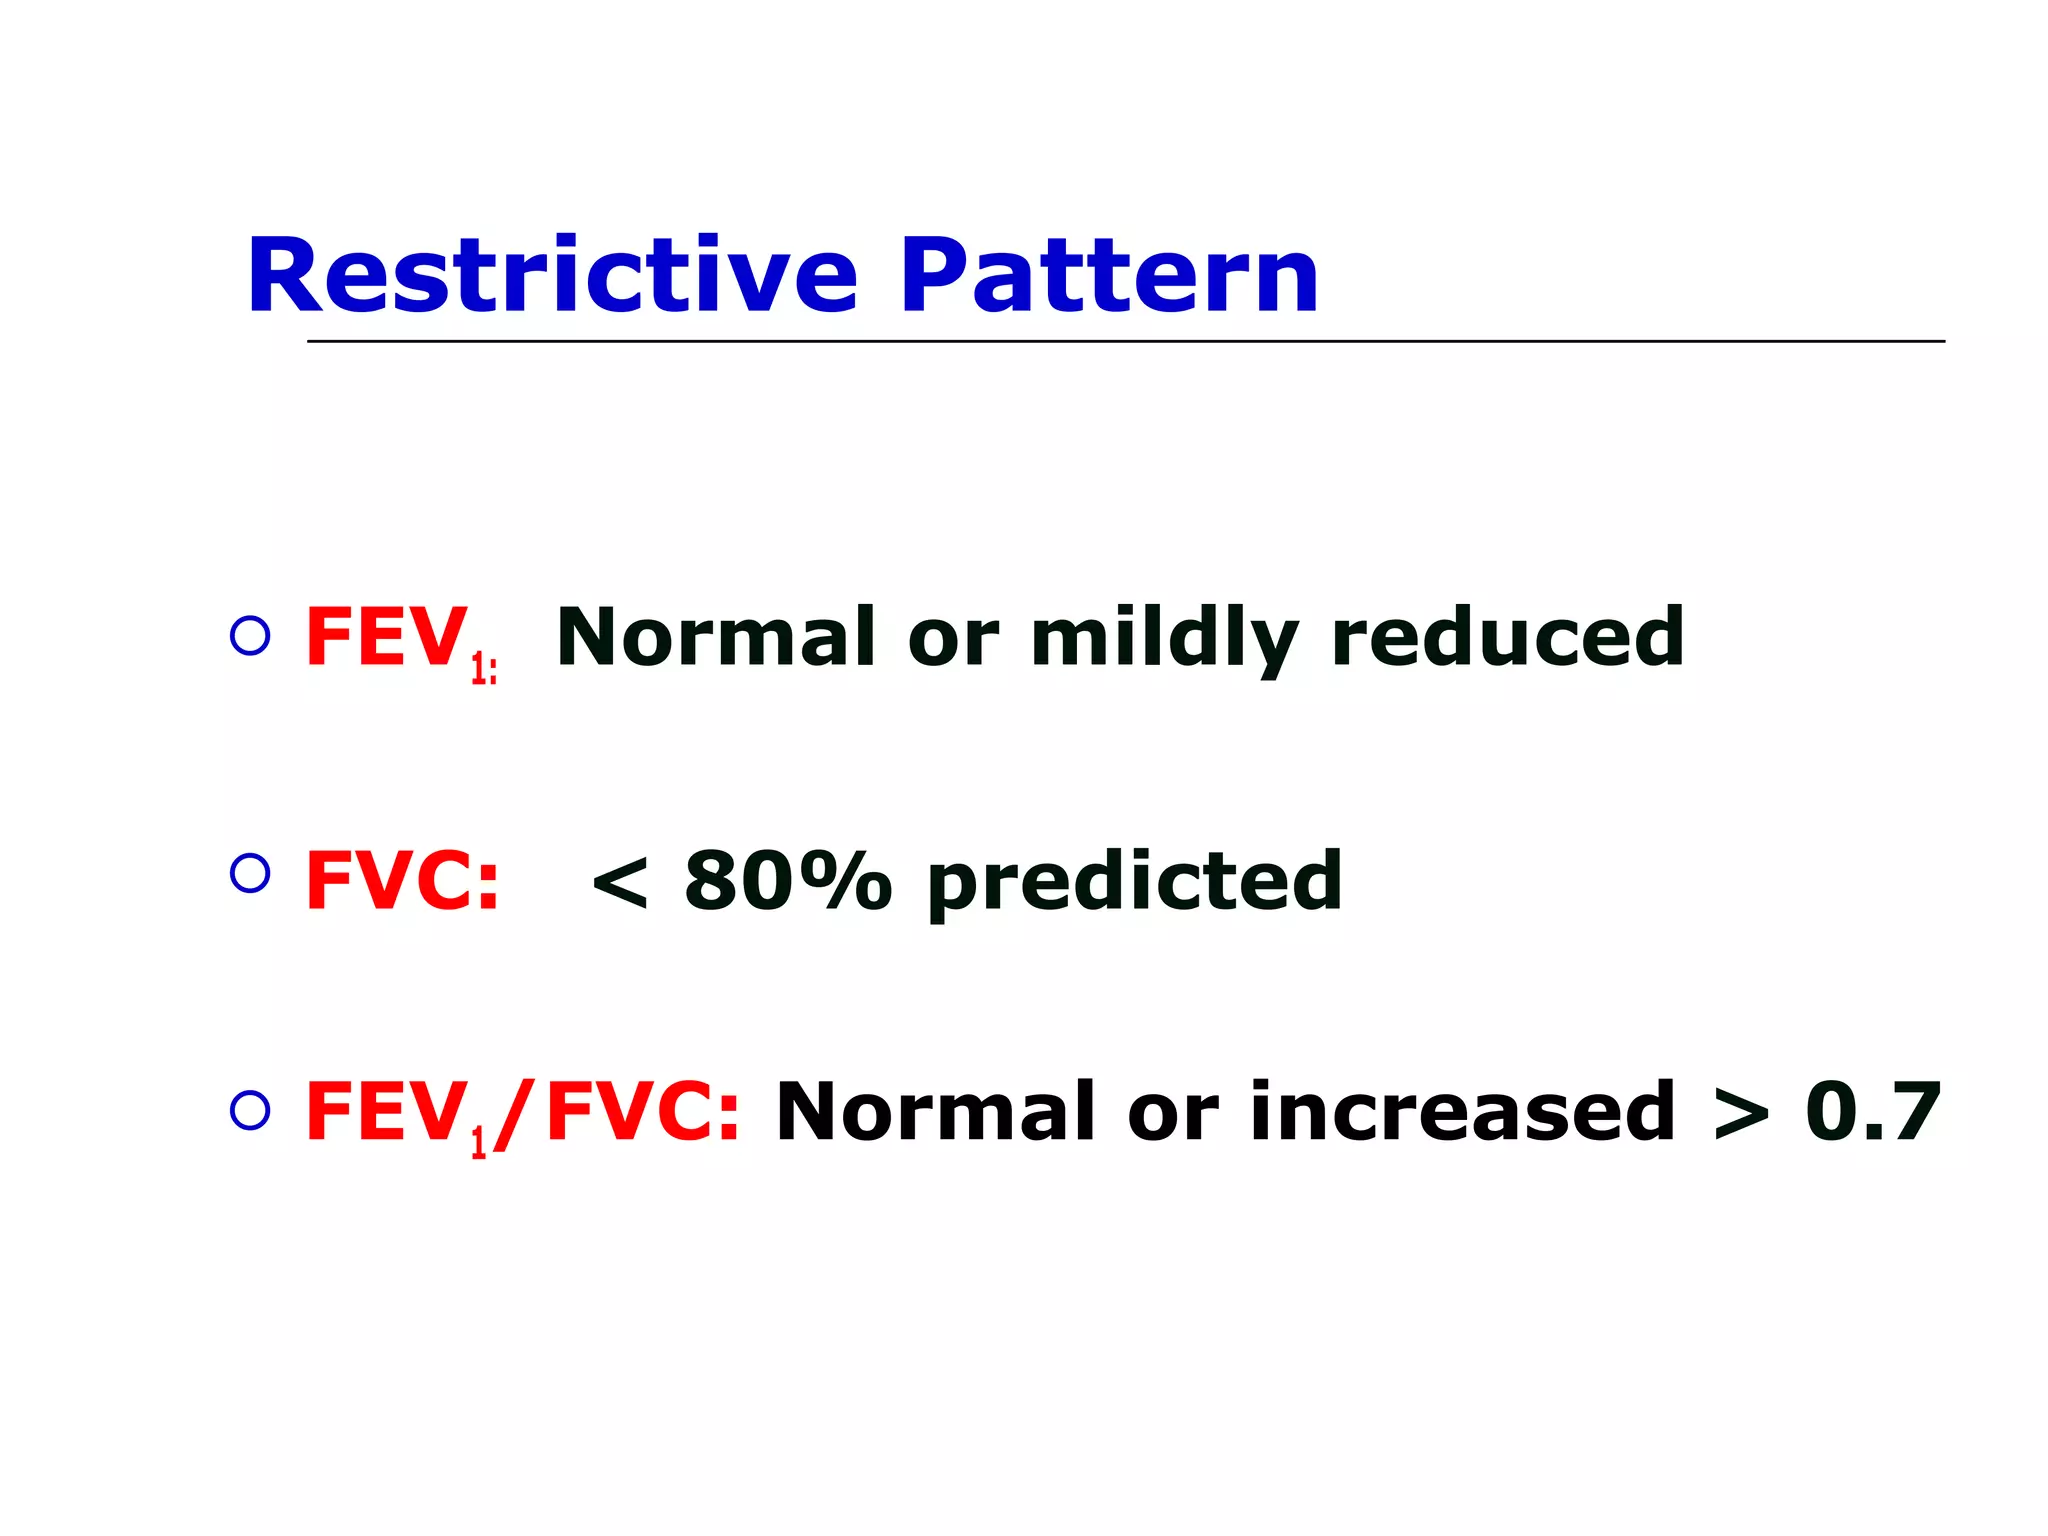
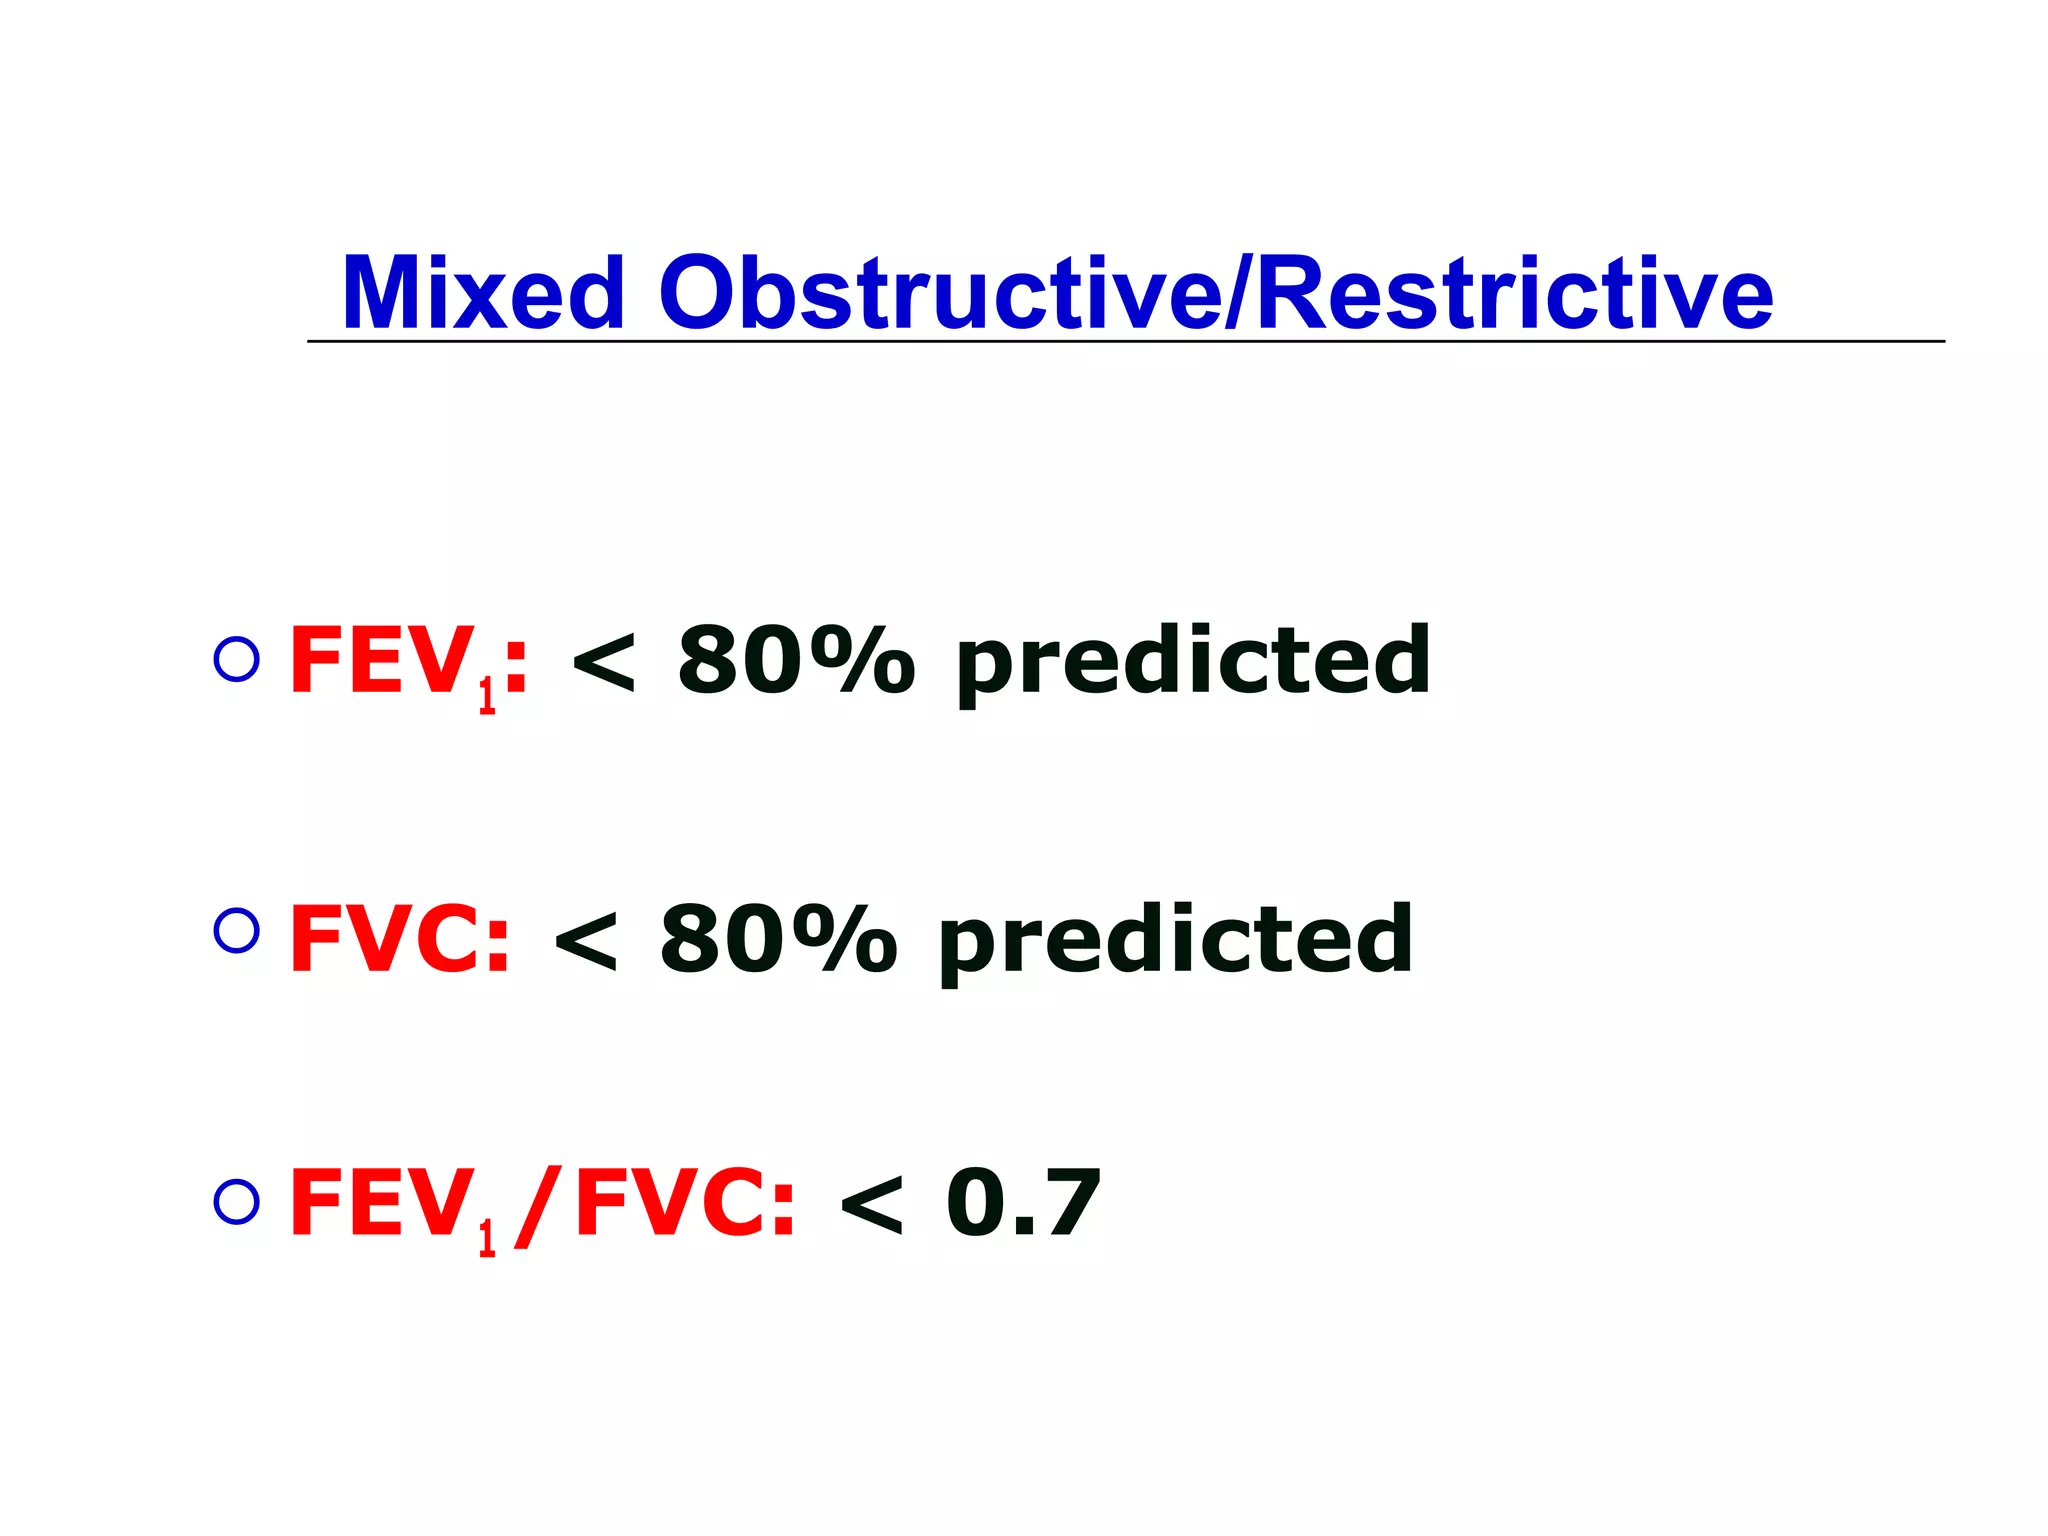
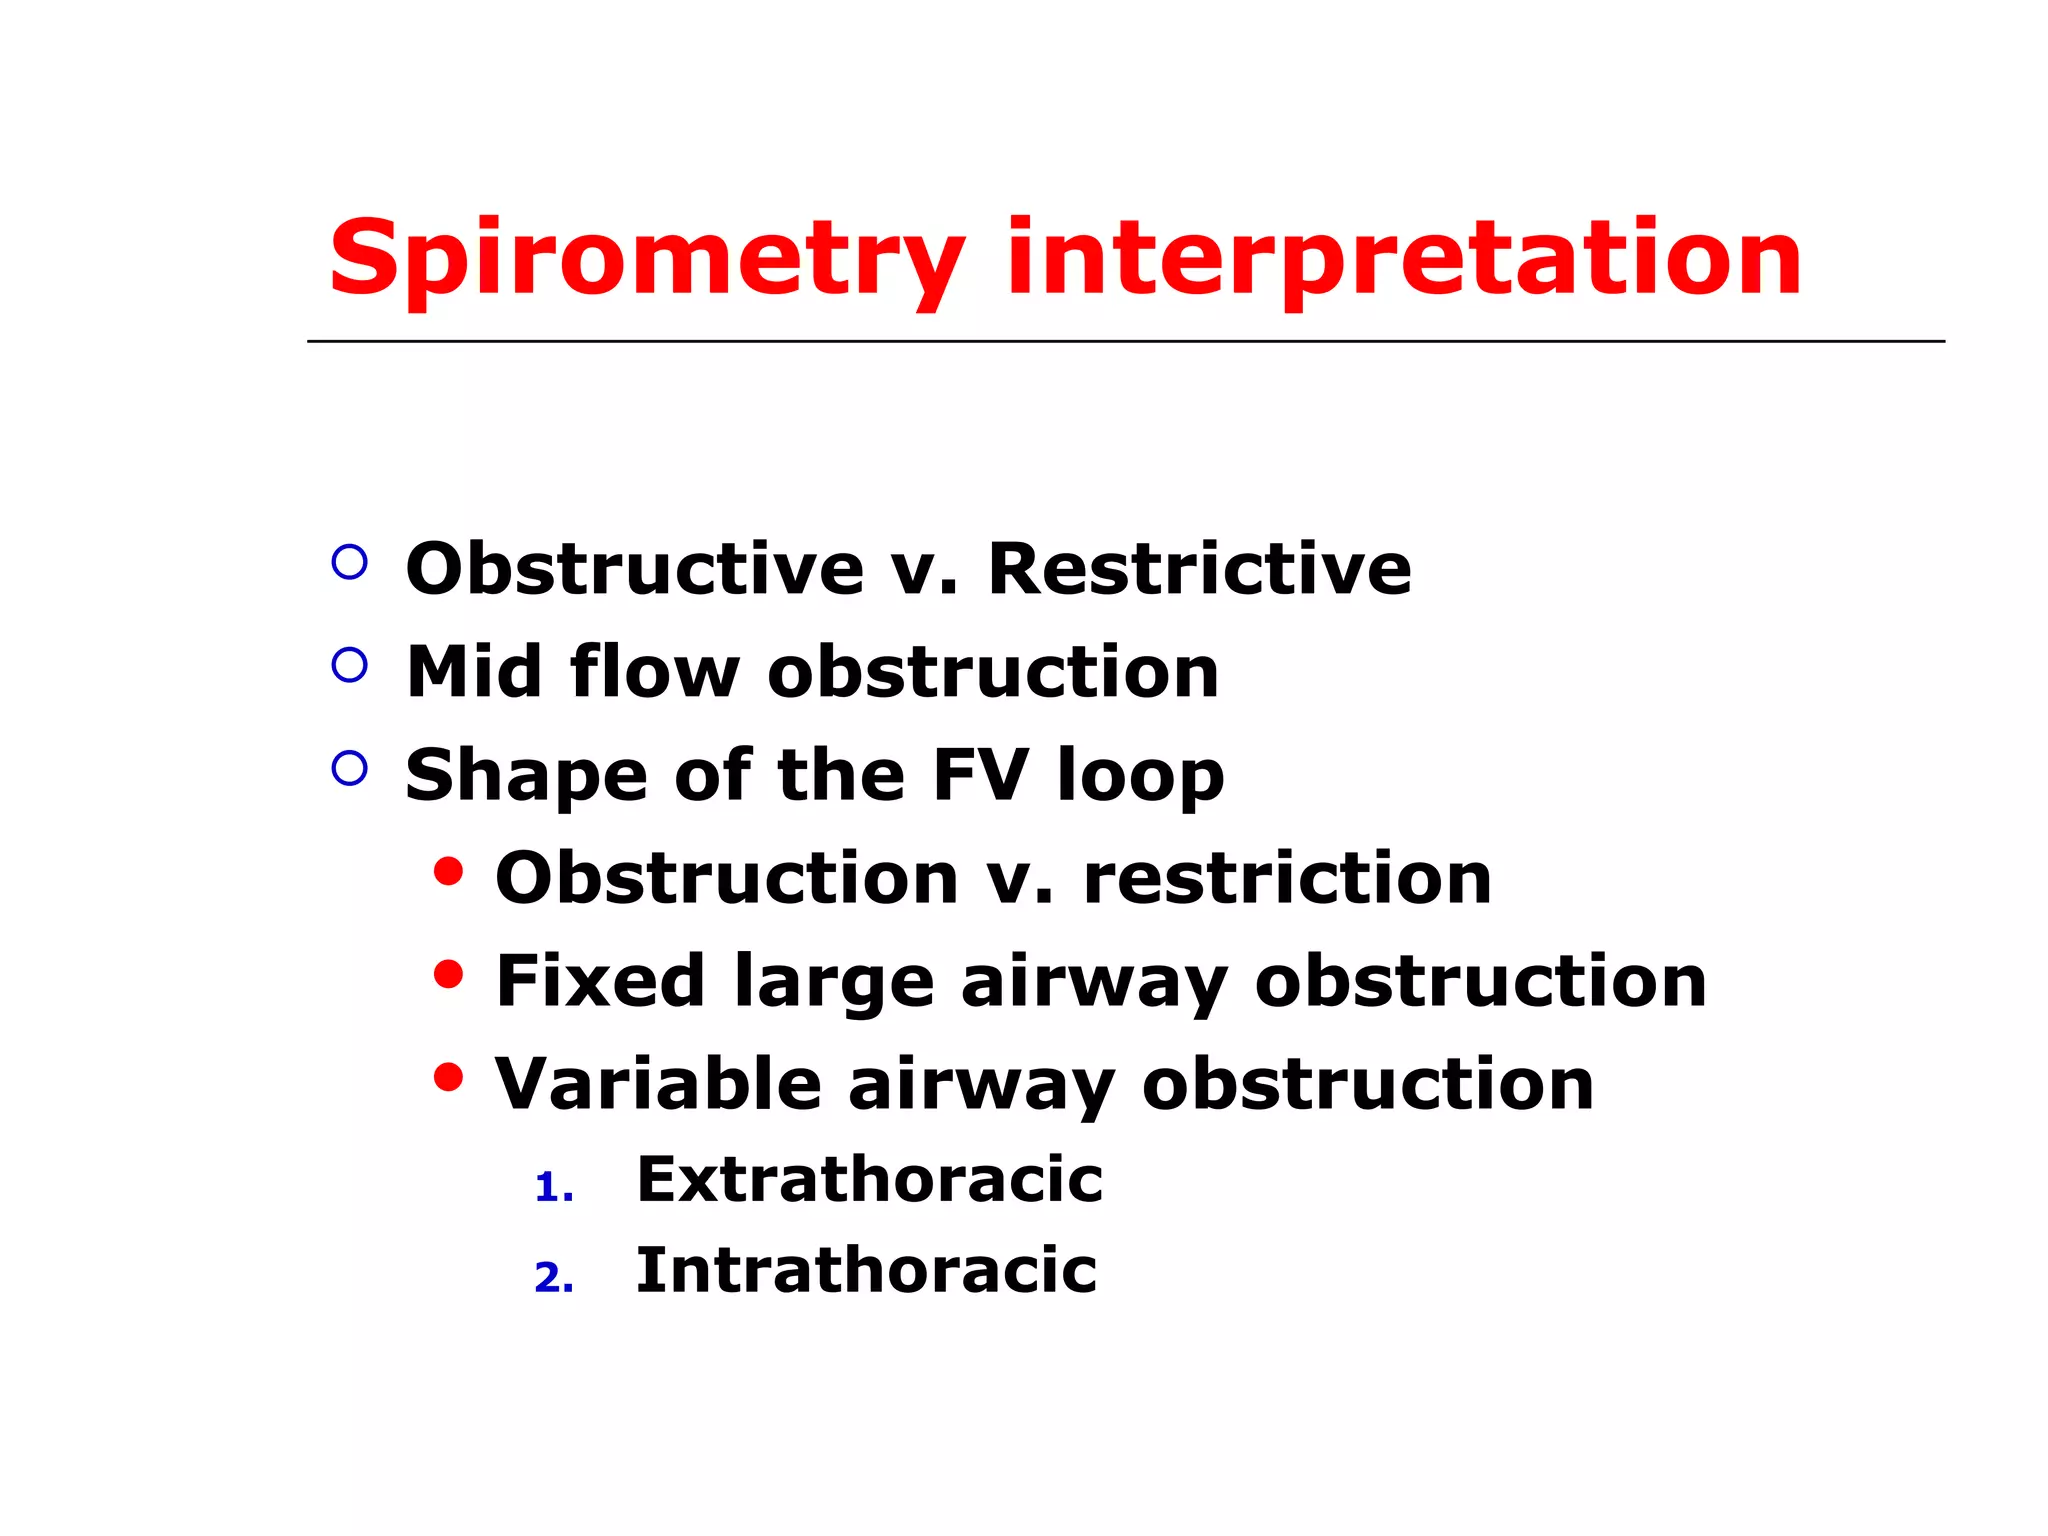
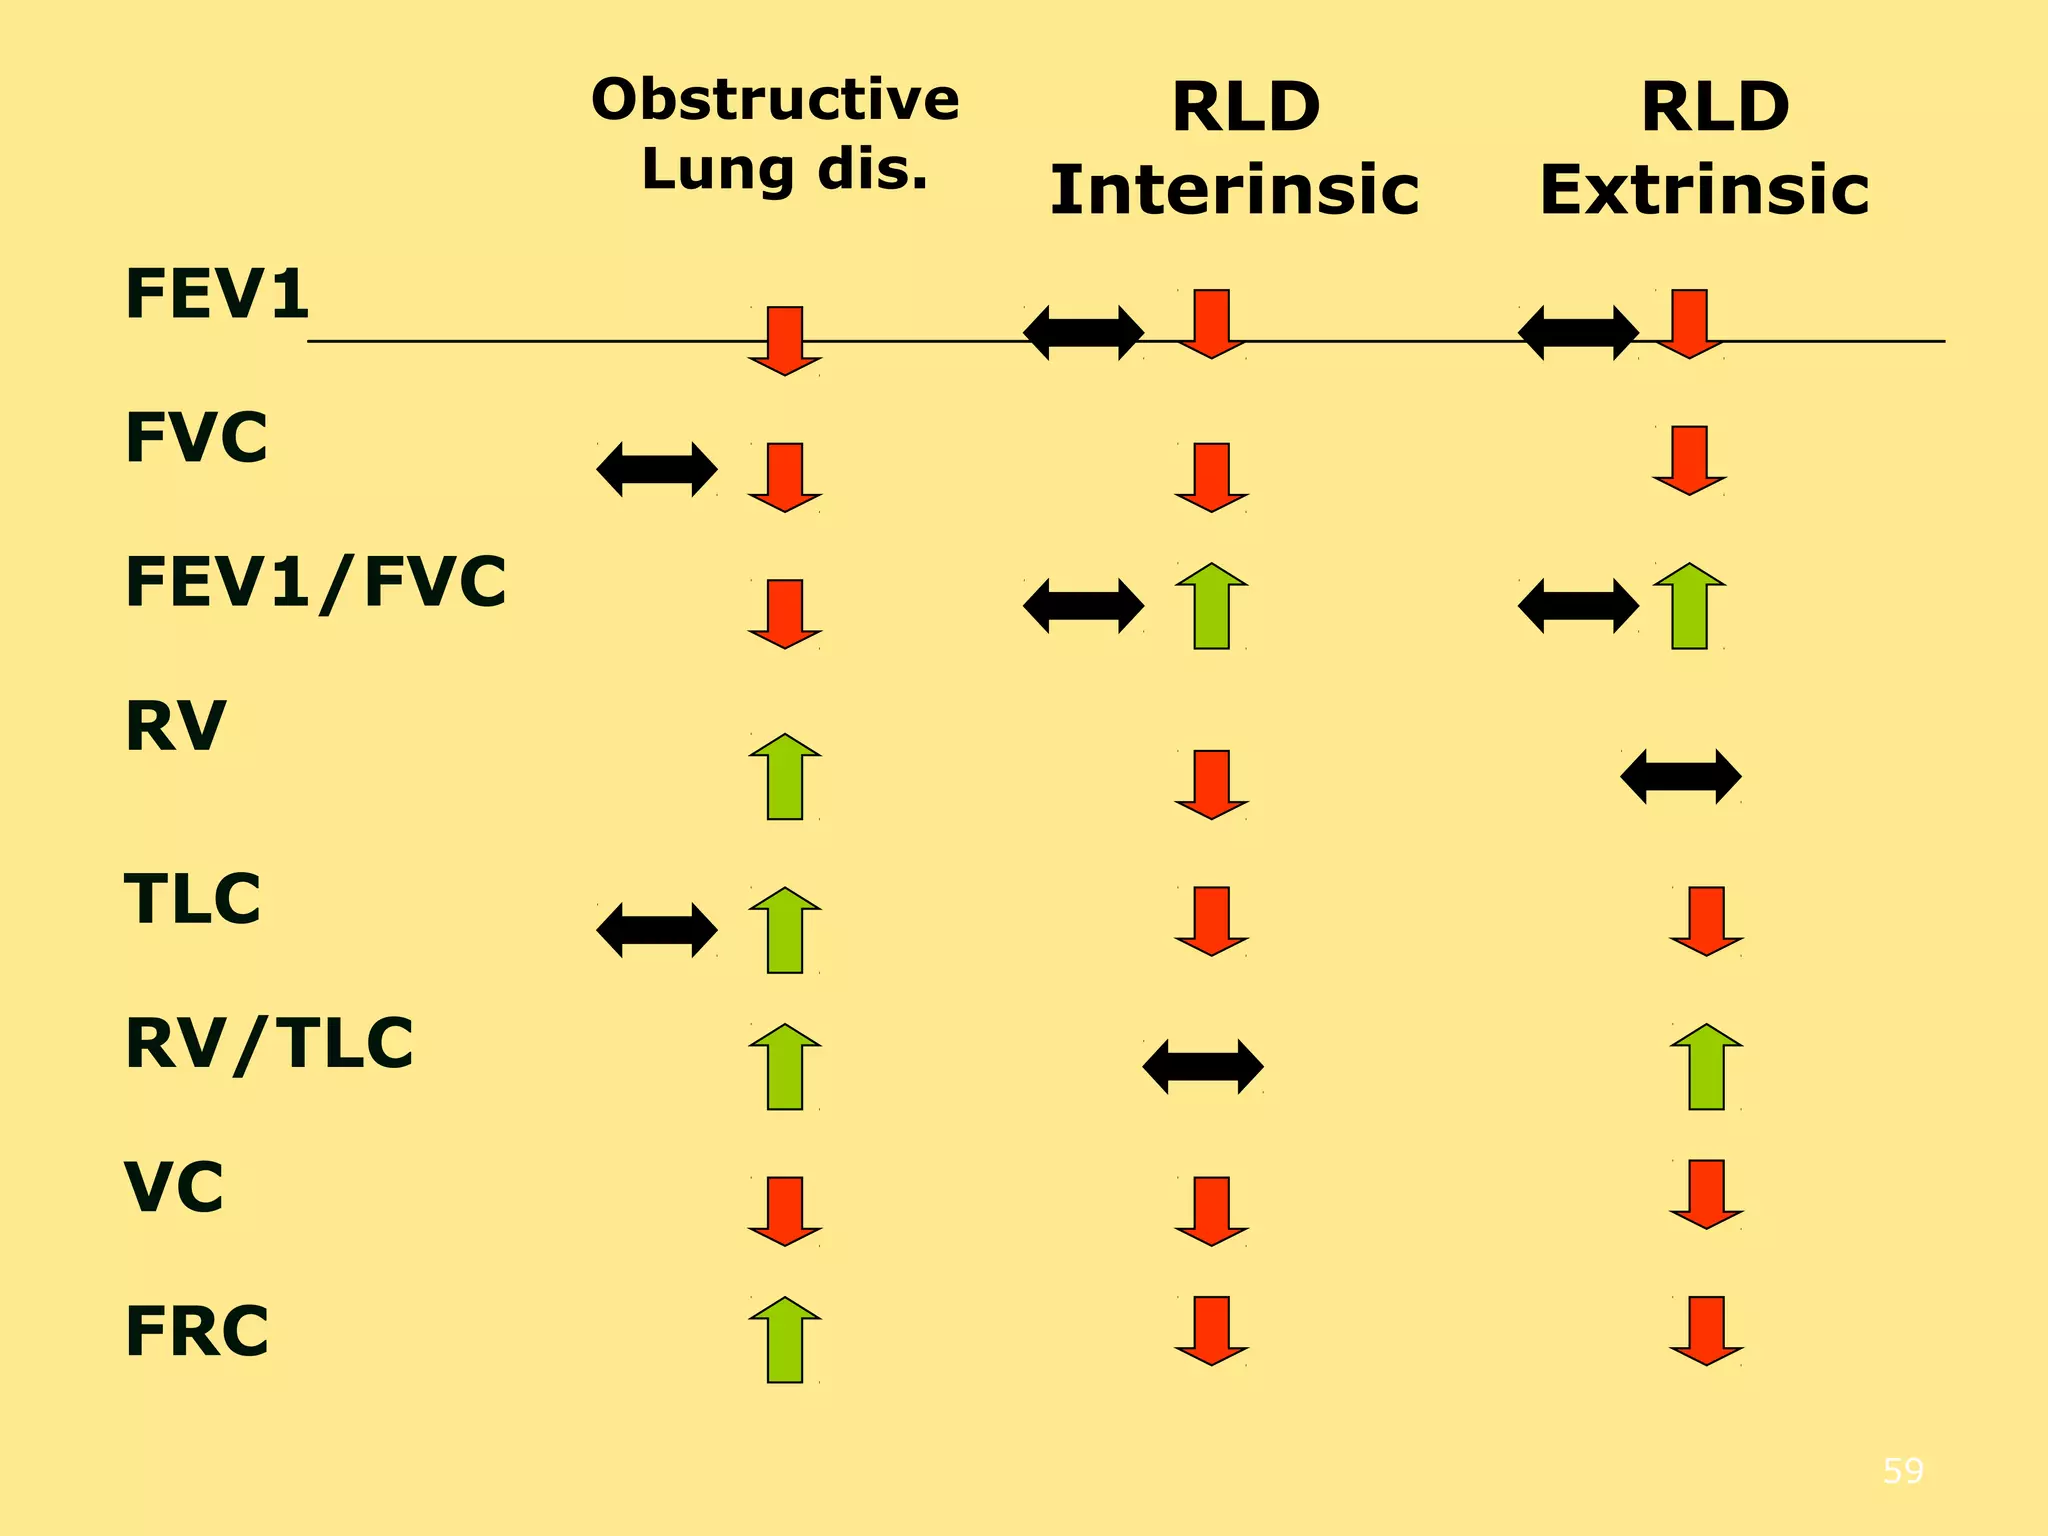
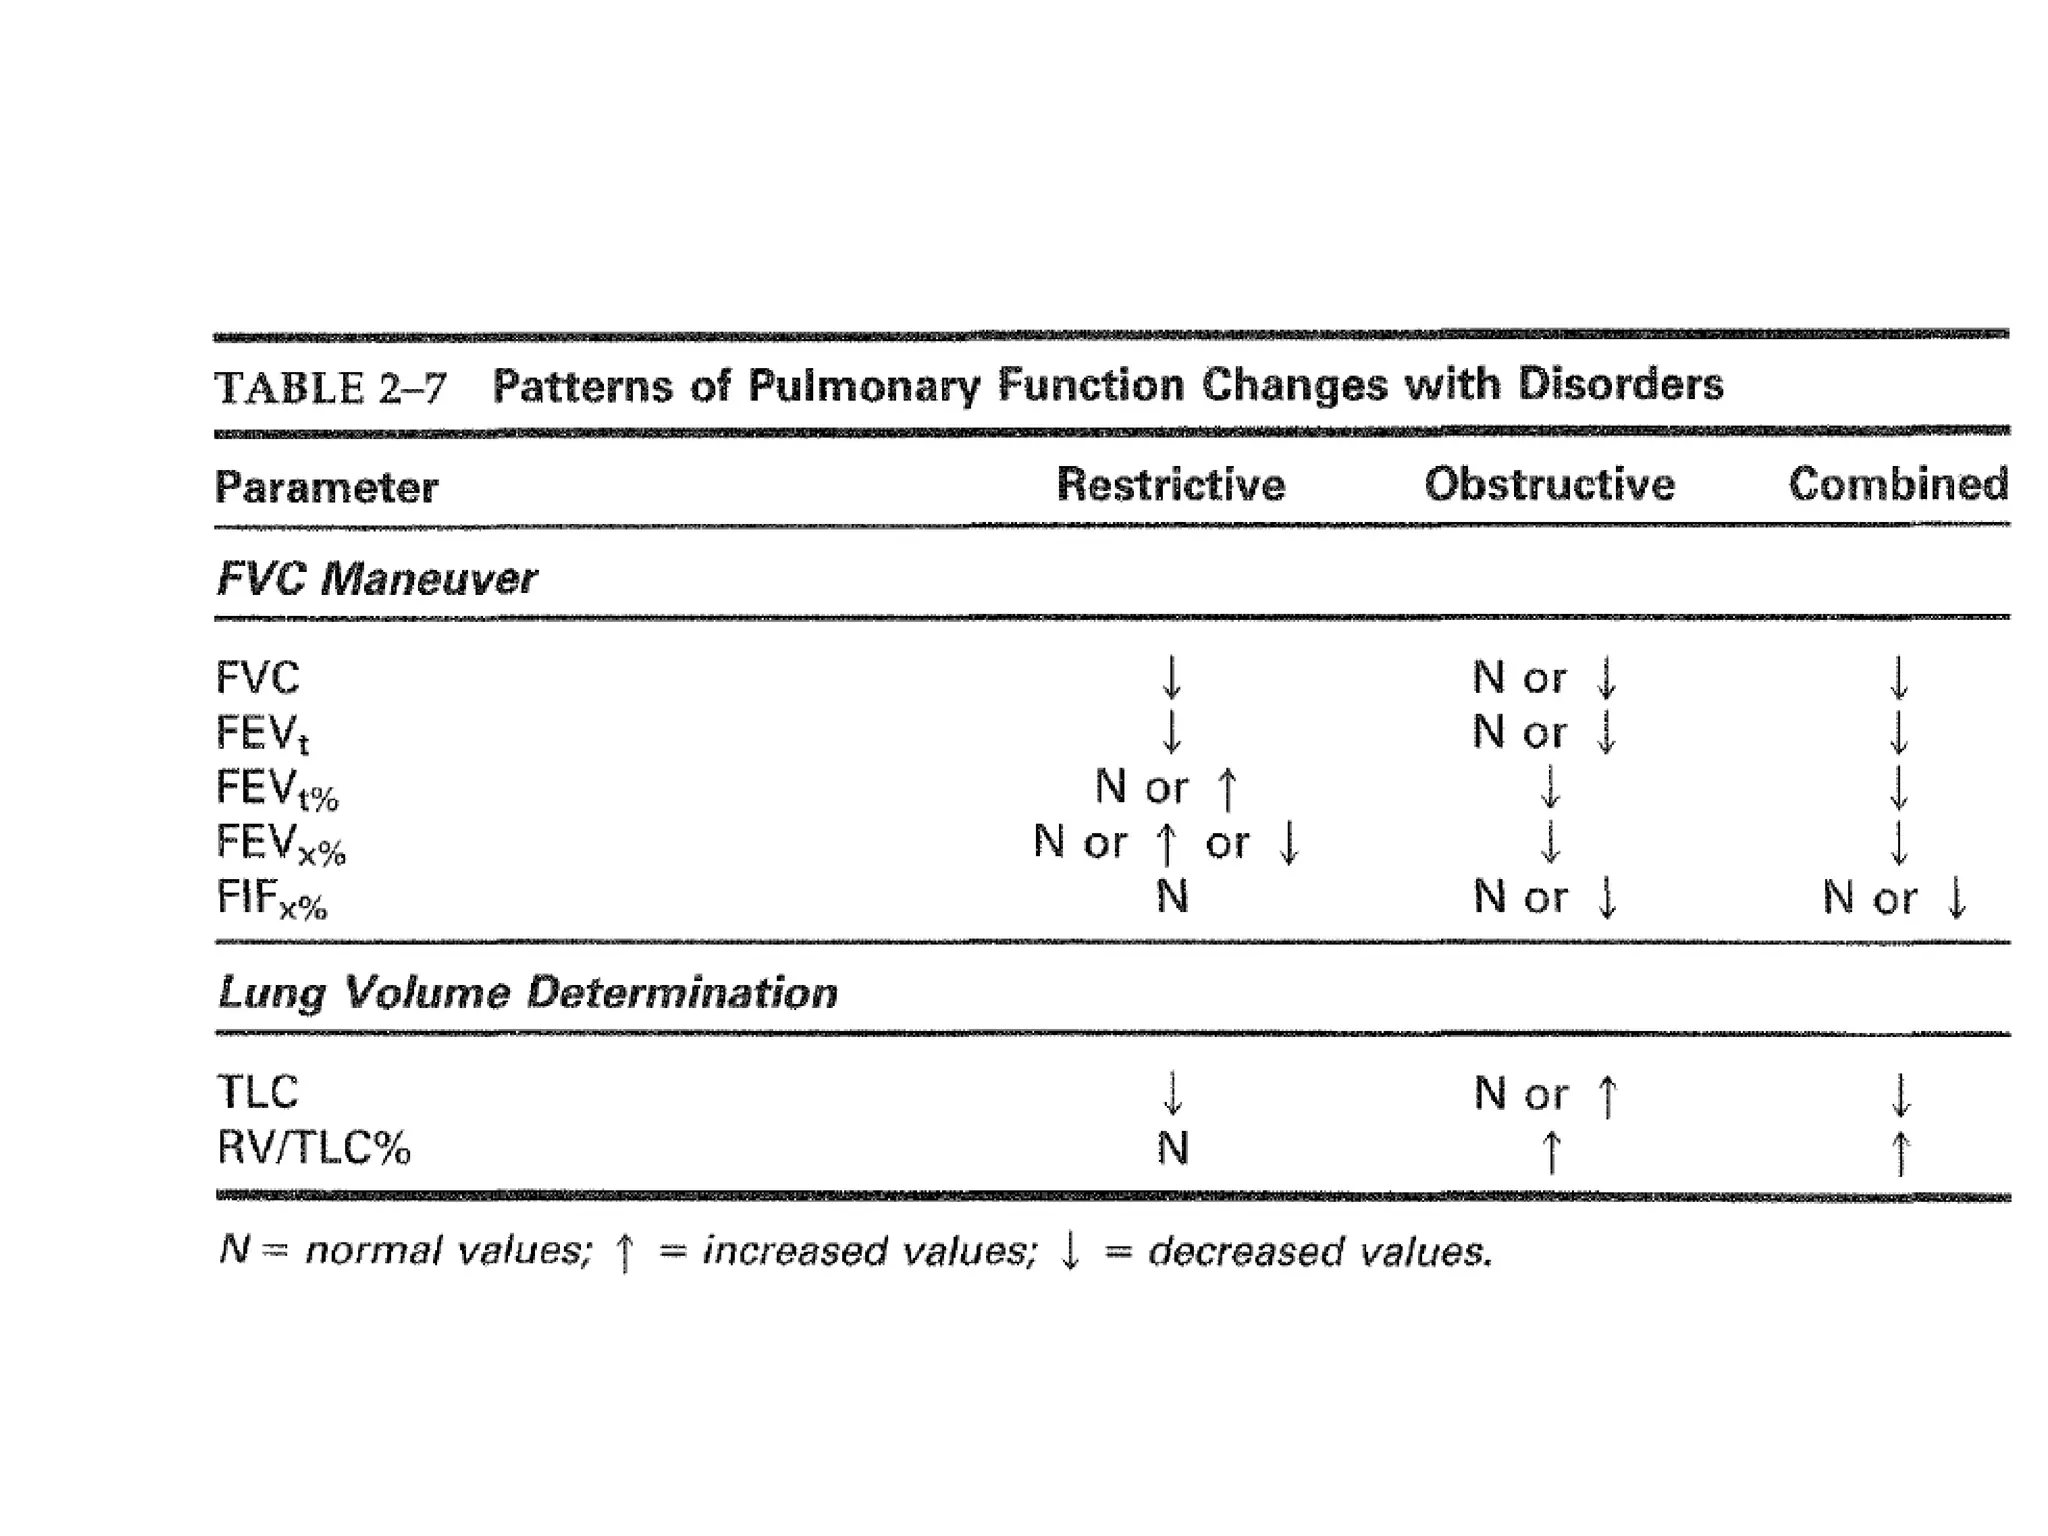
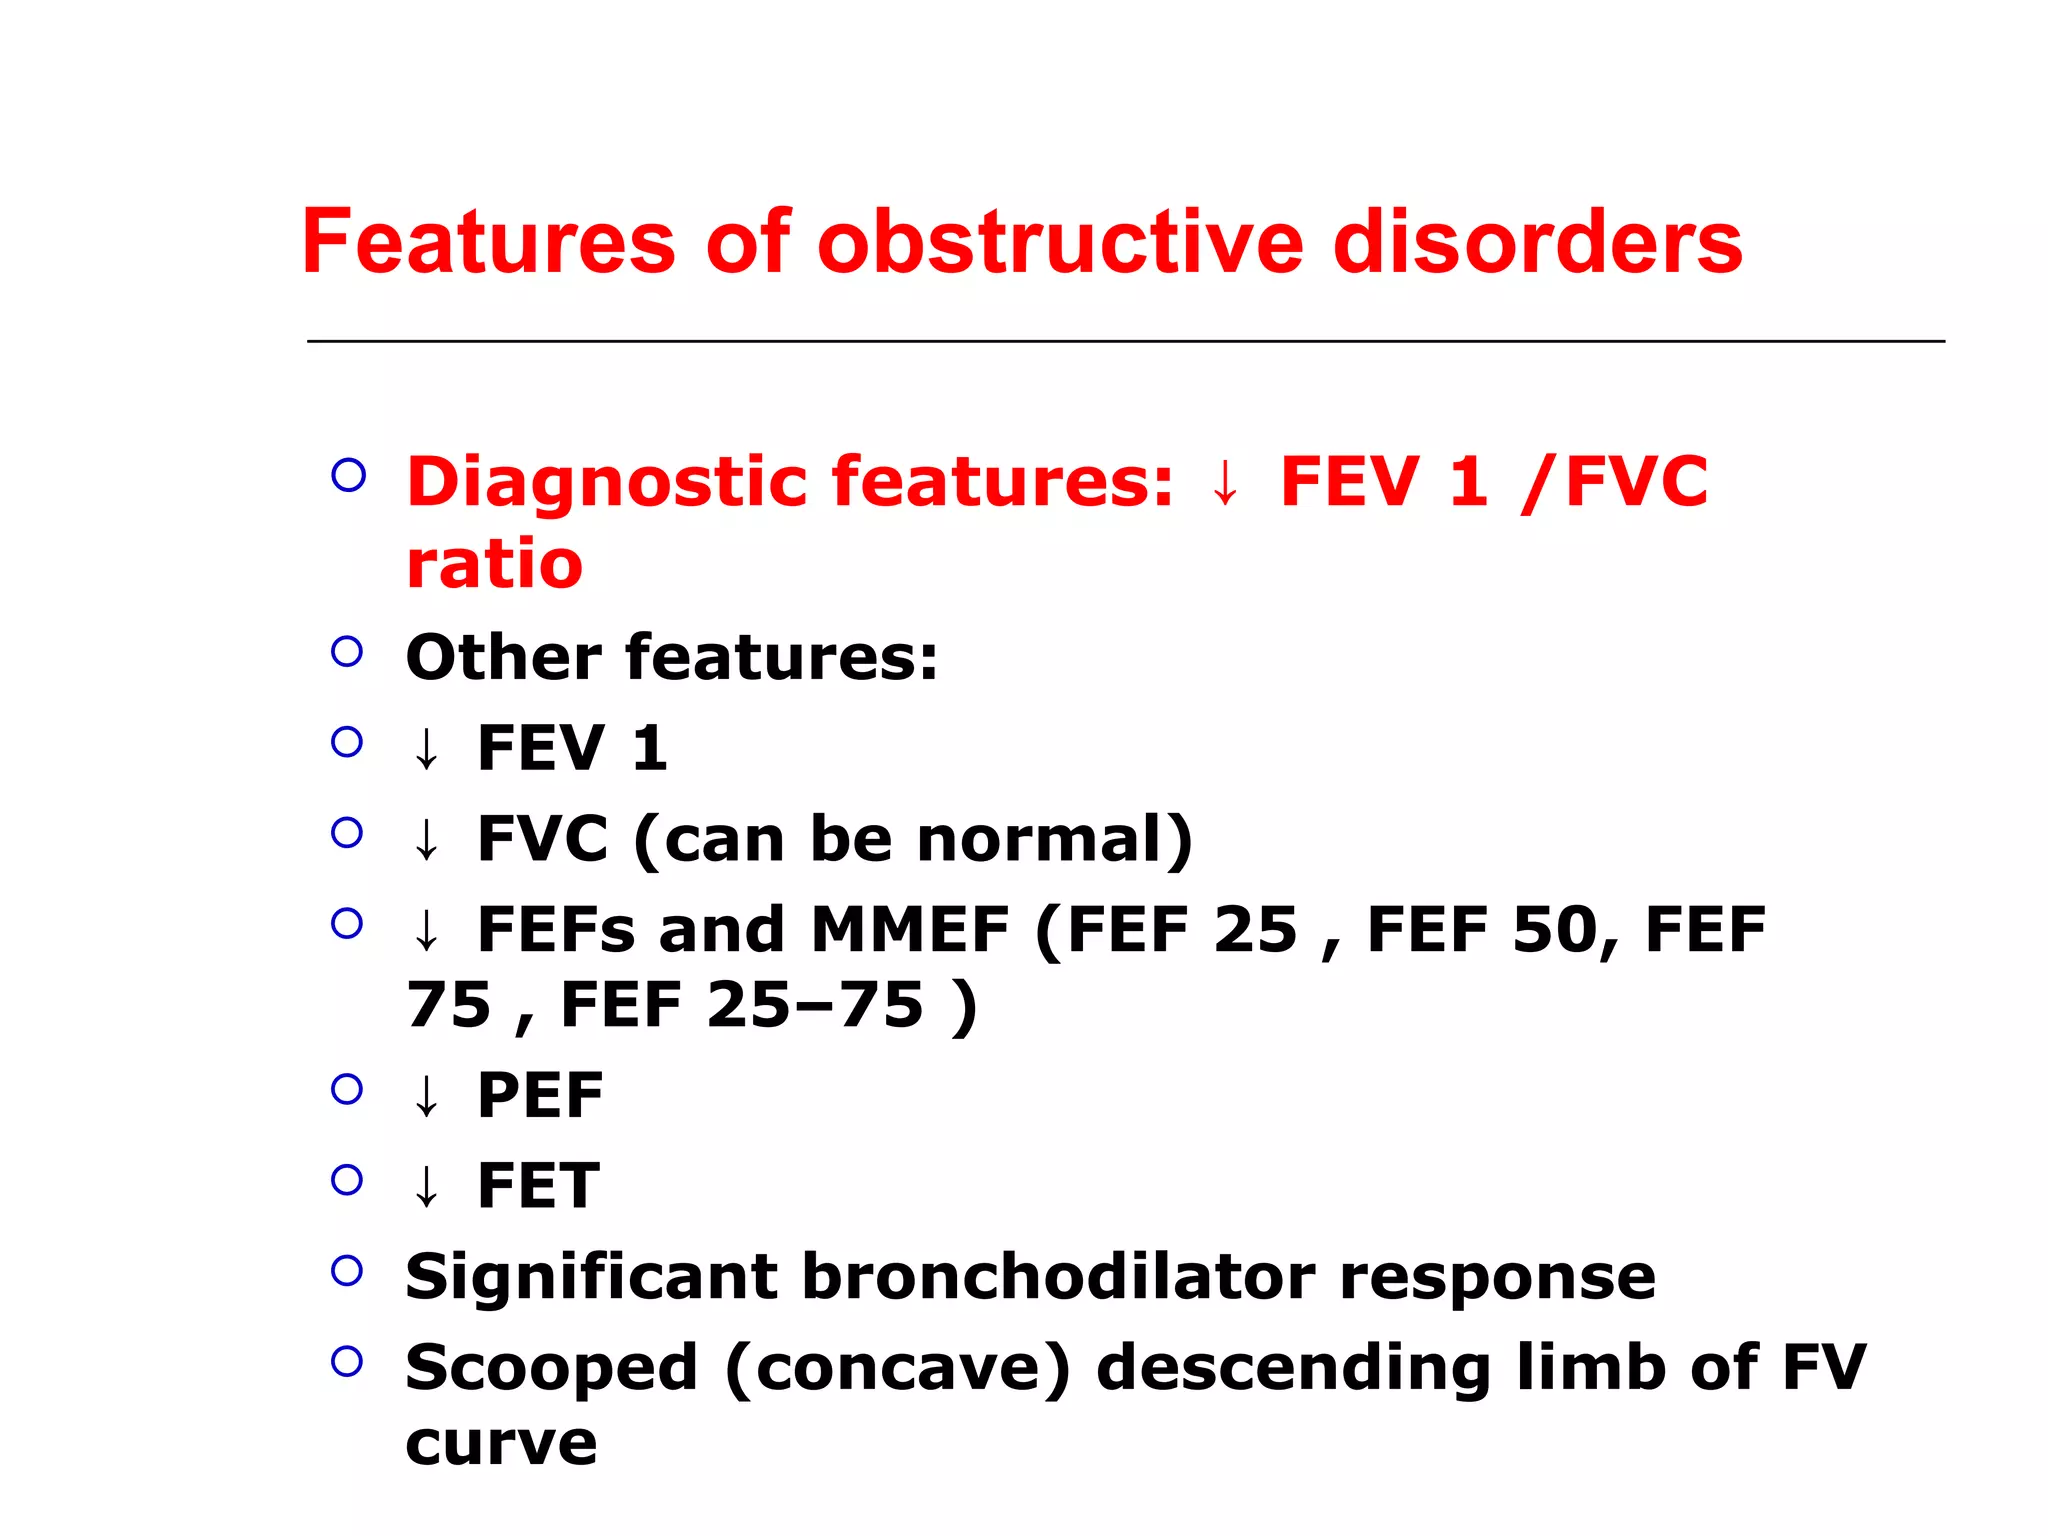
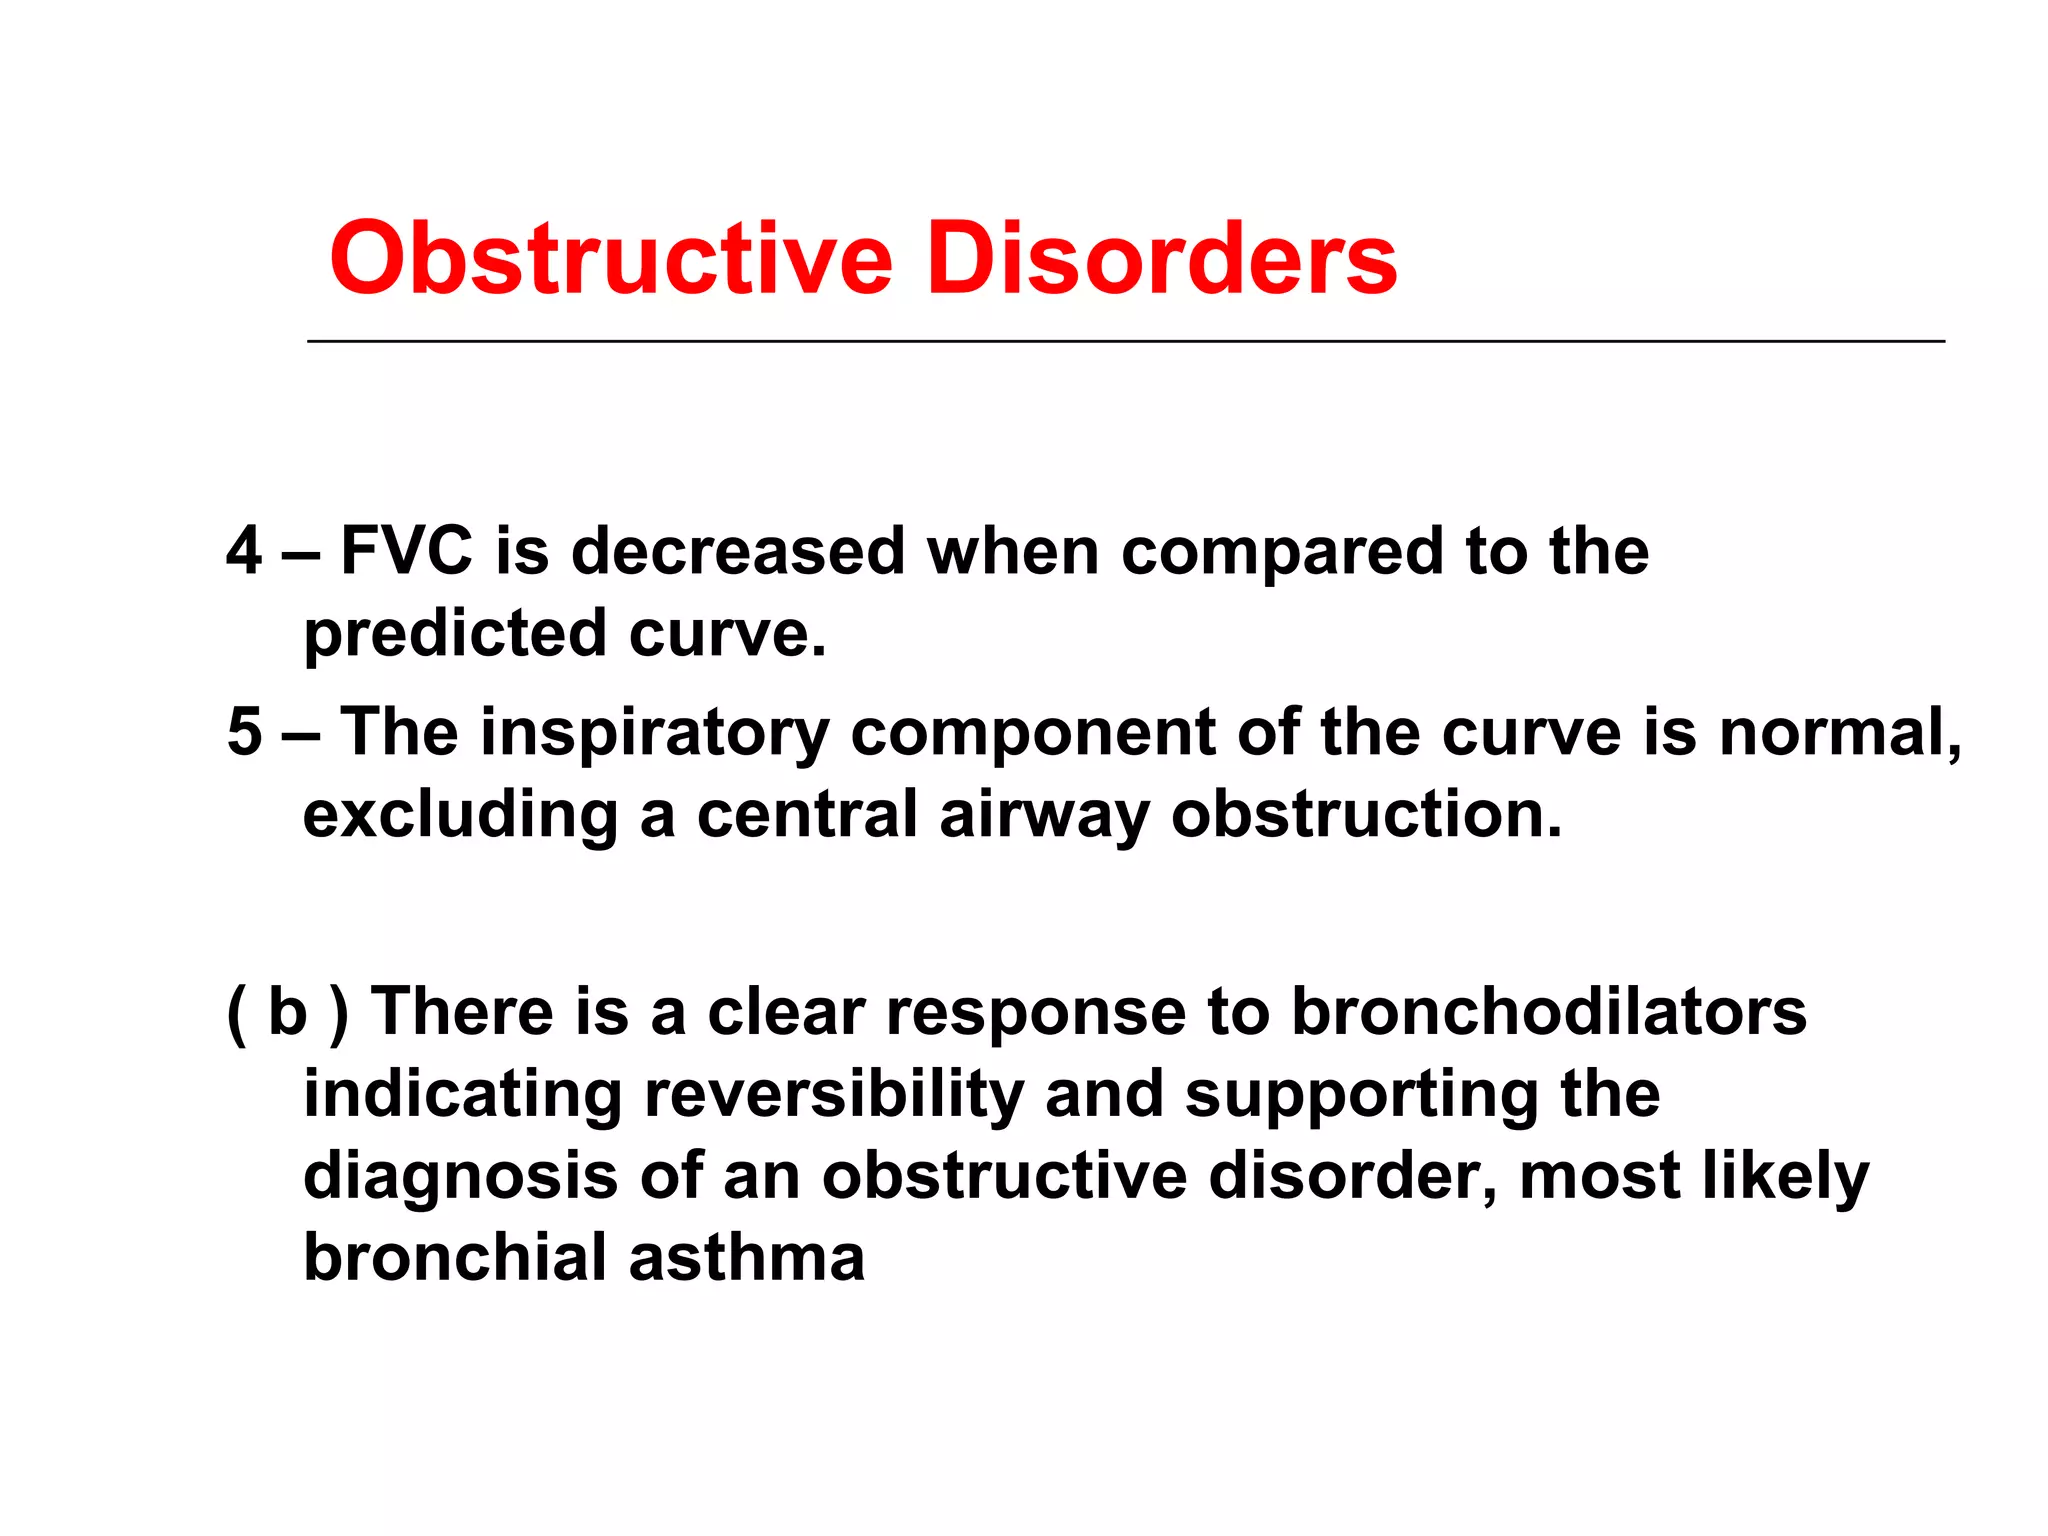
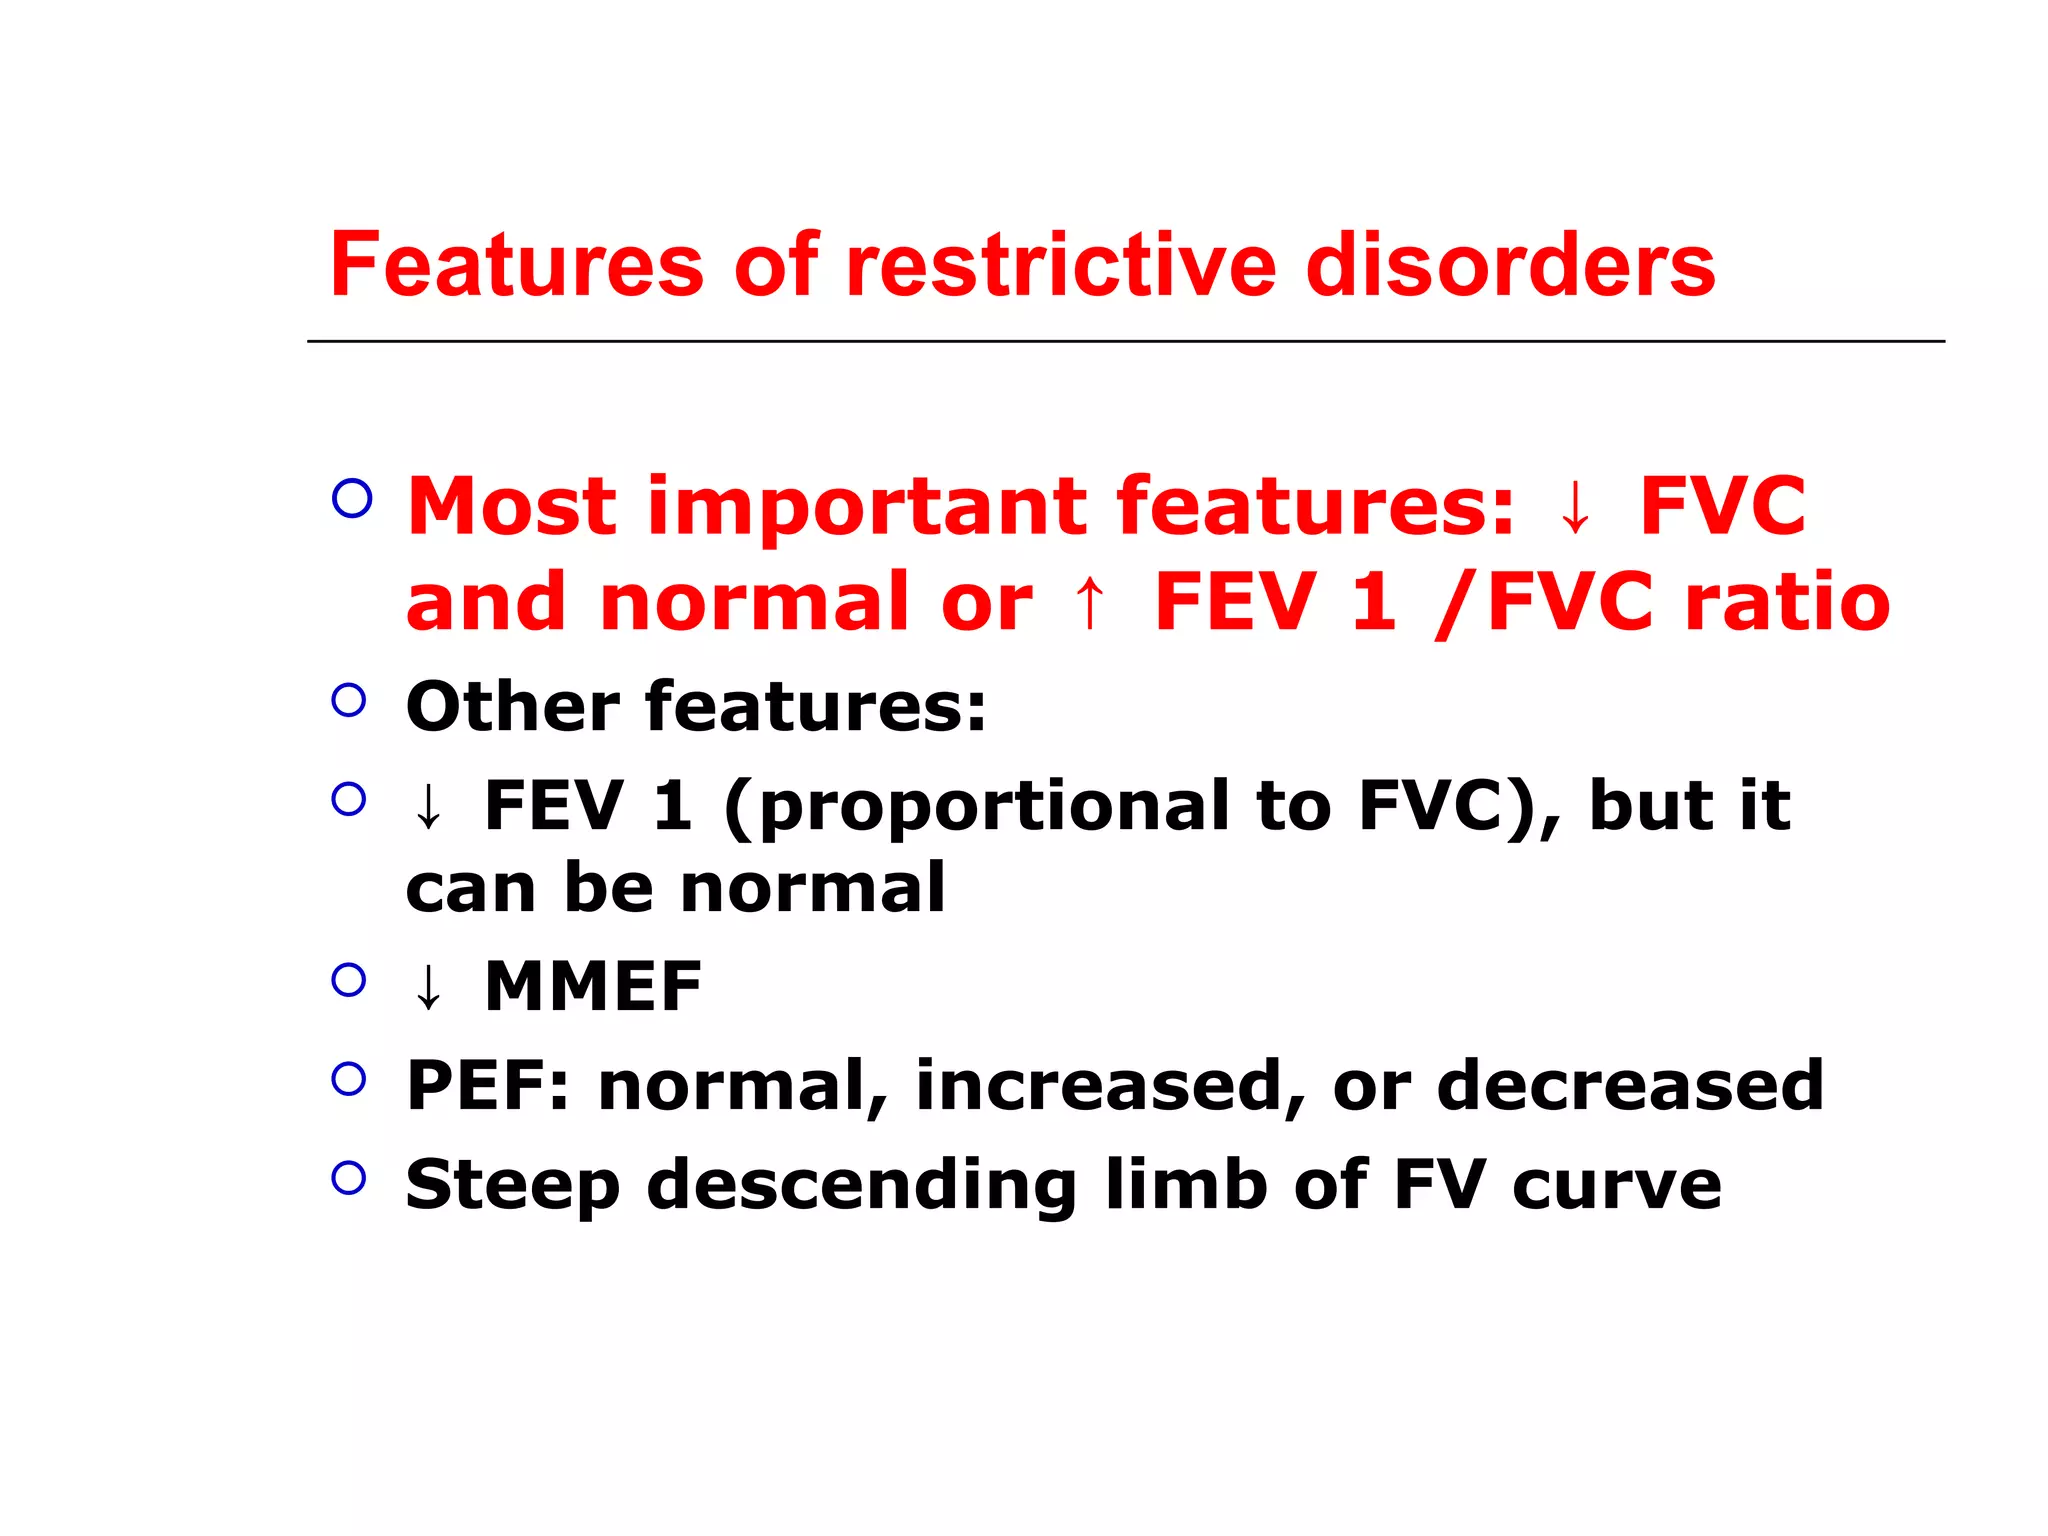
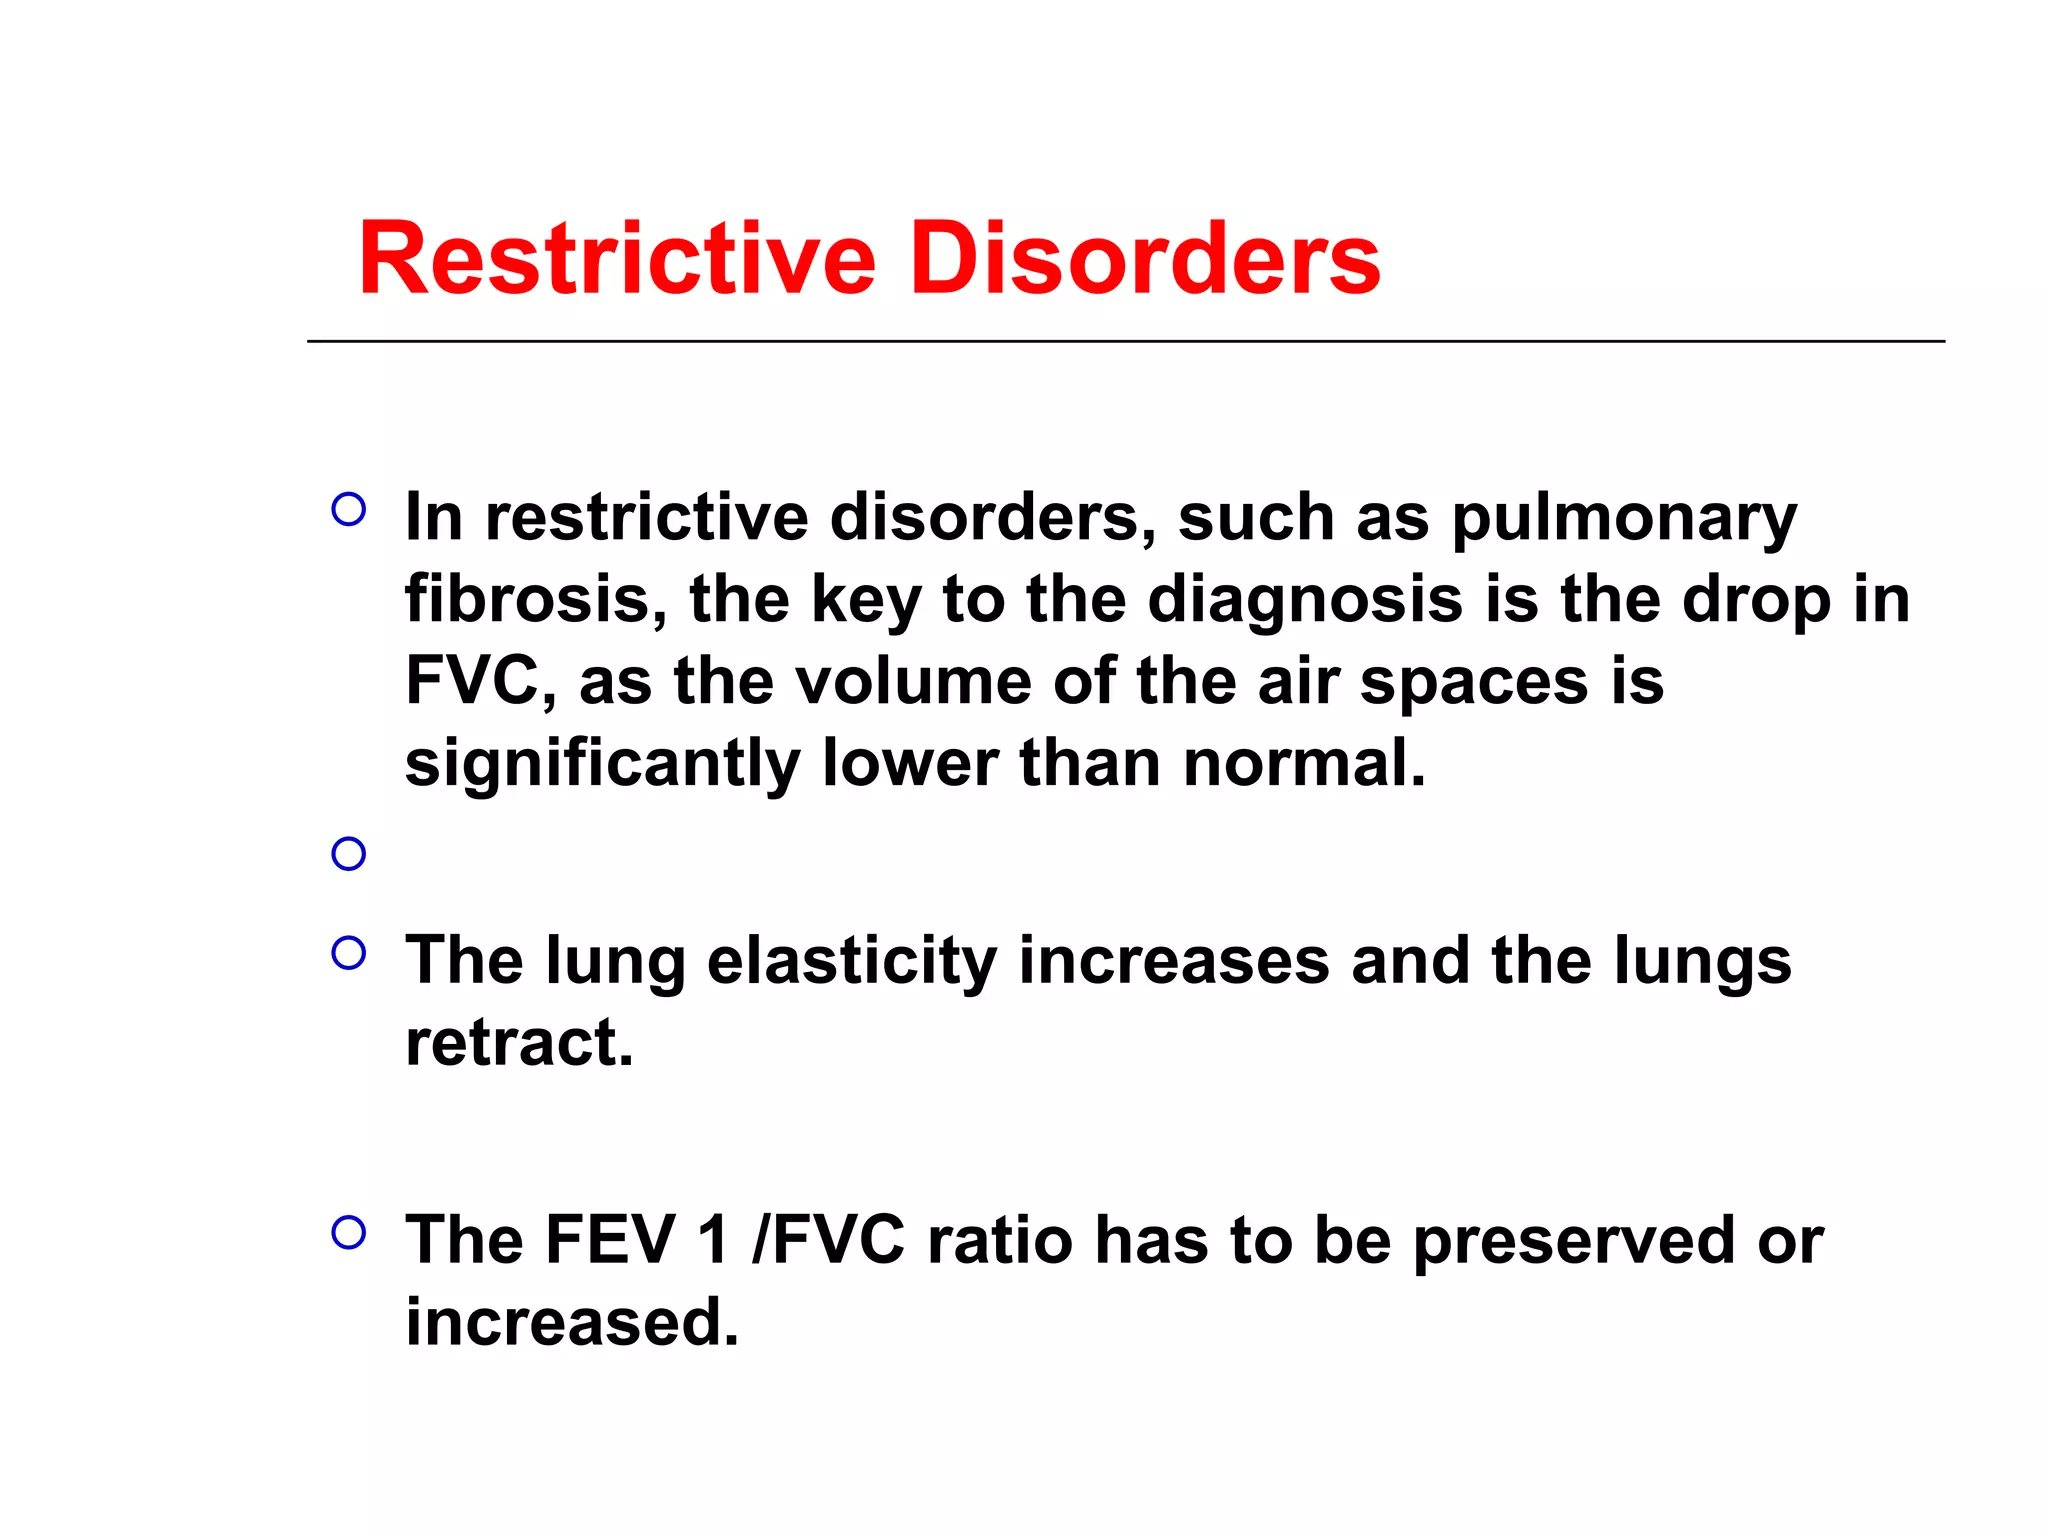
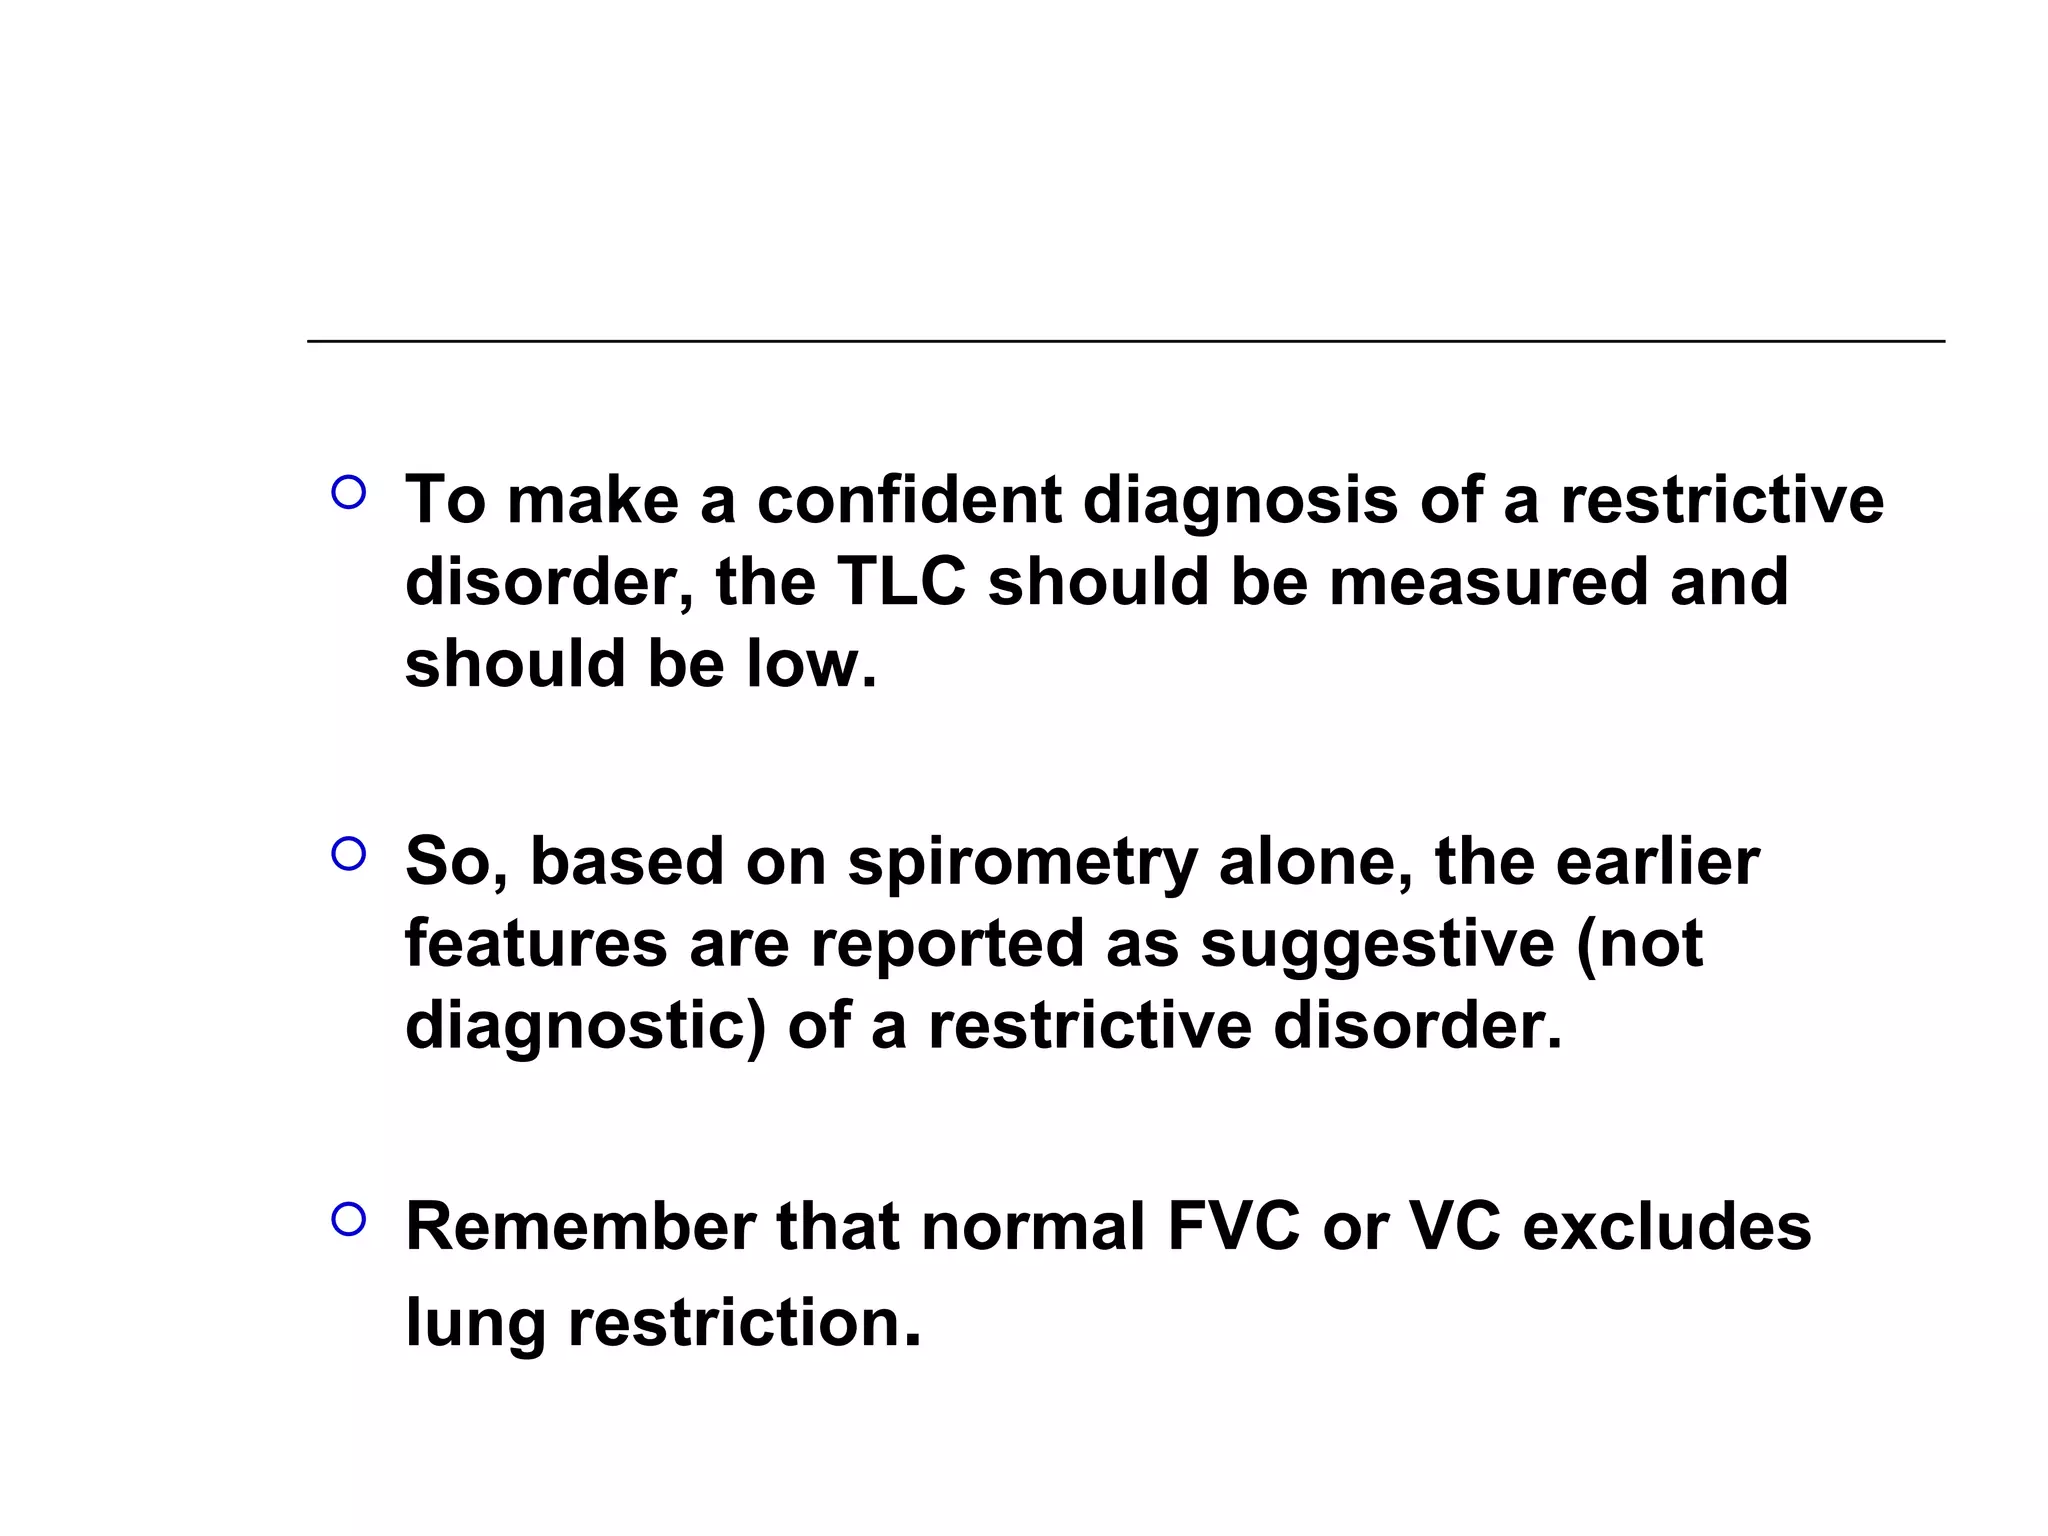
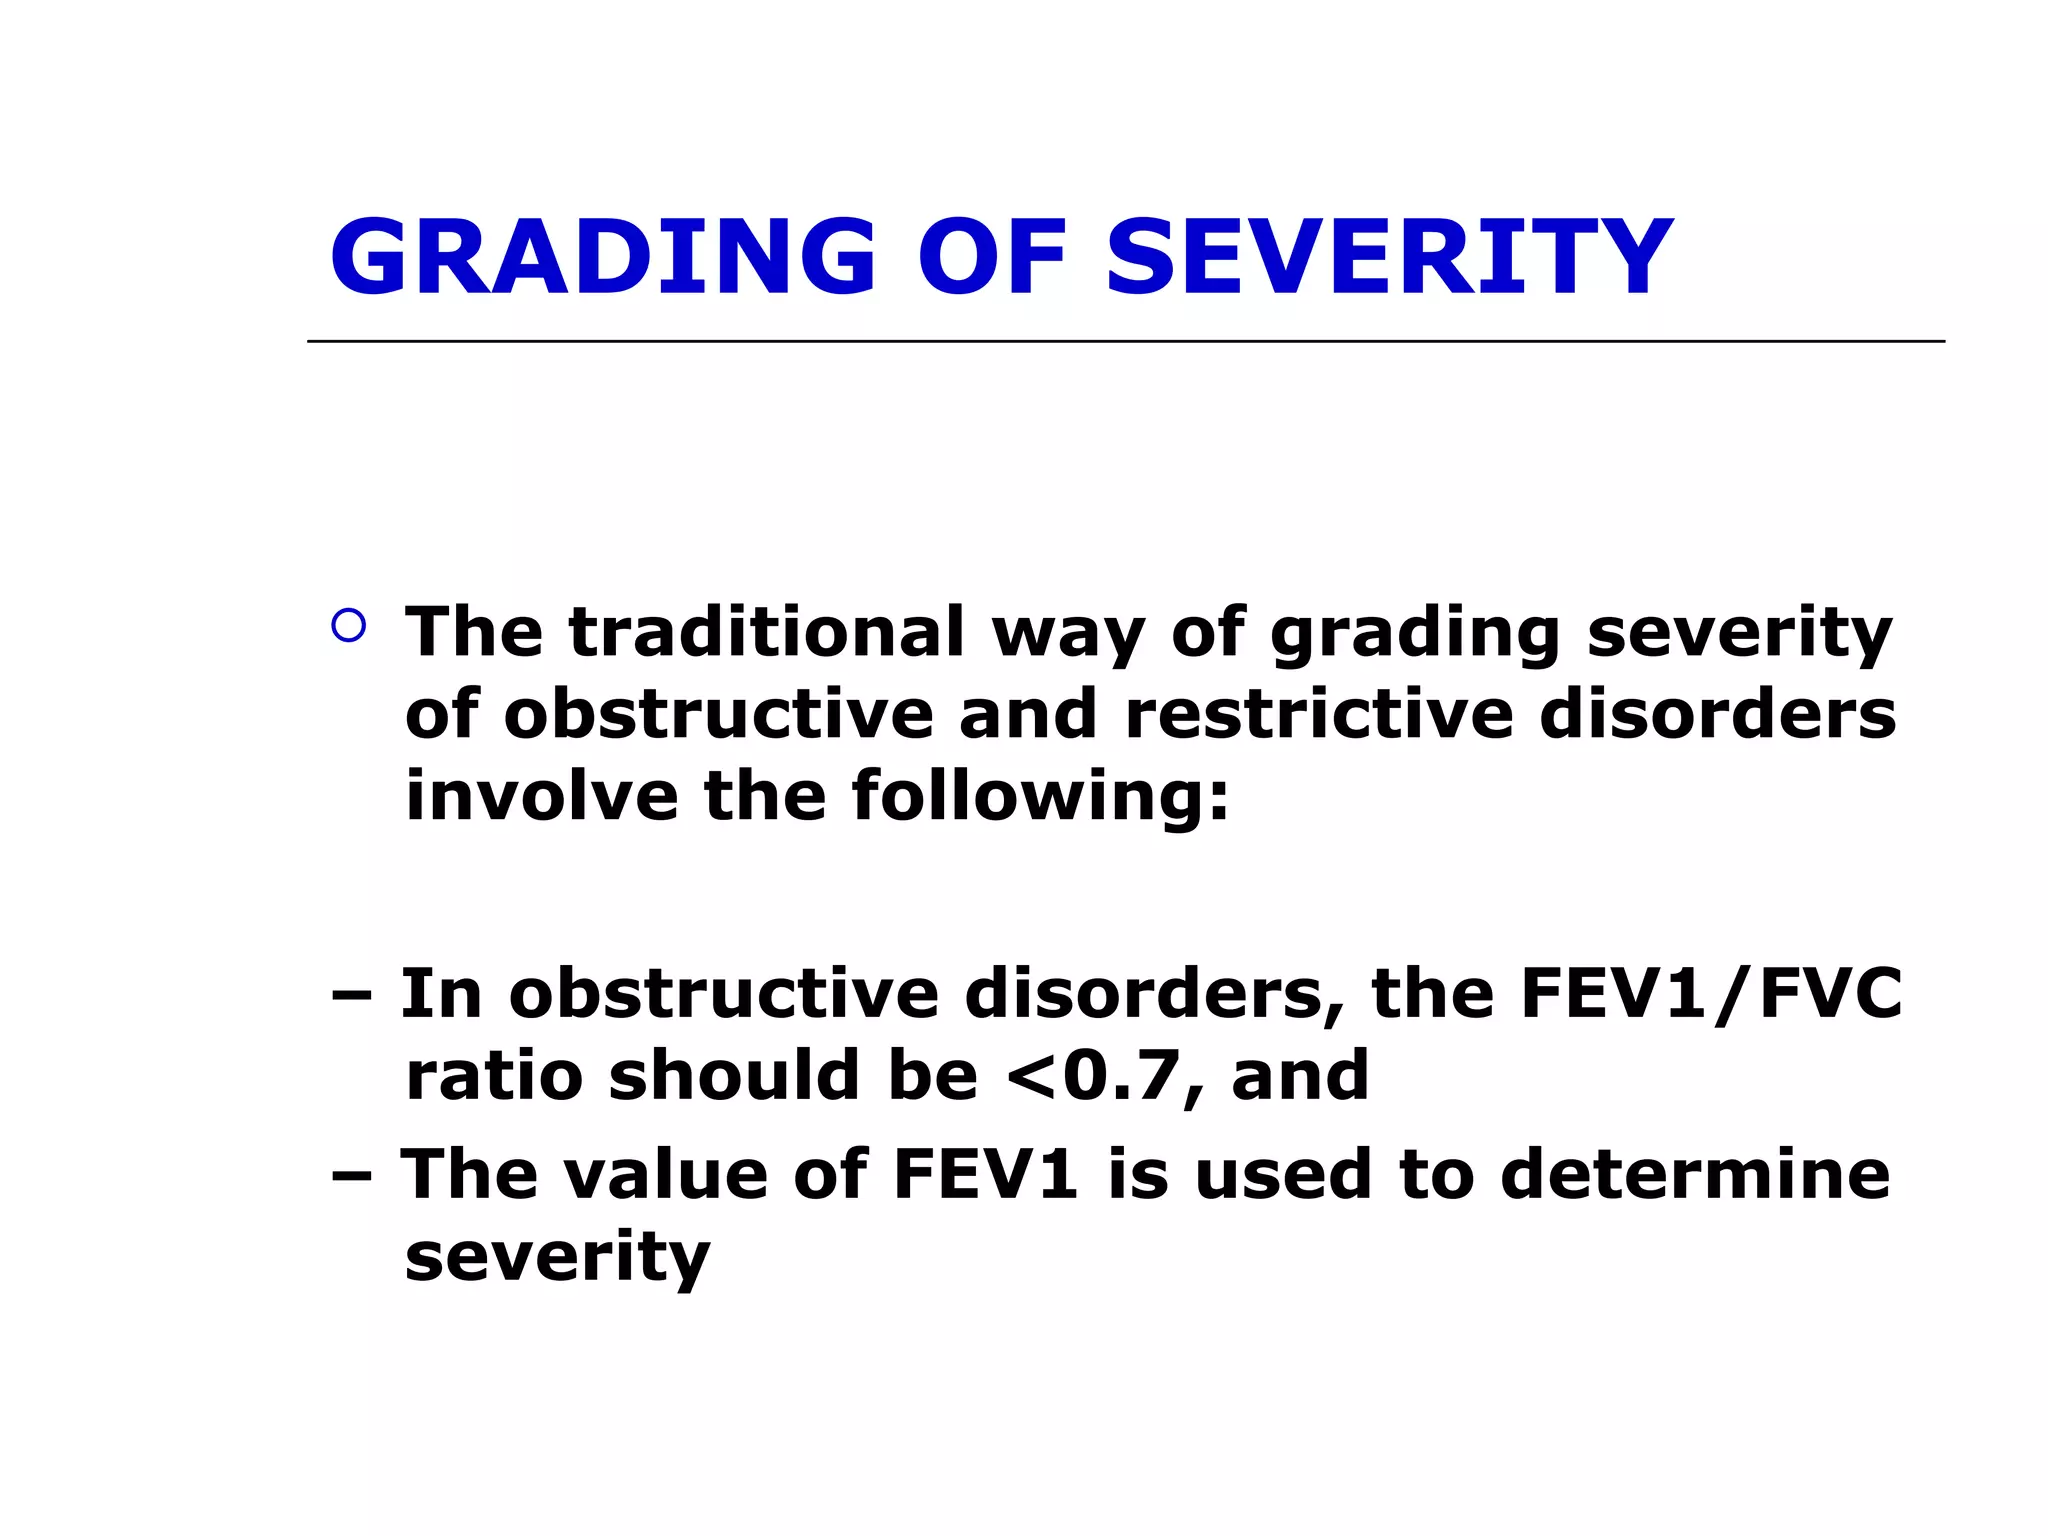
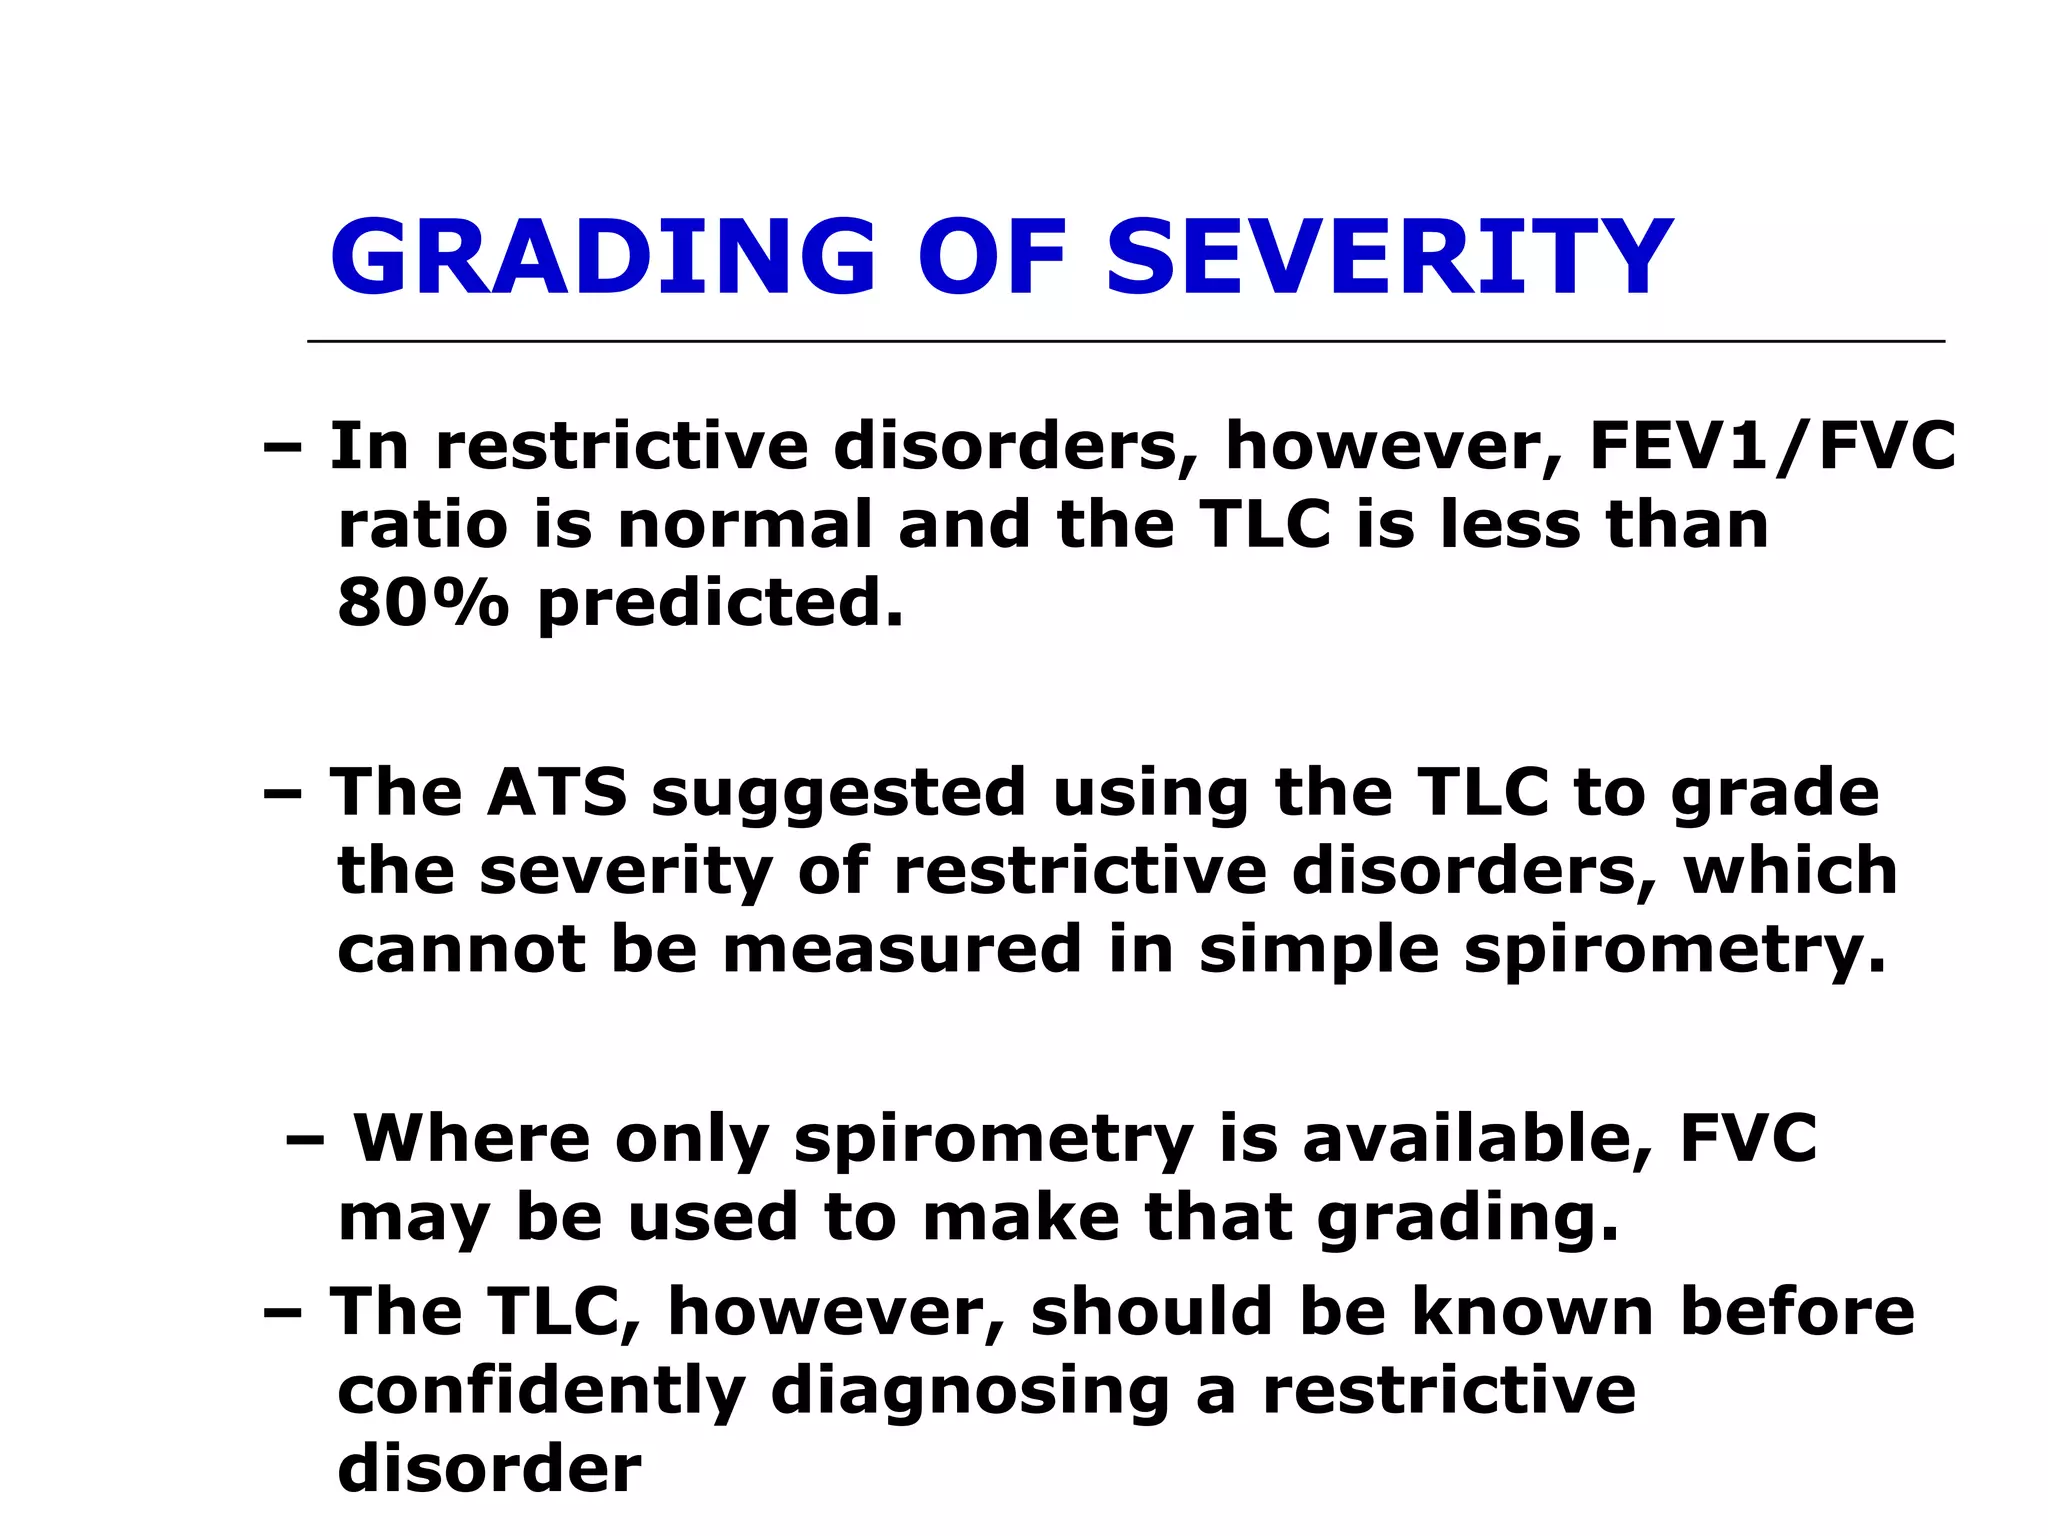
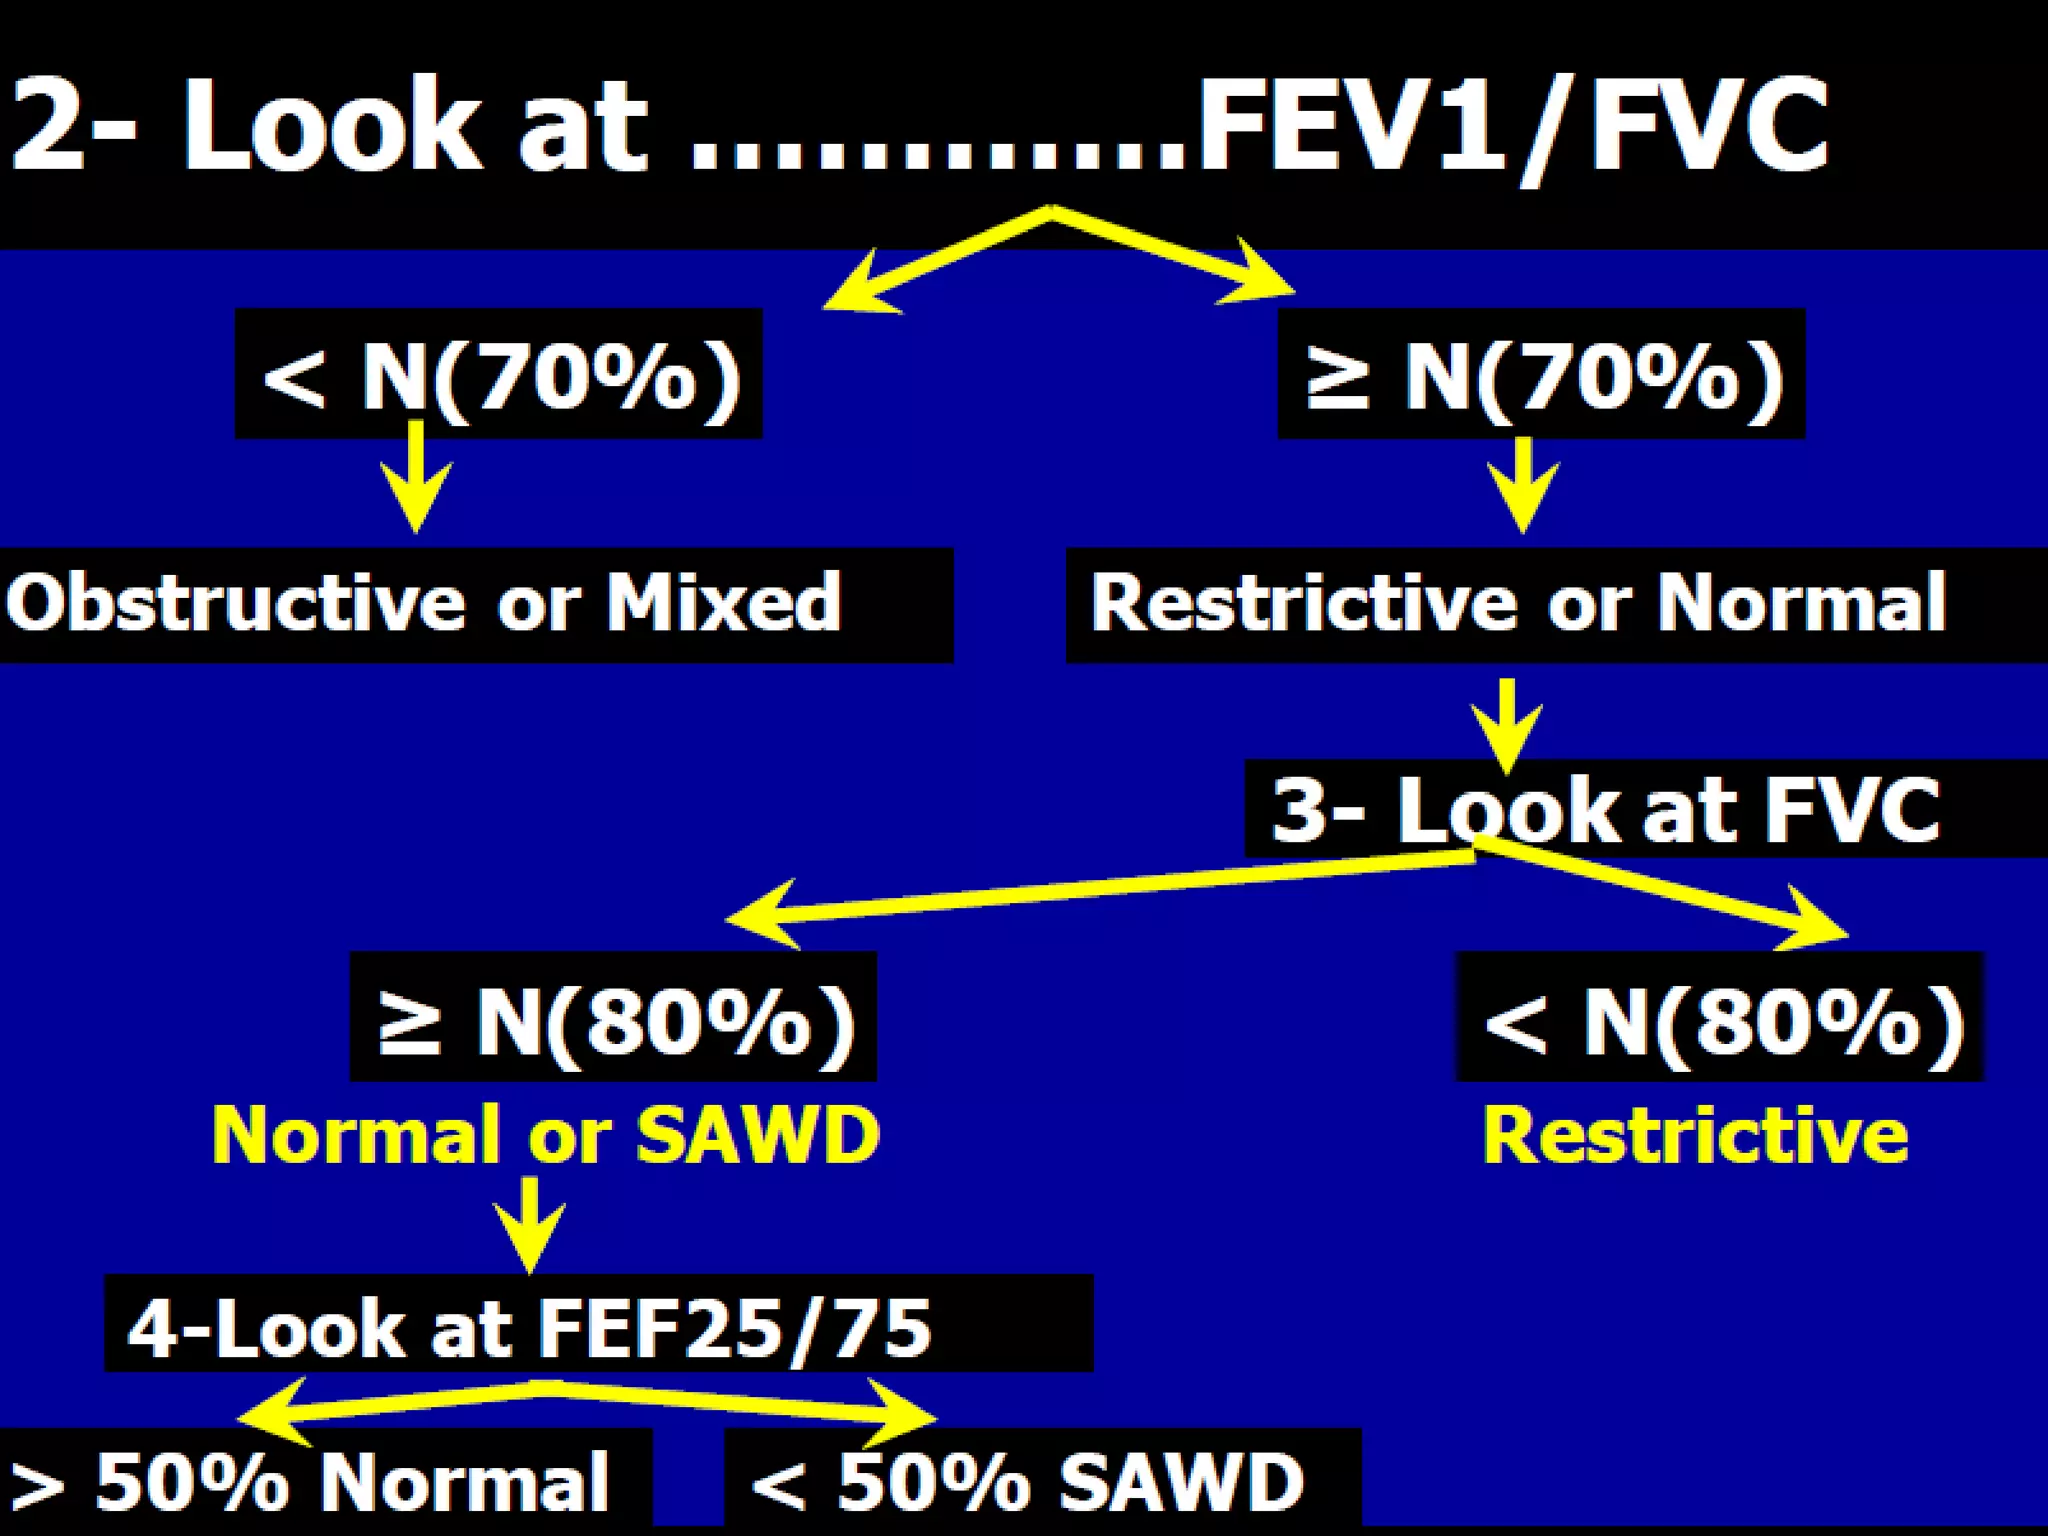
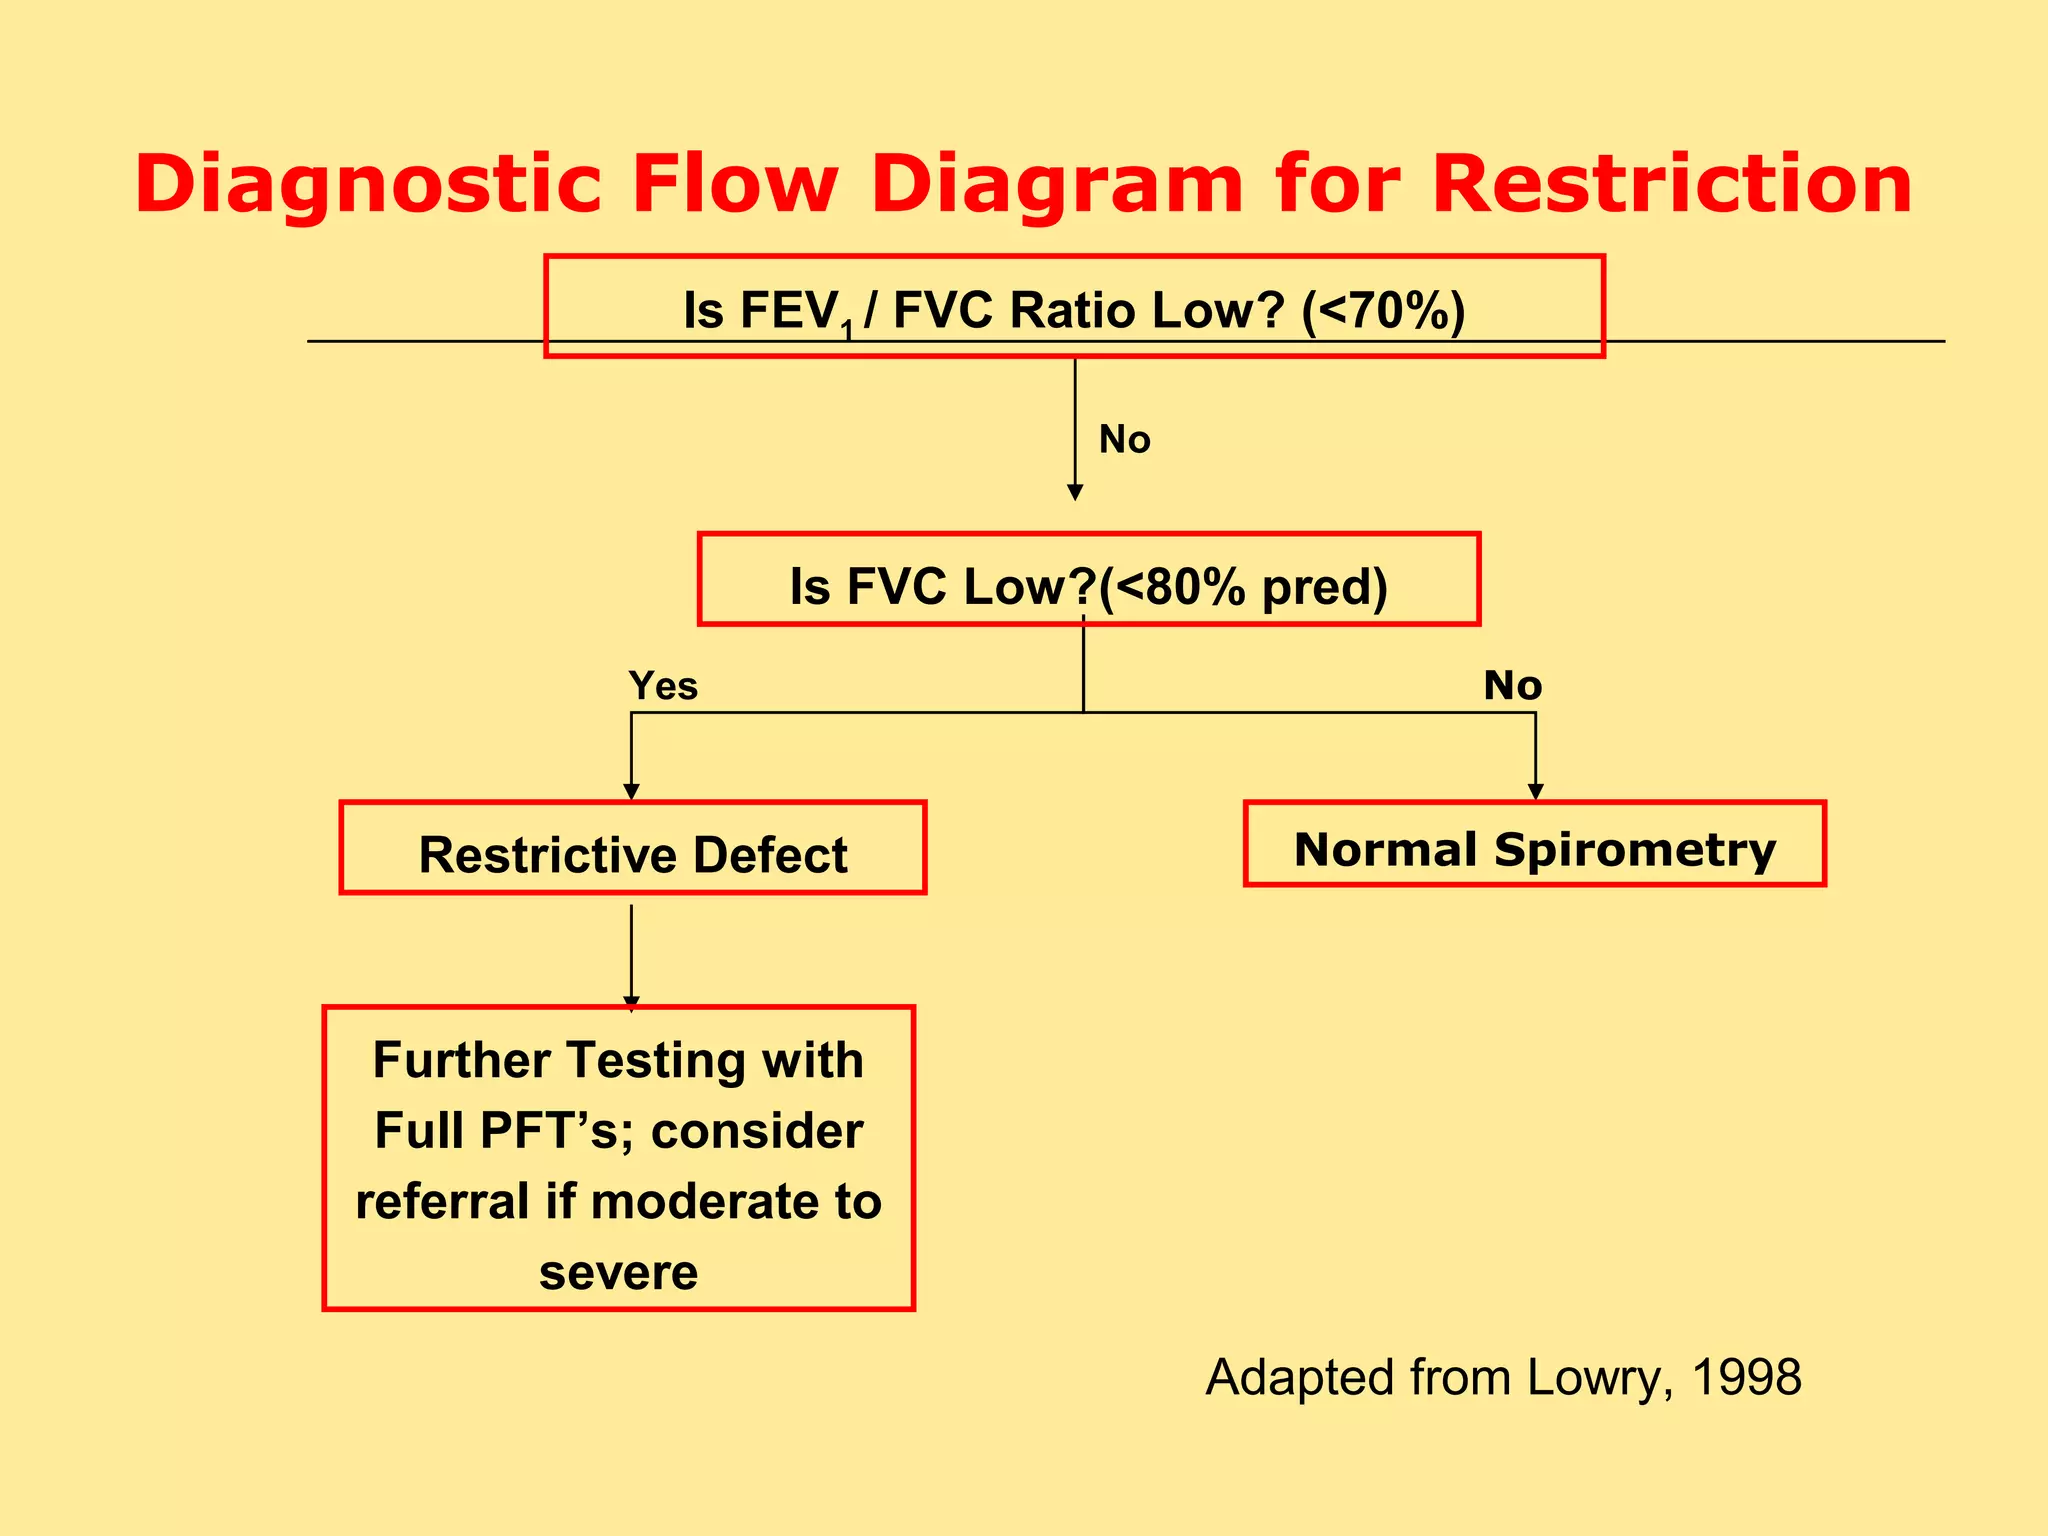
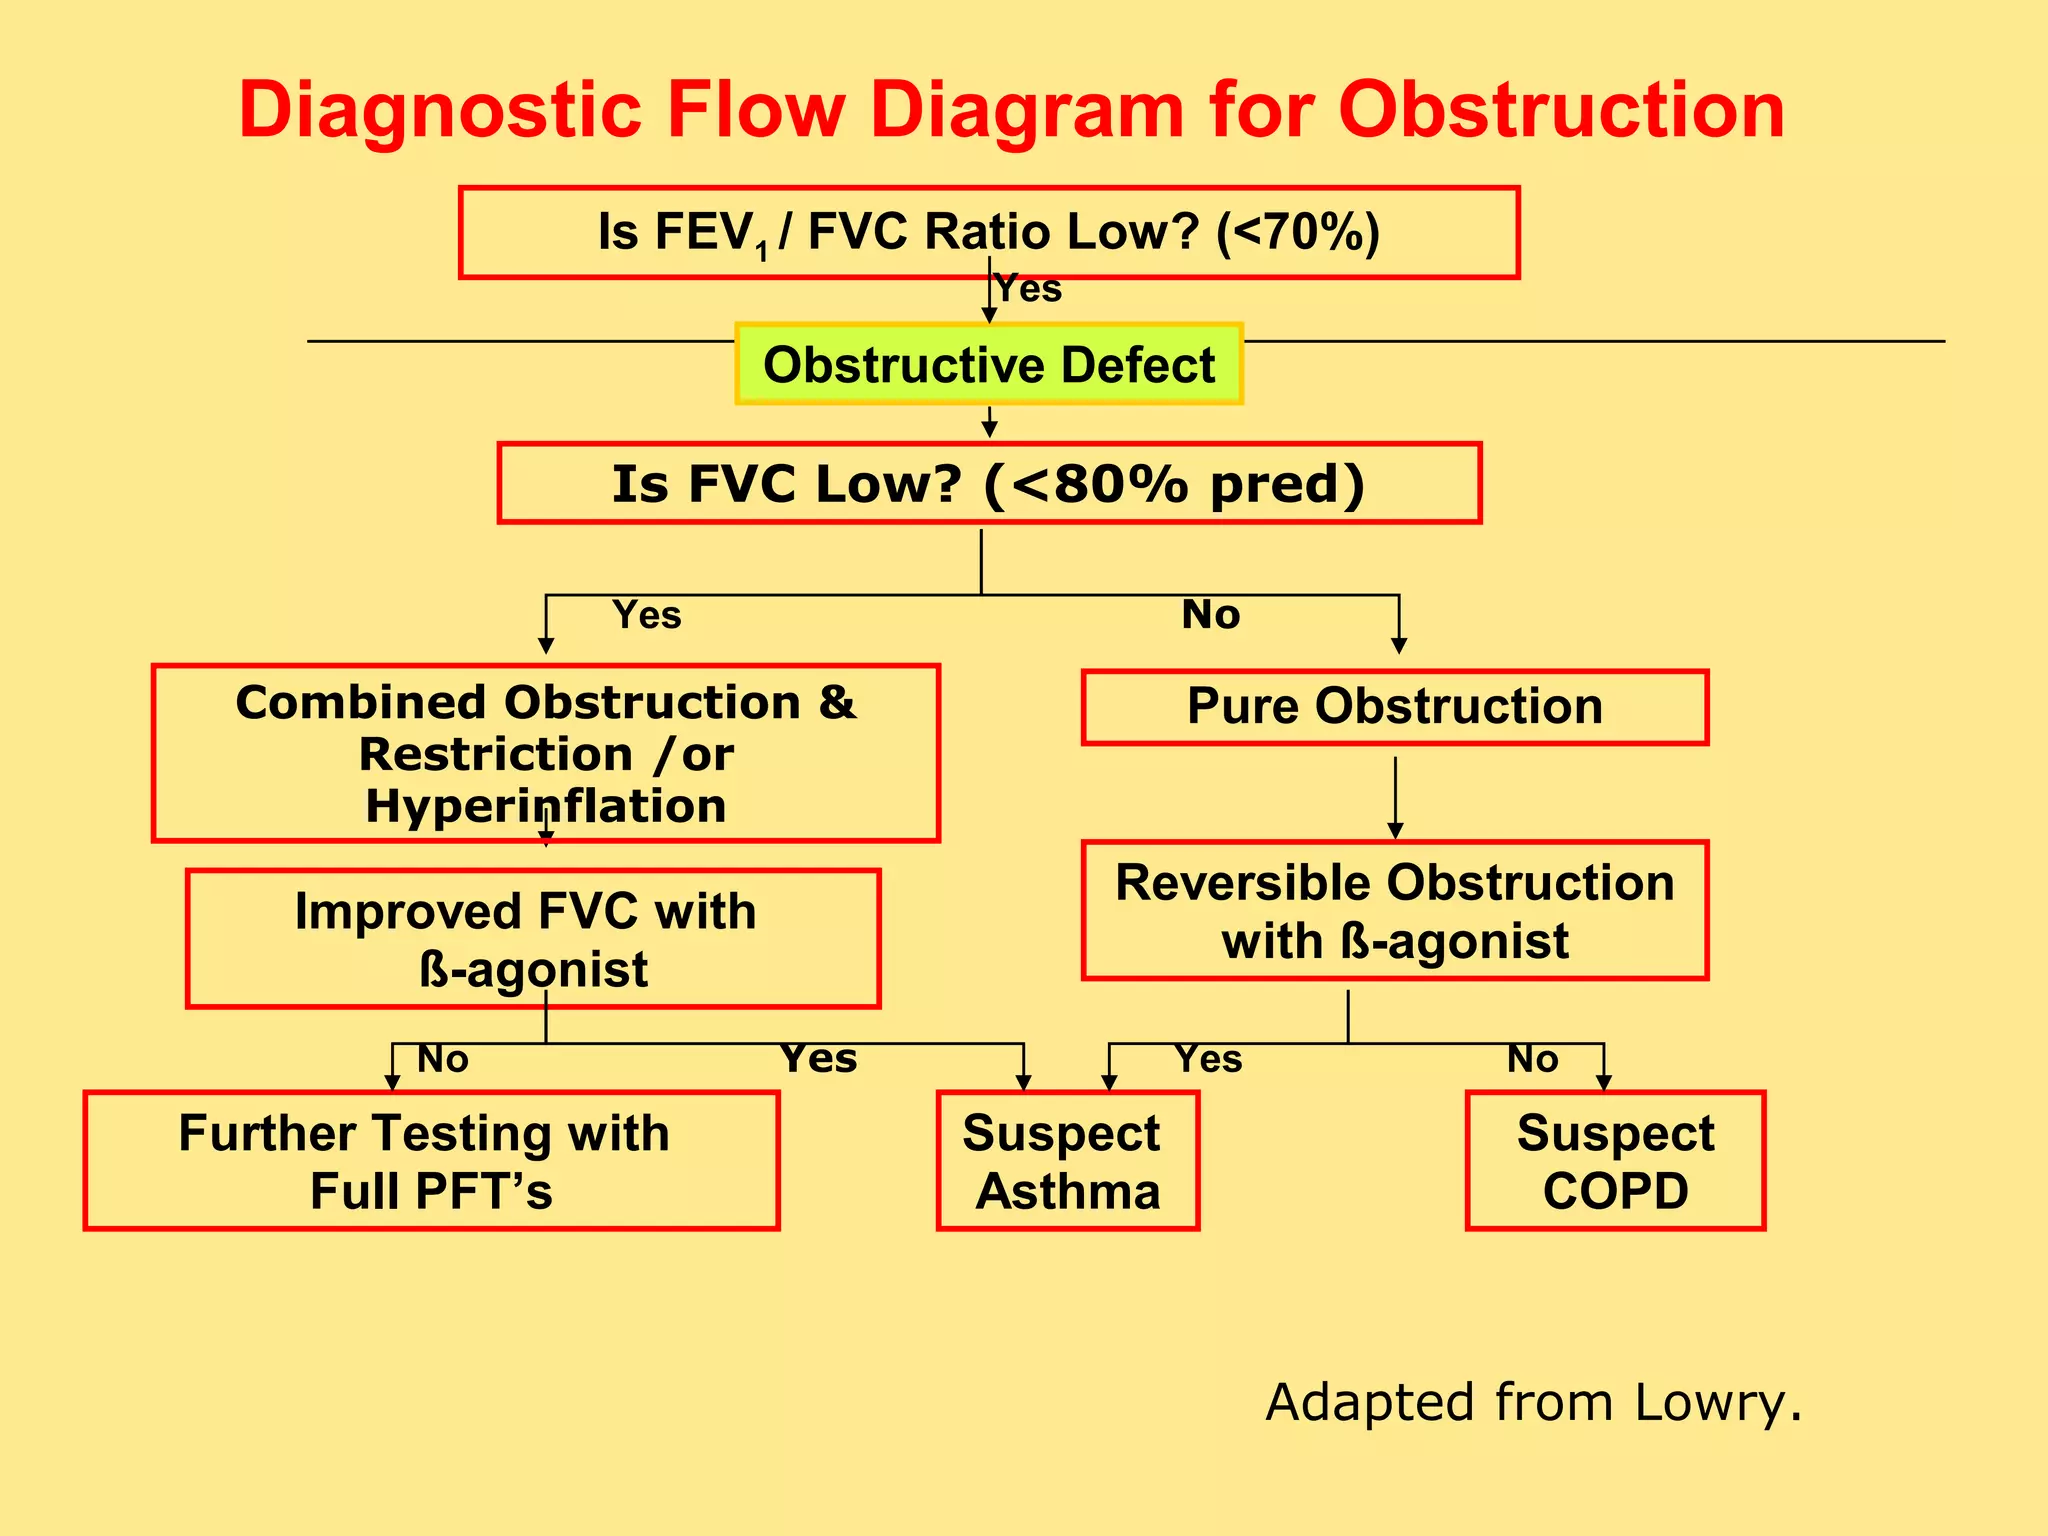
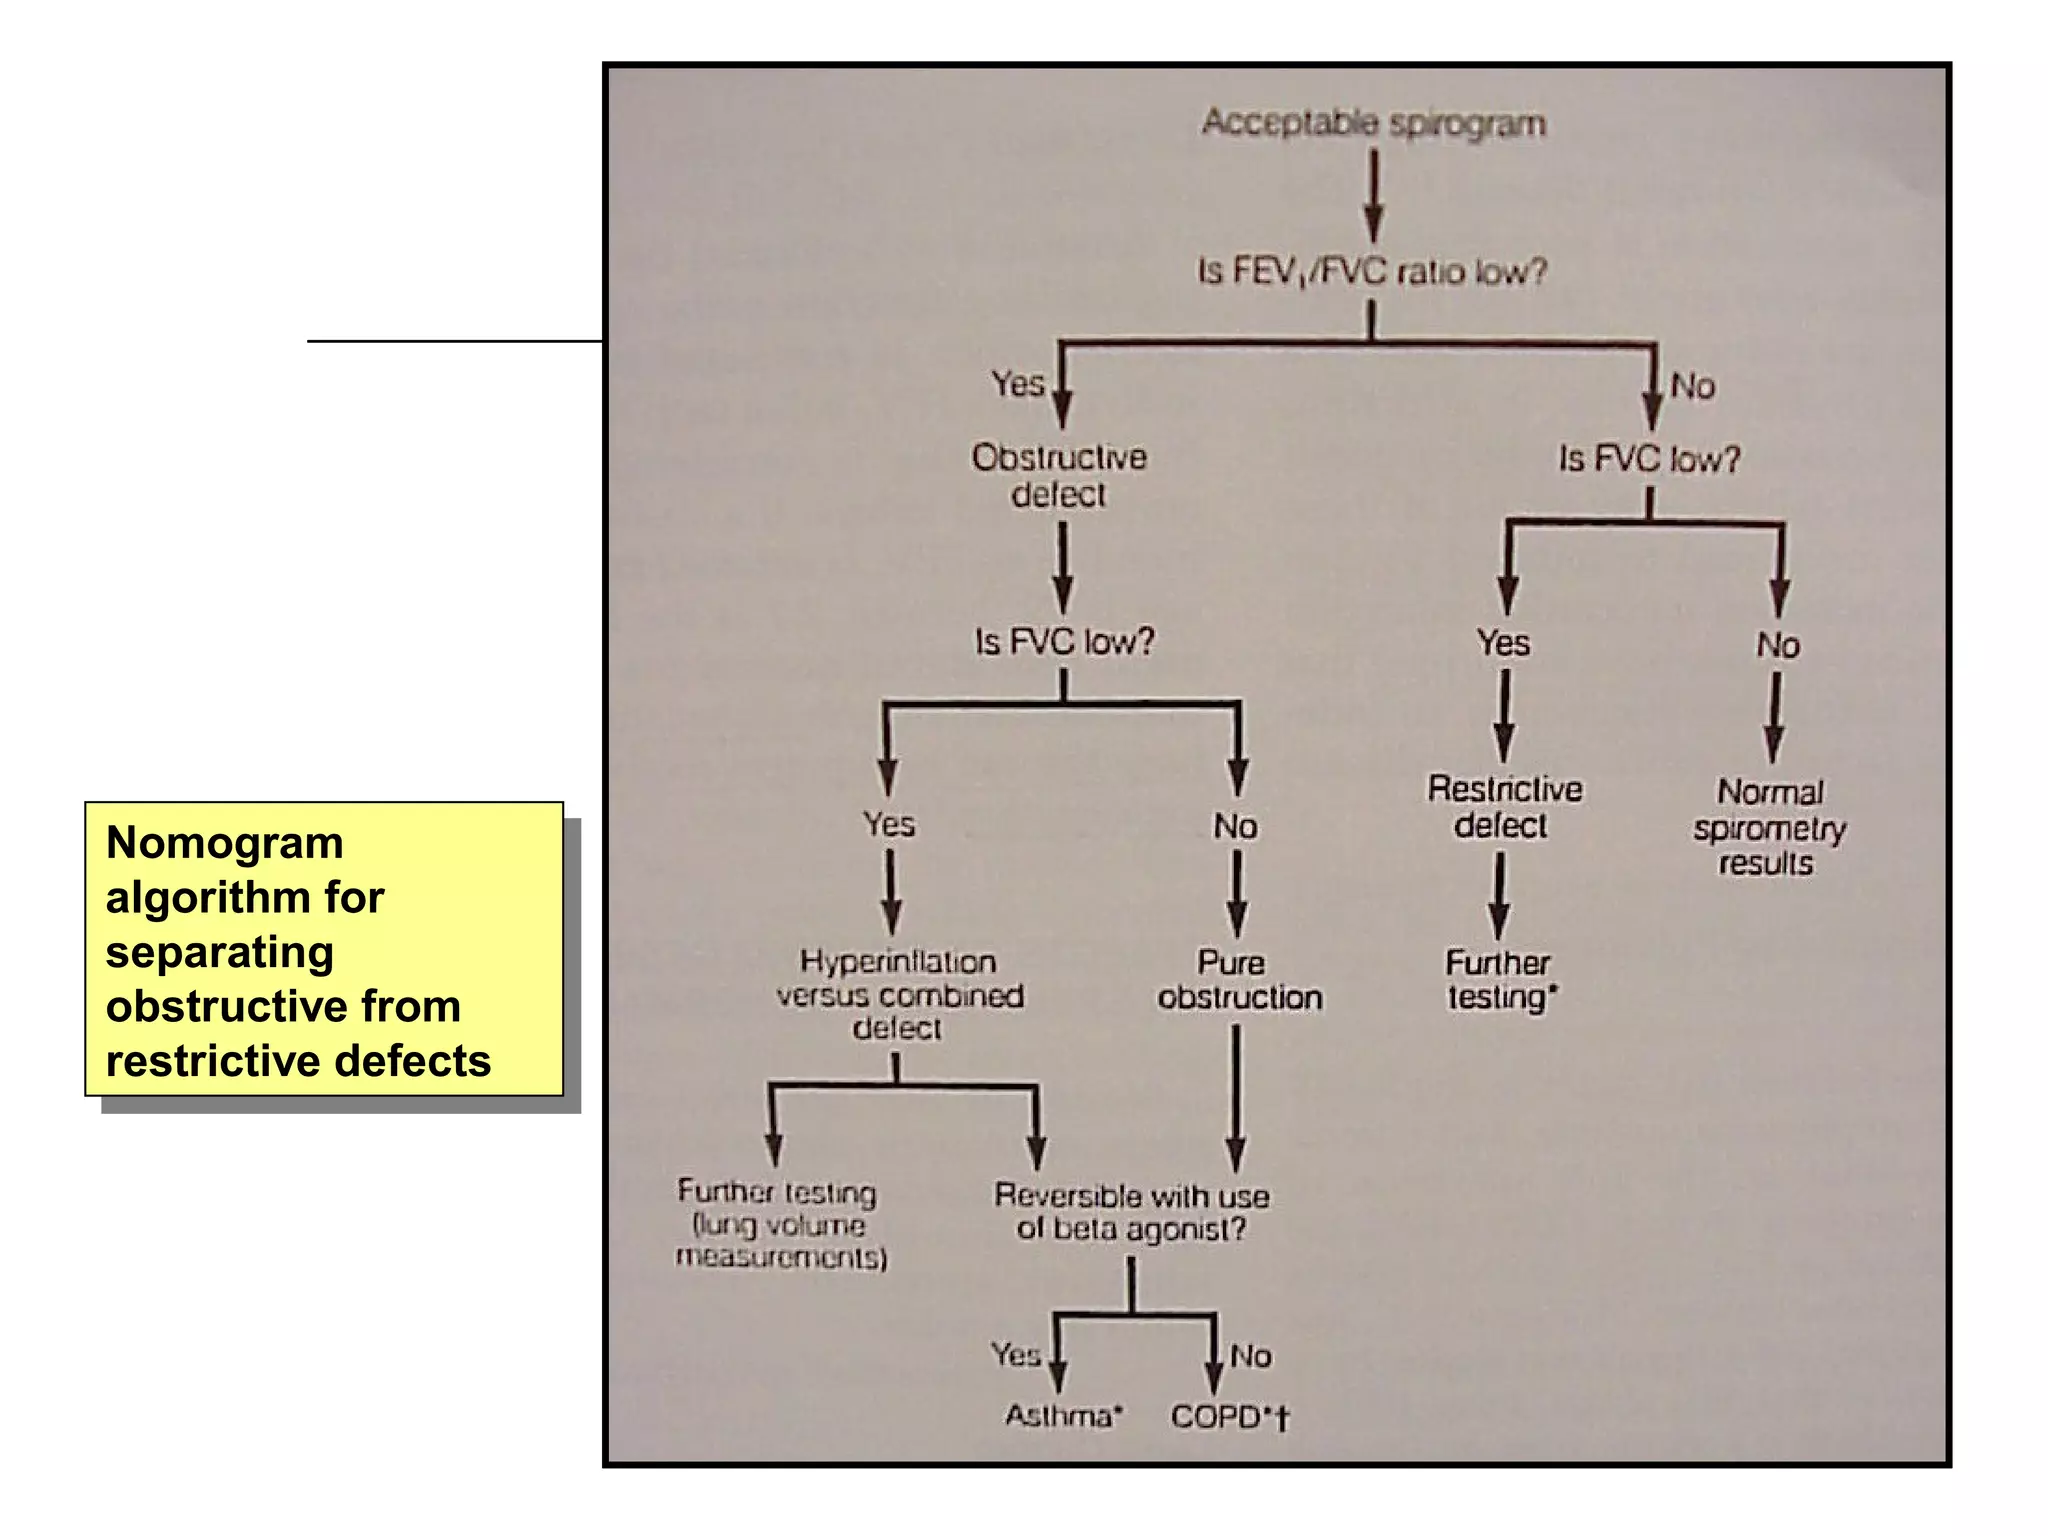
Descriptive patterns: Obstructive (reduced FEV1/FVC), Restrictive (normal FEV1/FVC).
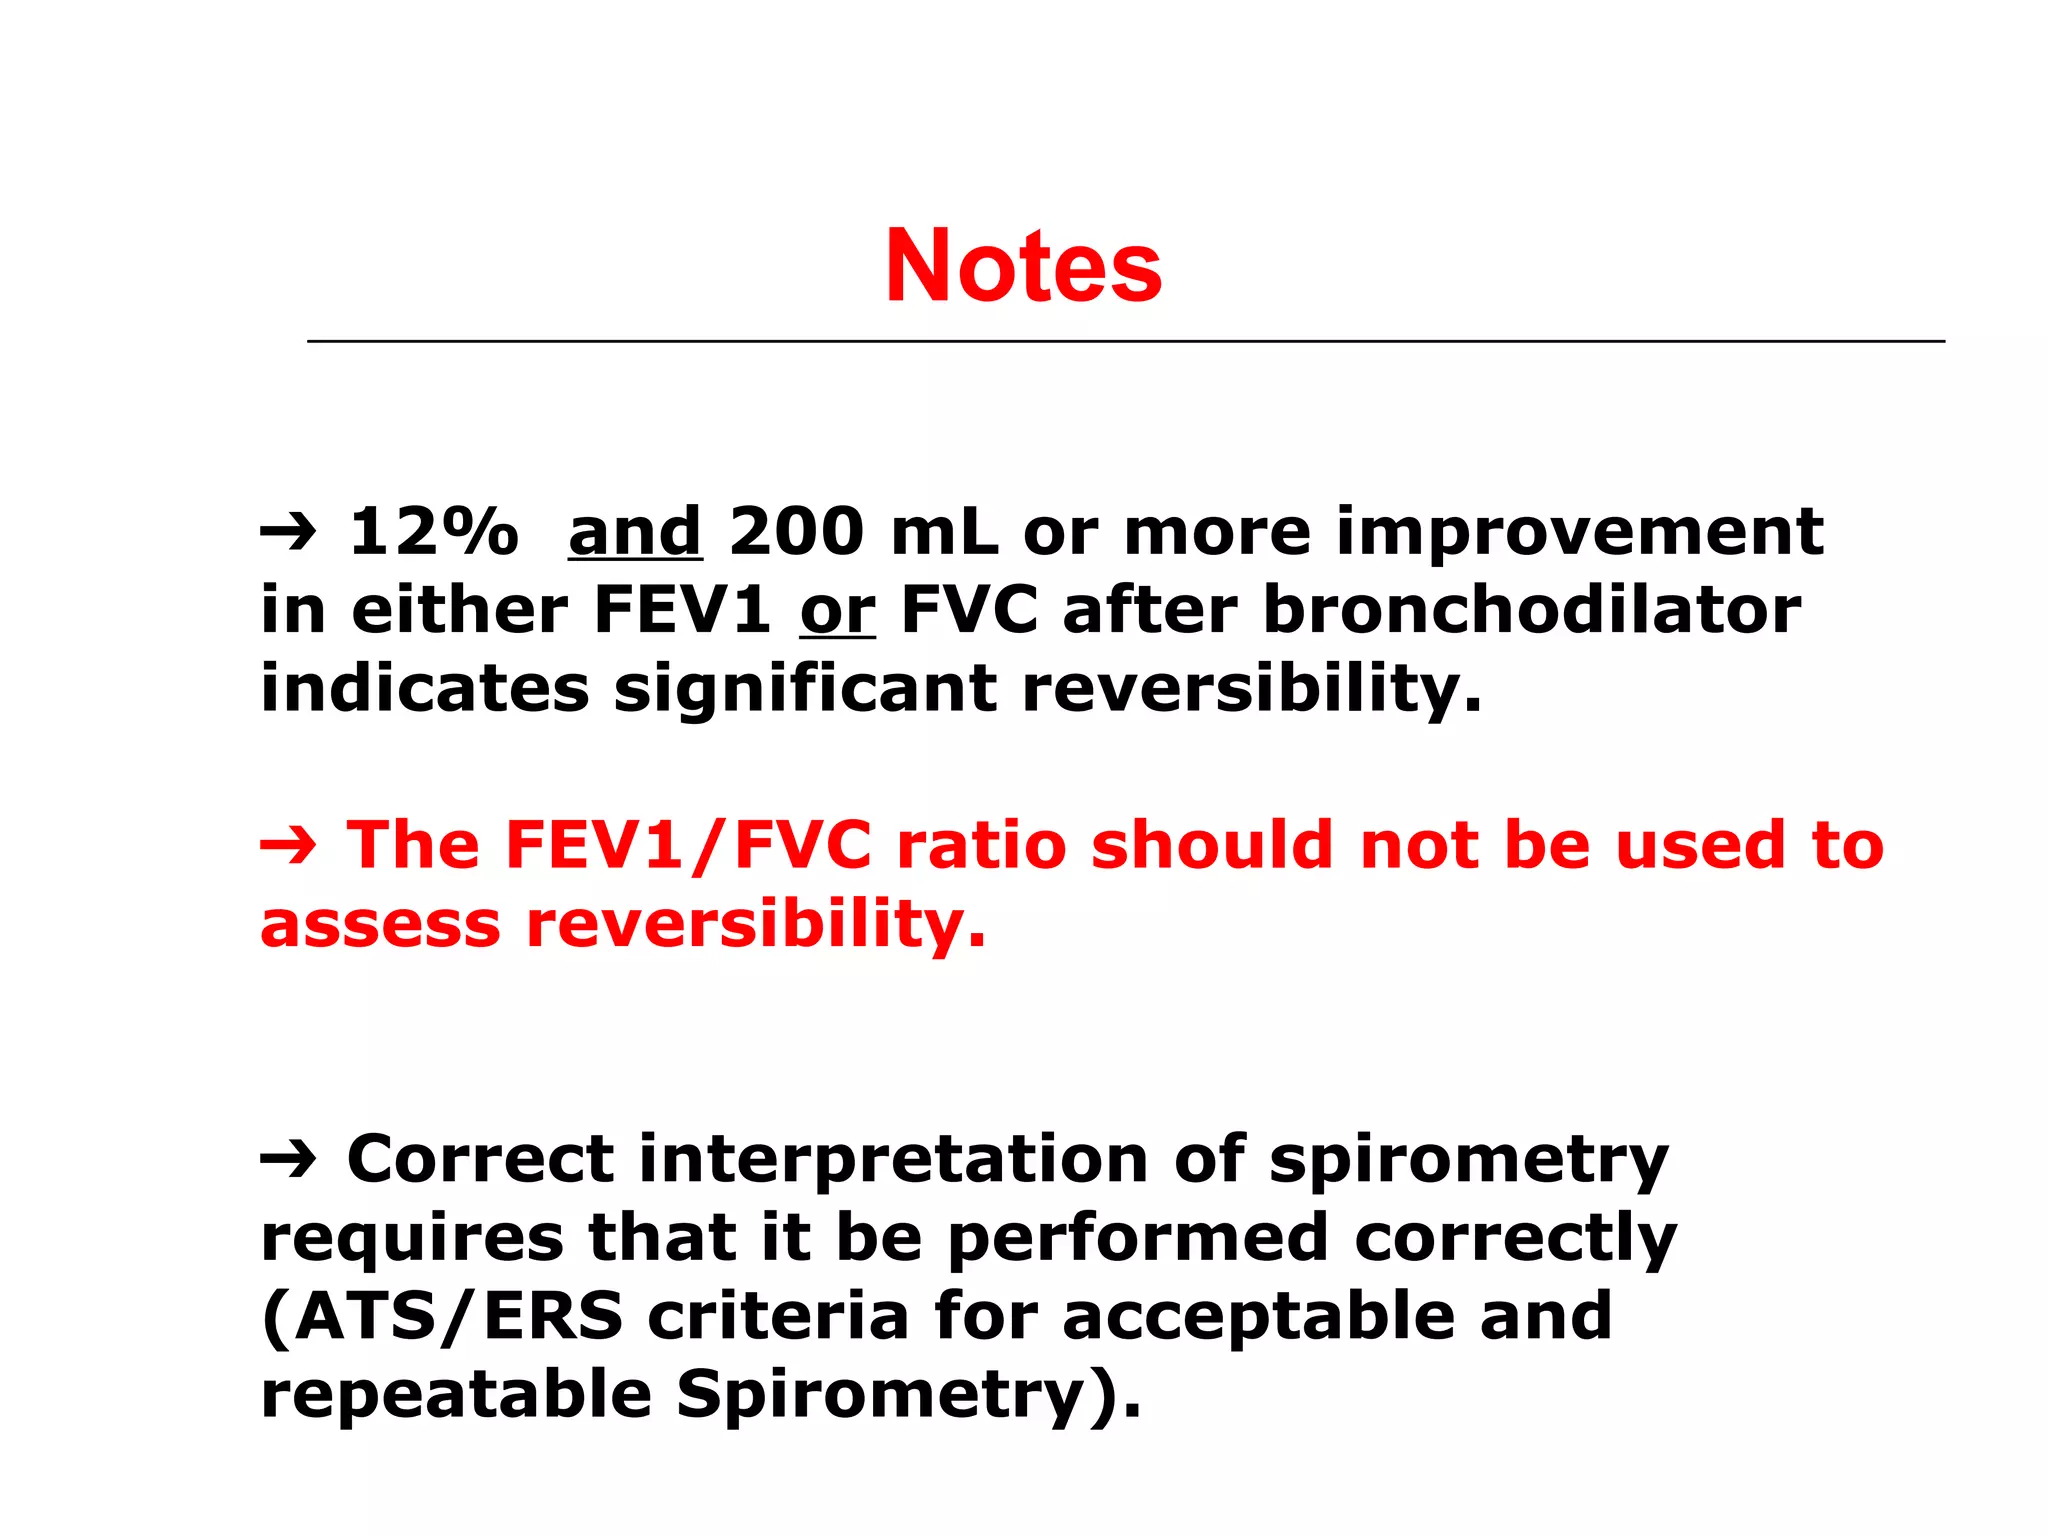
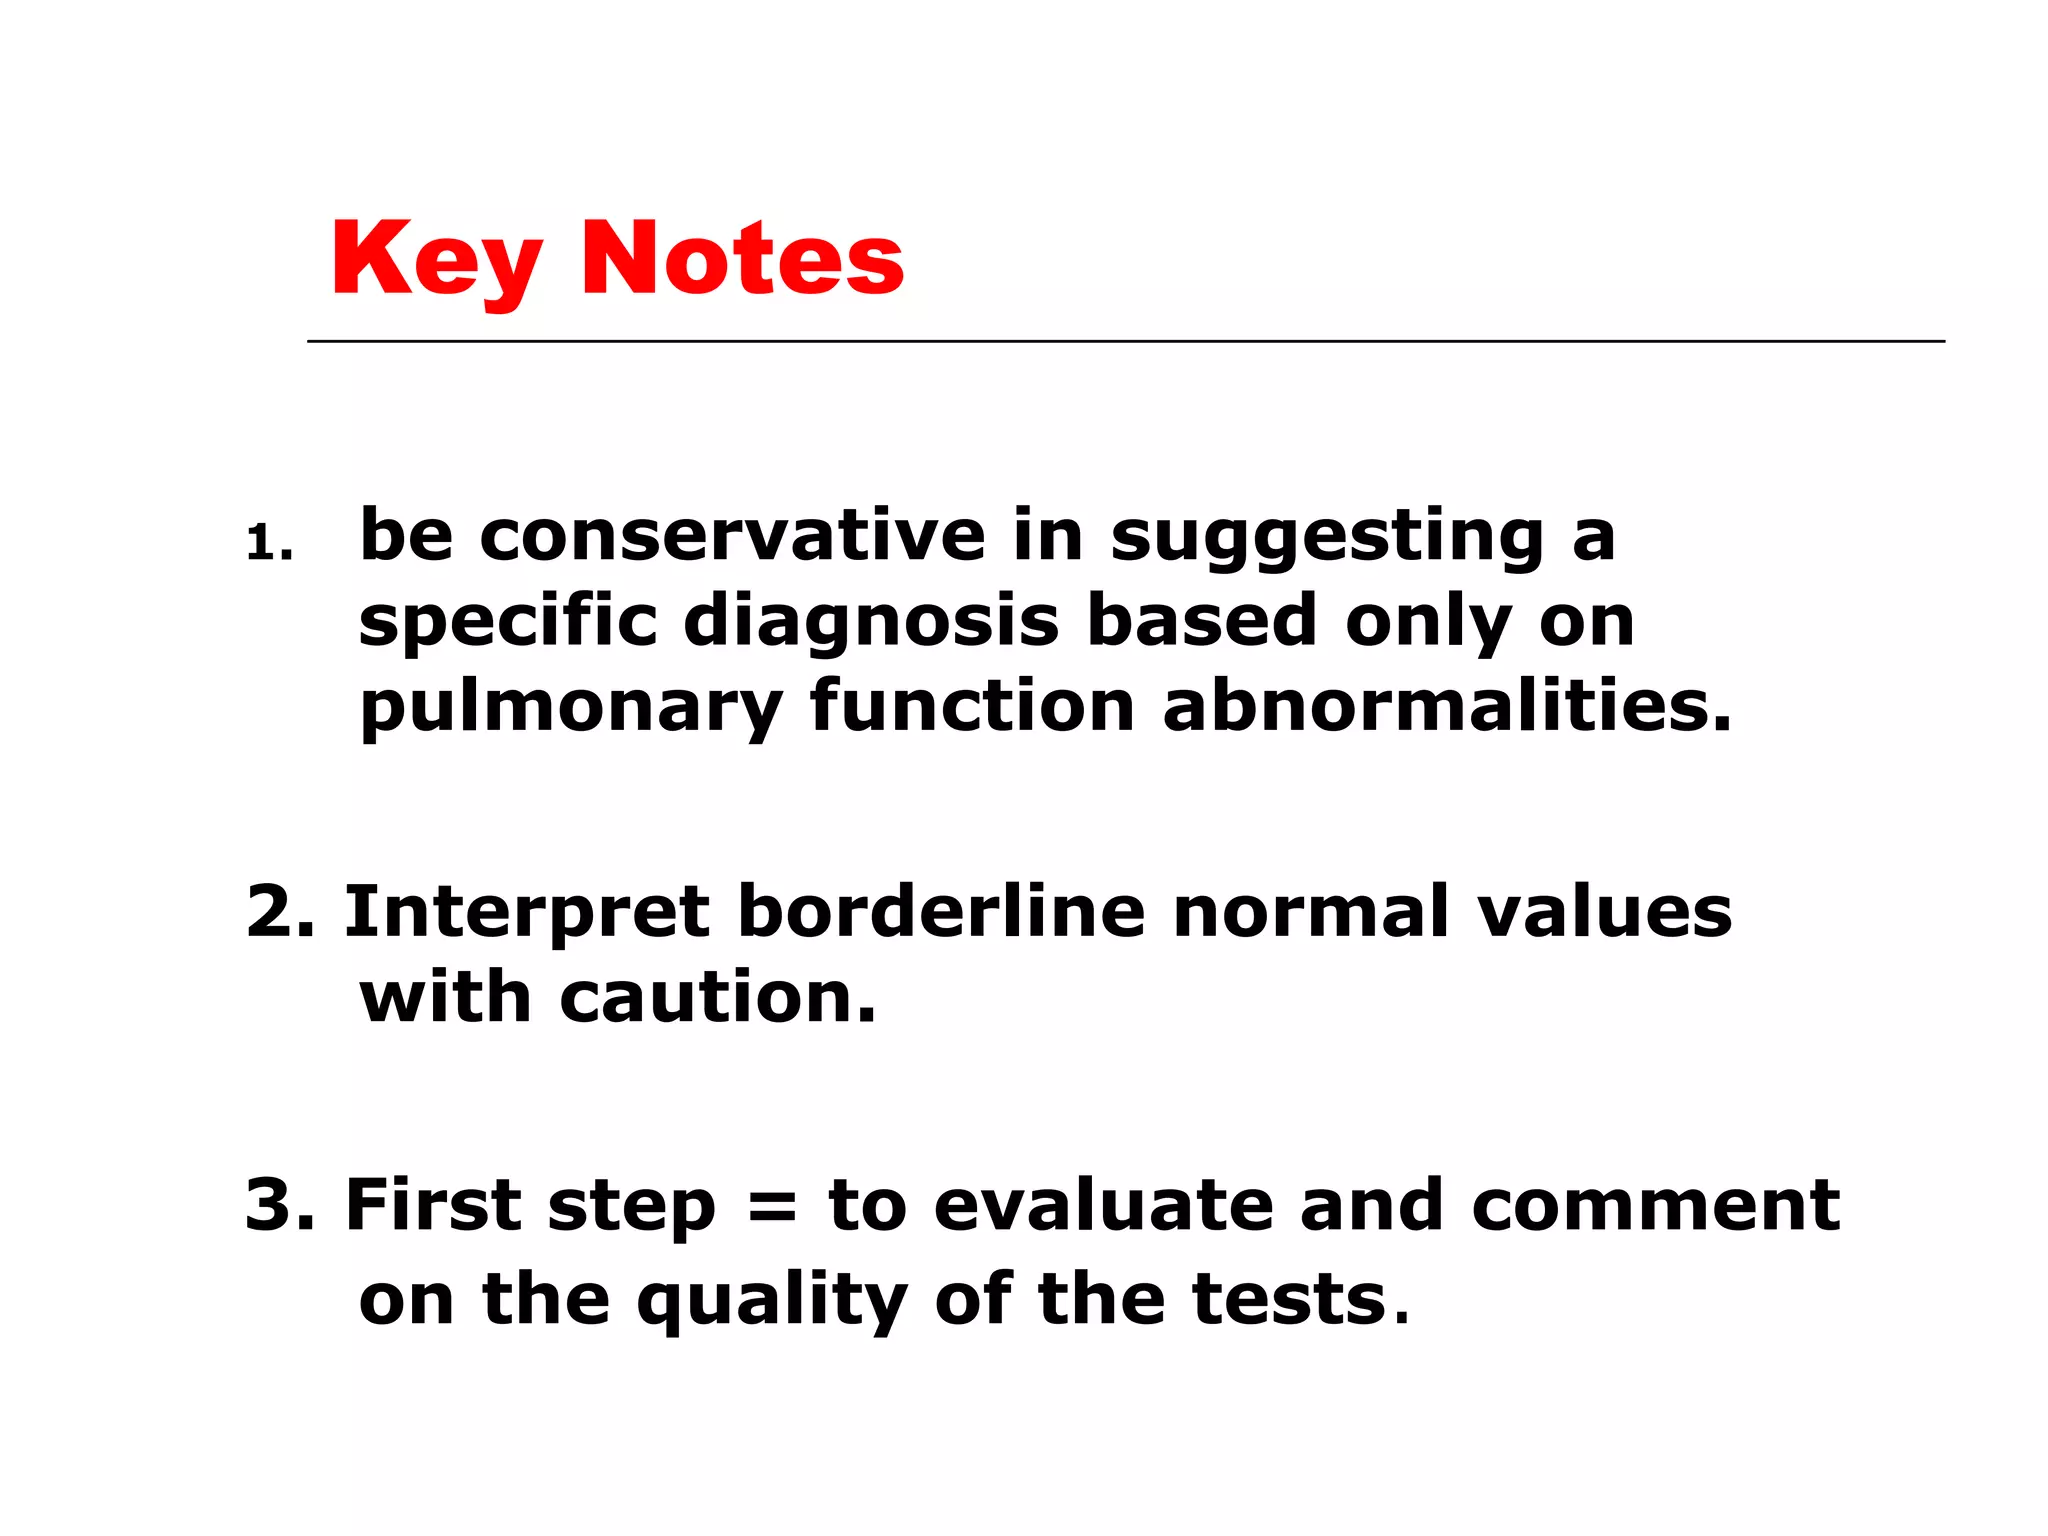
Conditions for accurate interpretation: proper technique, reversibility indication after bronchodilator.
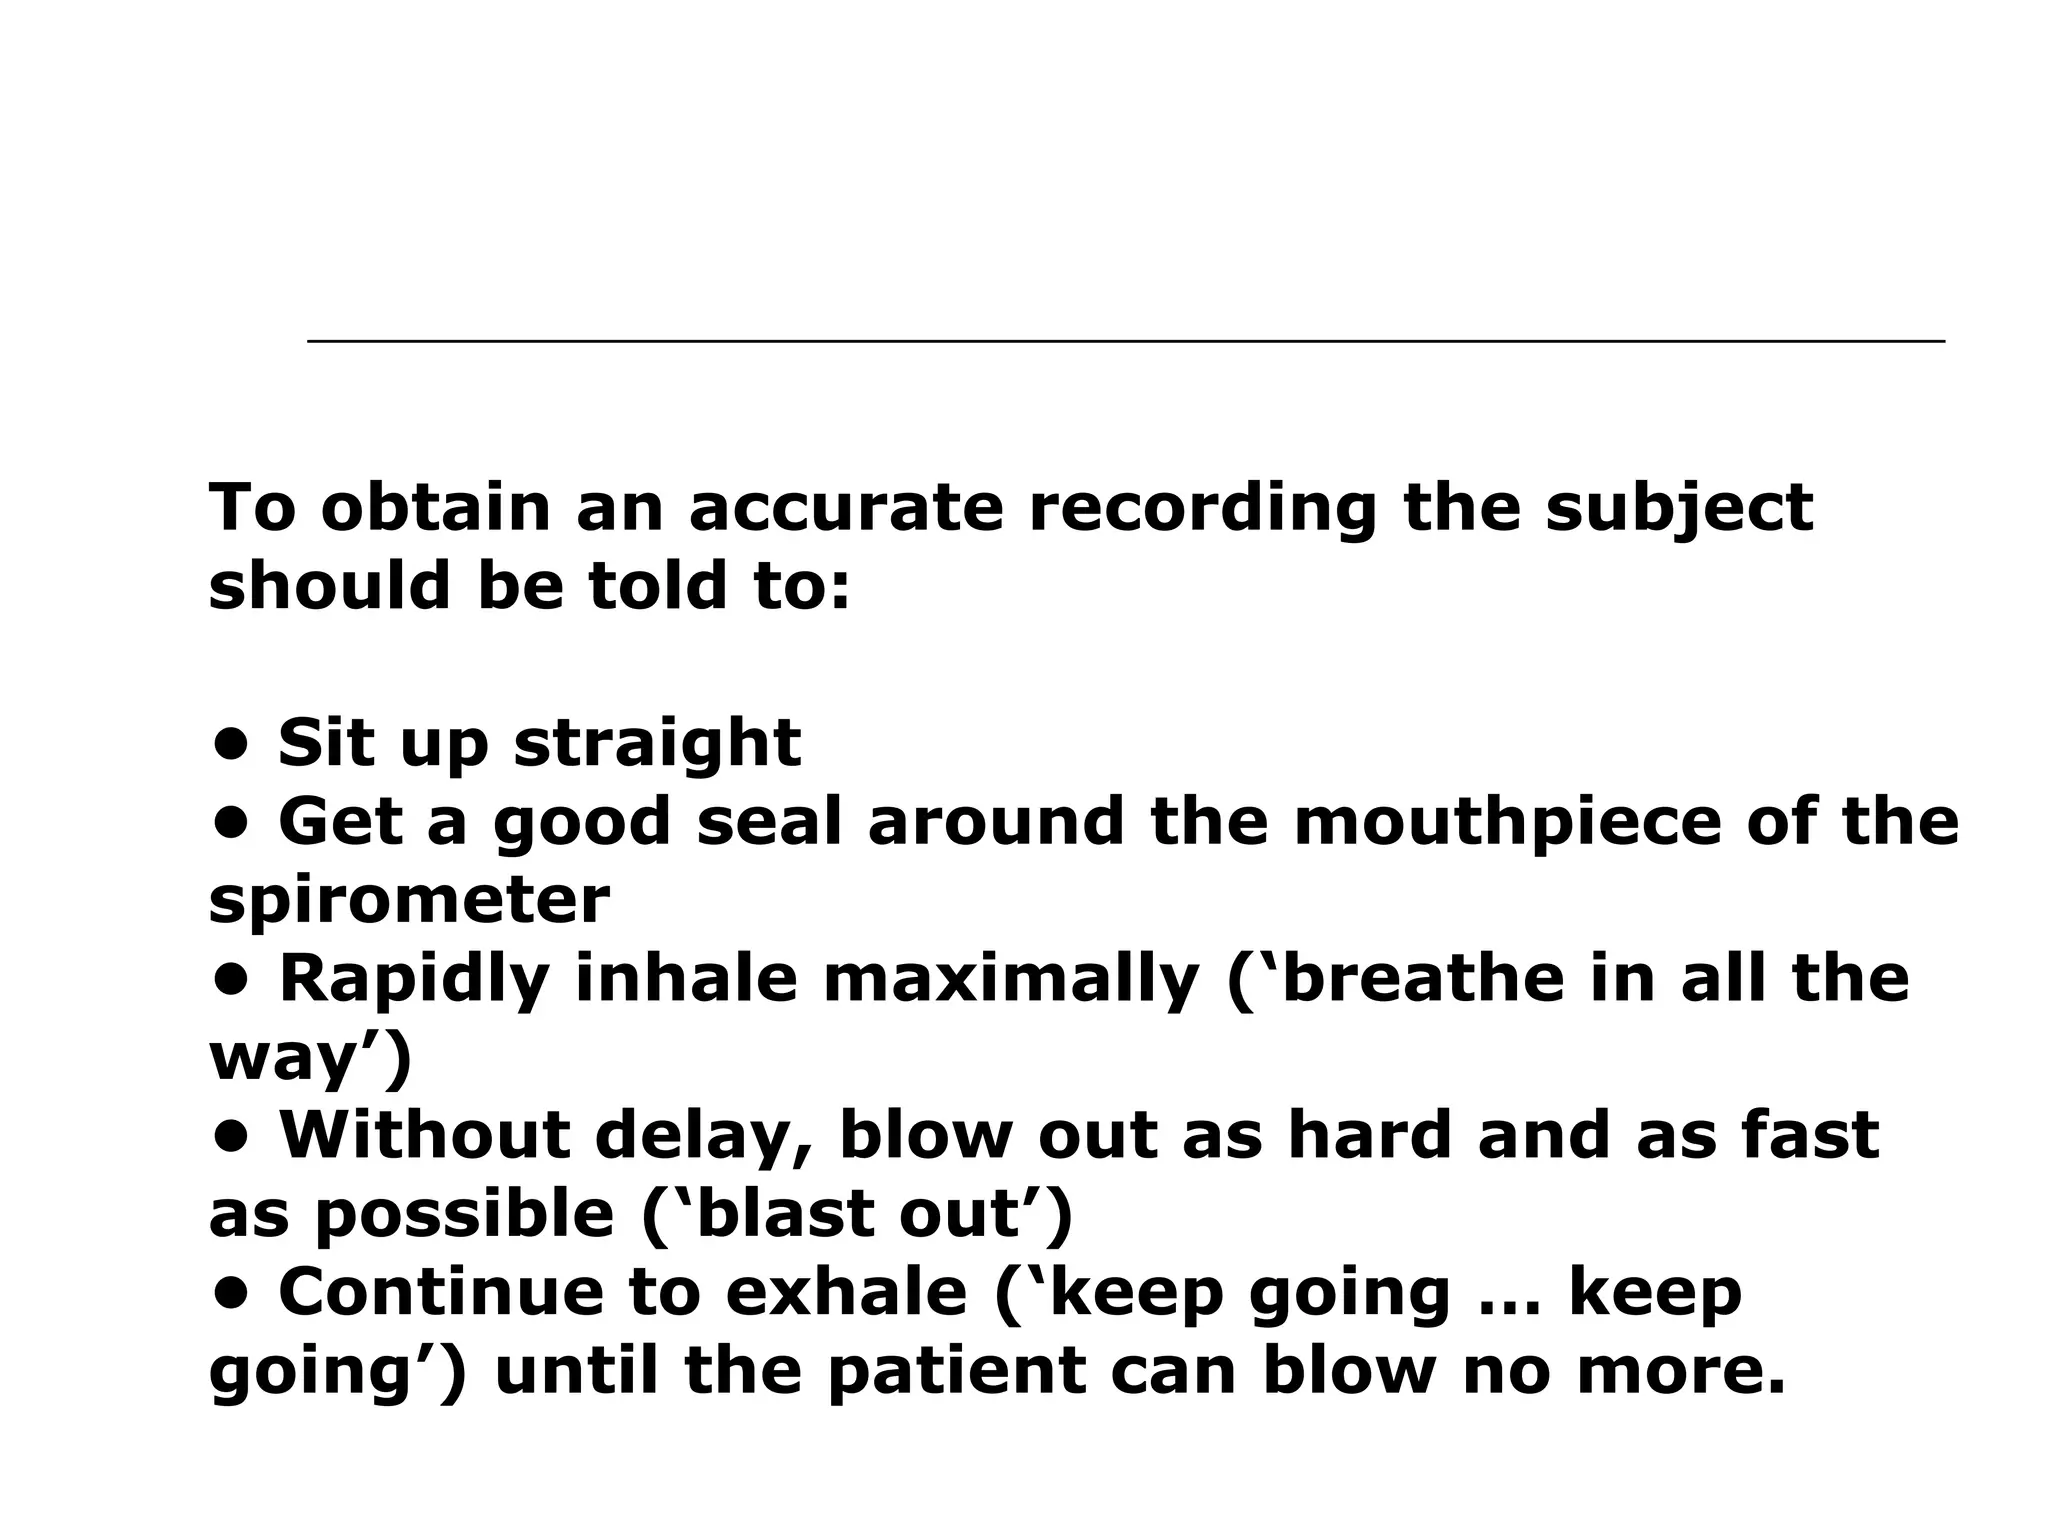
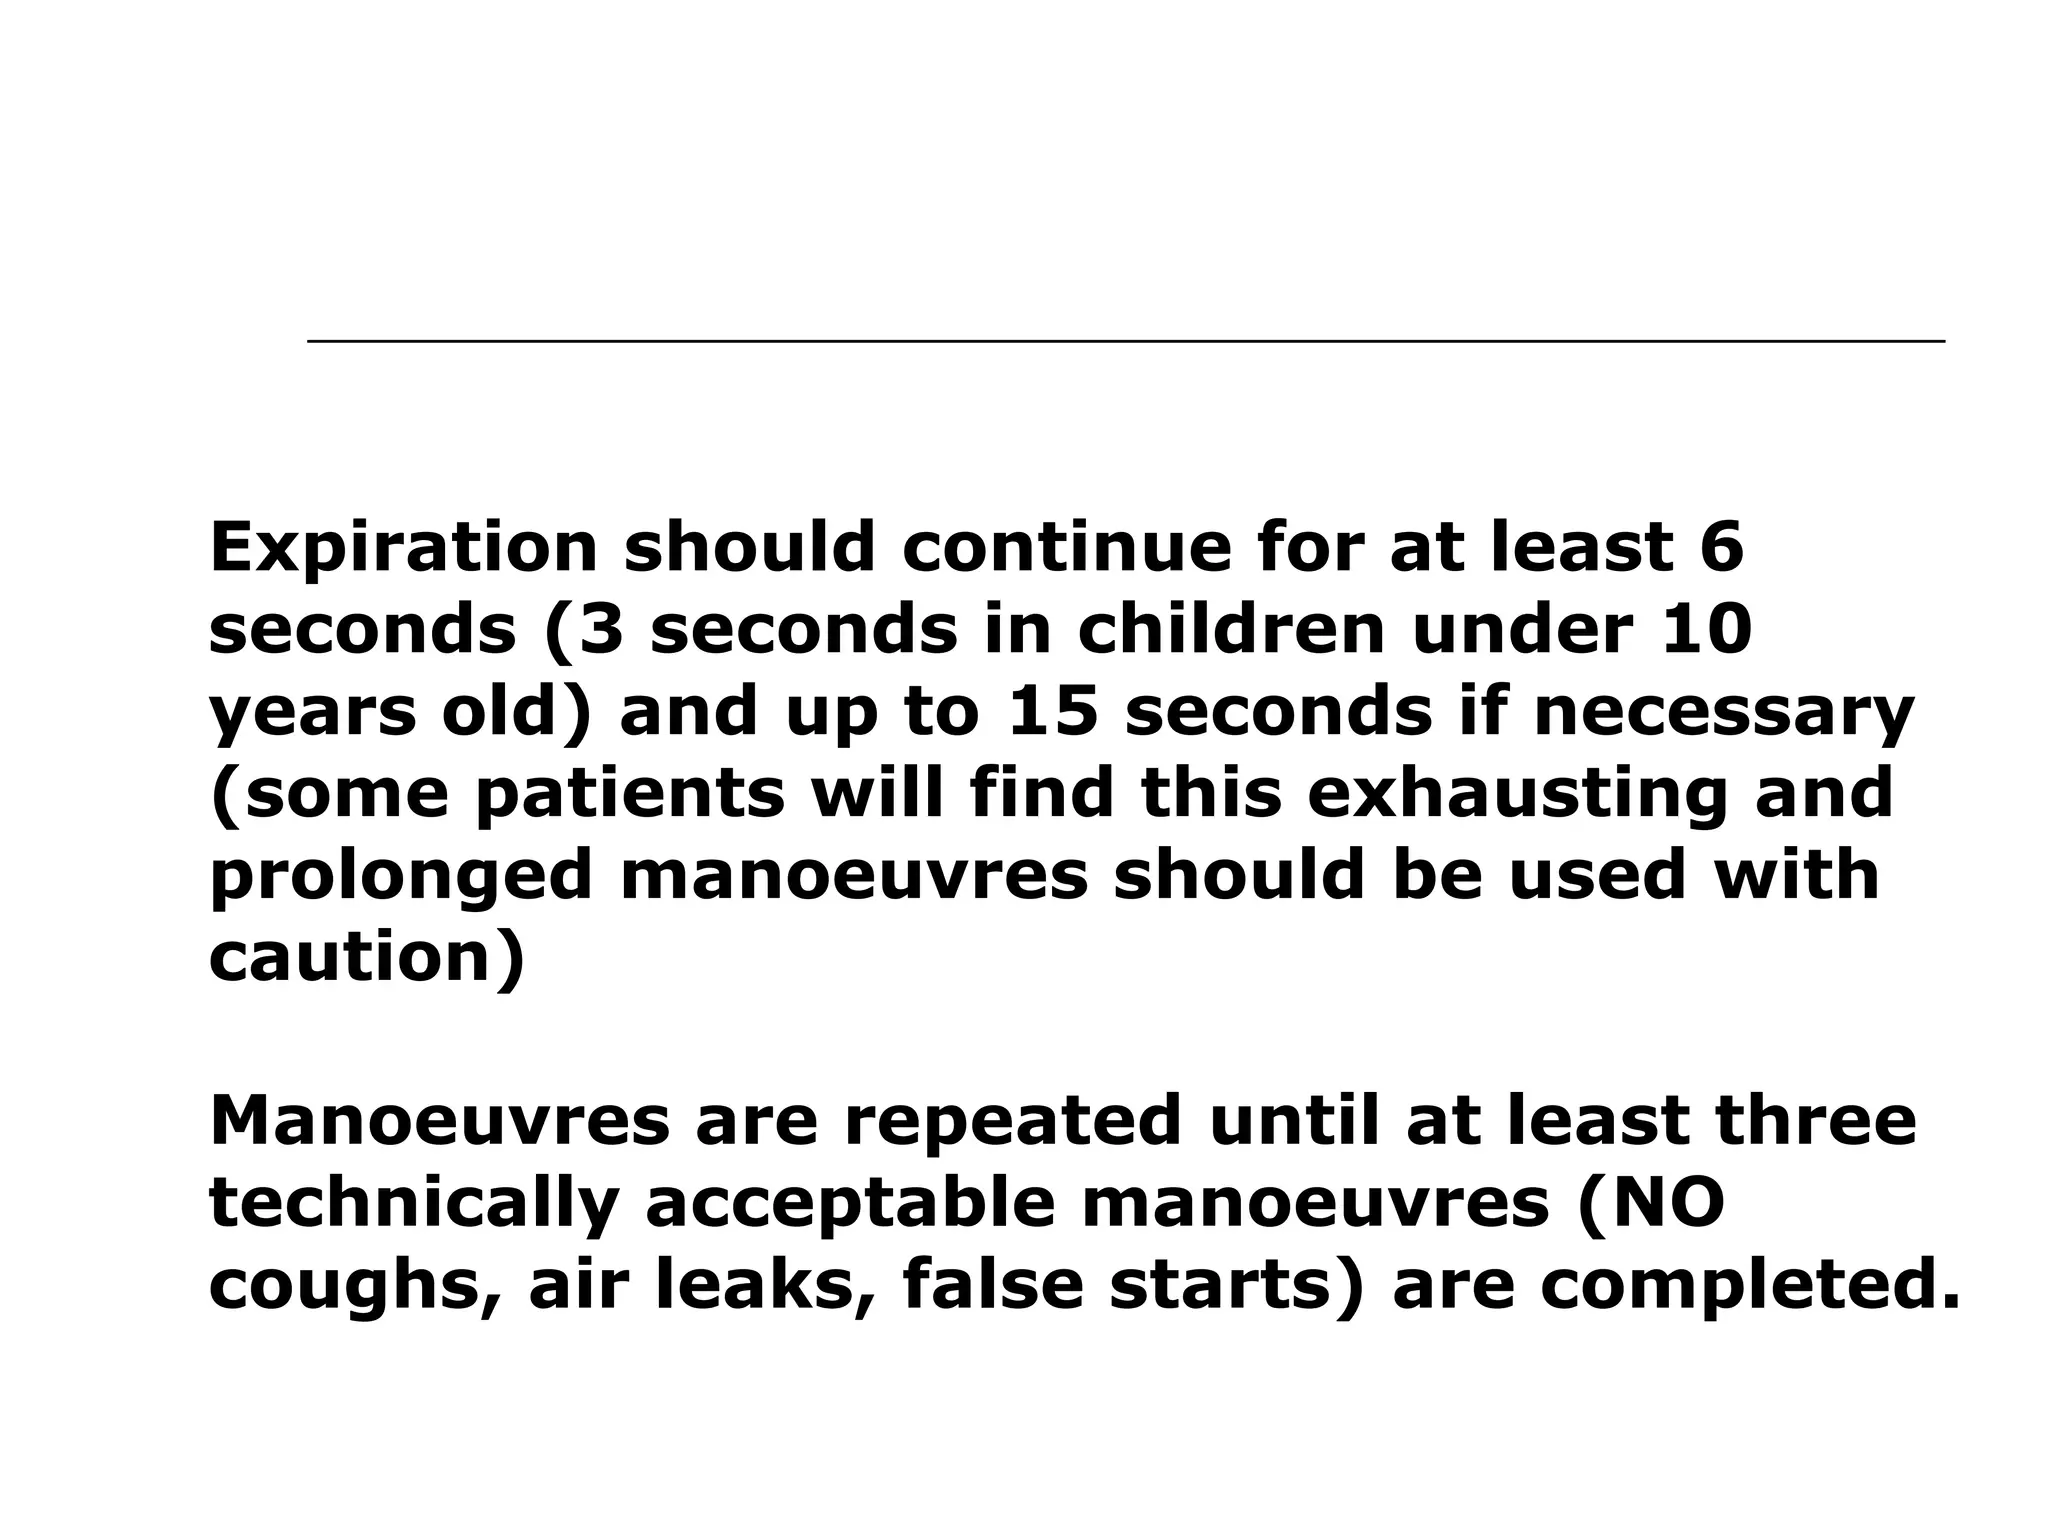
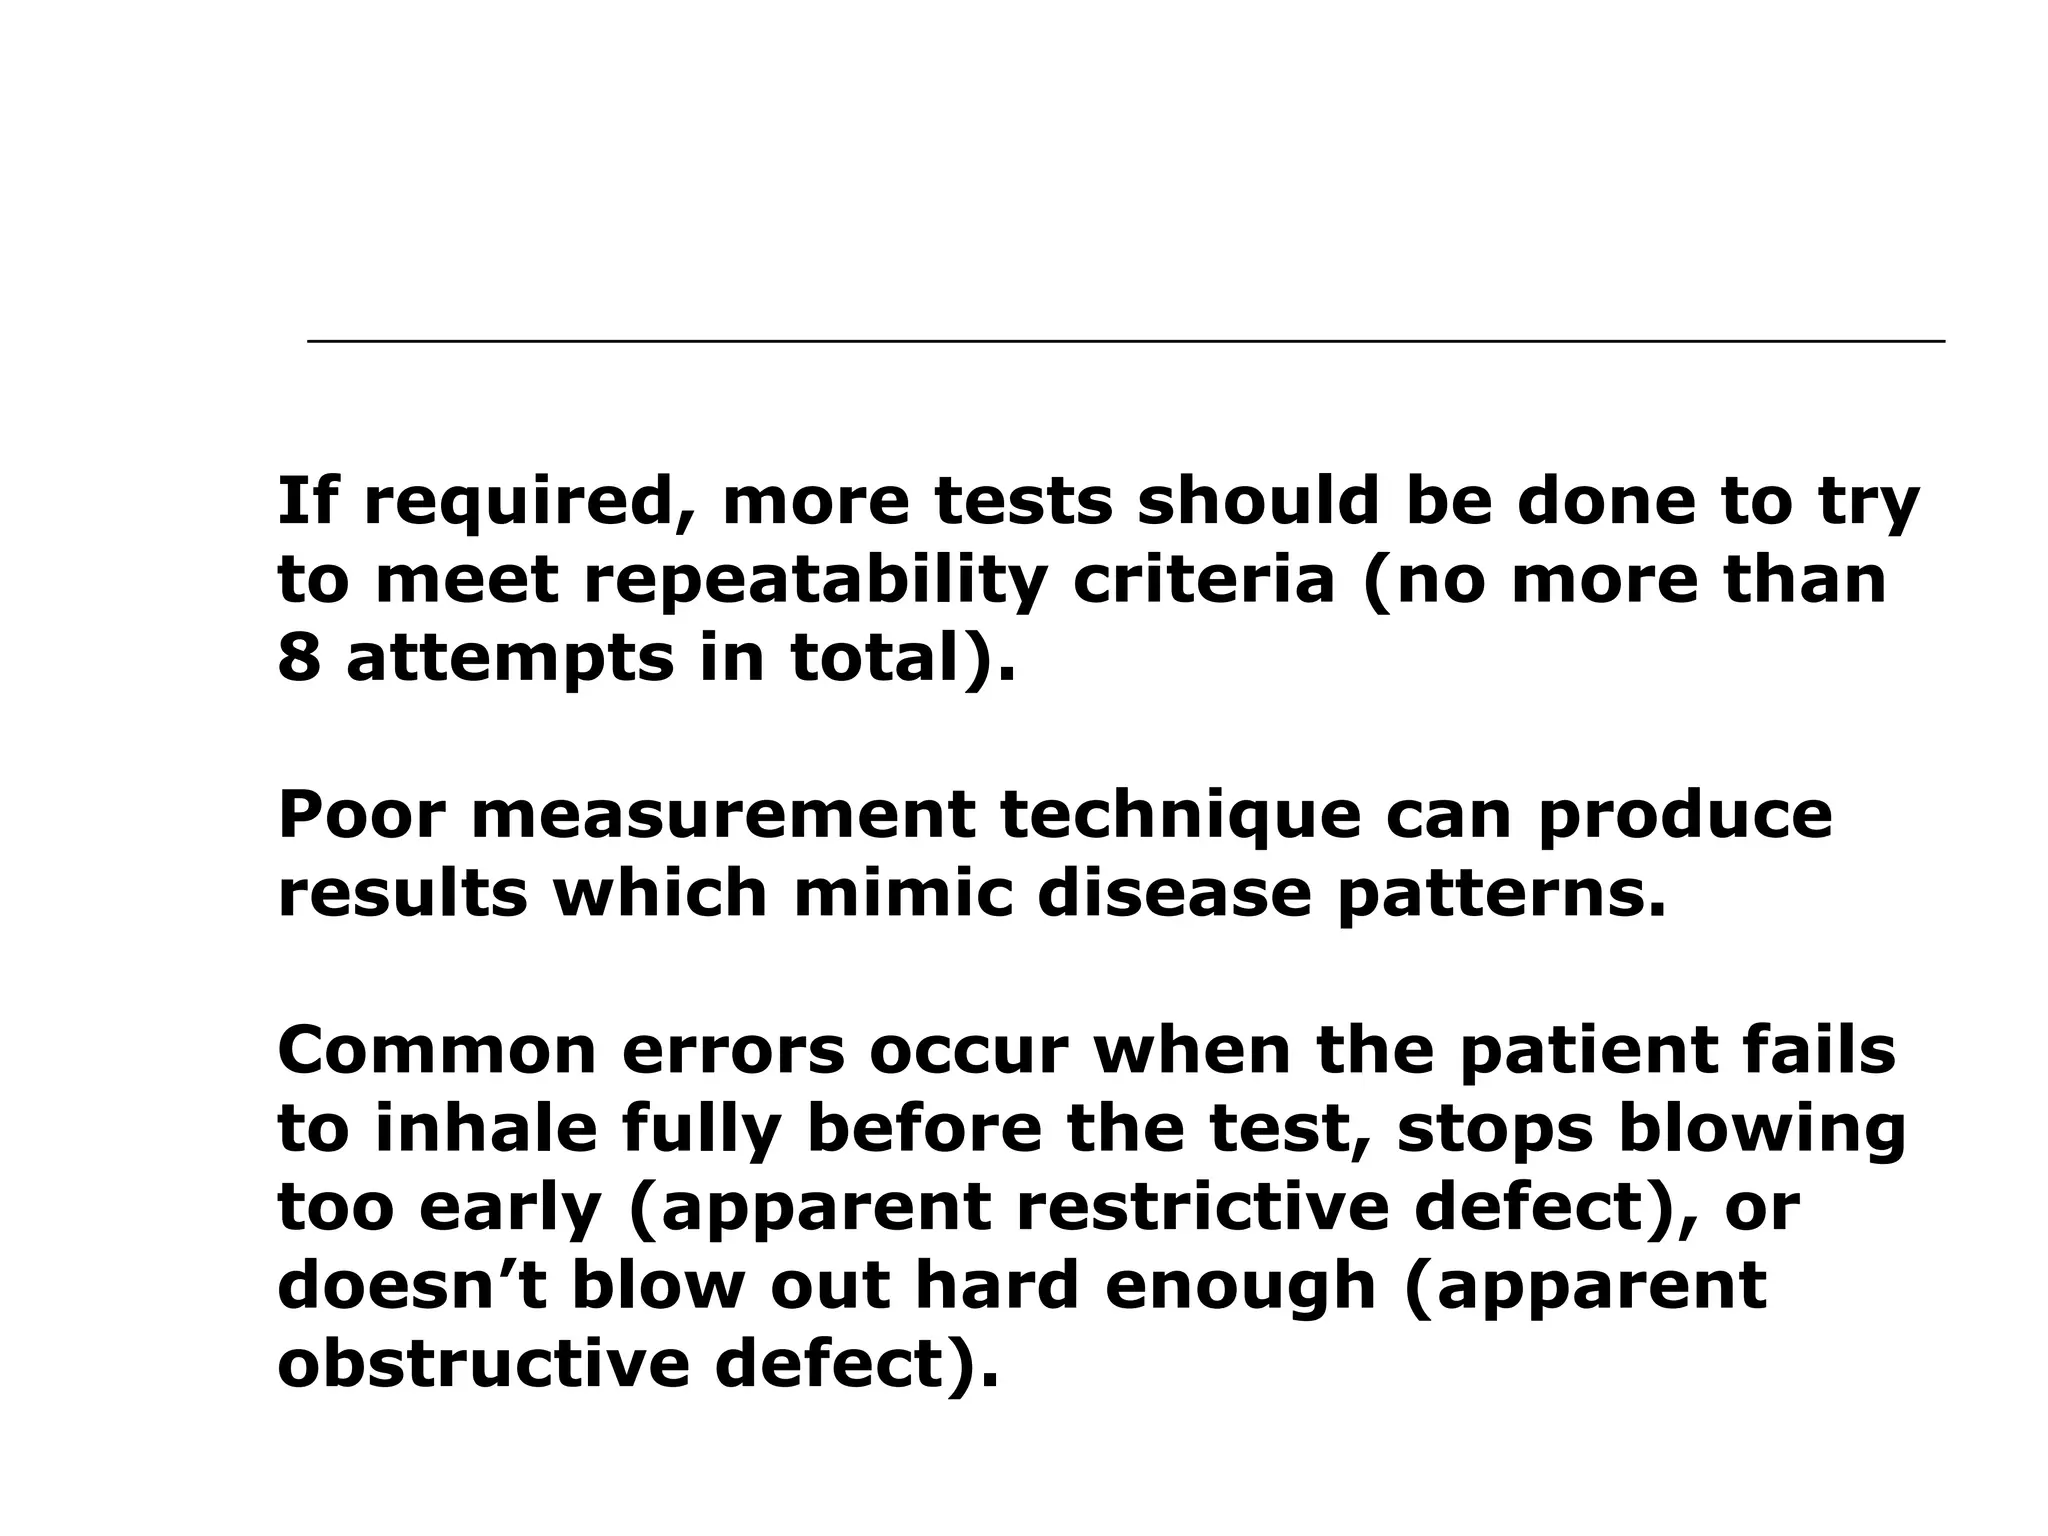
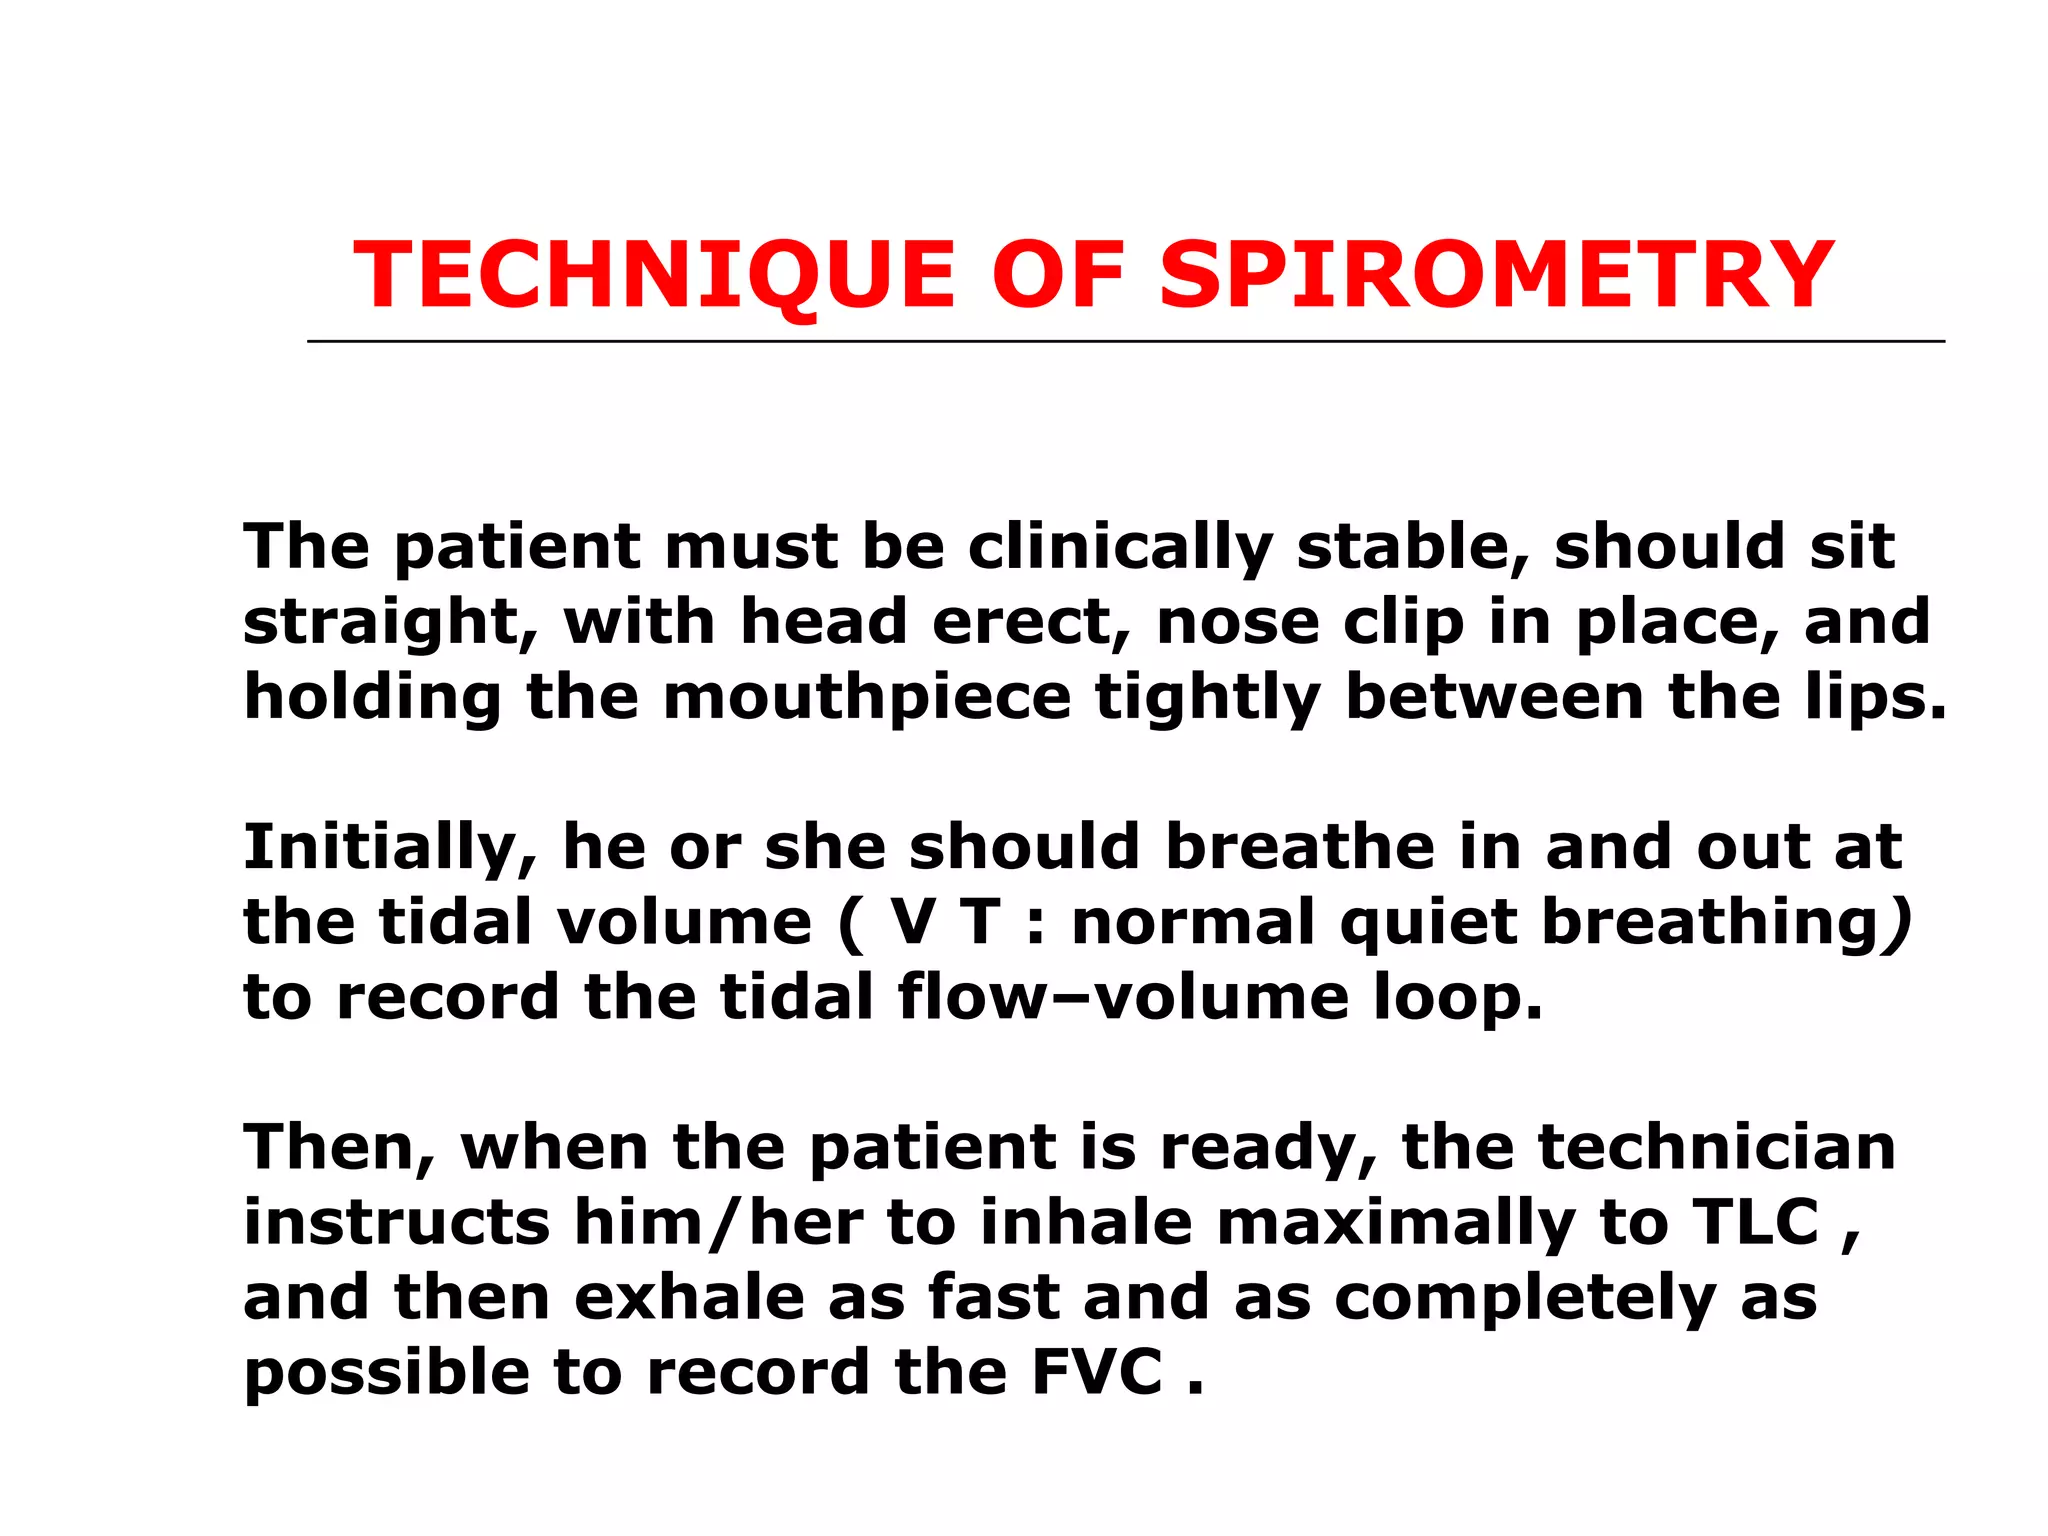
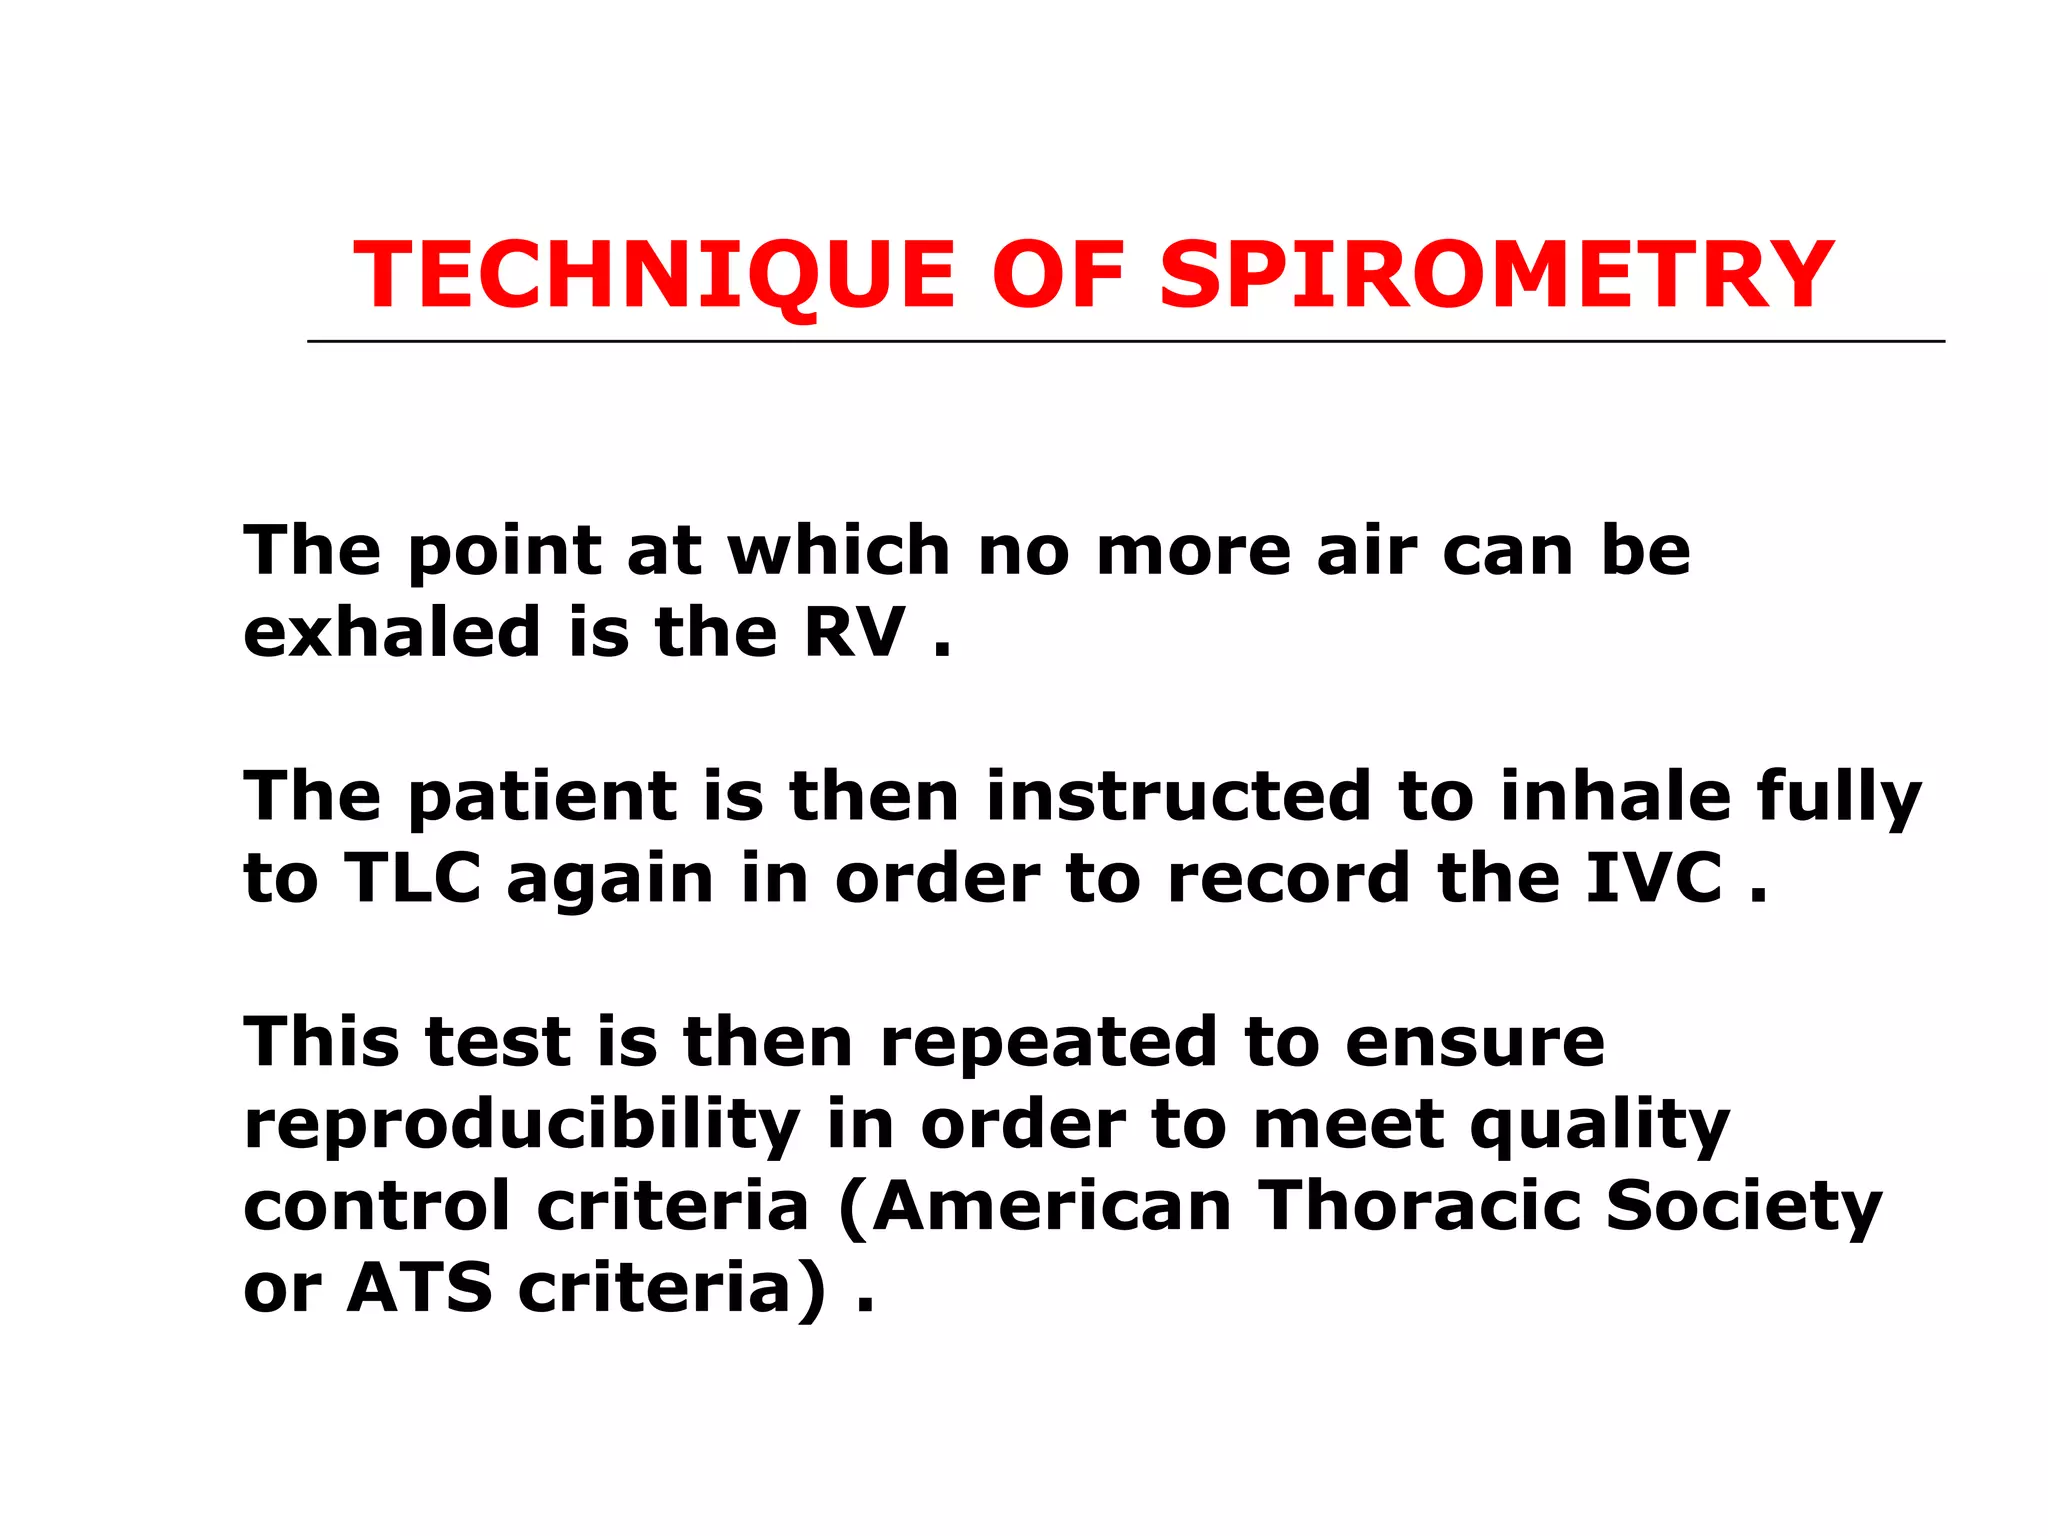
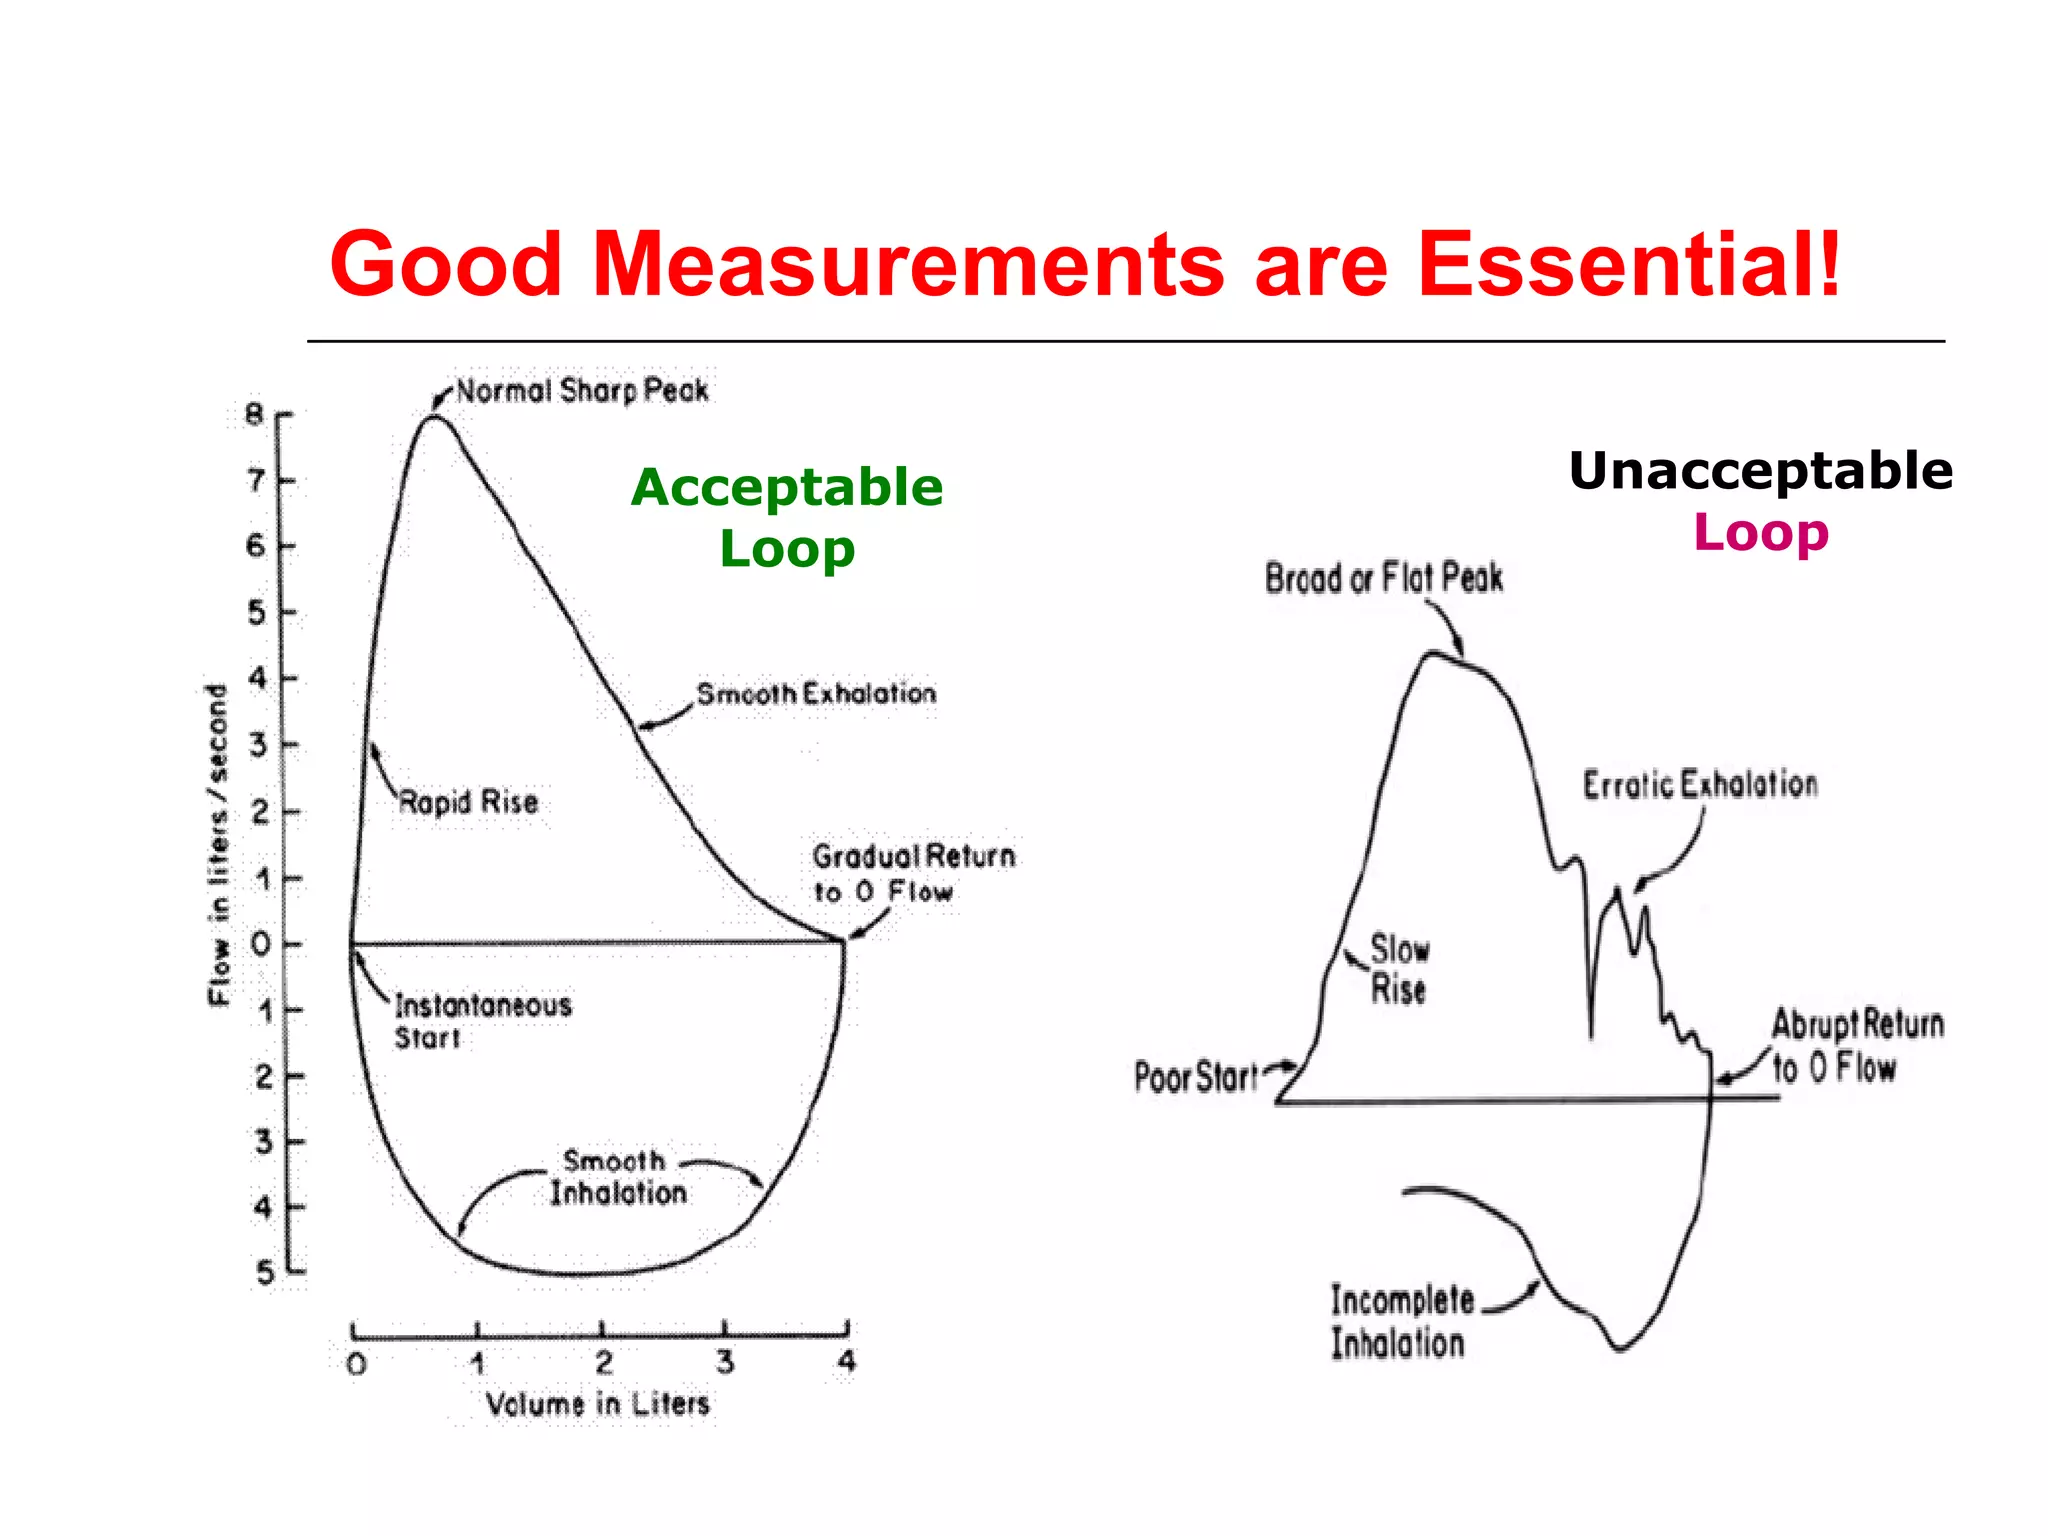
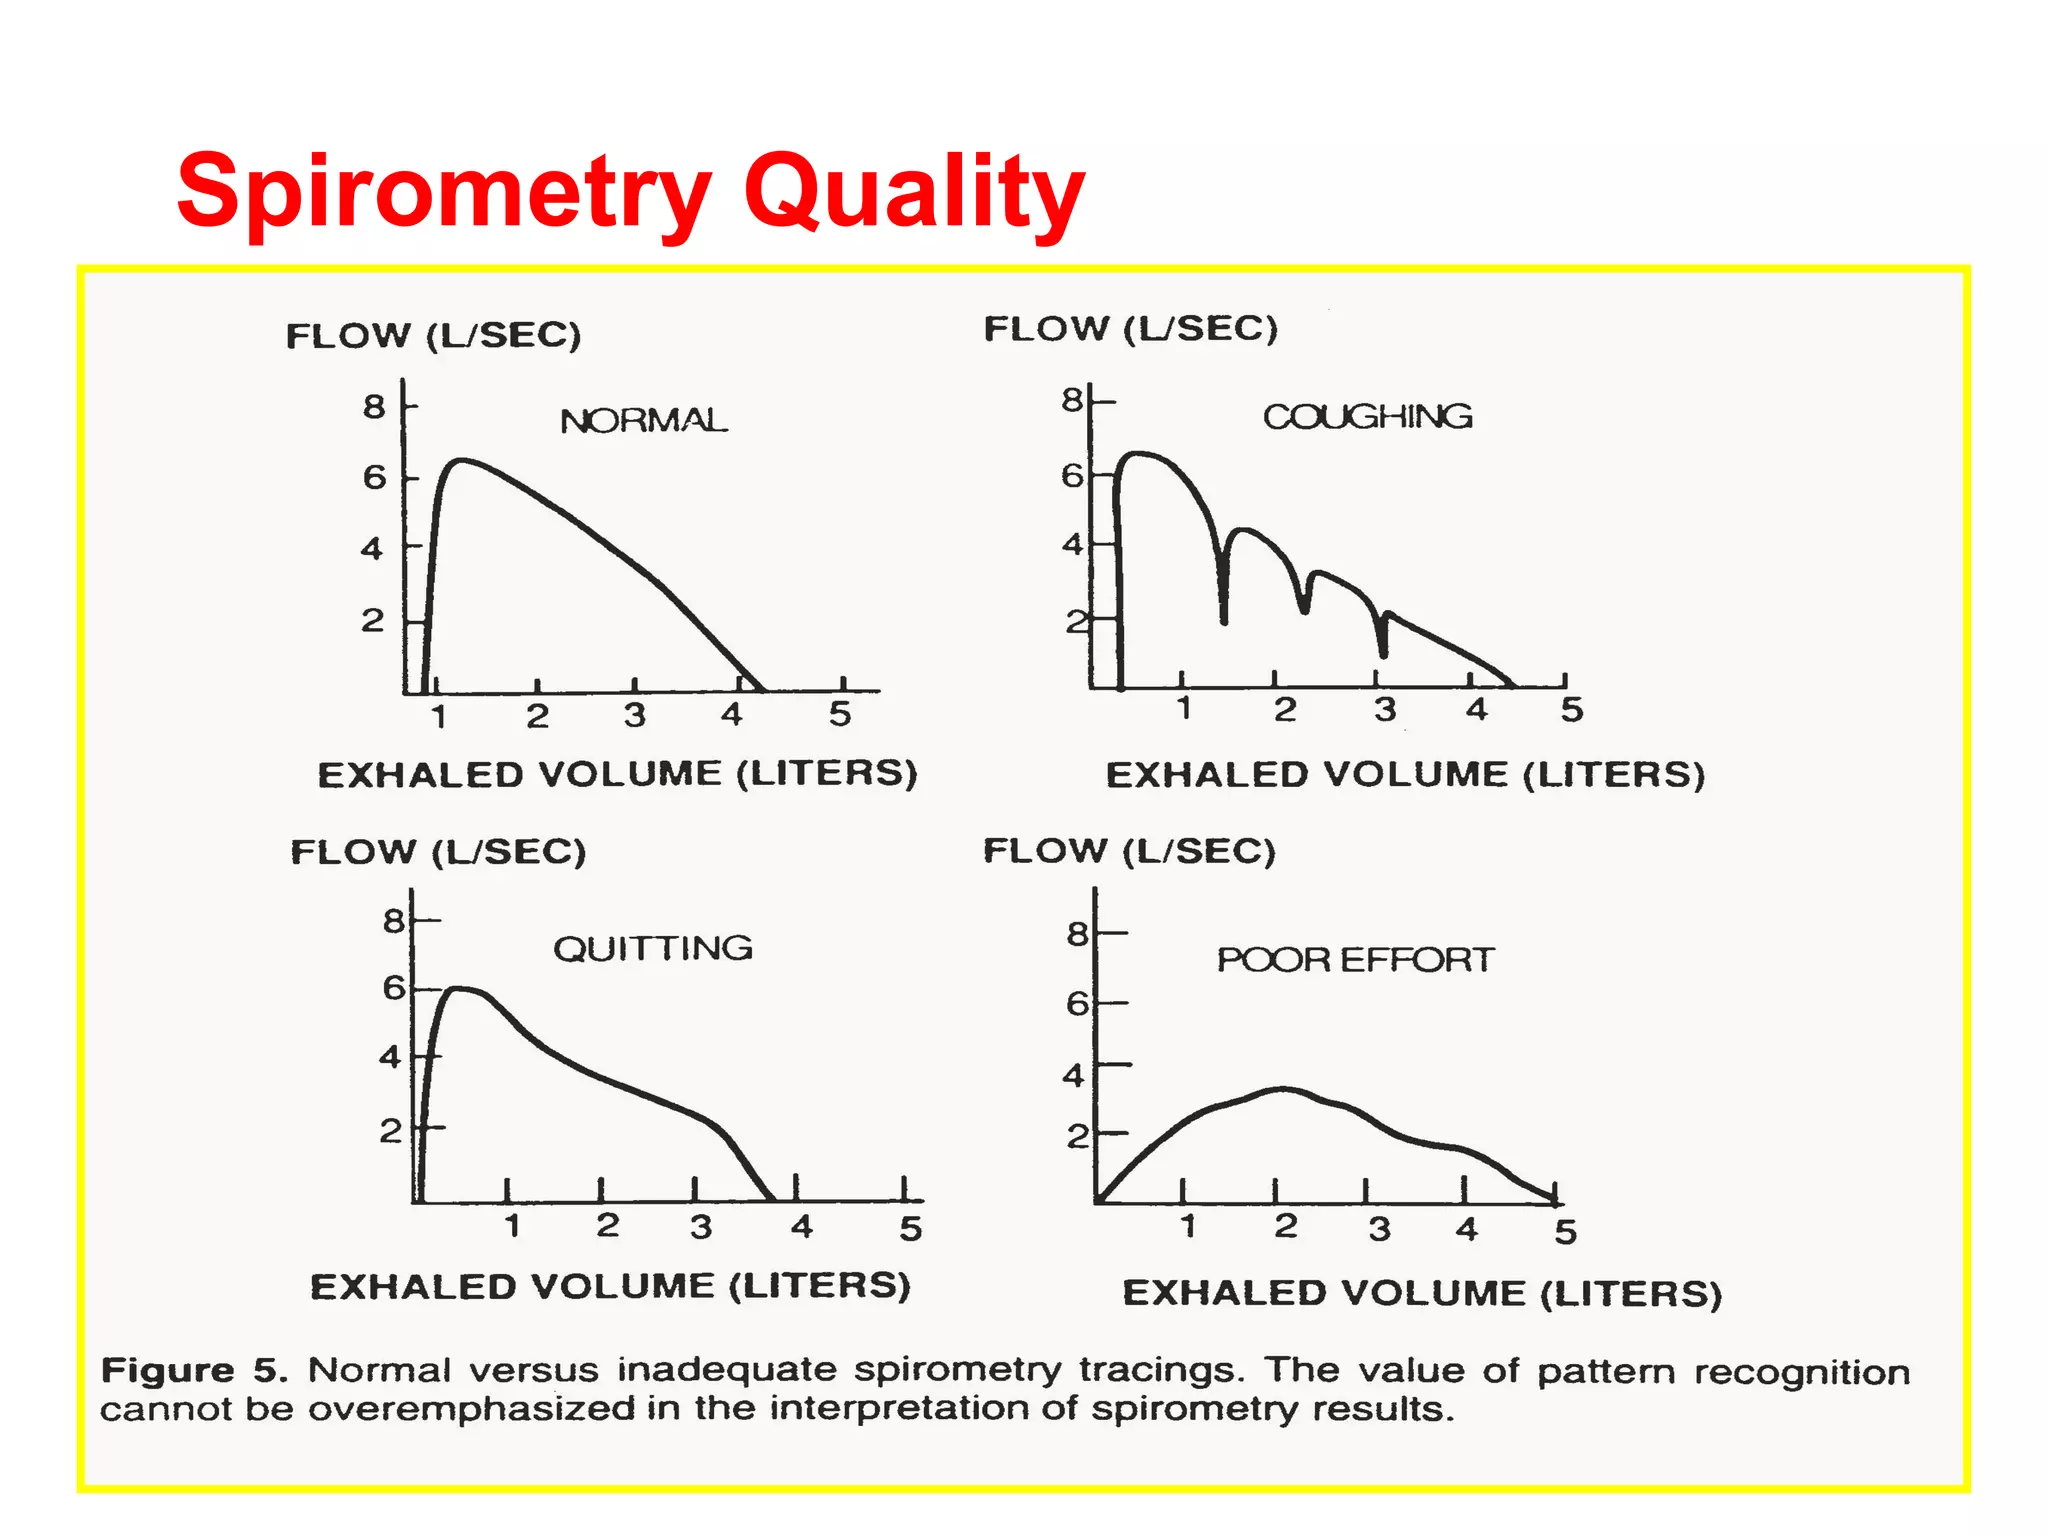
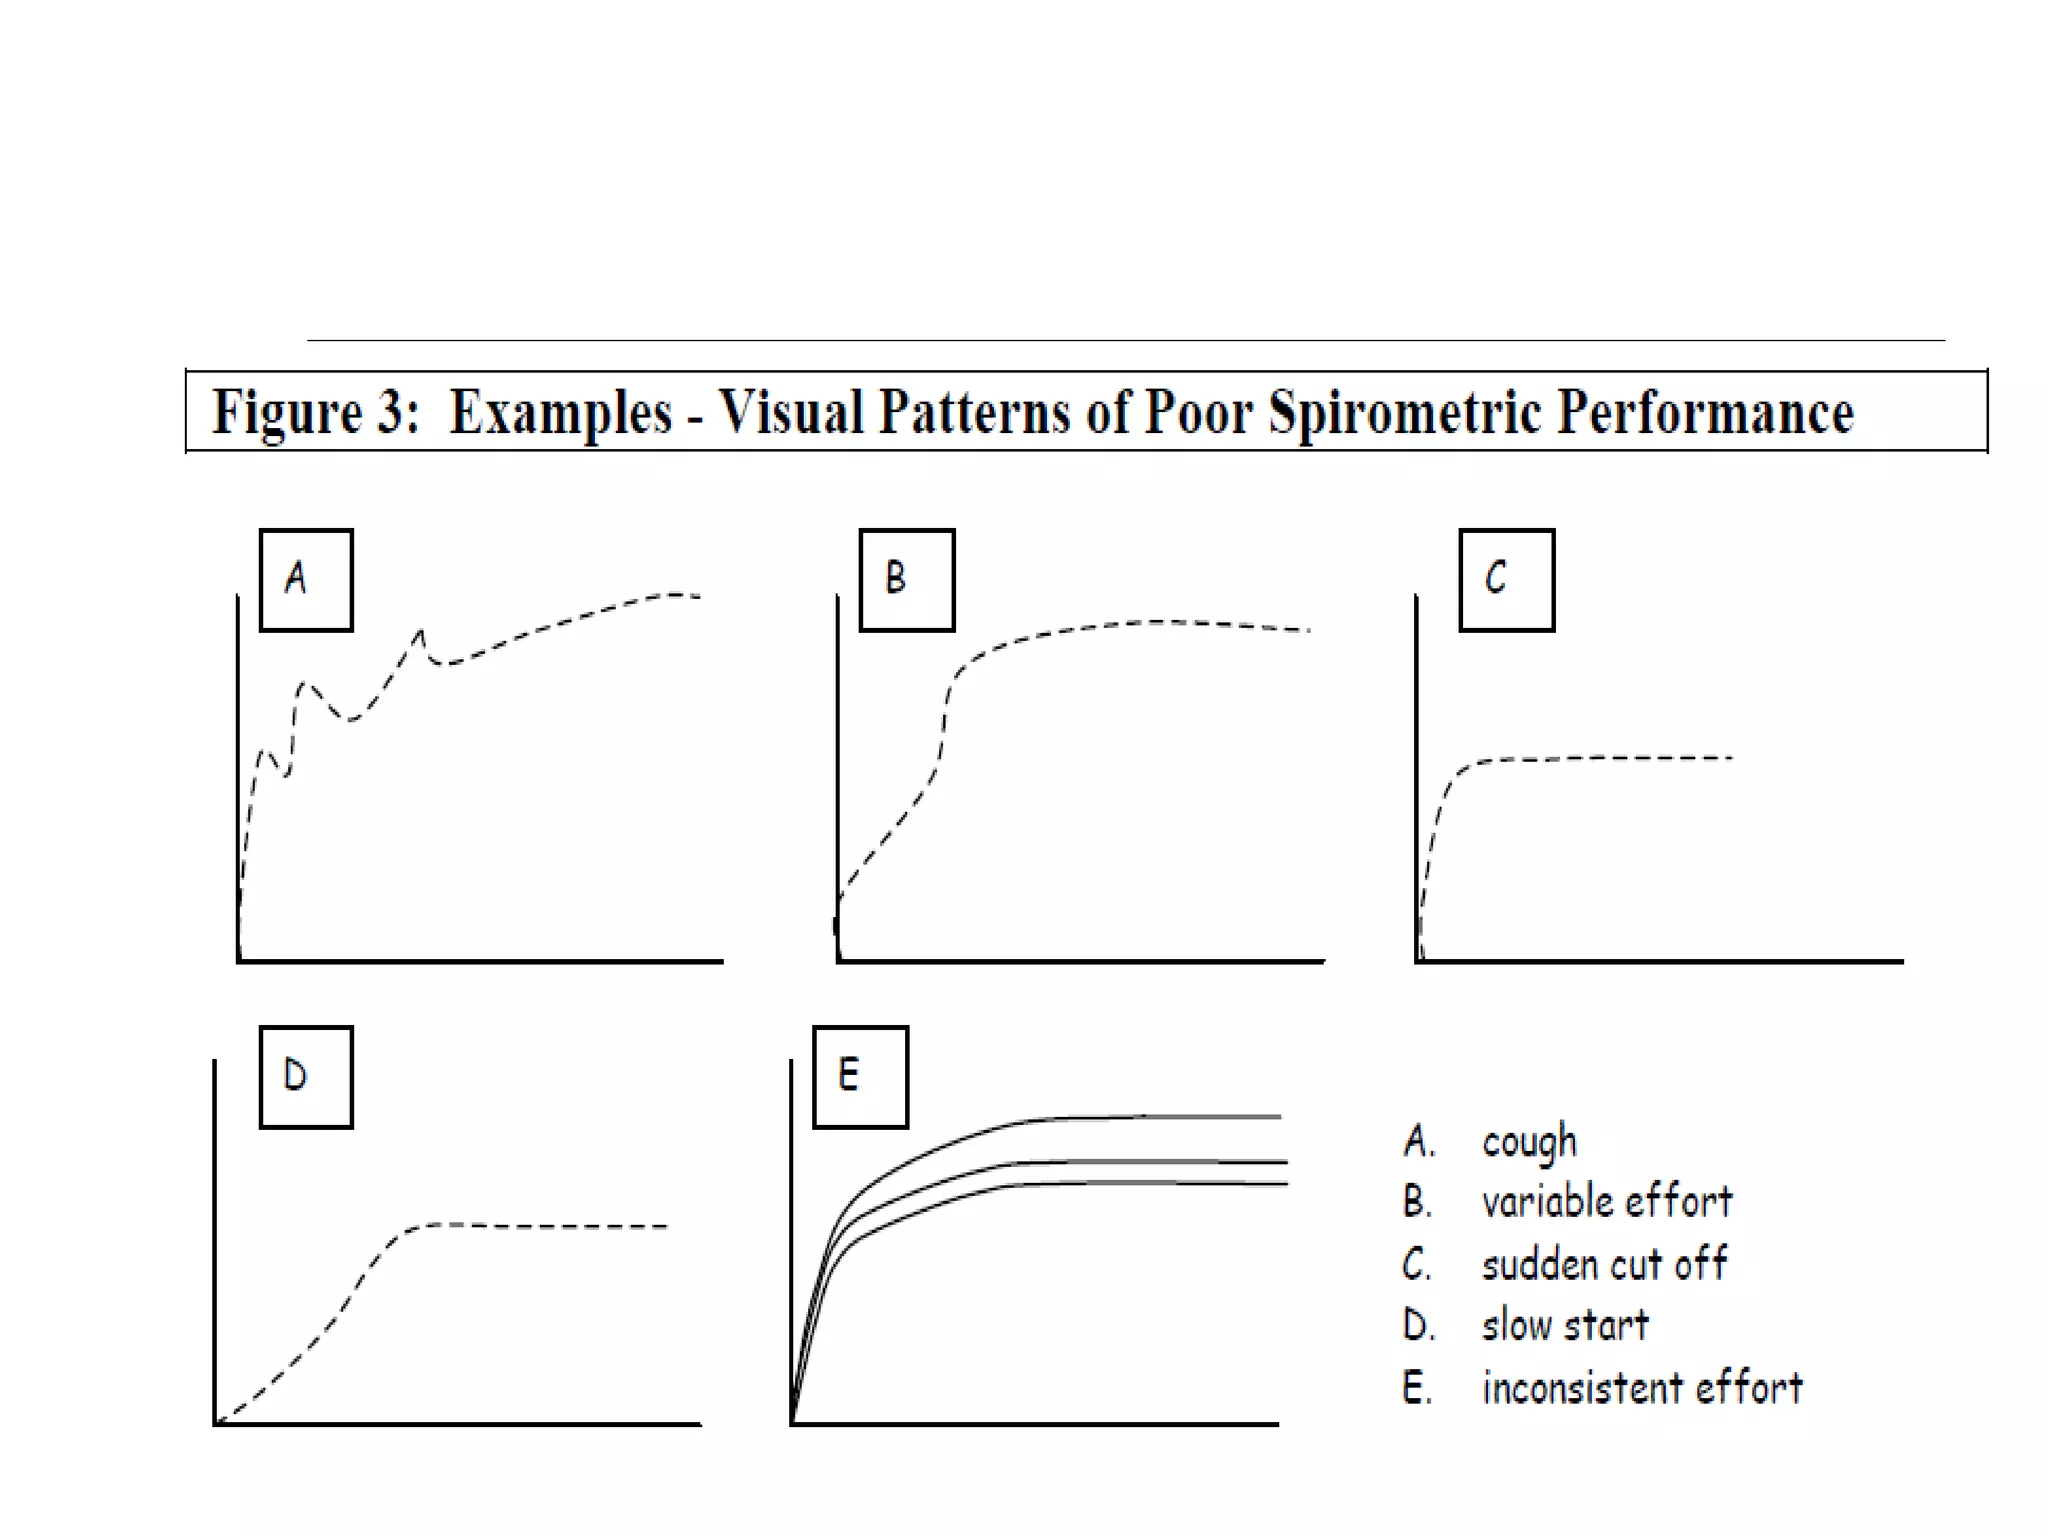
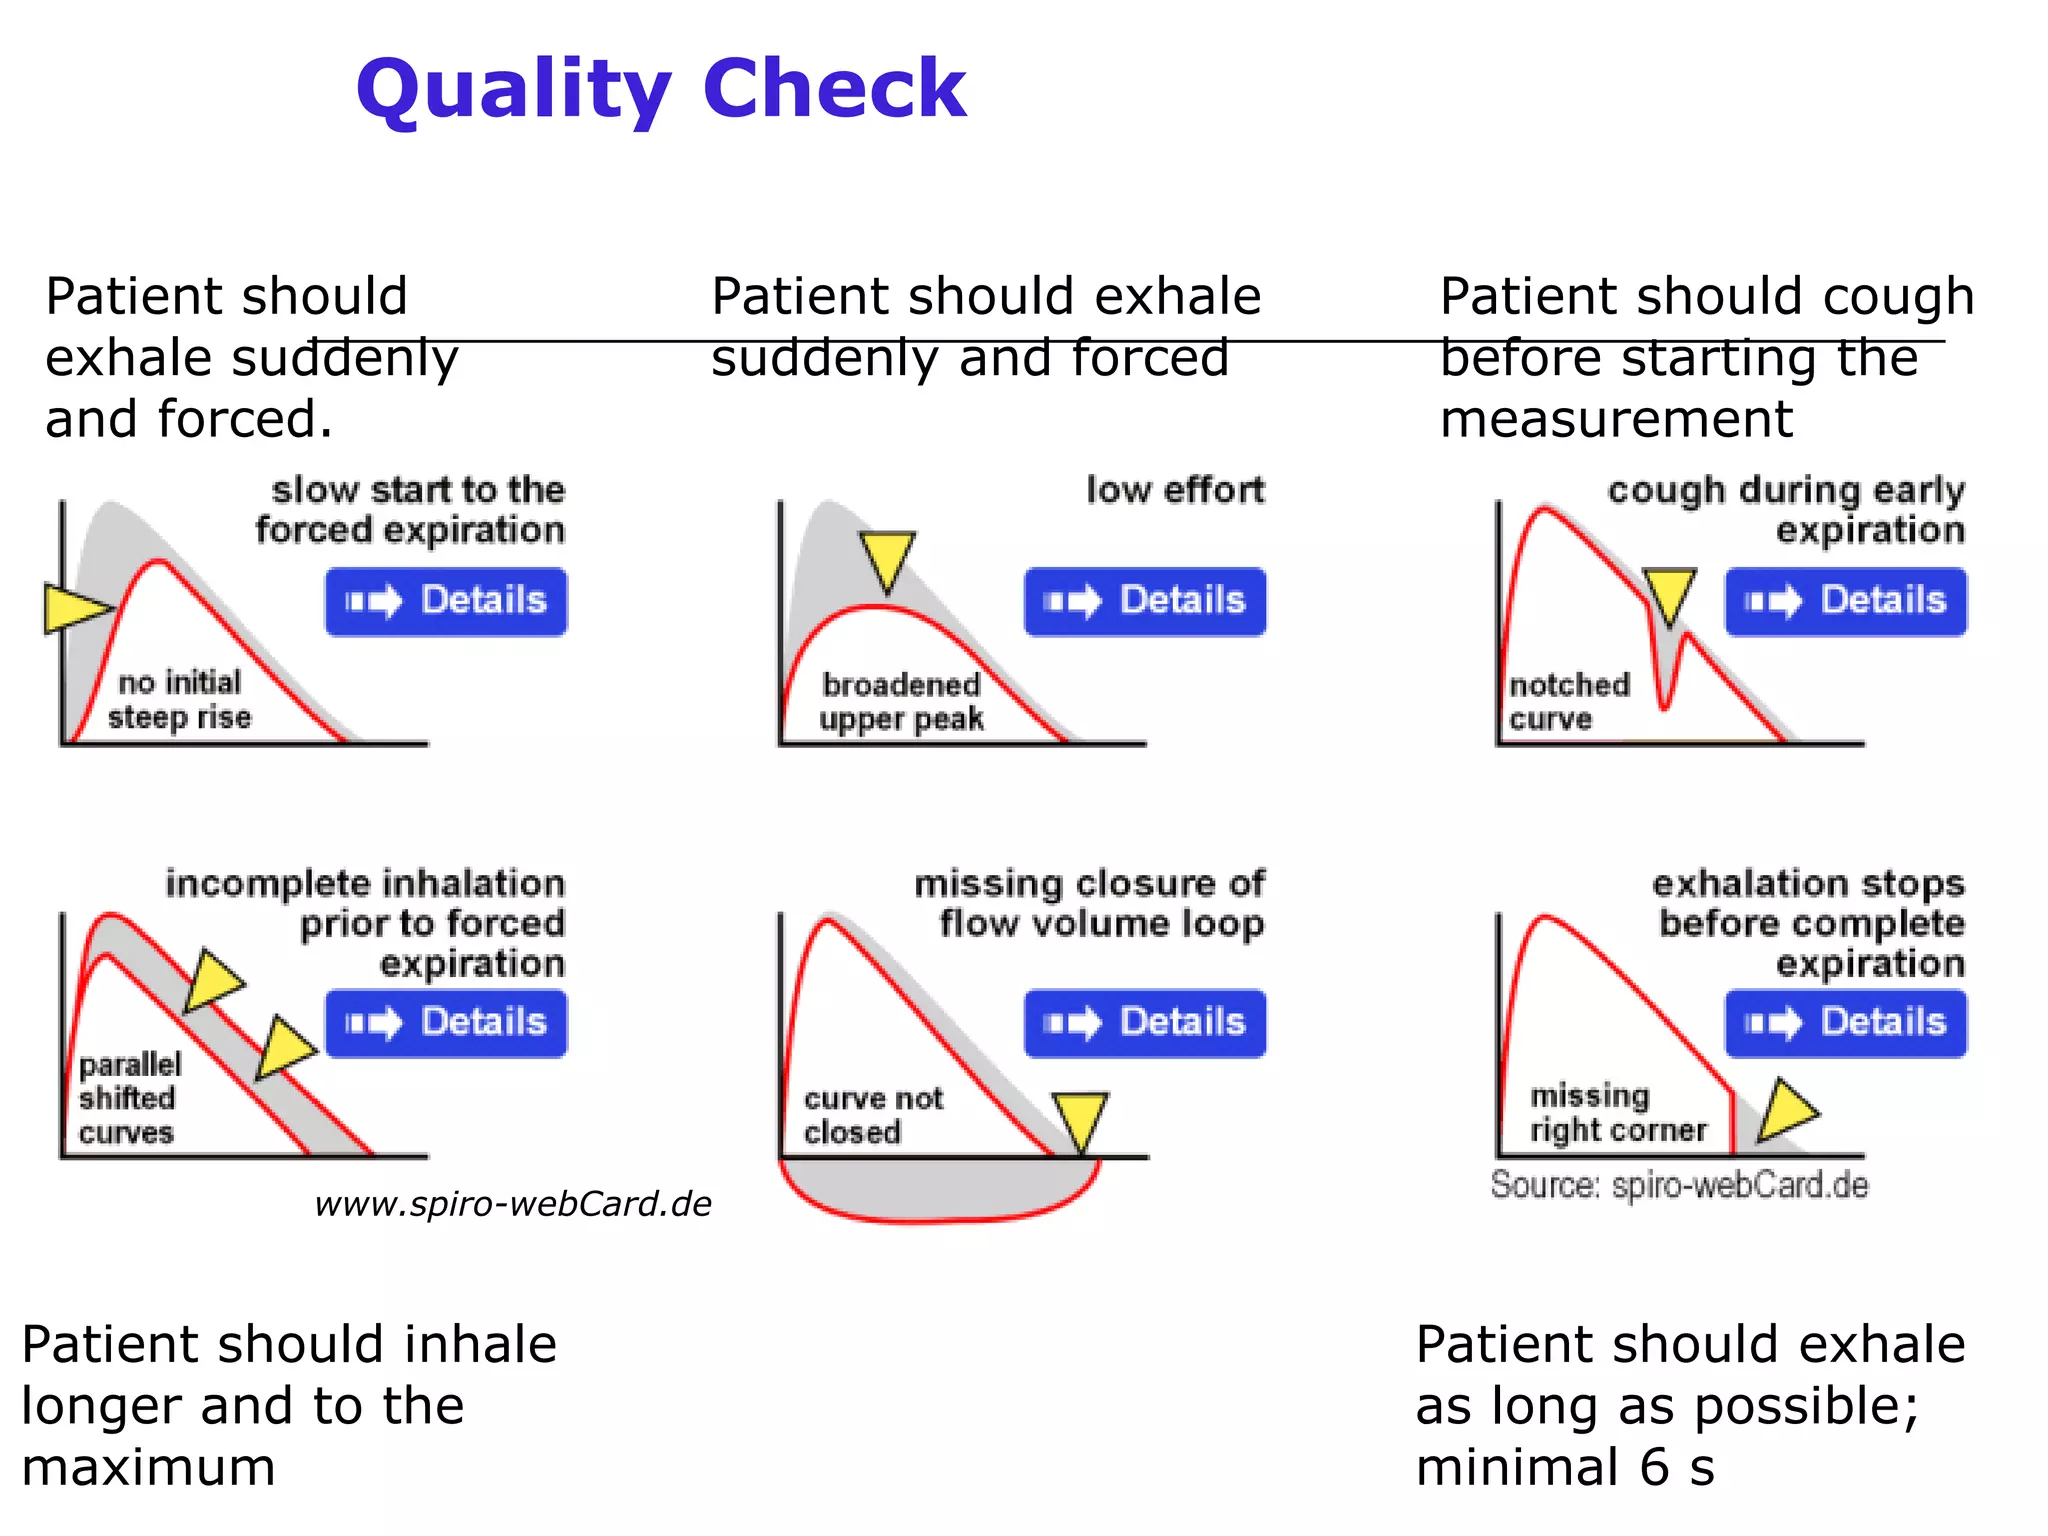
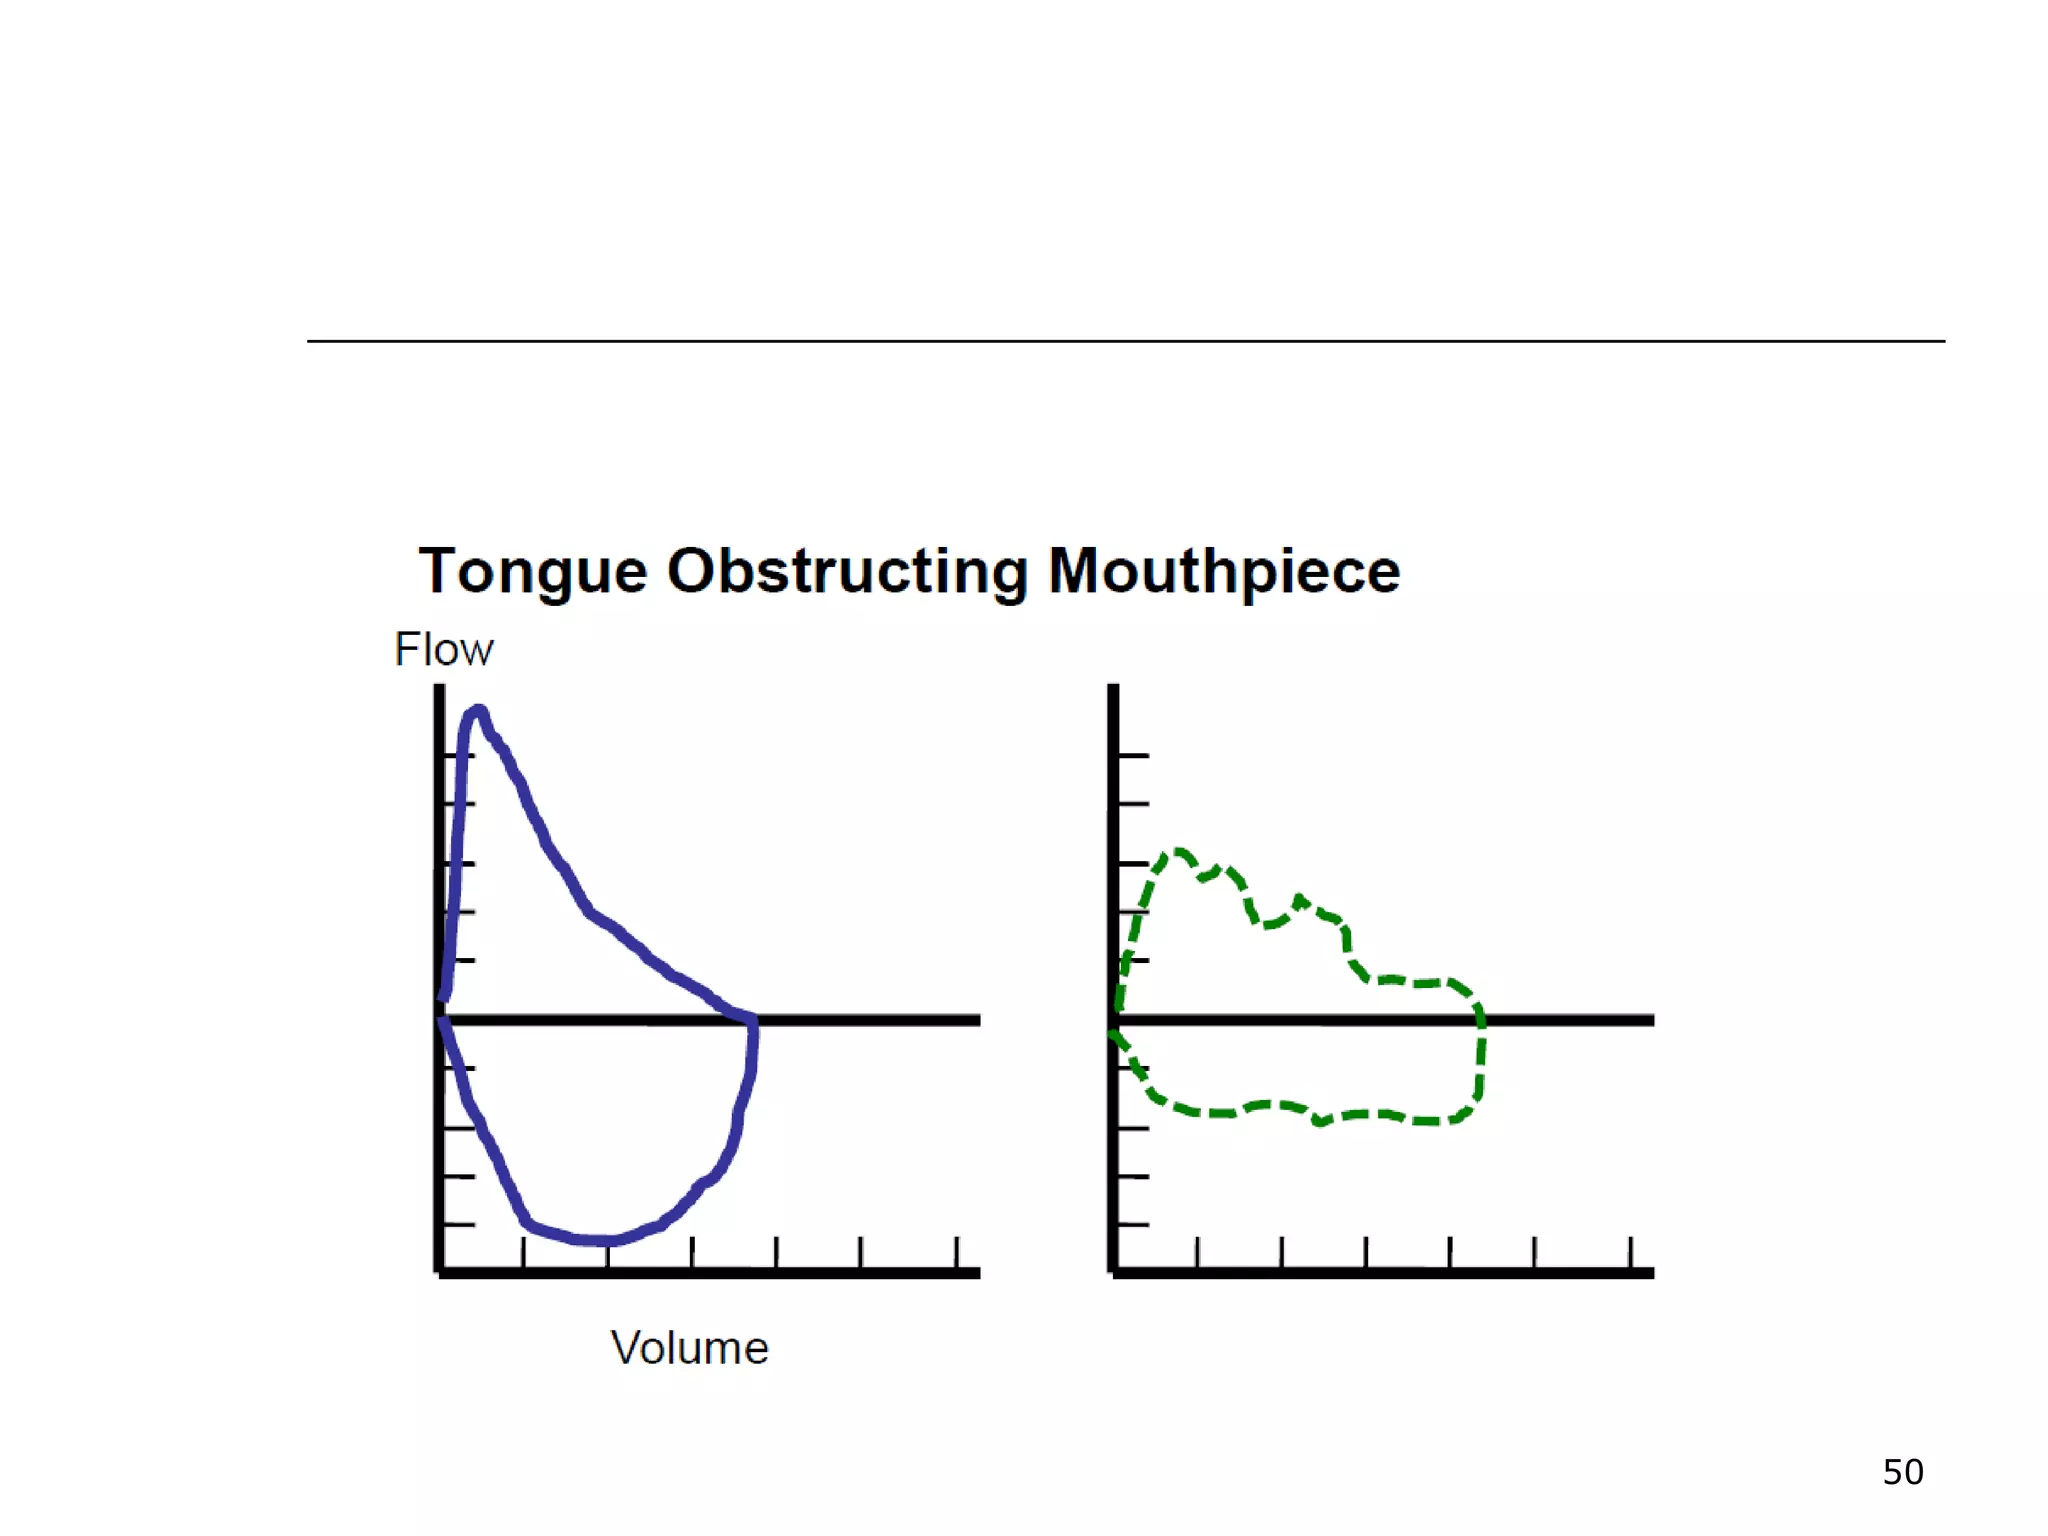
Step-by-step instructions for conducting spirometry tests to ensure accurate results.
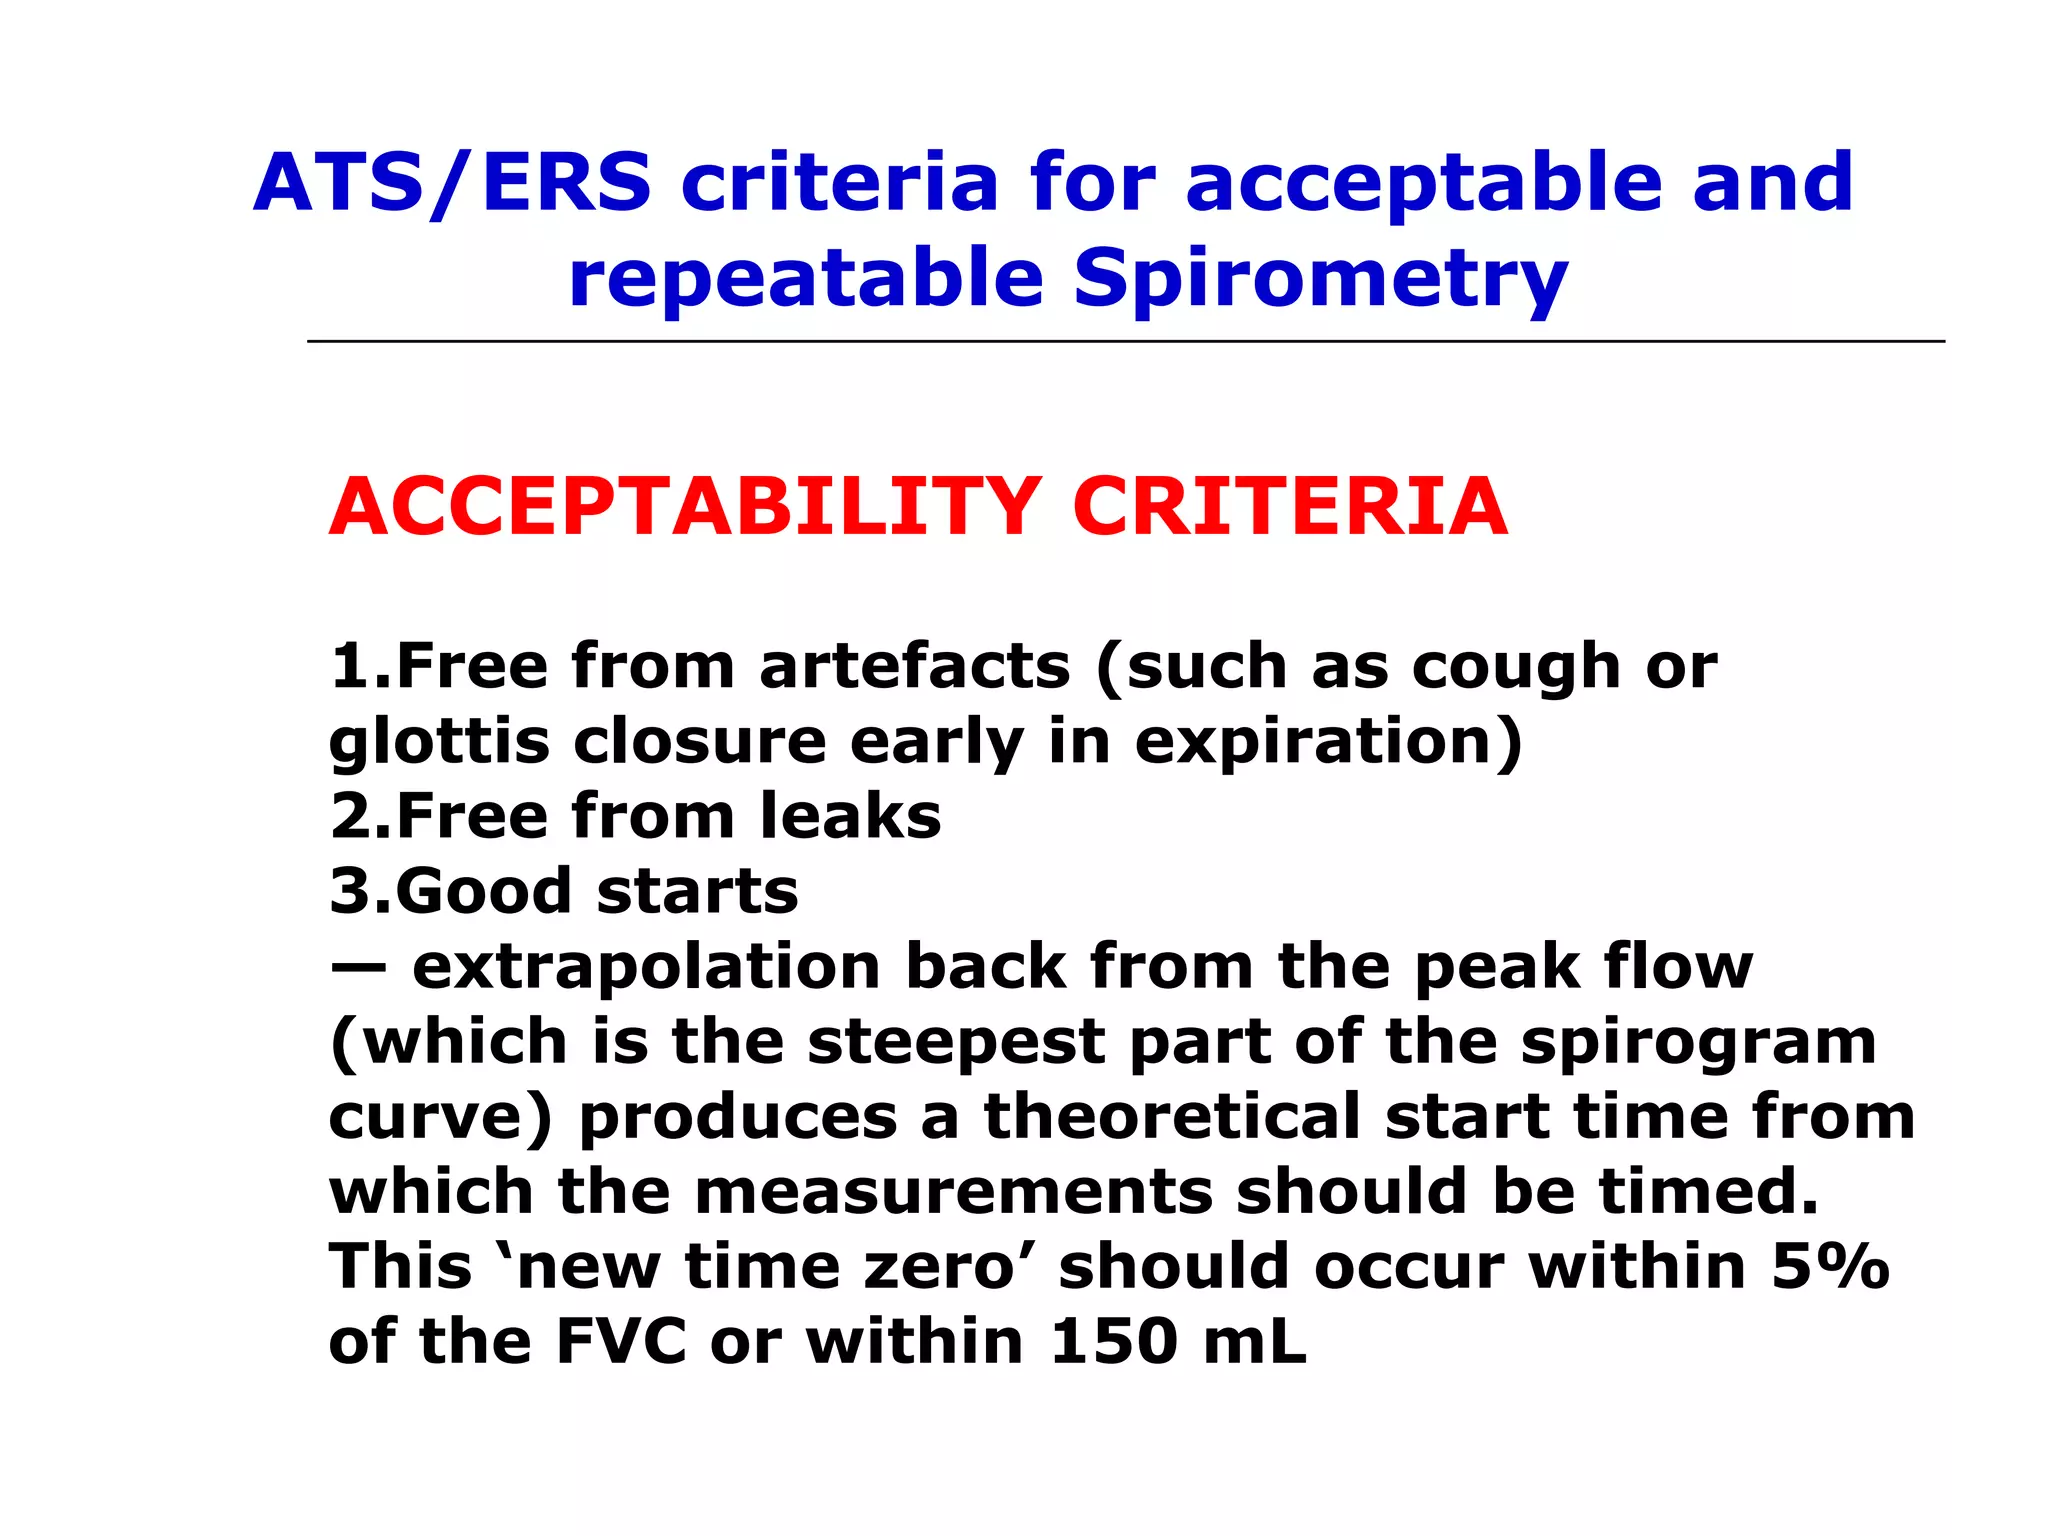
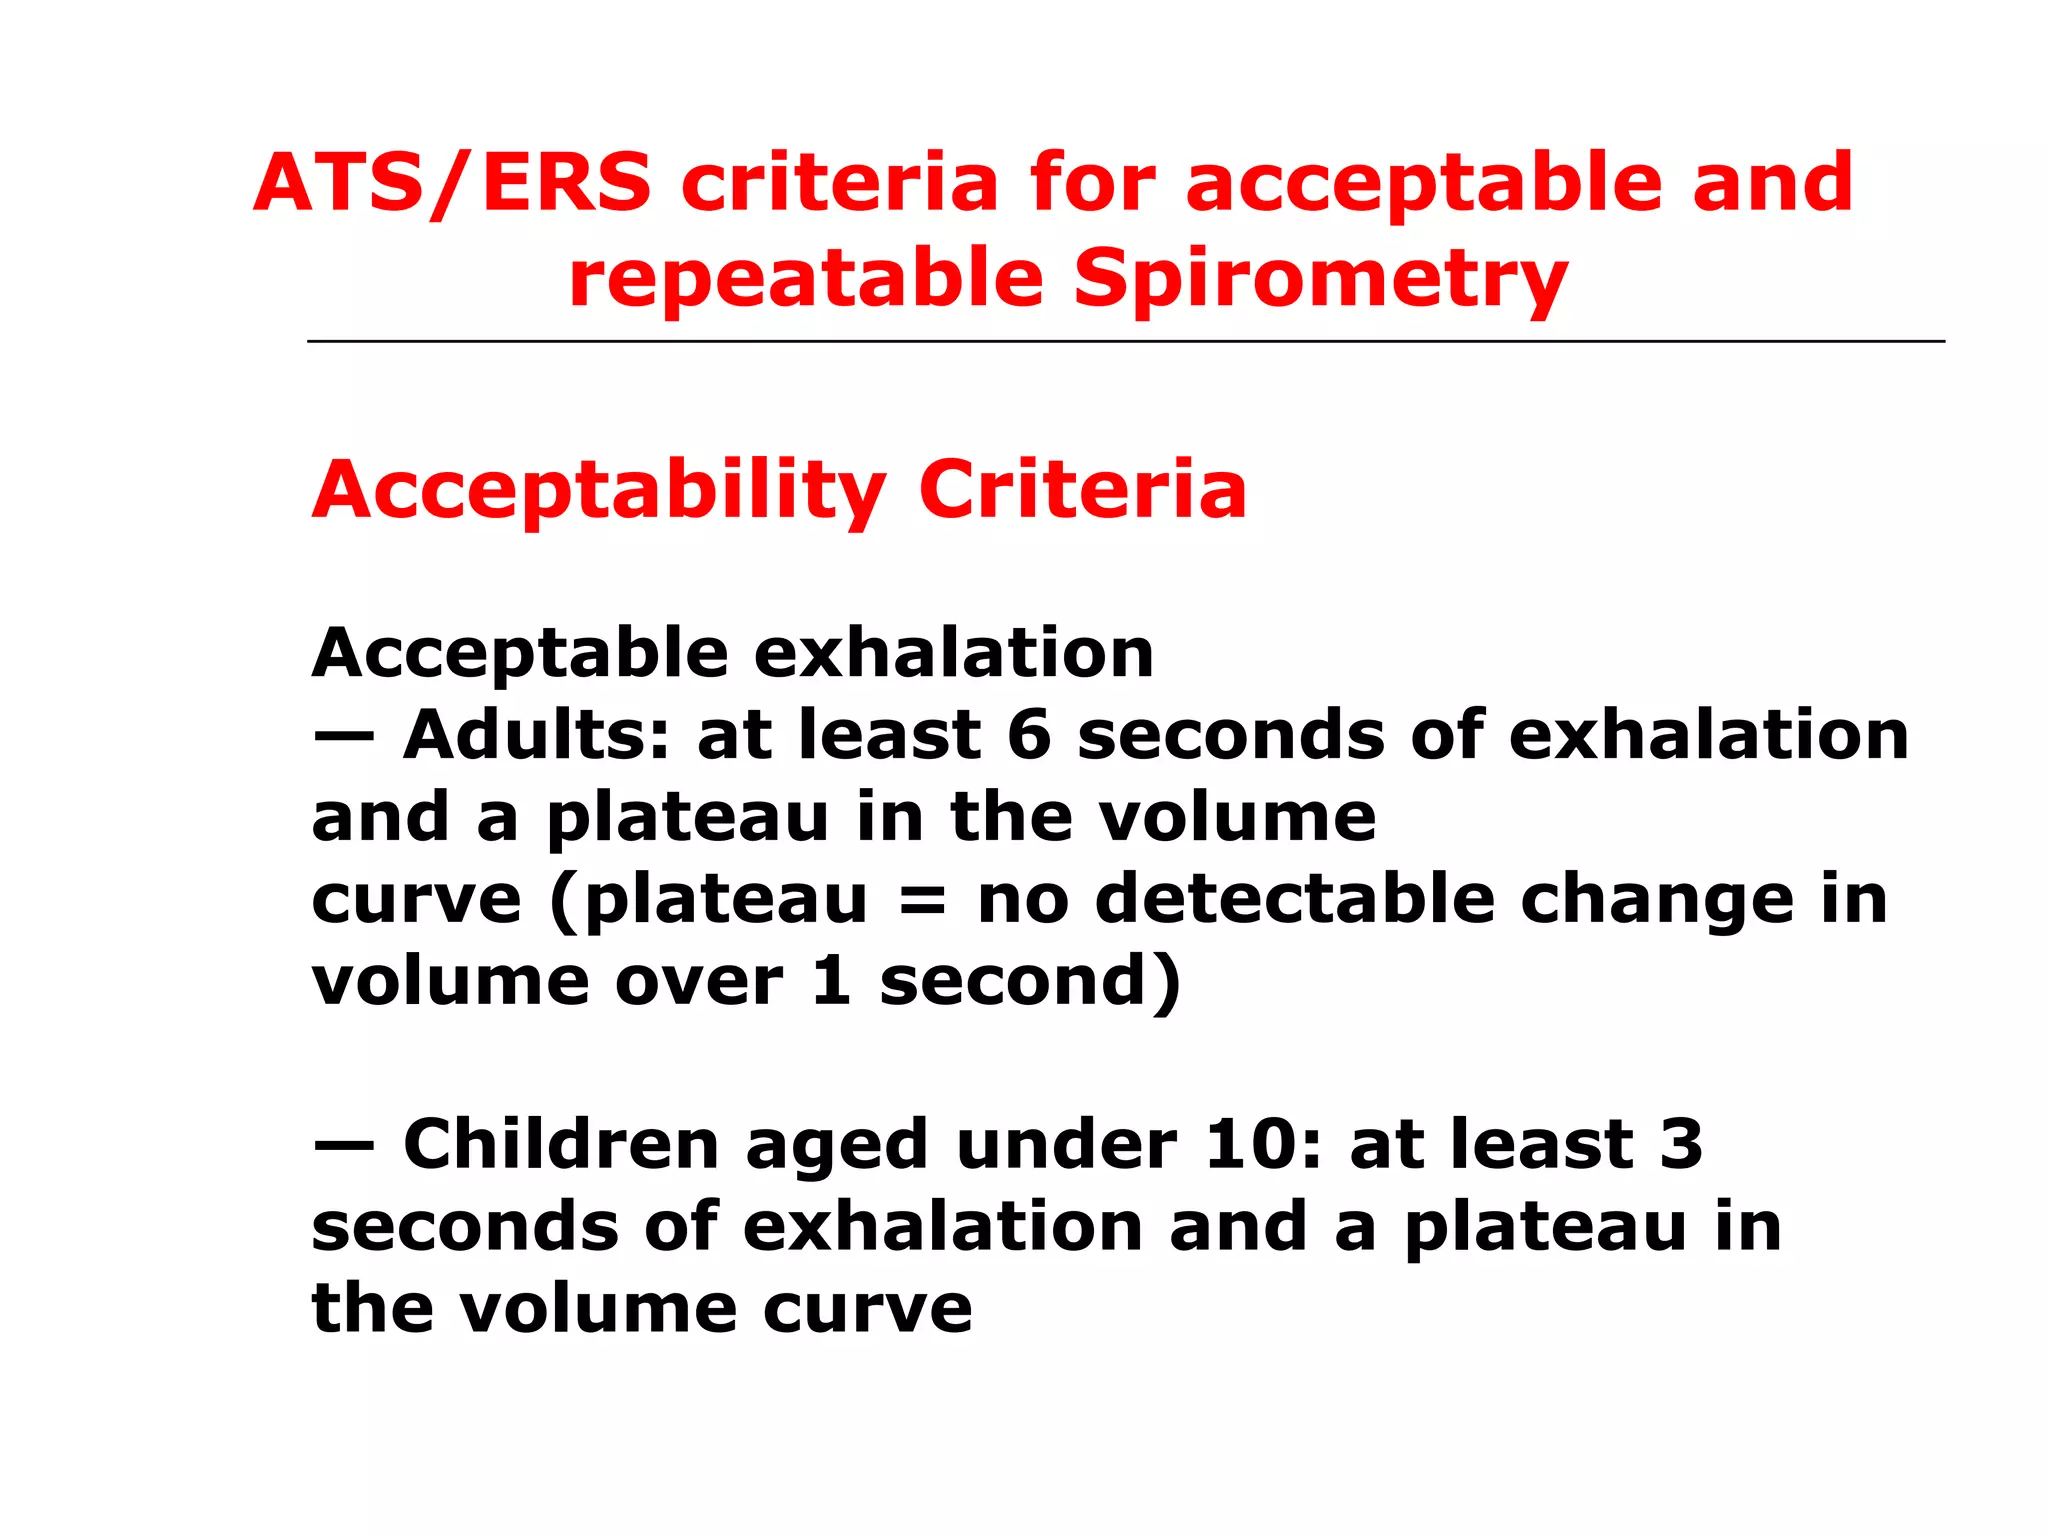
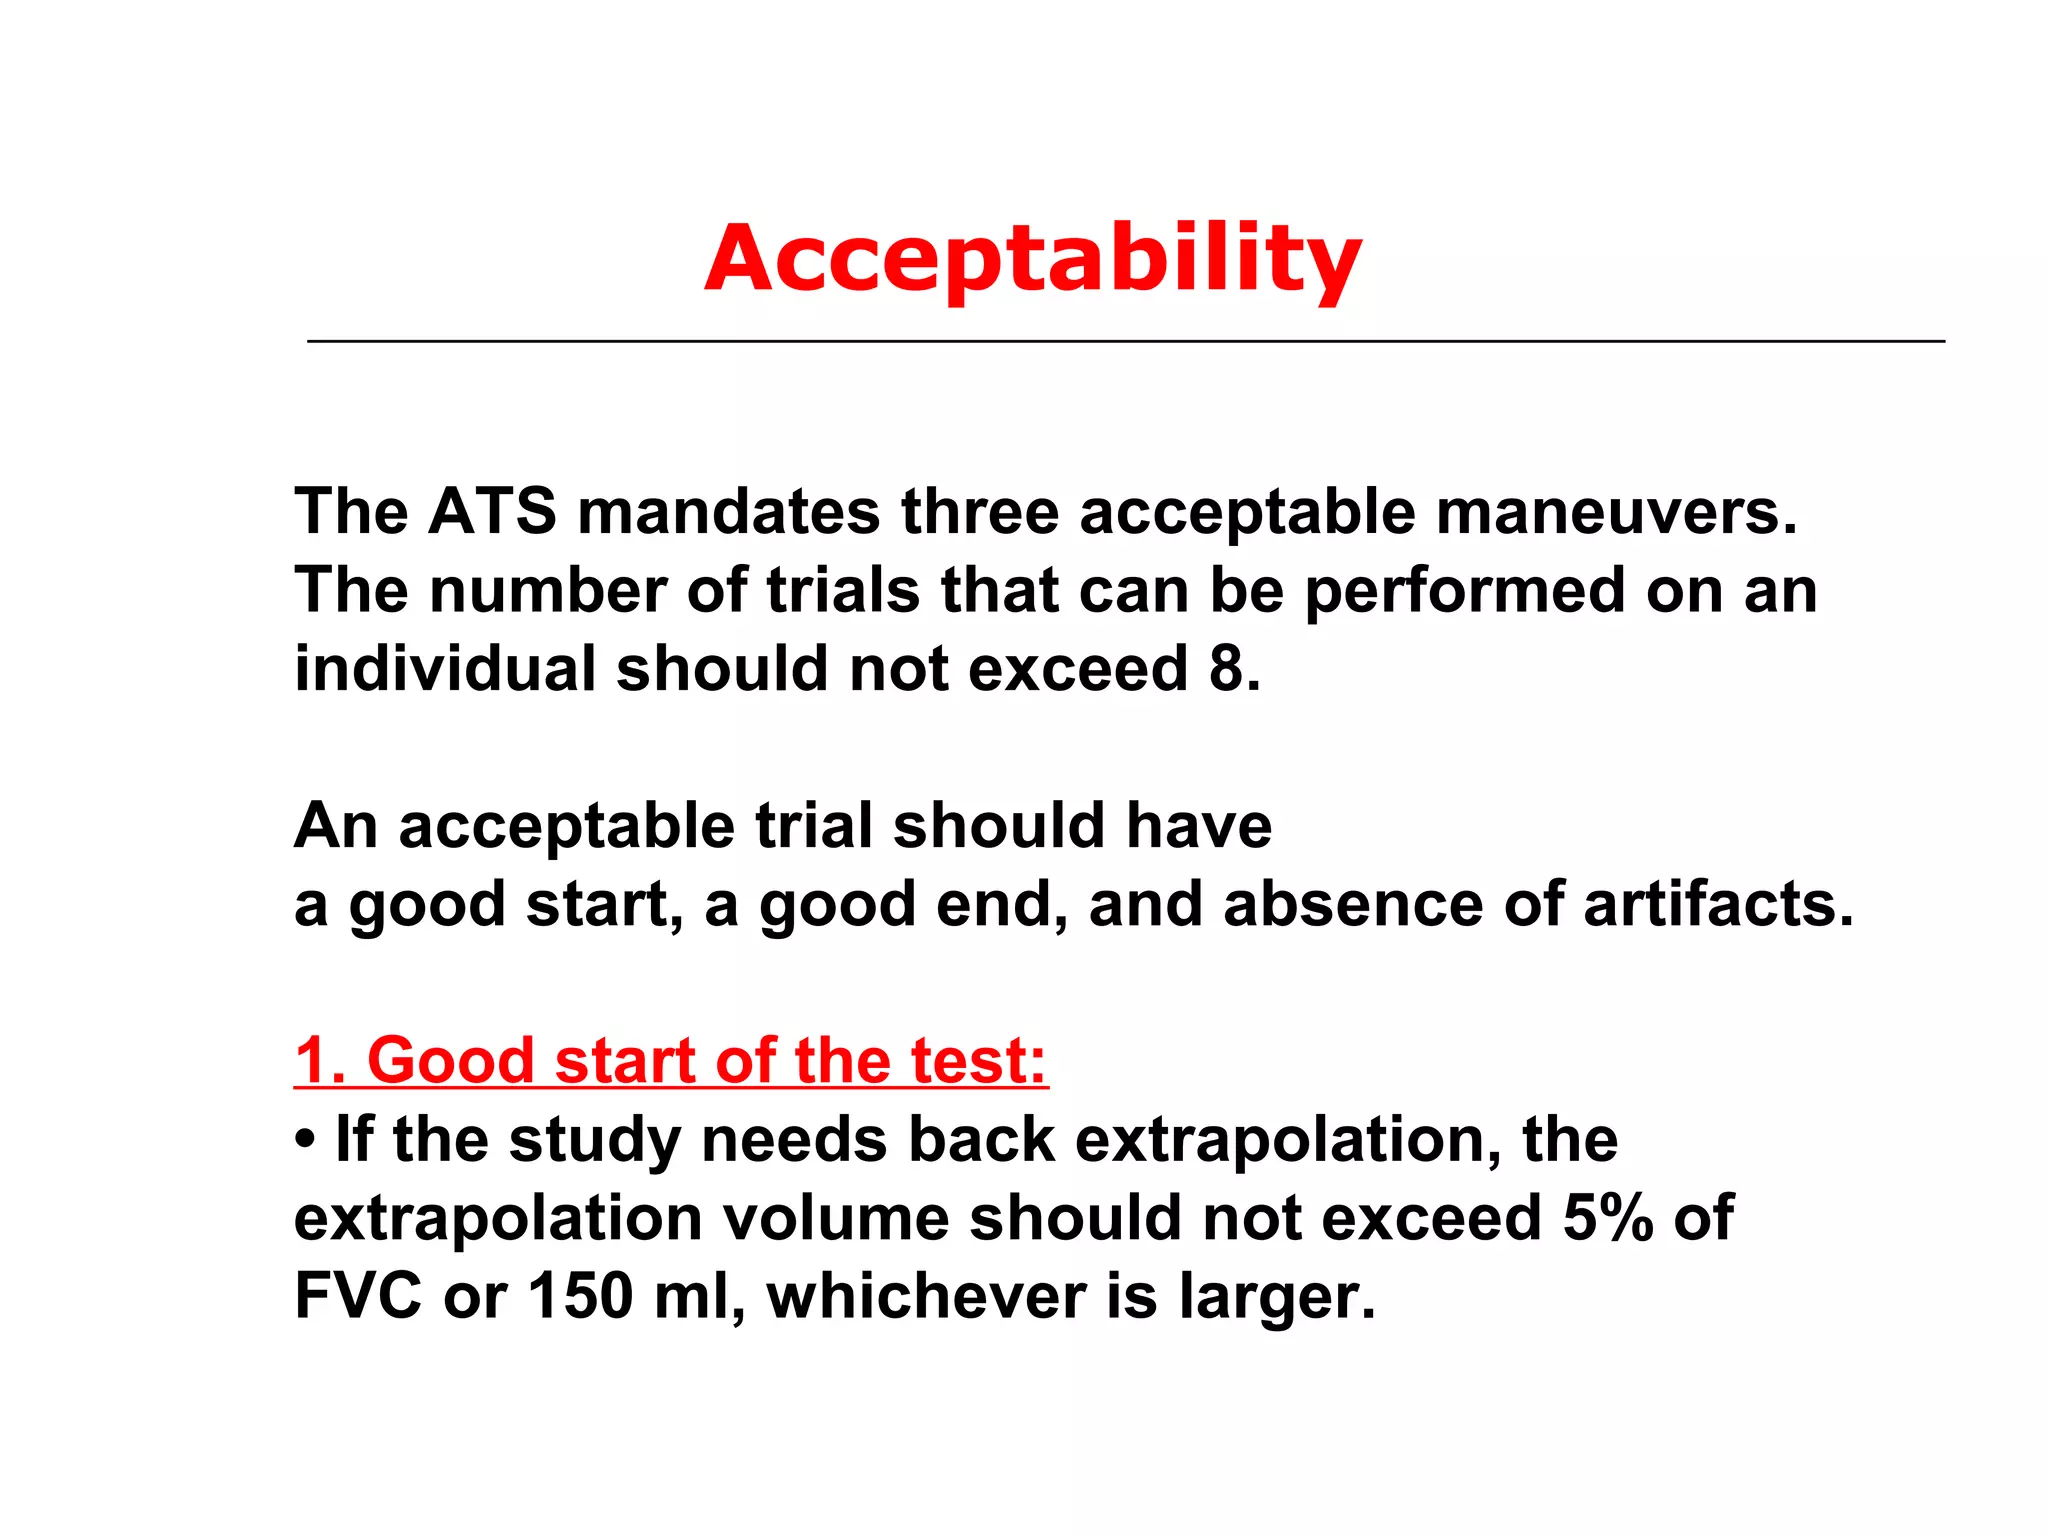
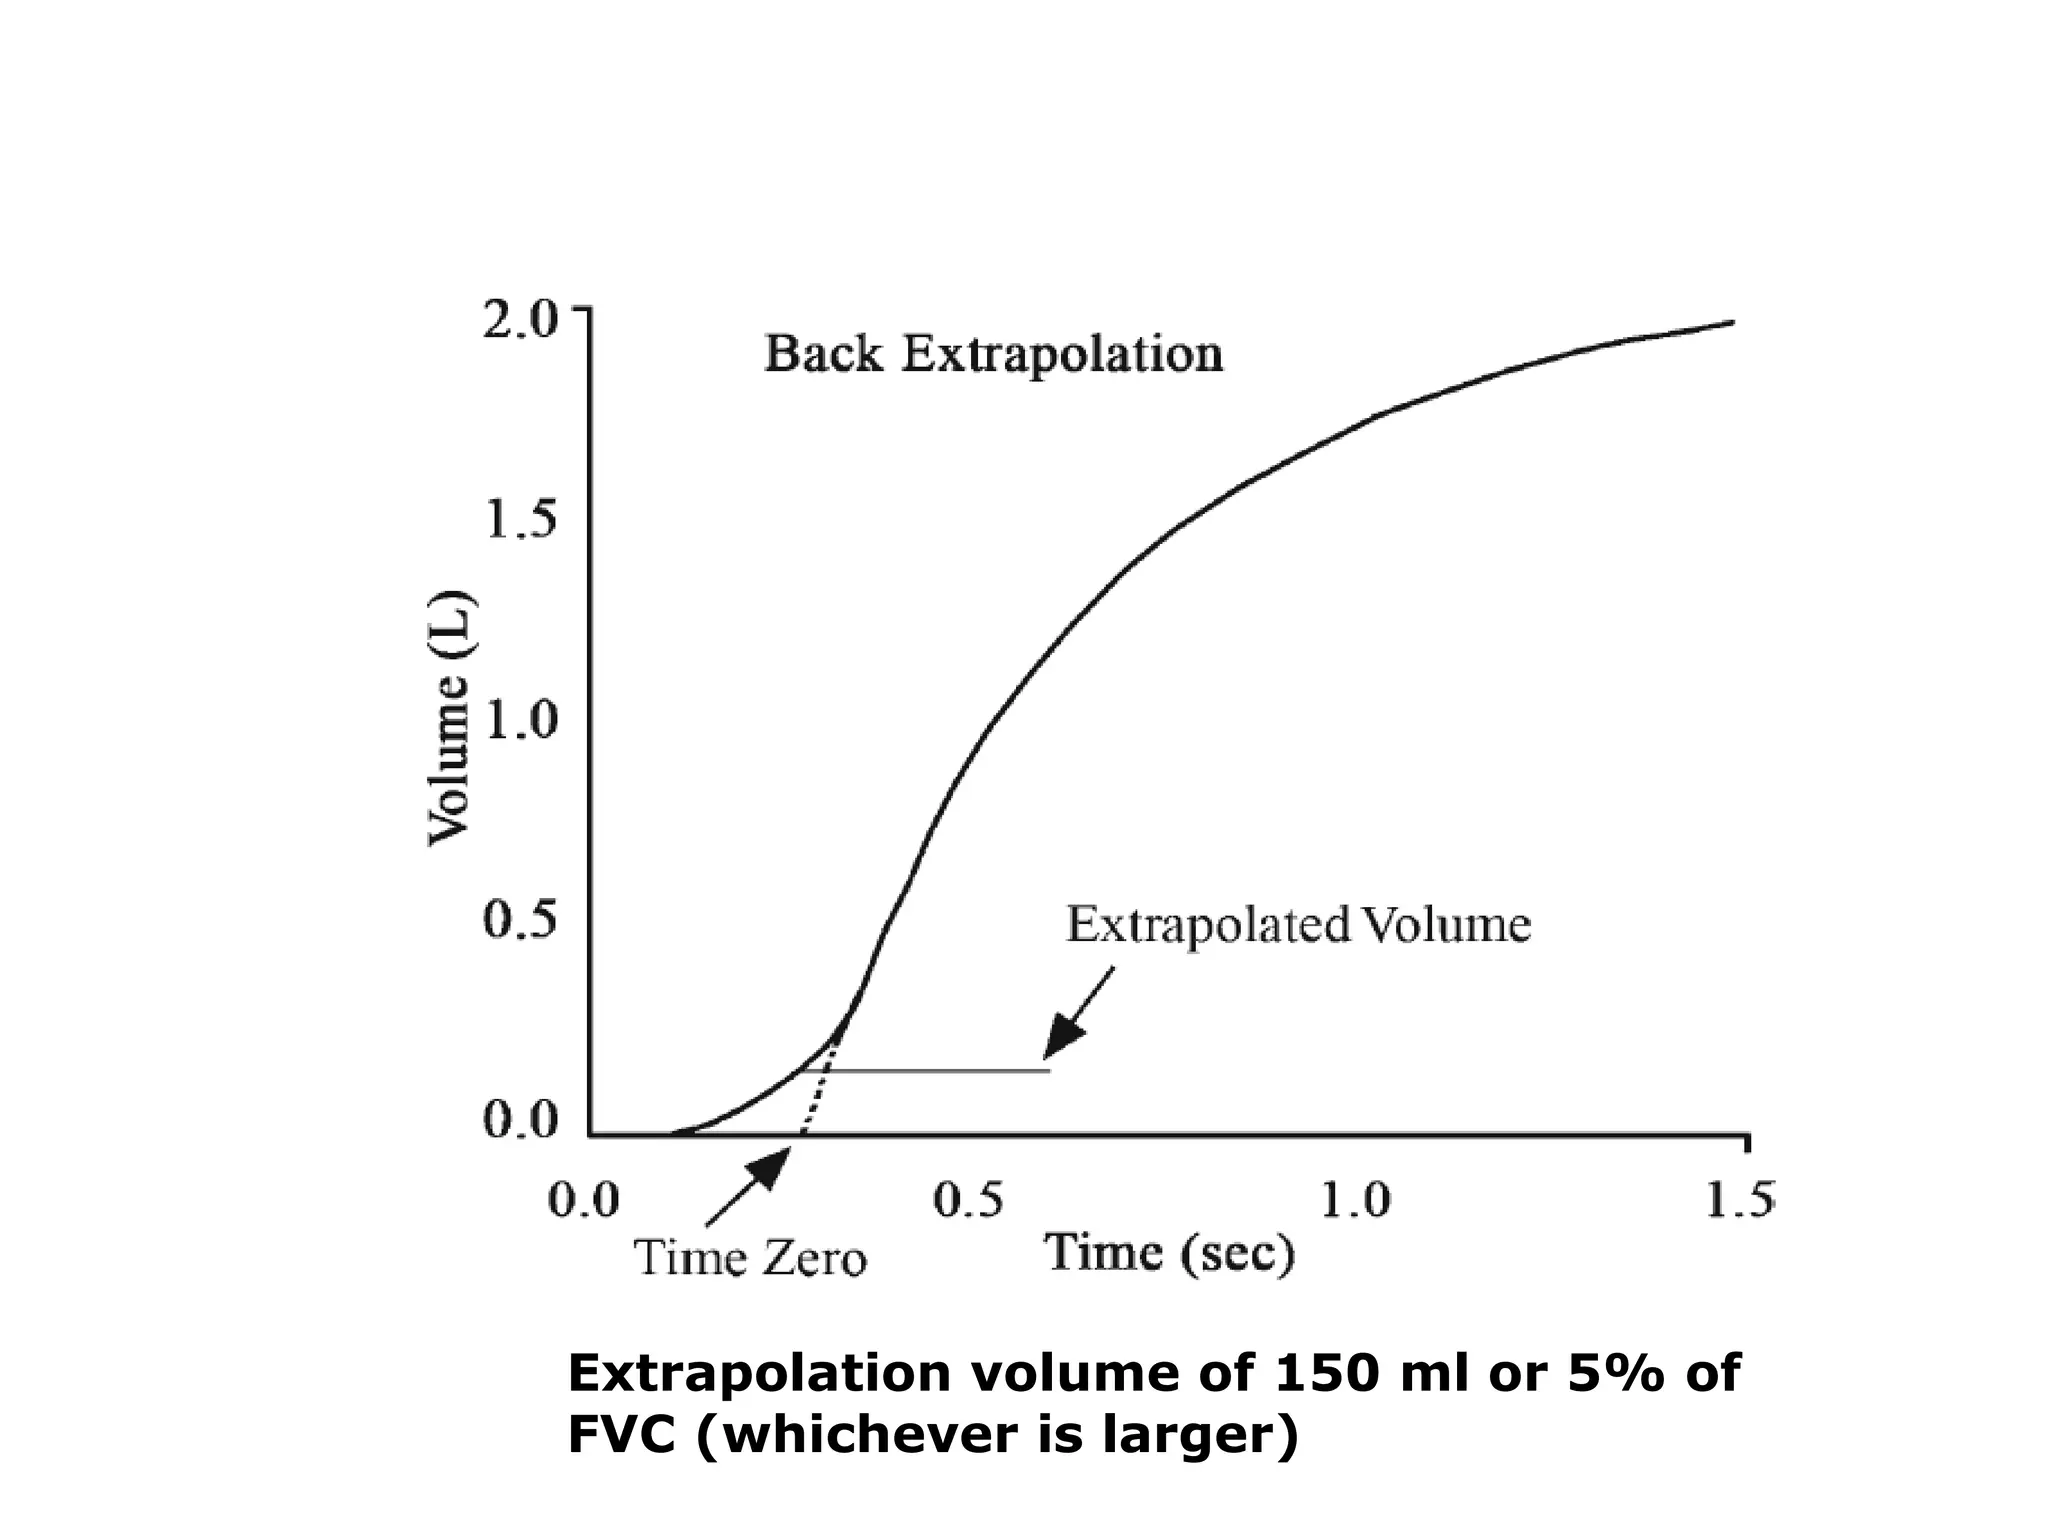
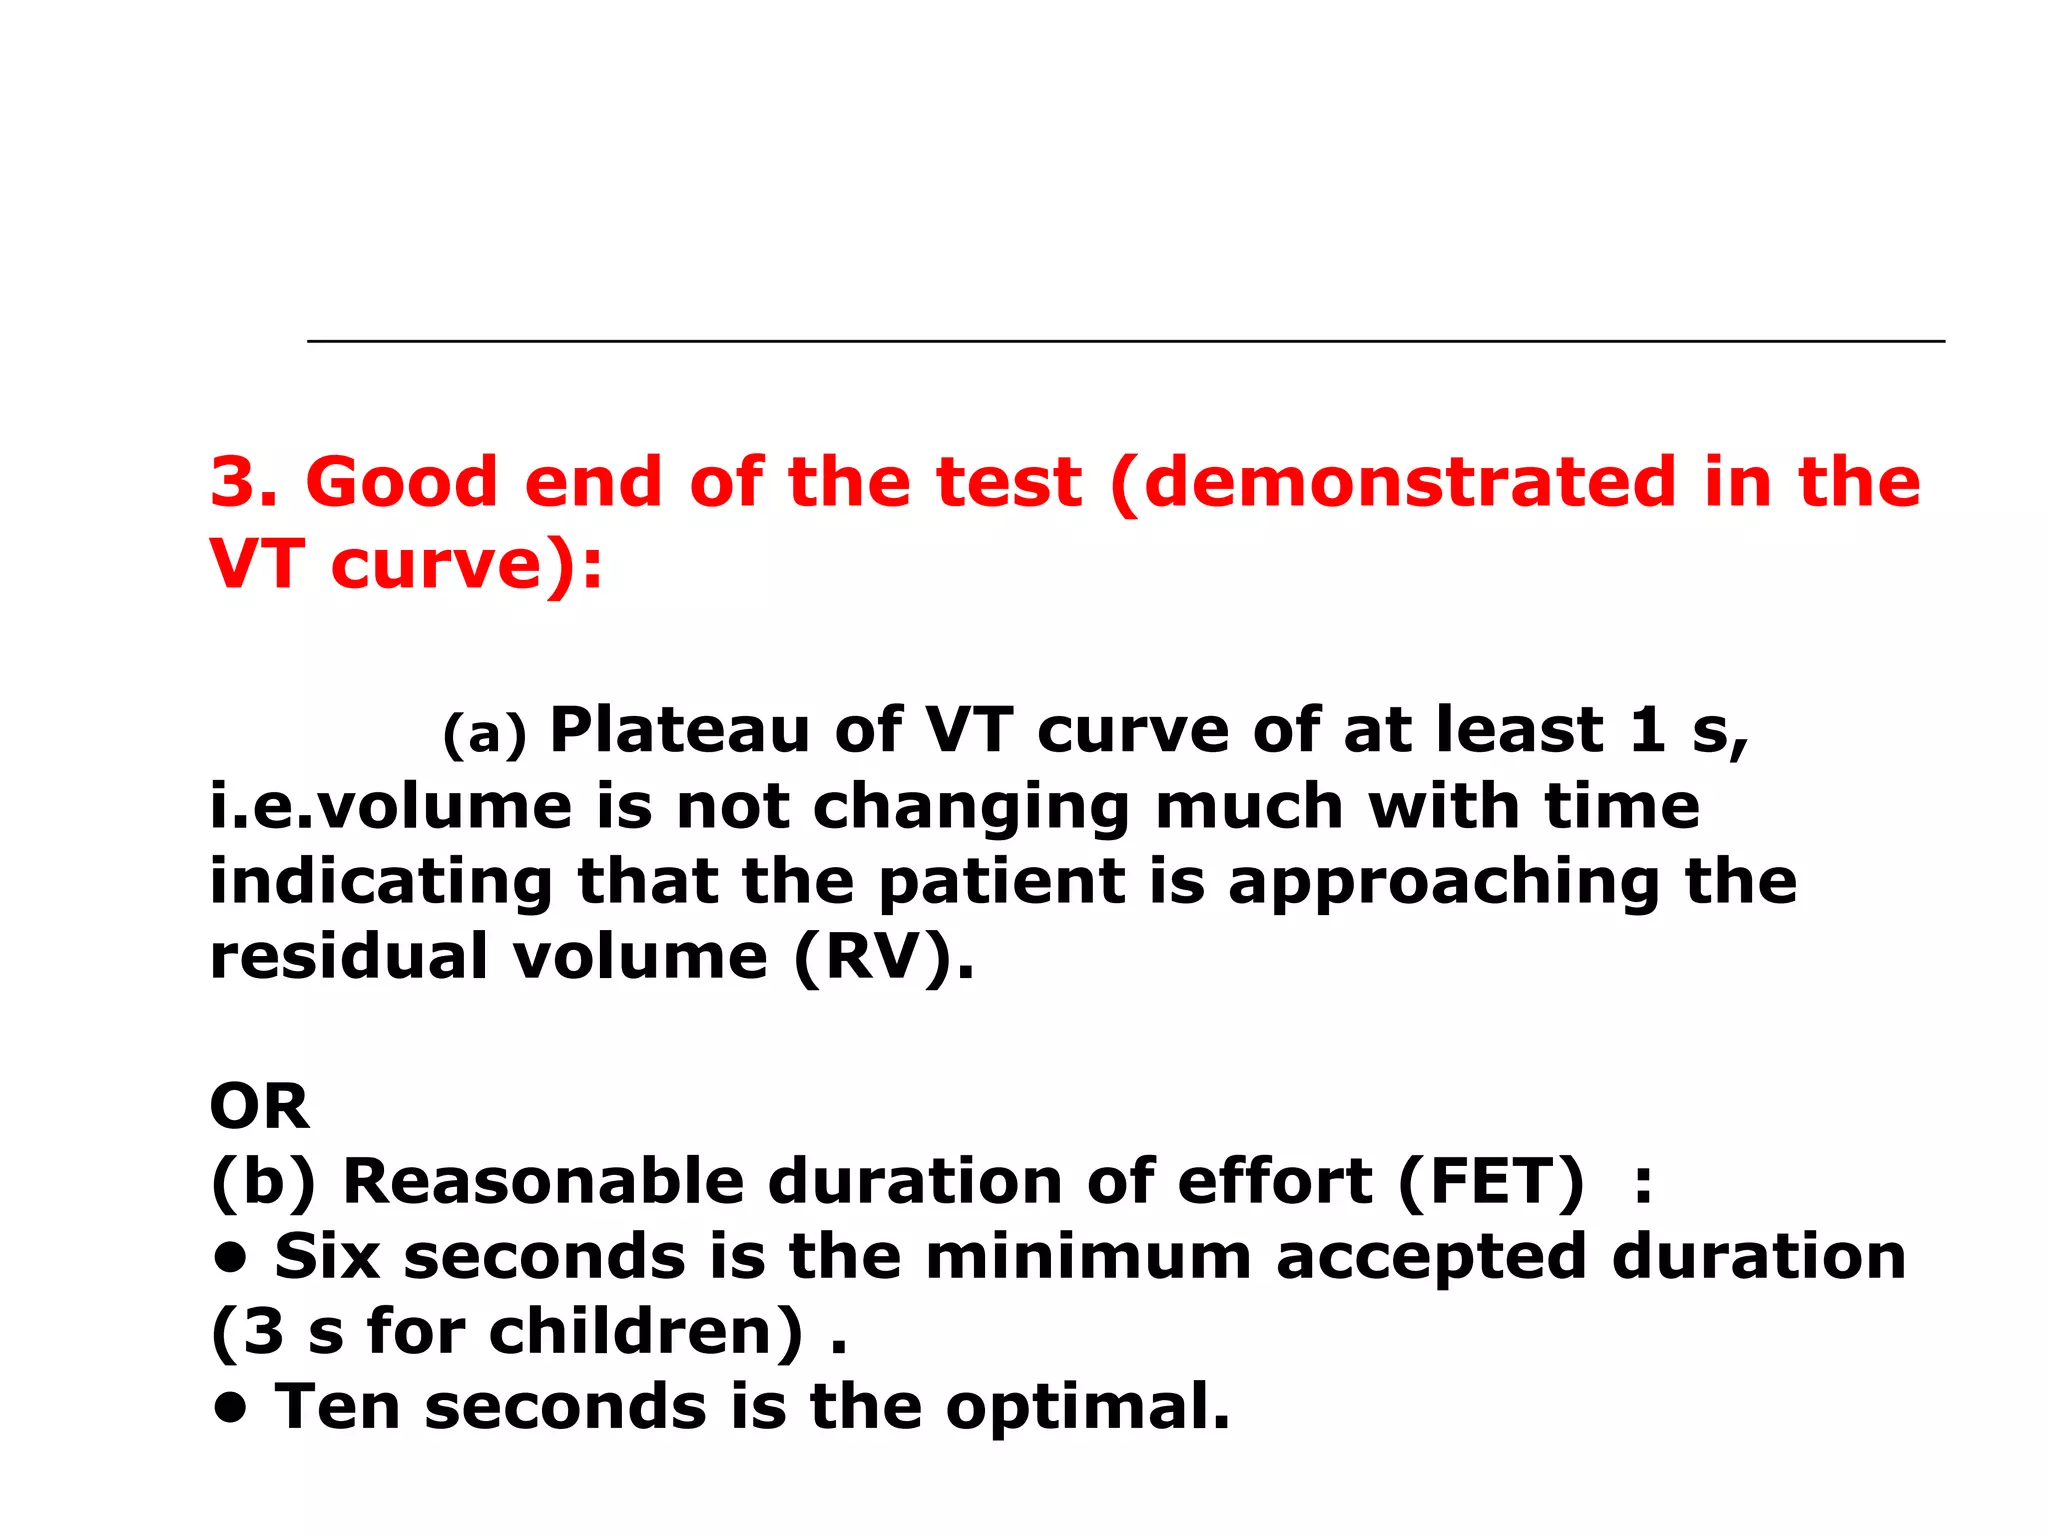
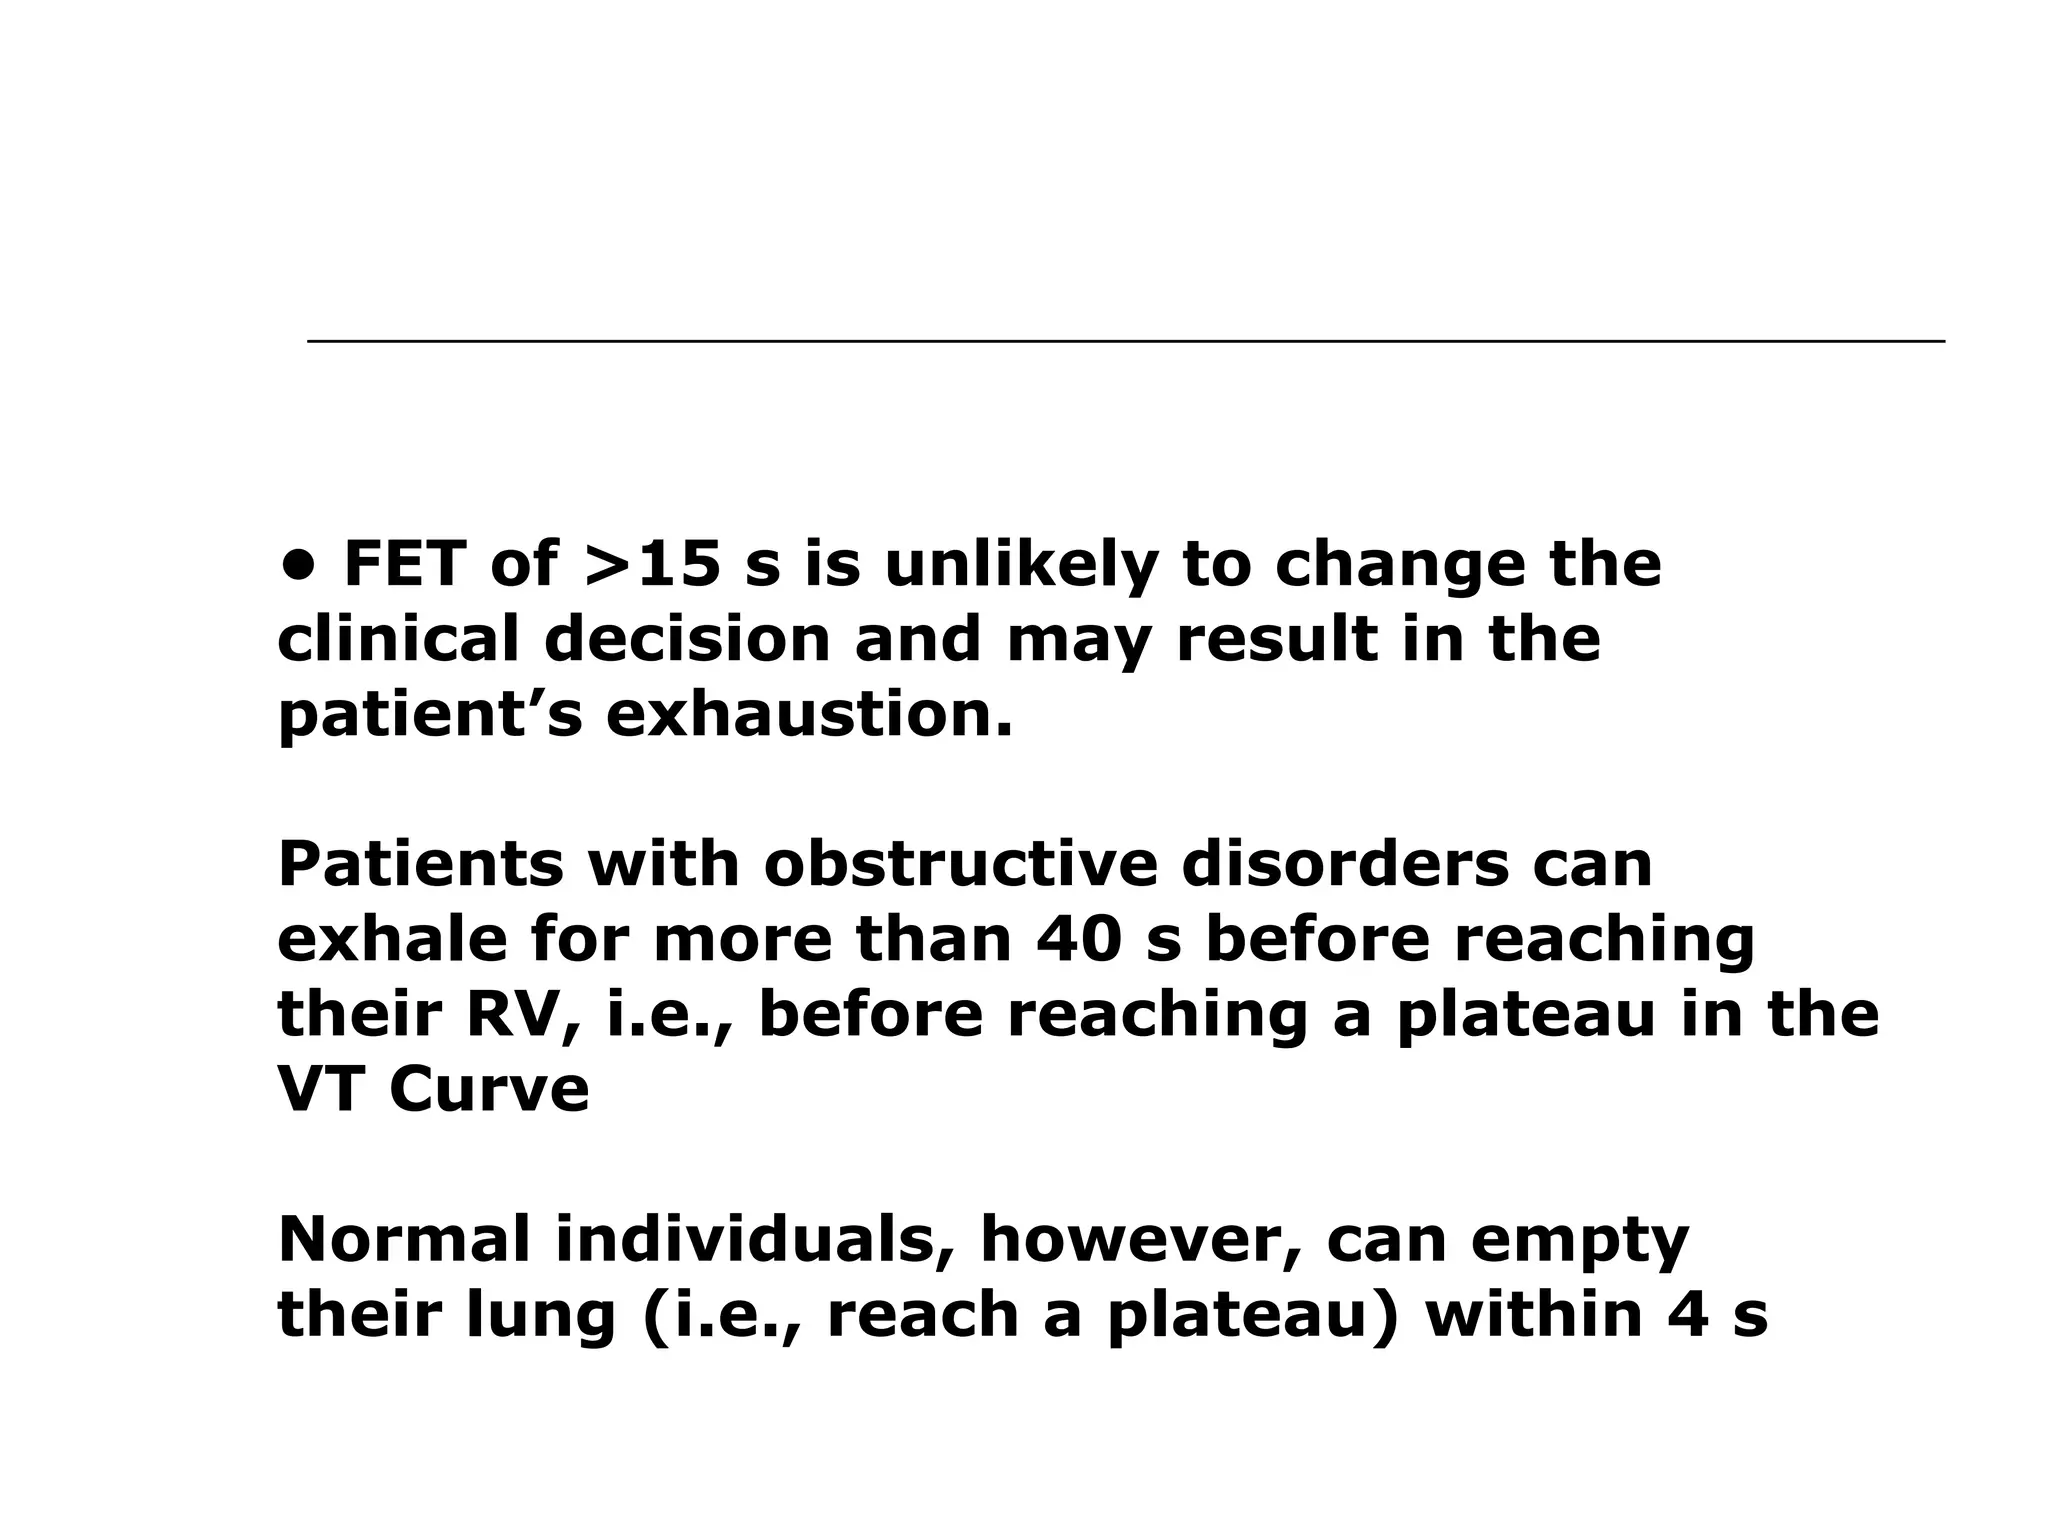
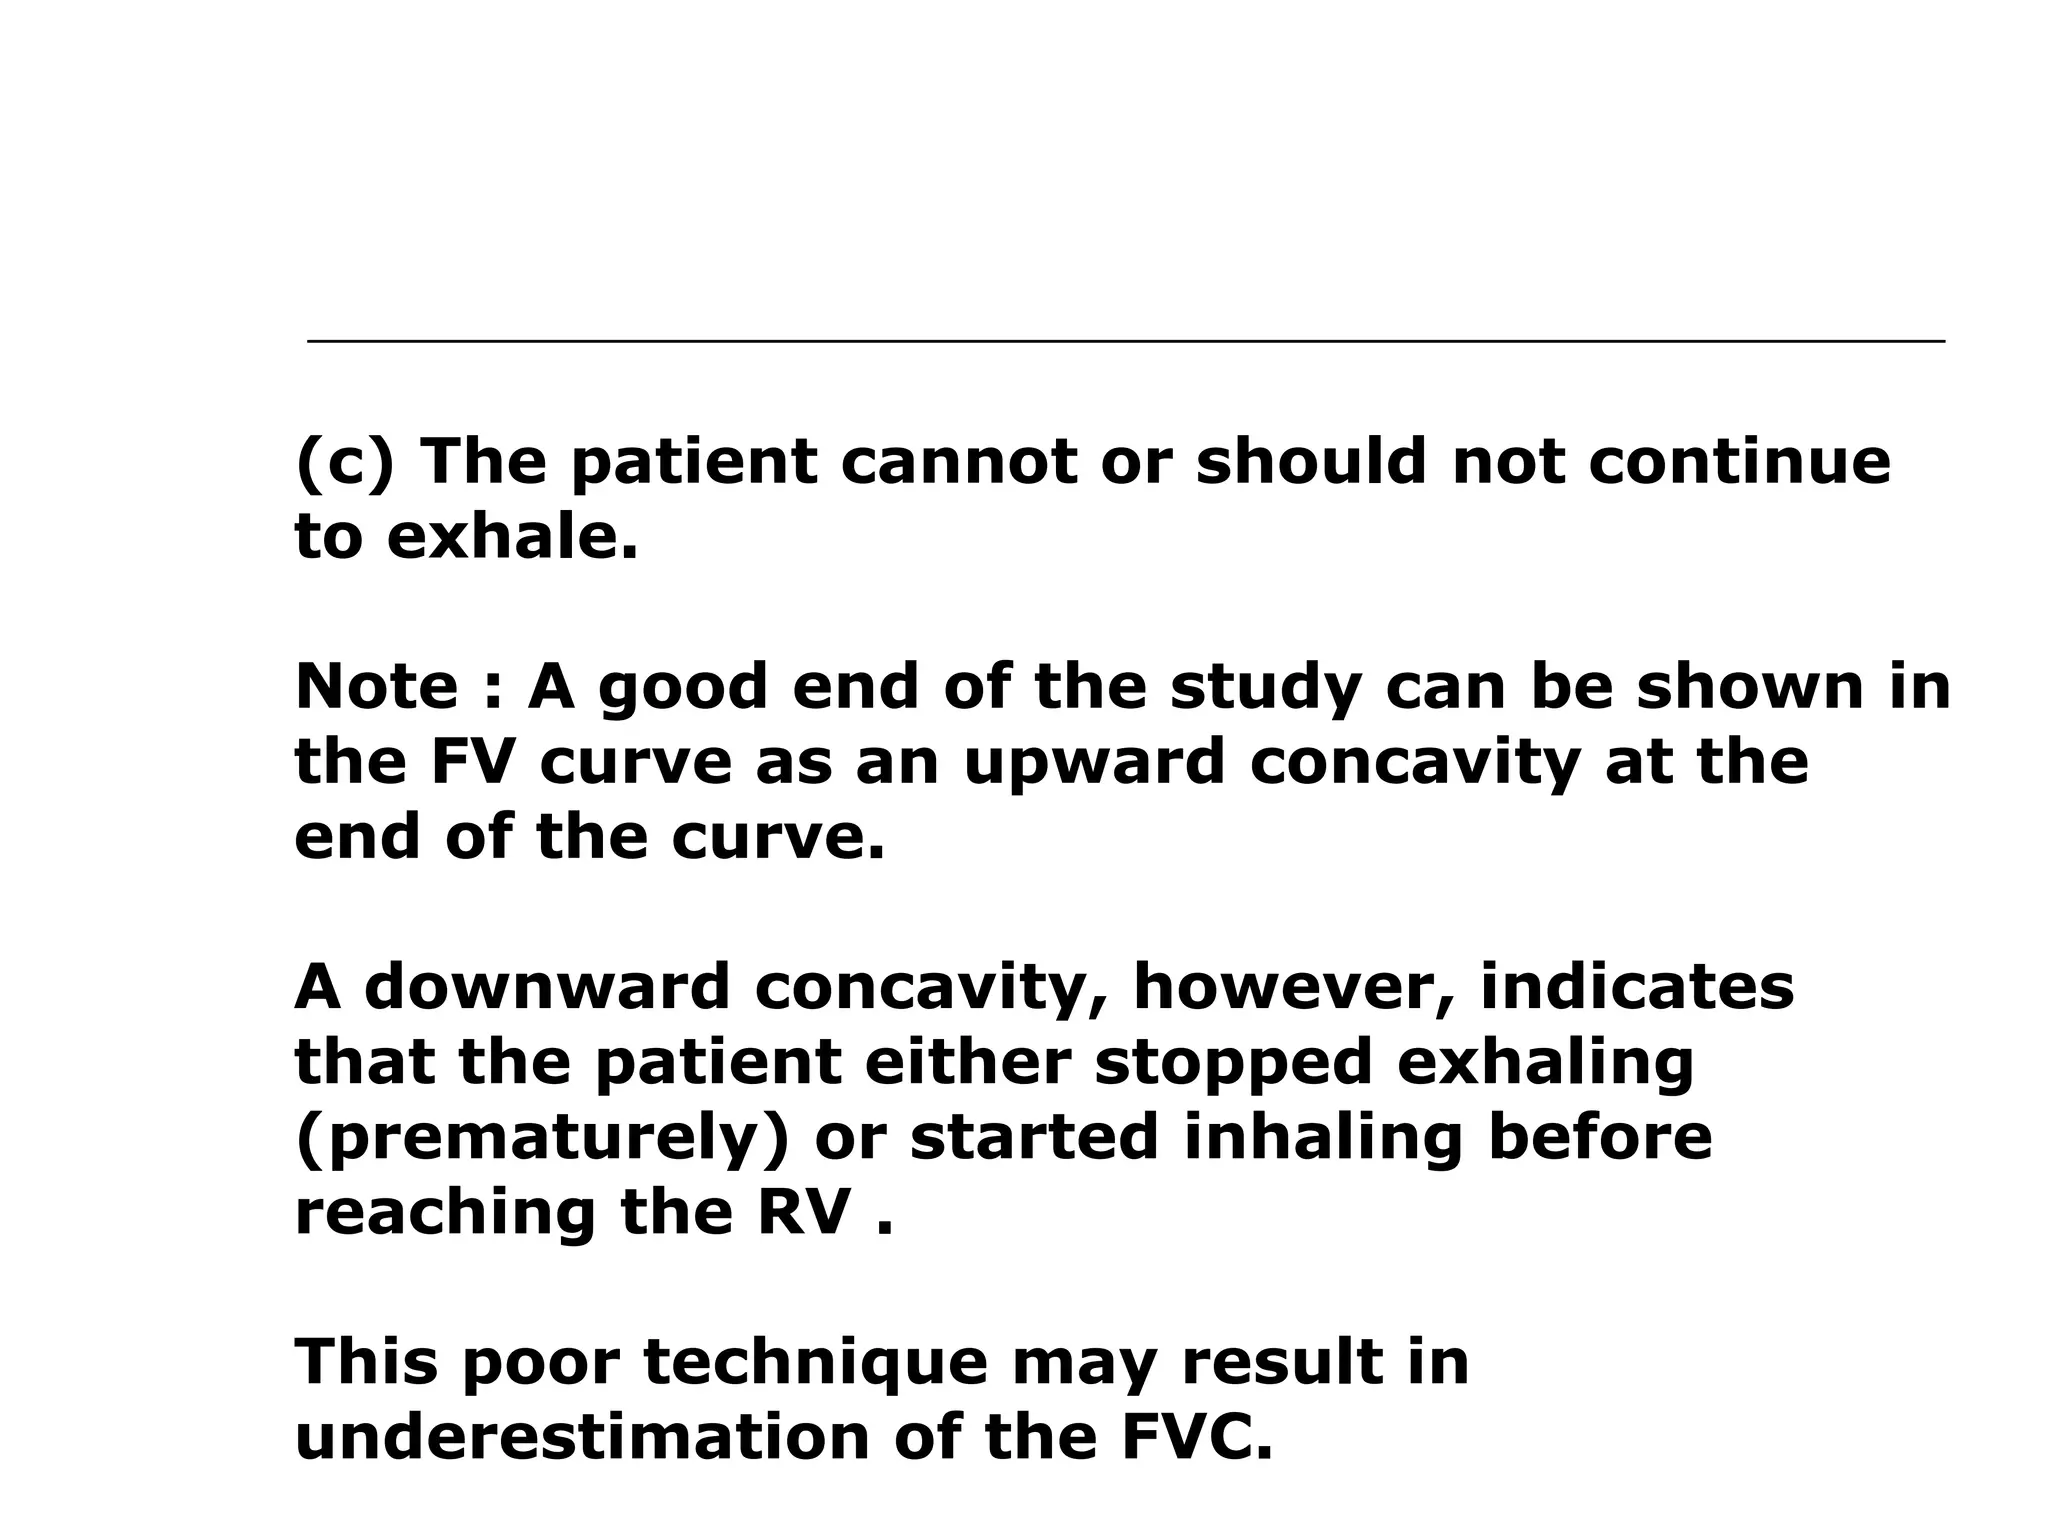
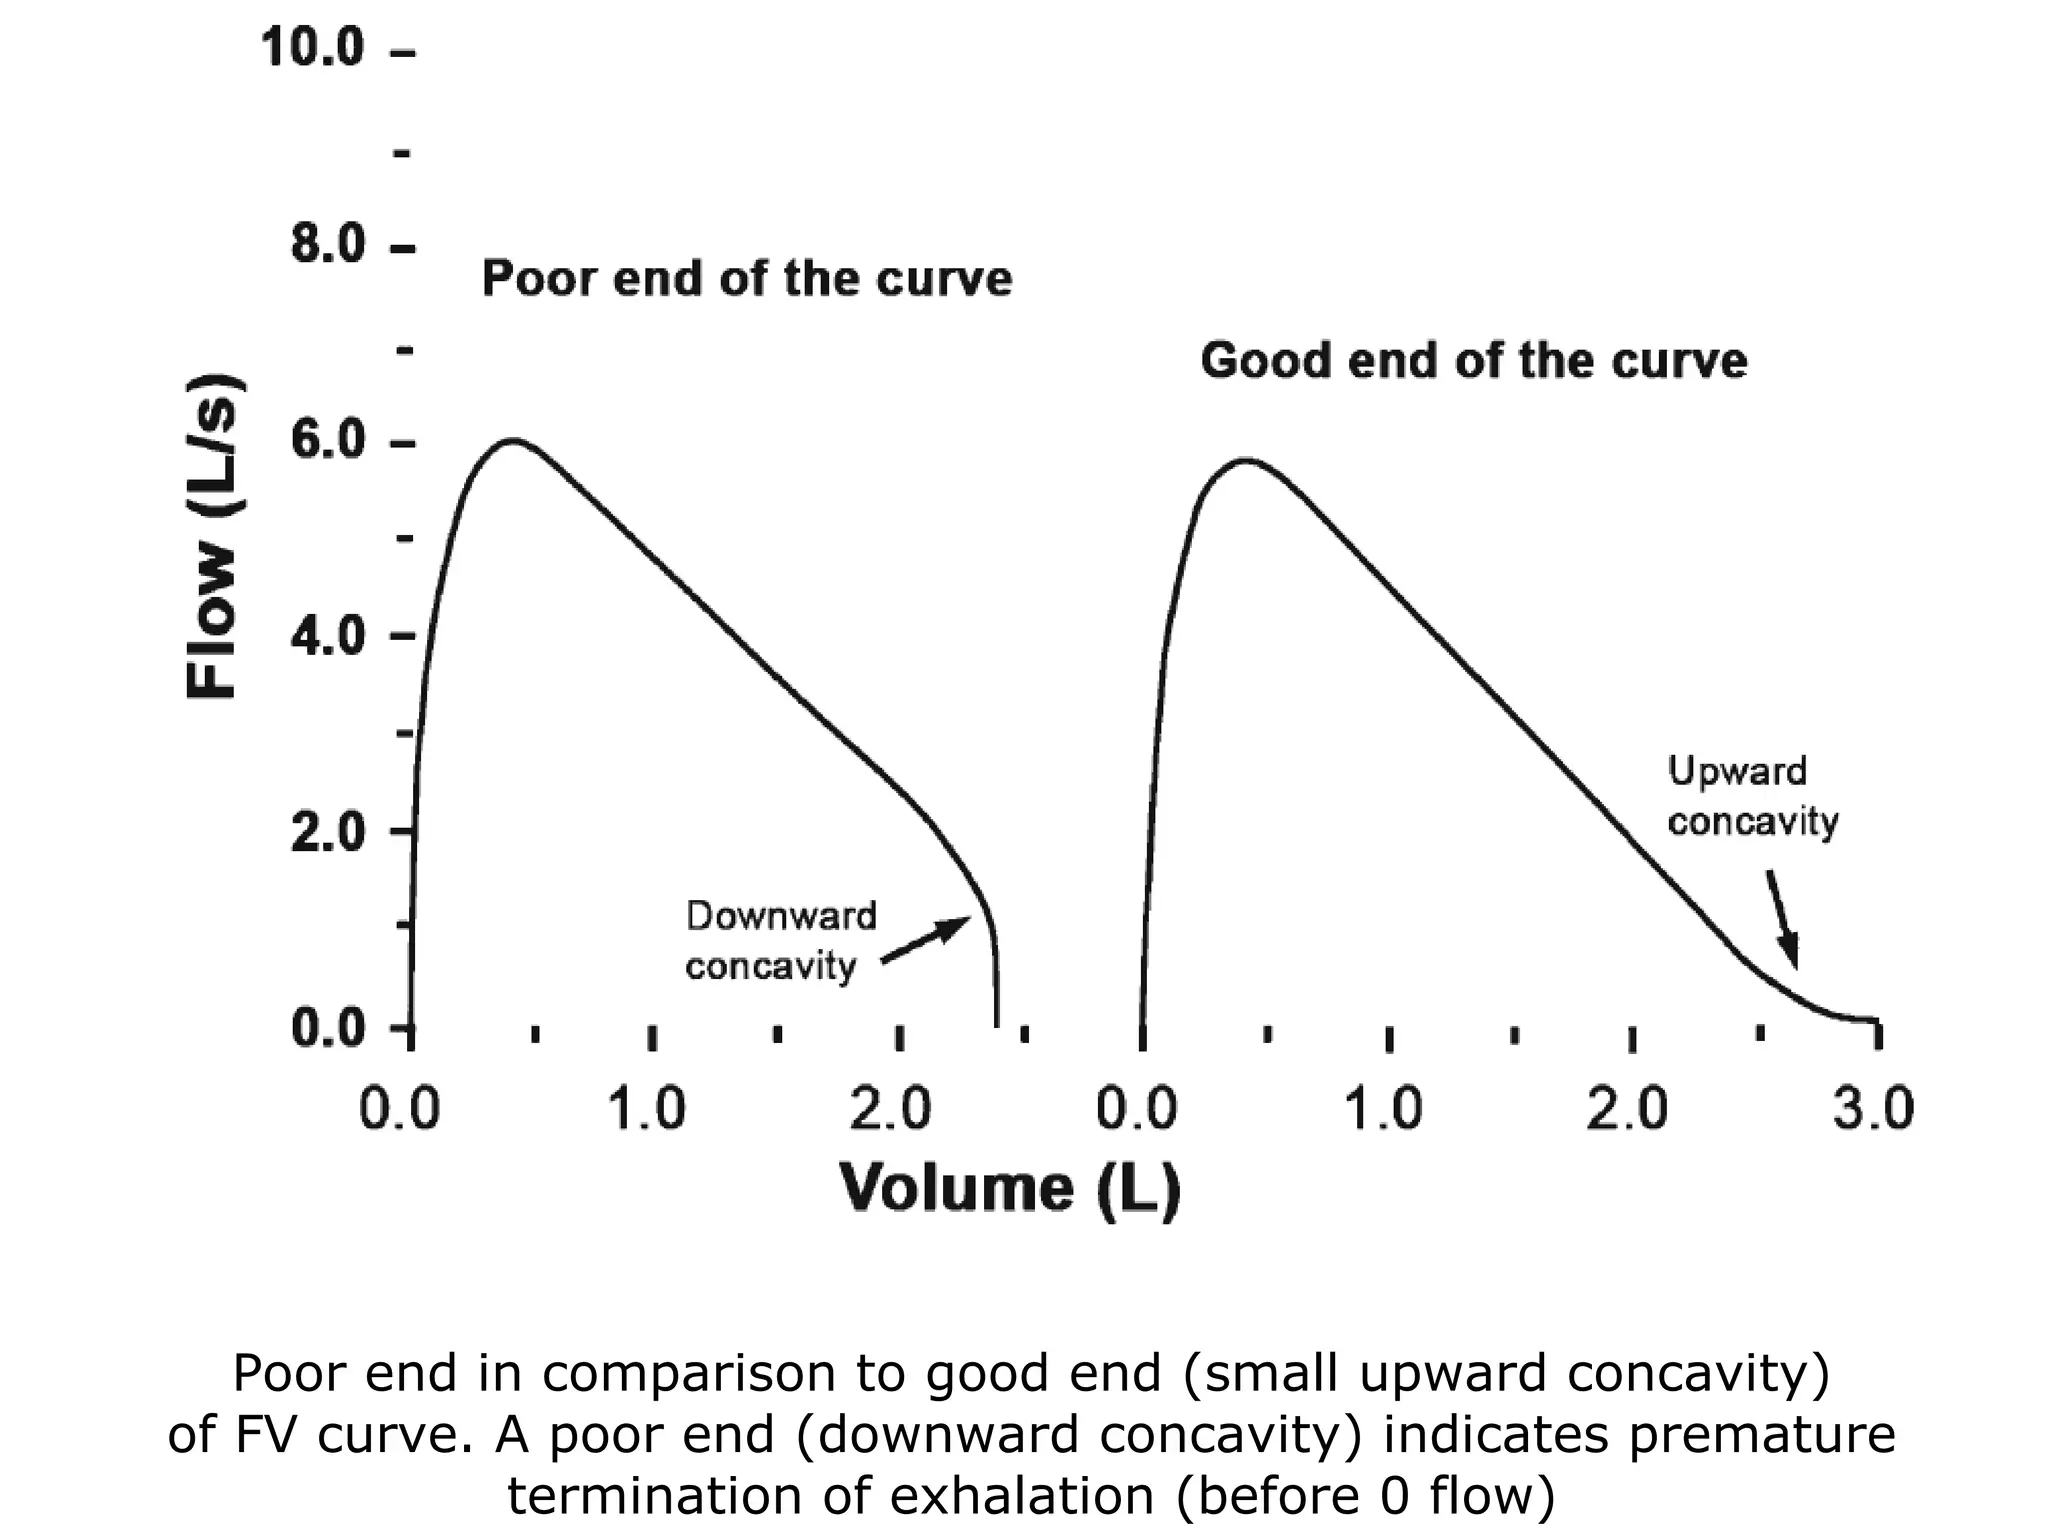
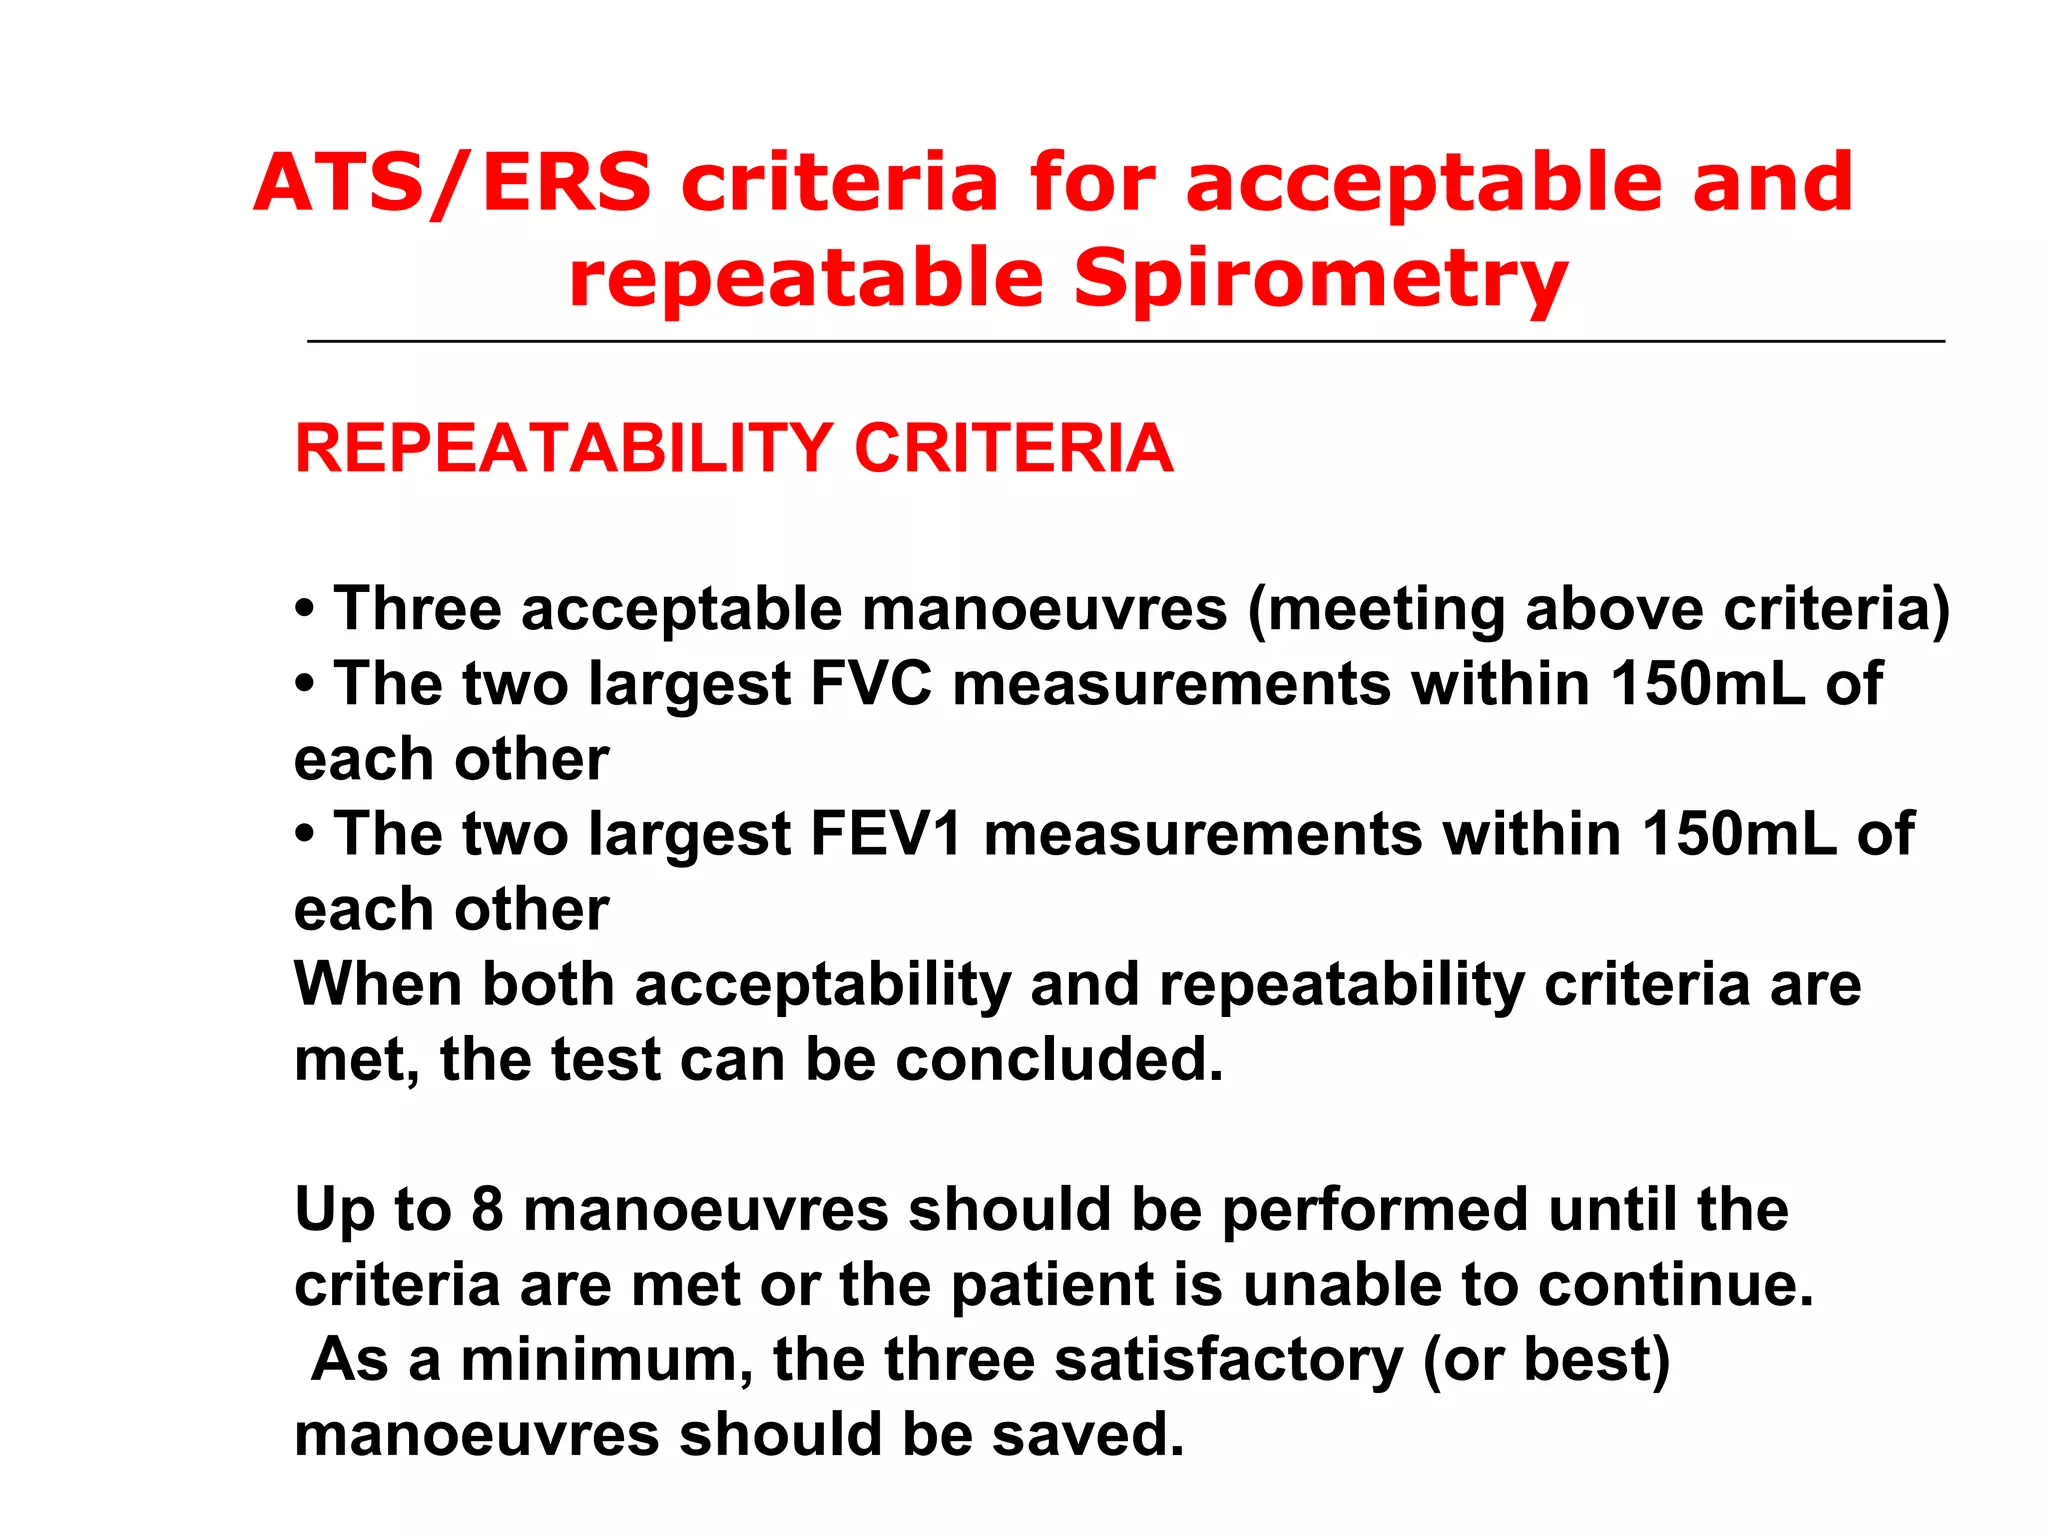
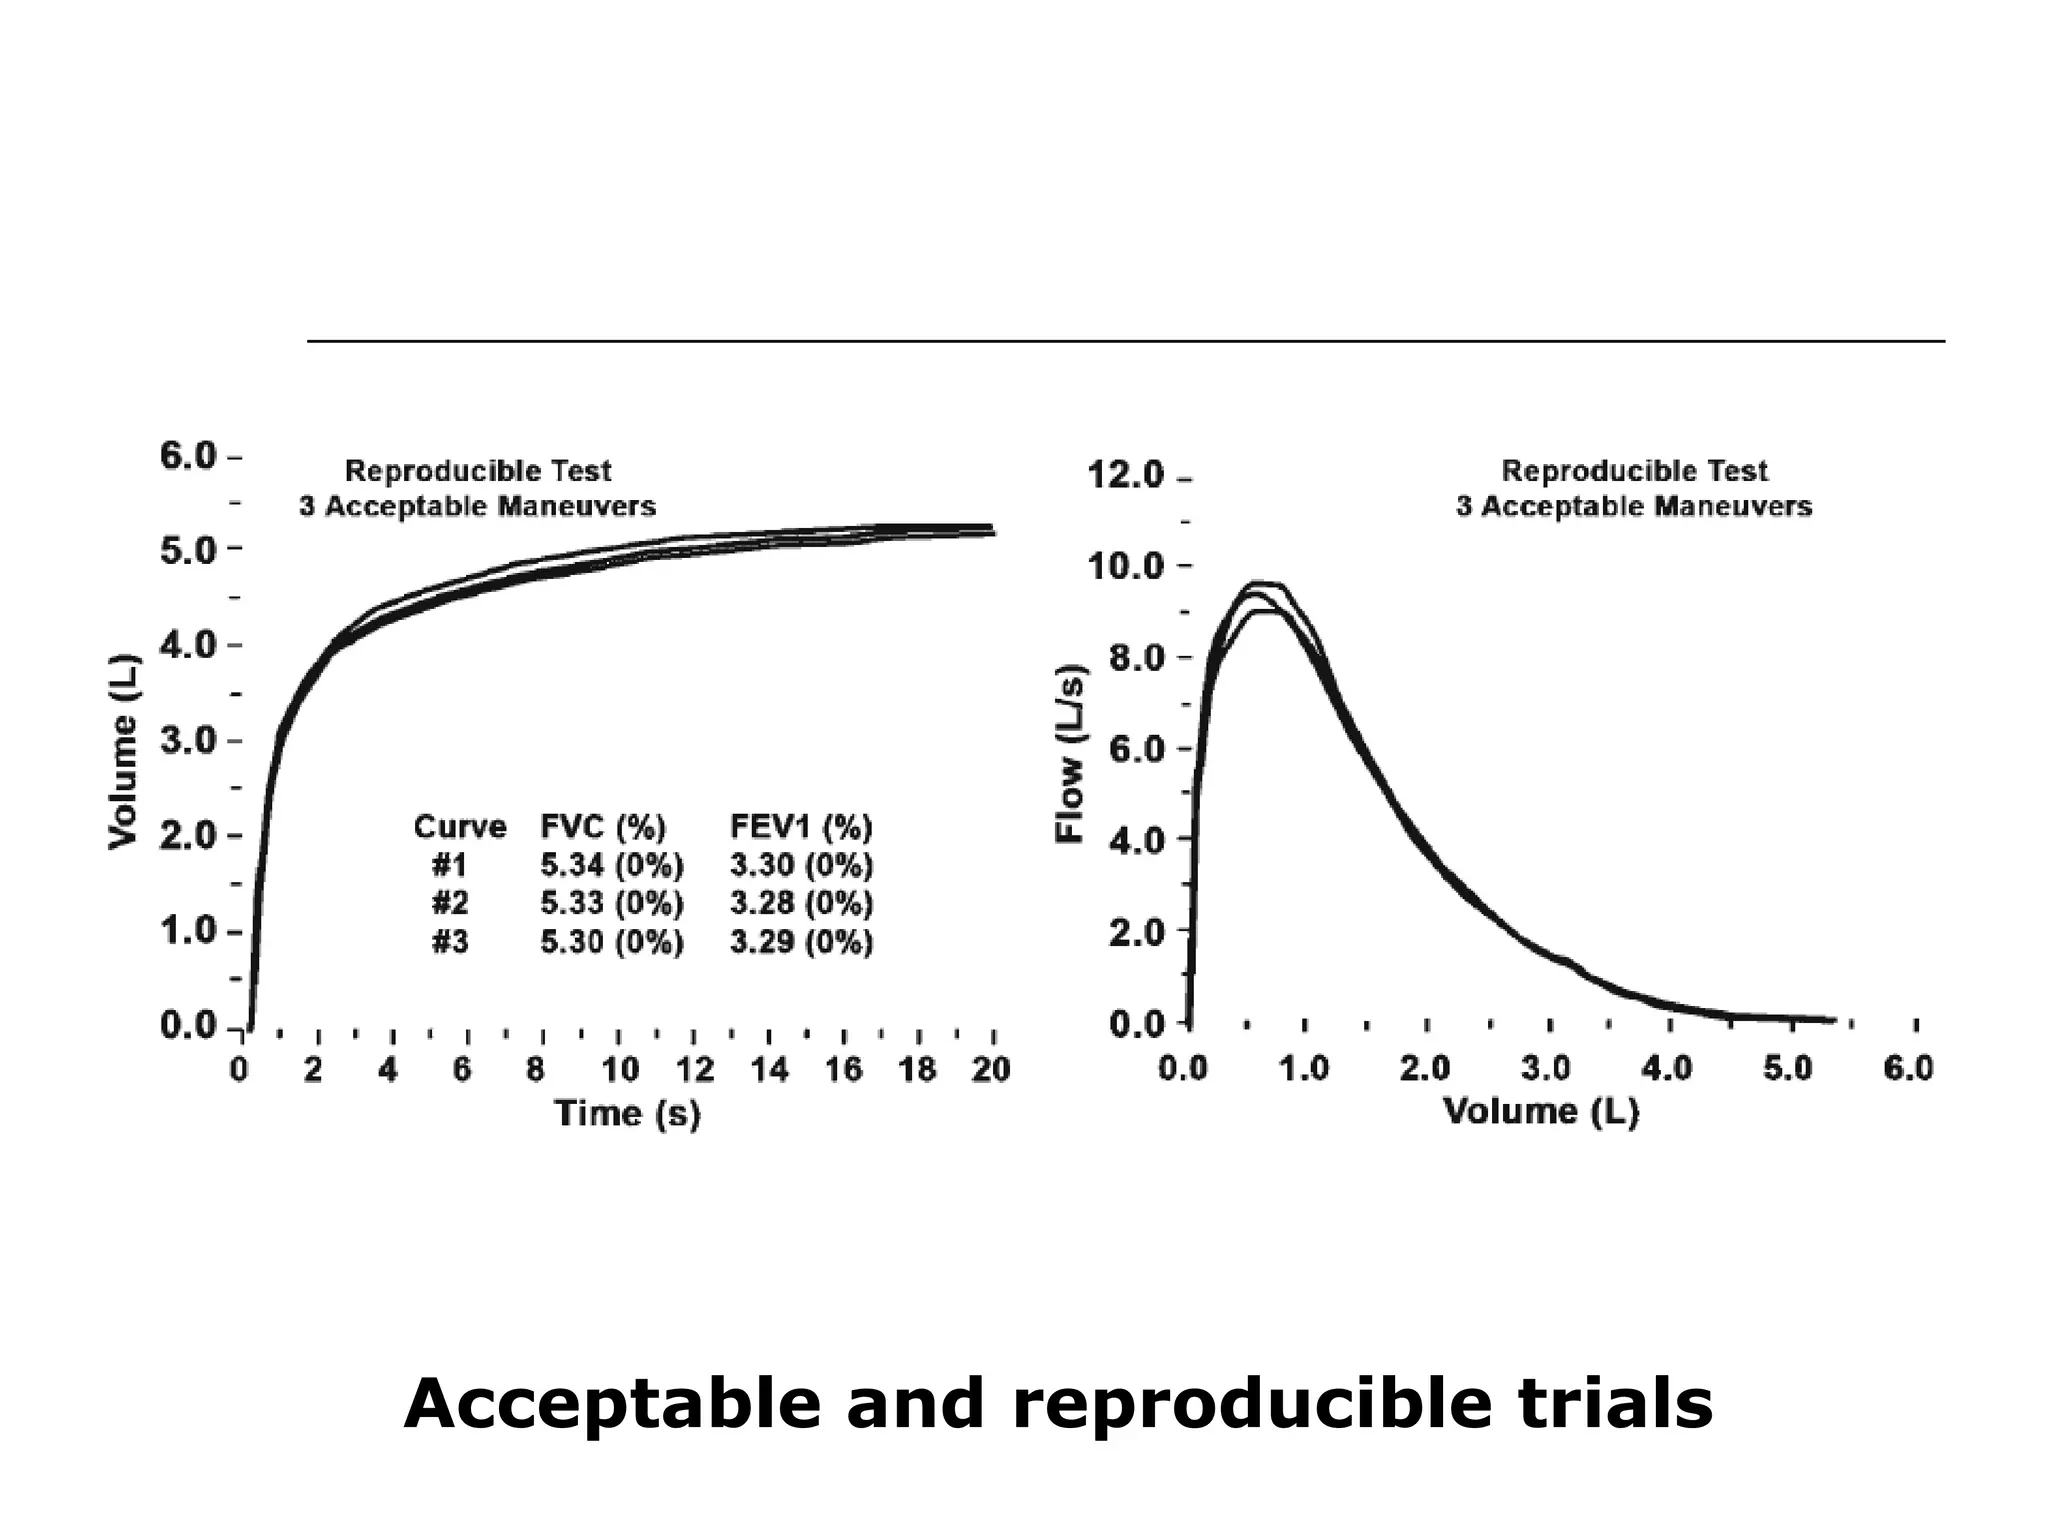
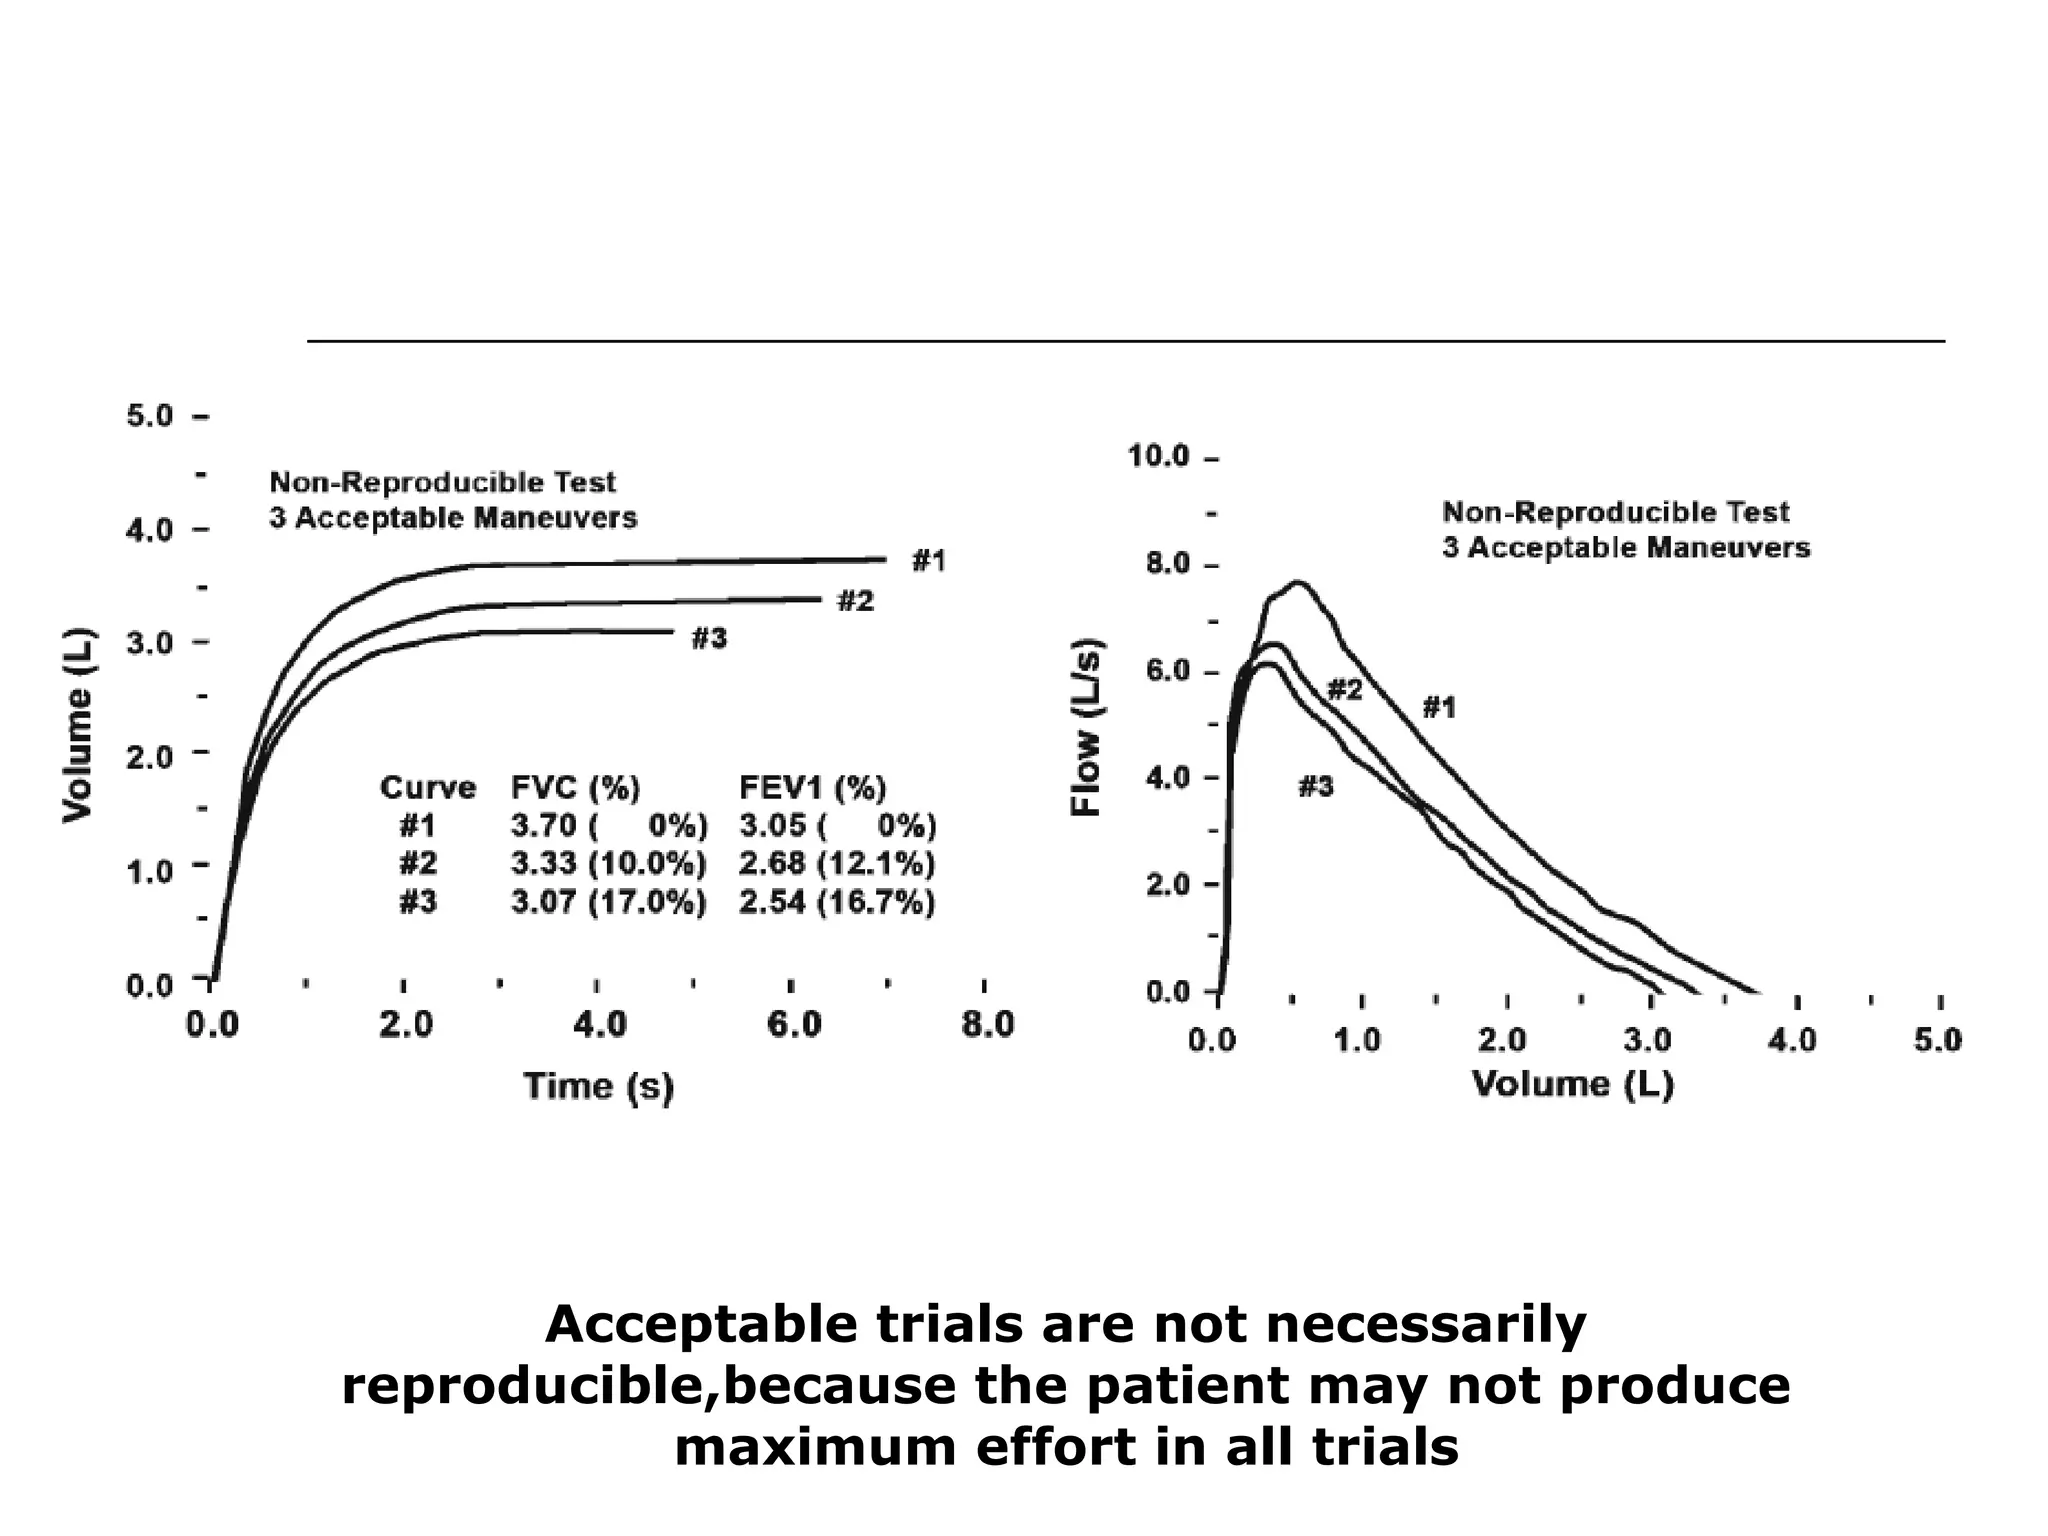
ATS/ERS criteria for acceptable and repeatable spirometry and examples of acceptable curves.
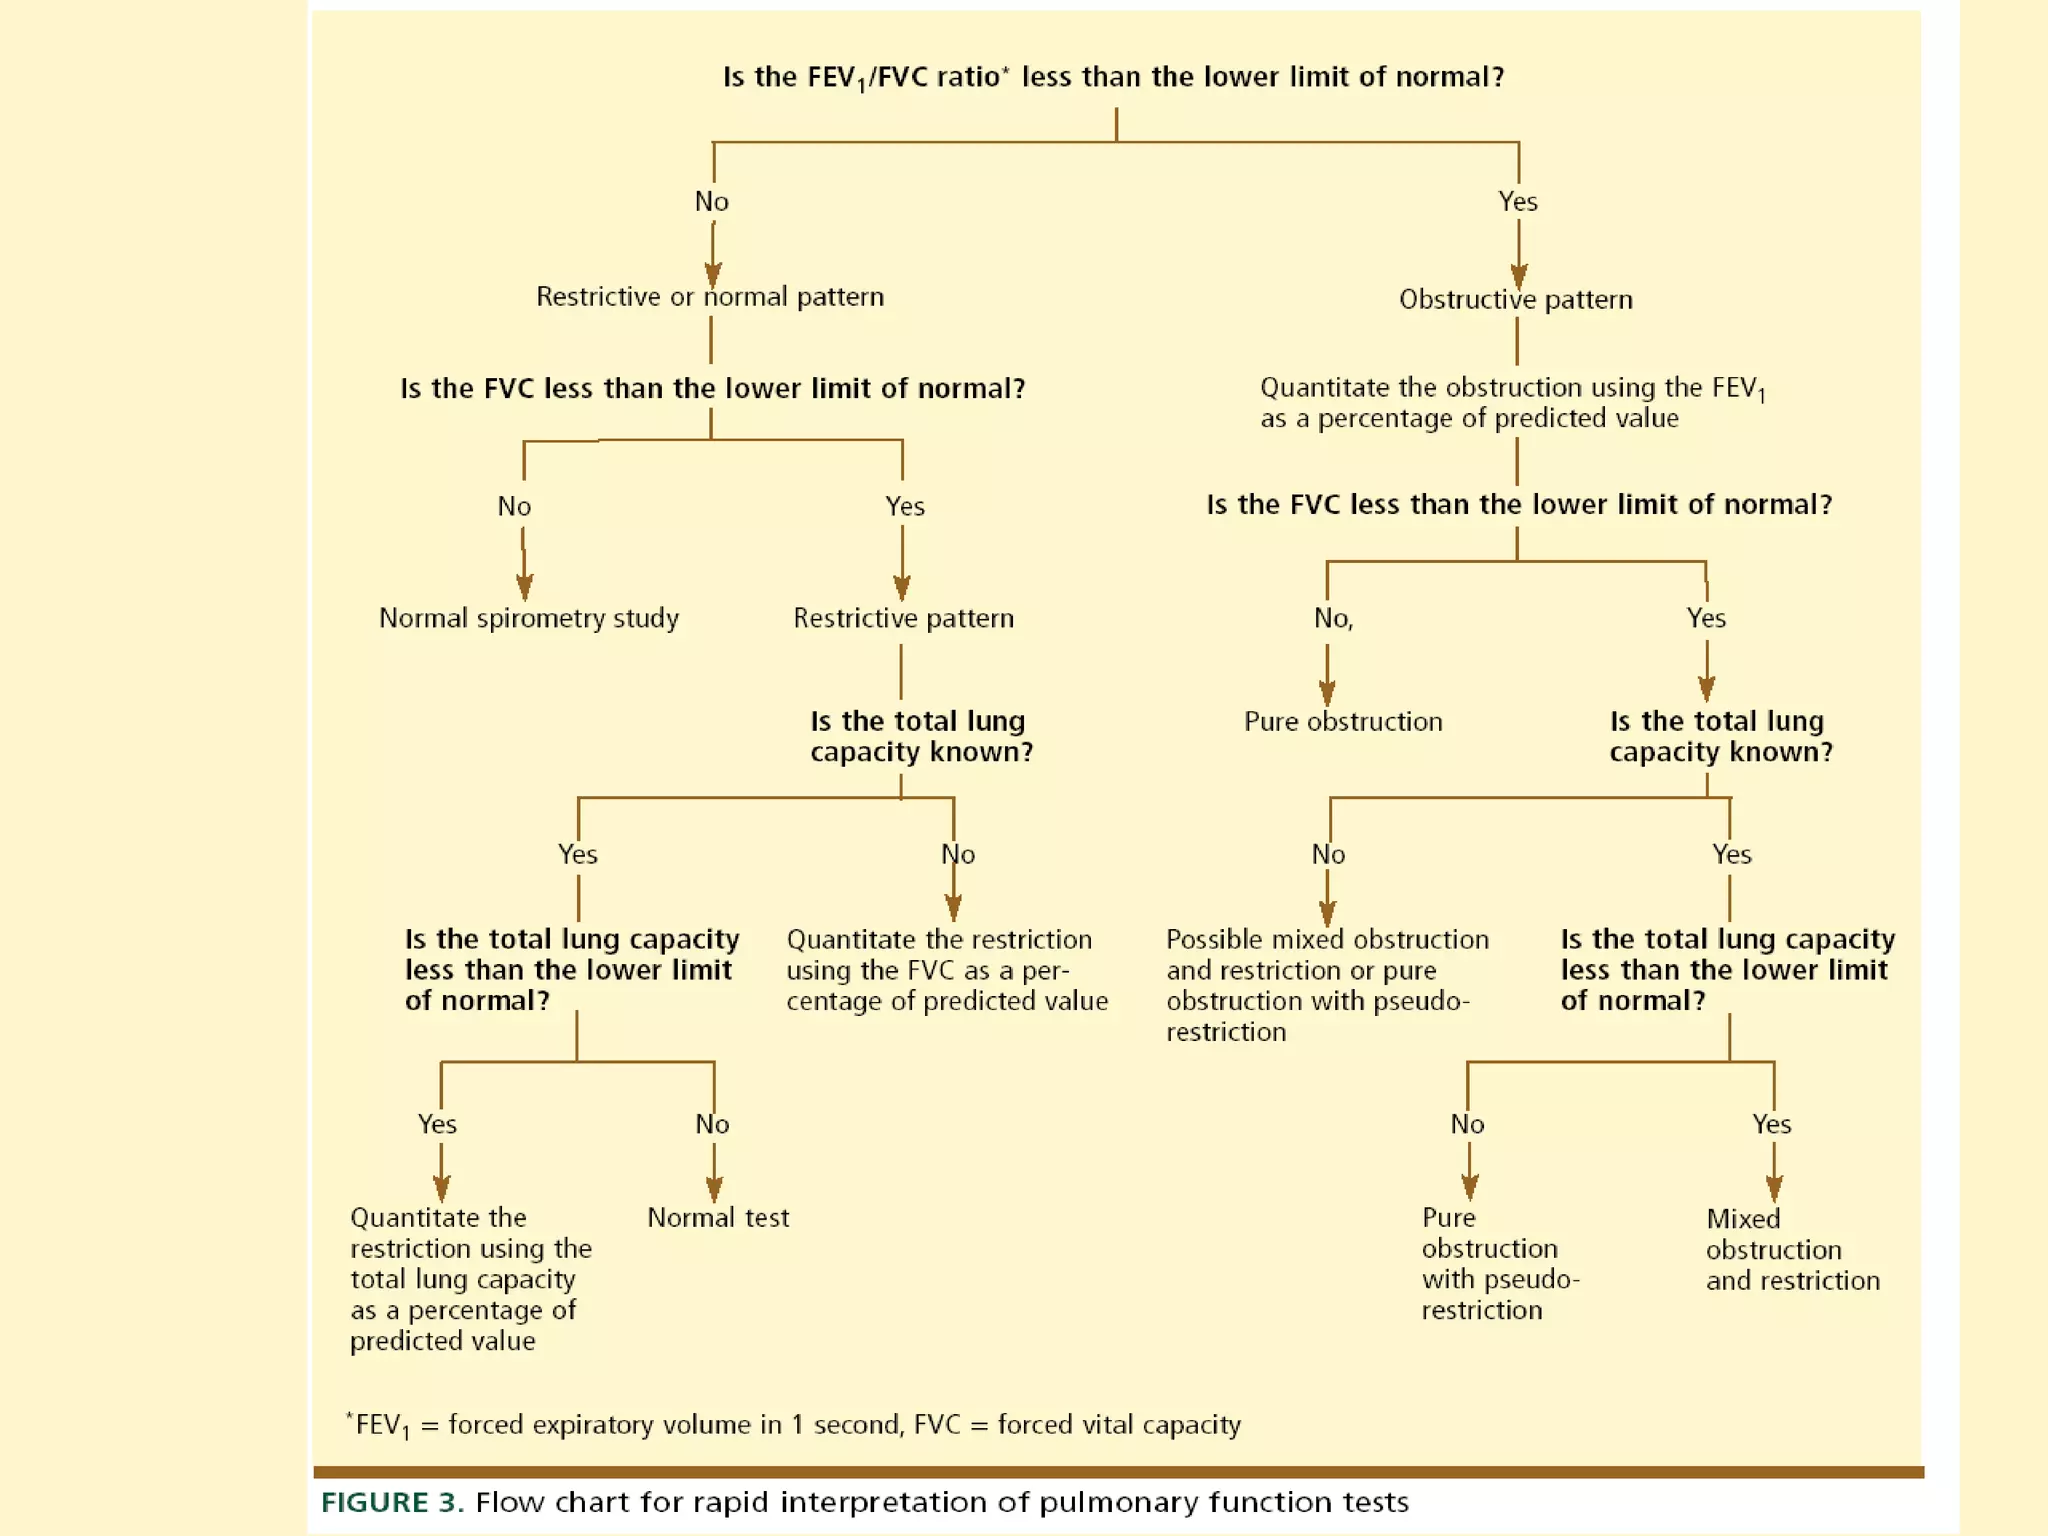
Criteria for interpreting spirometry results: Obstruction vs Restriction, quality of measurements.
Flow diagrams for diagnosing obstructive and restrictive defects with spirometry definitions.
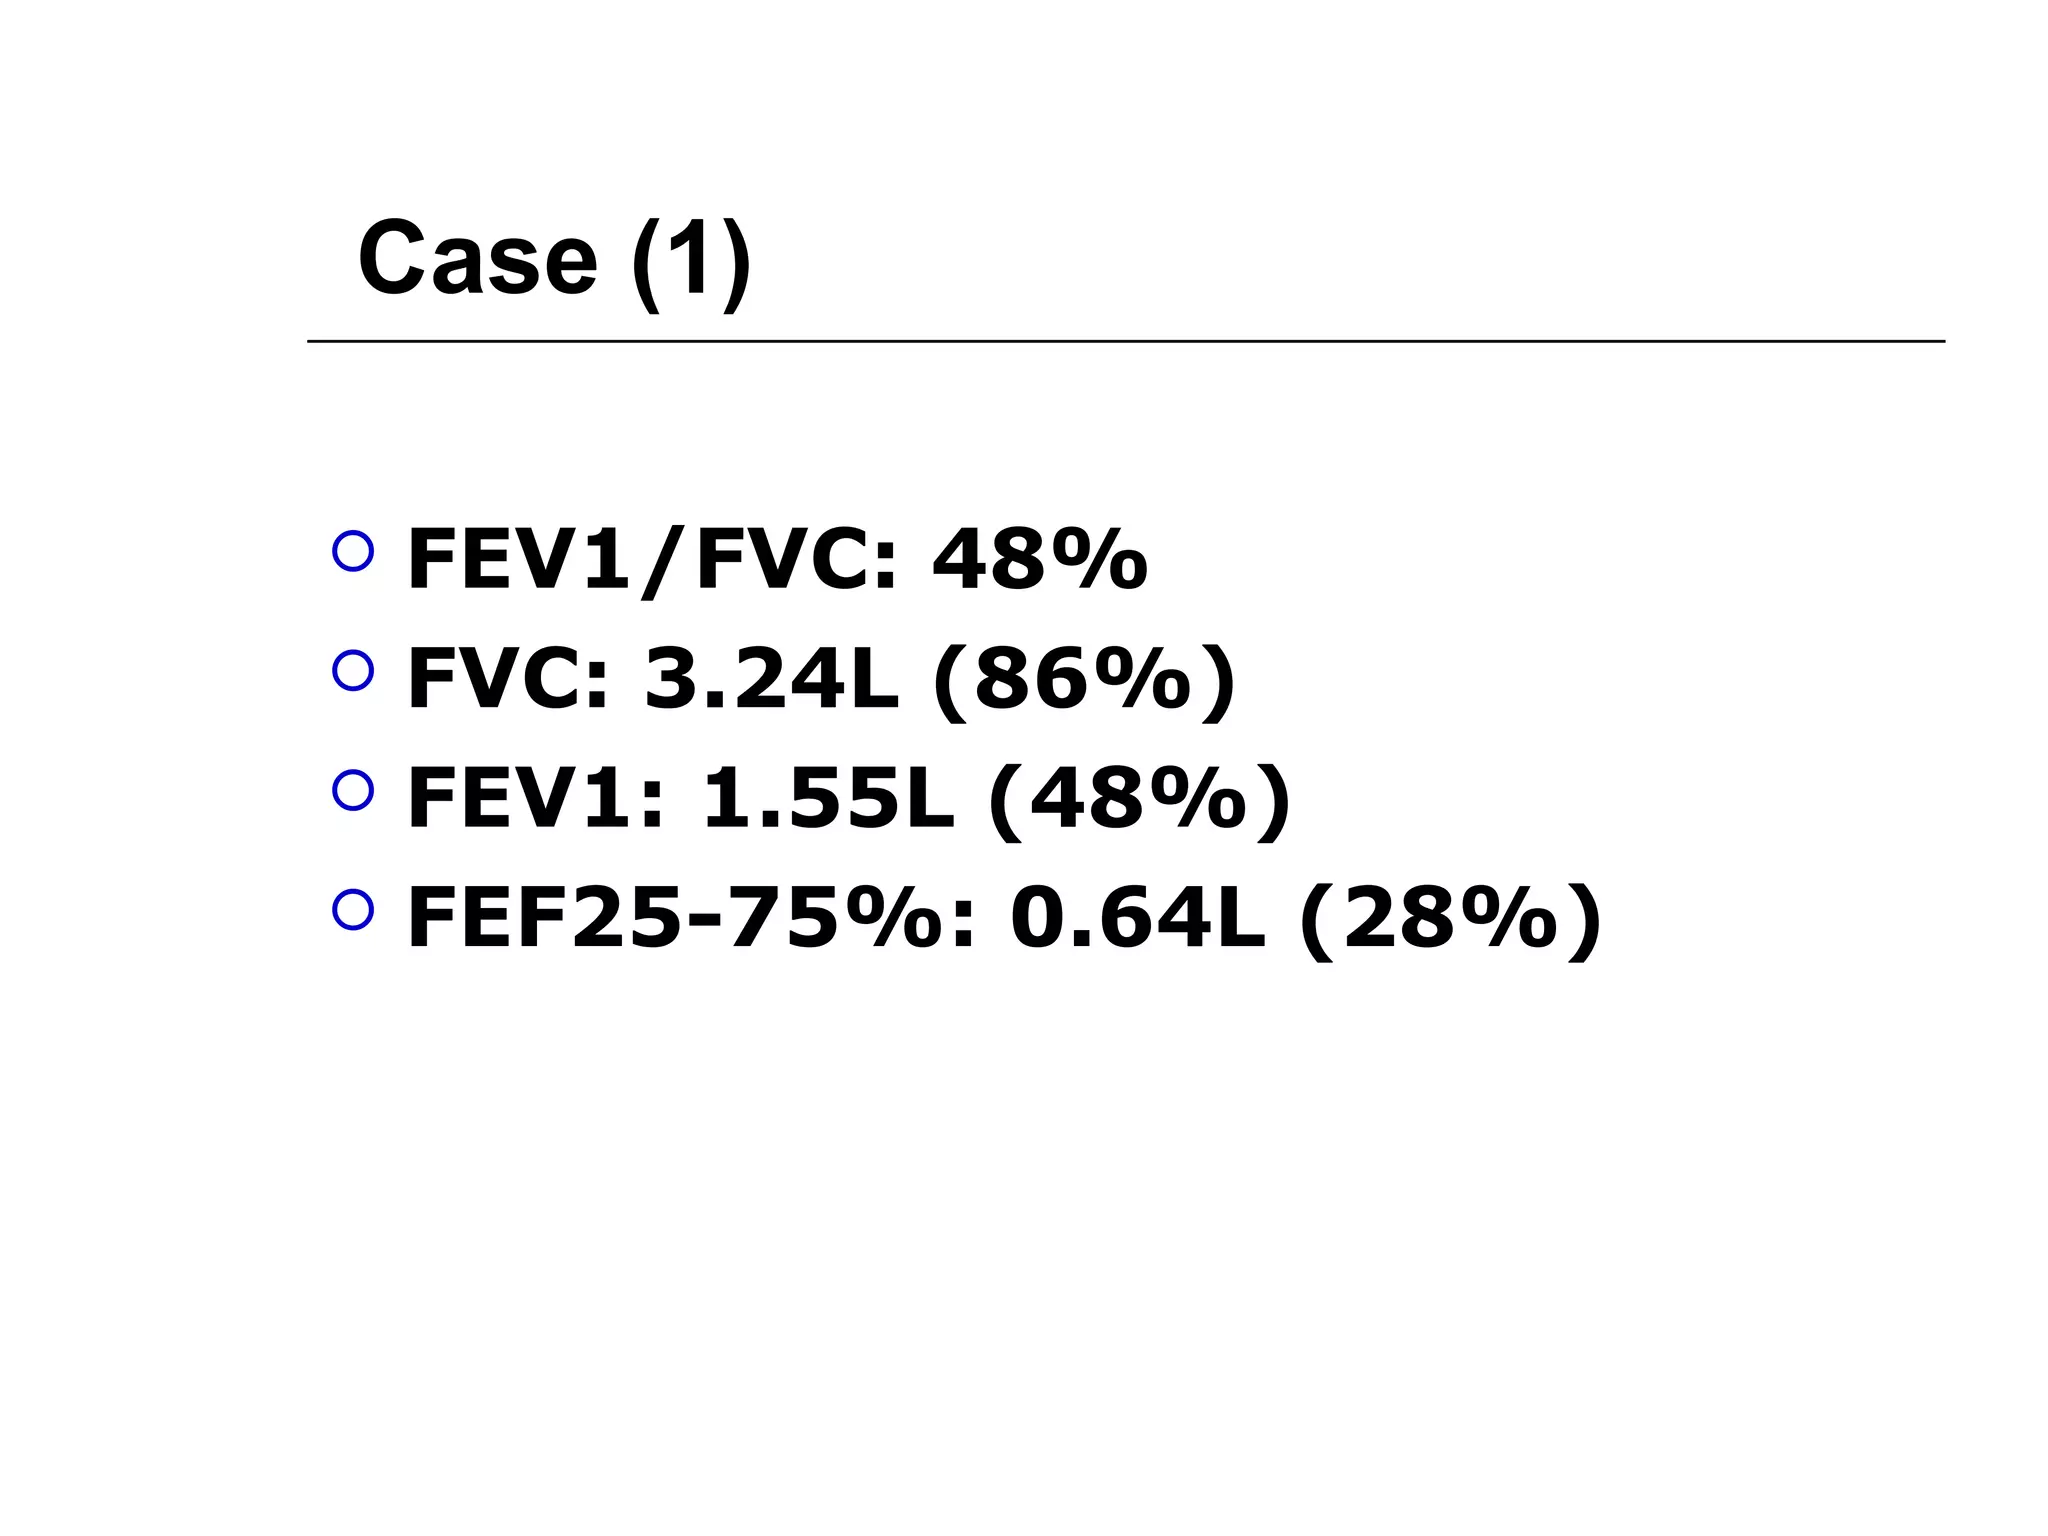
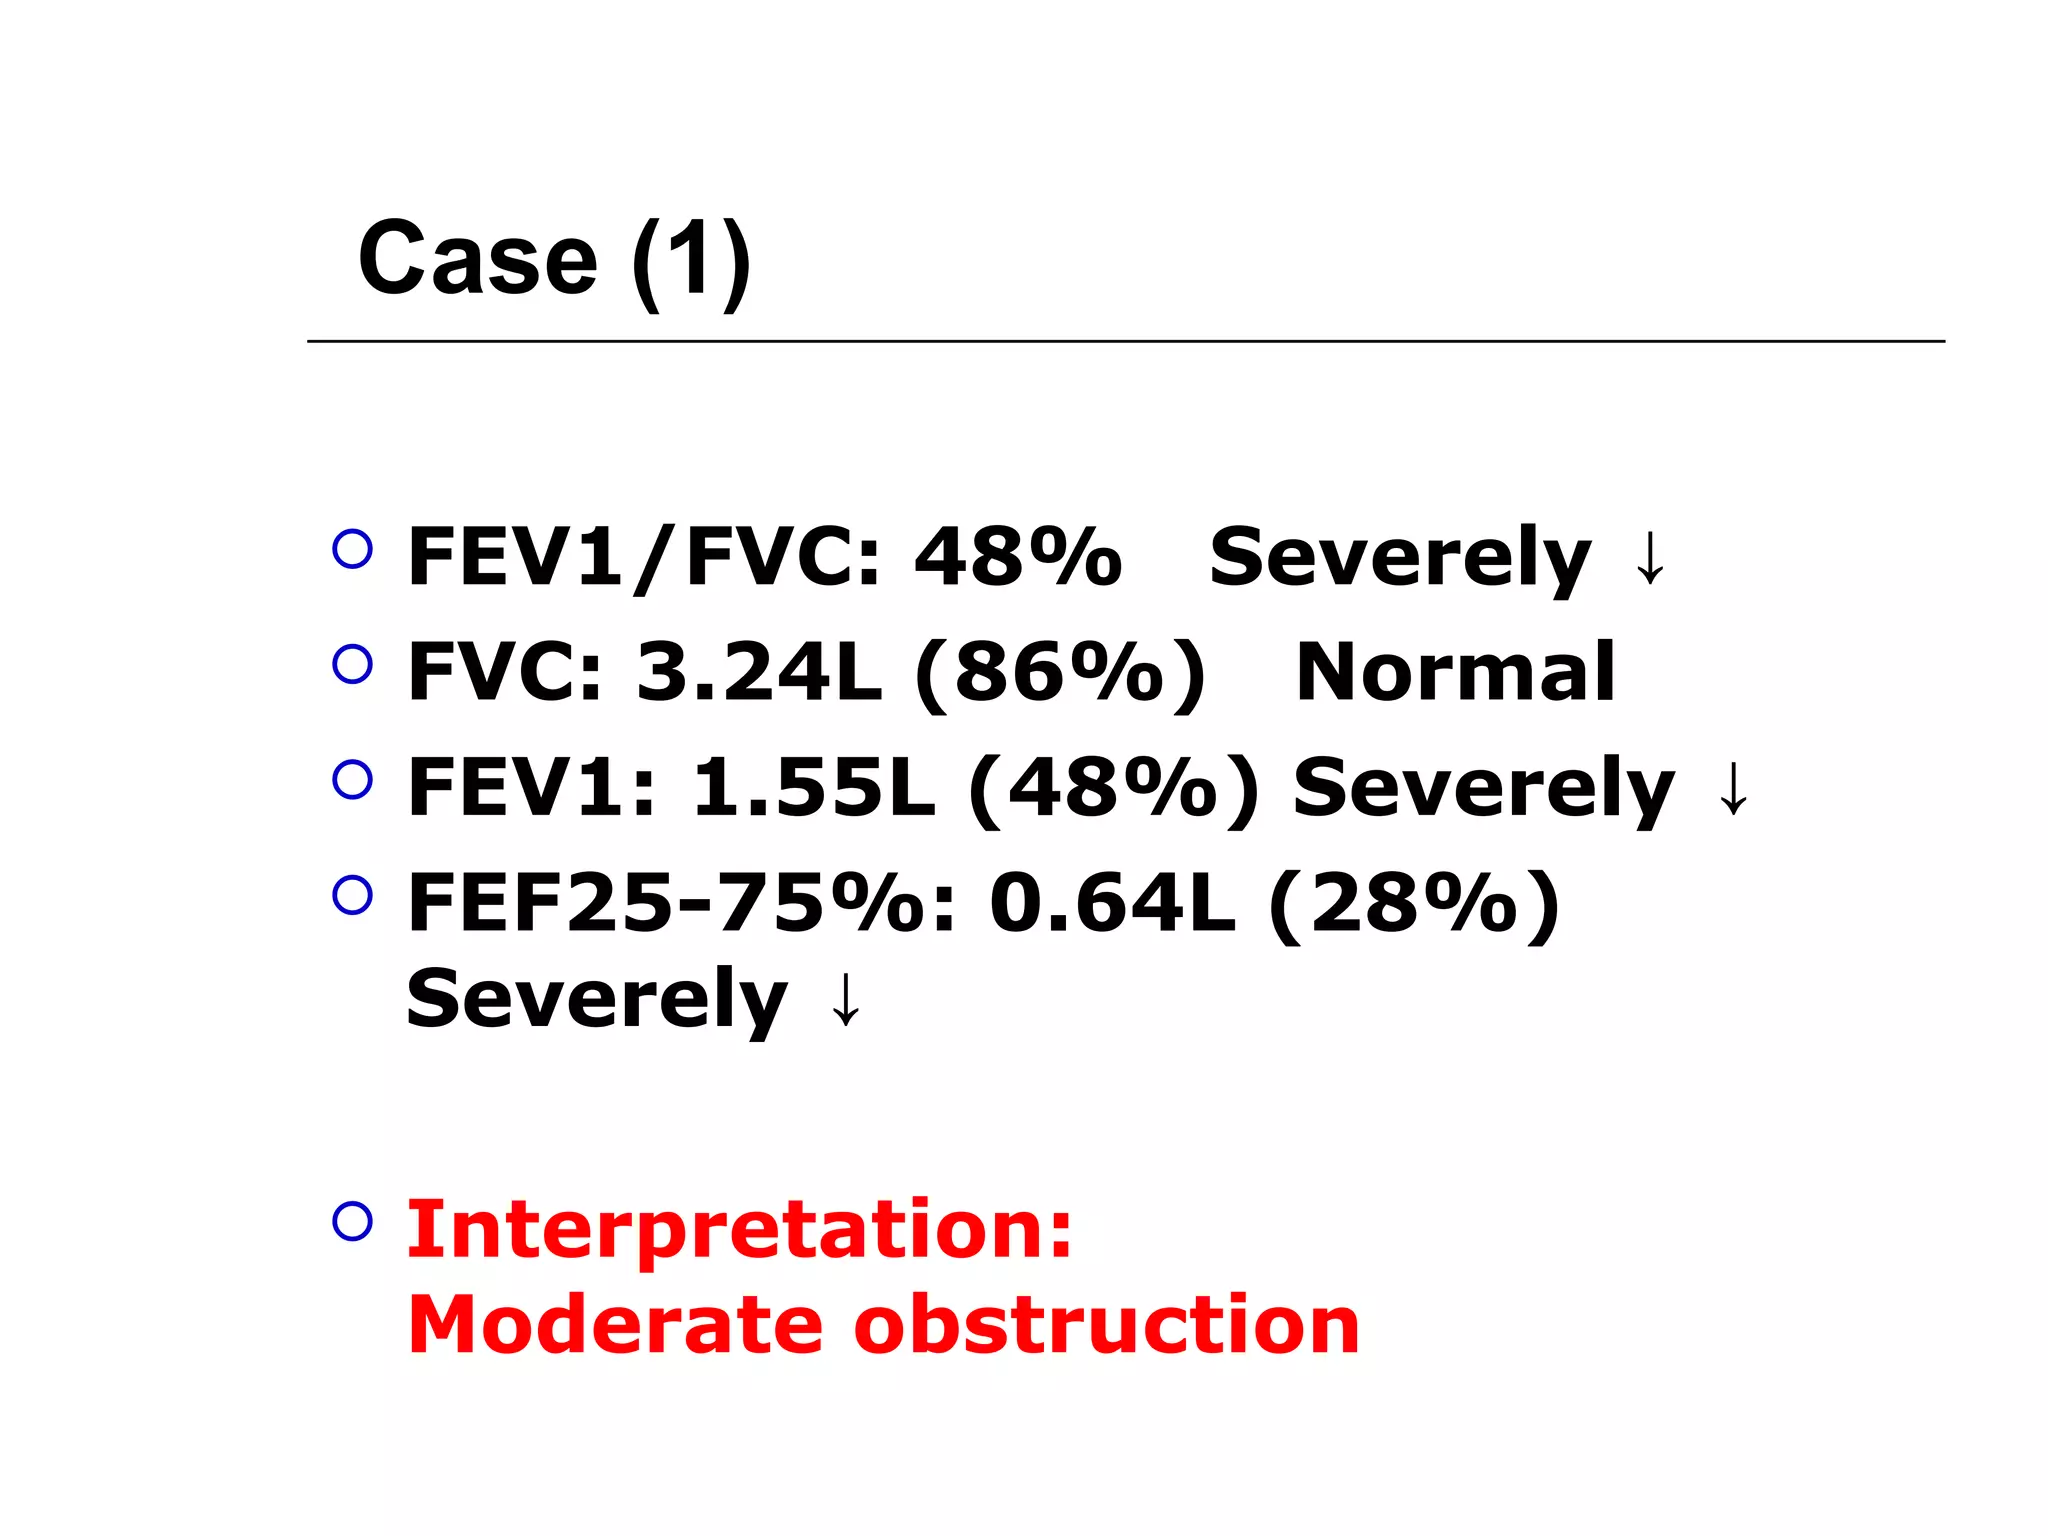
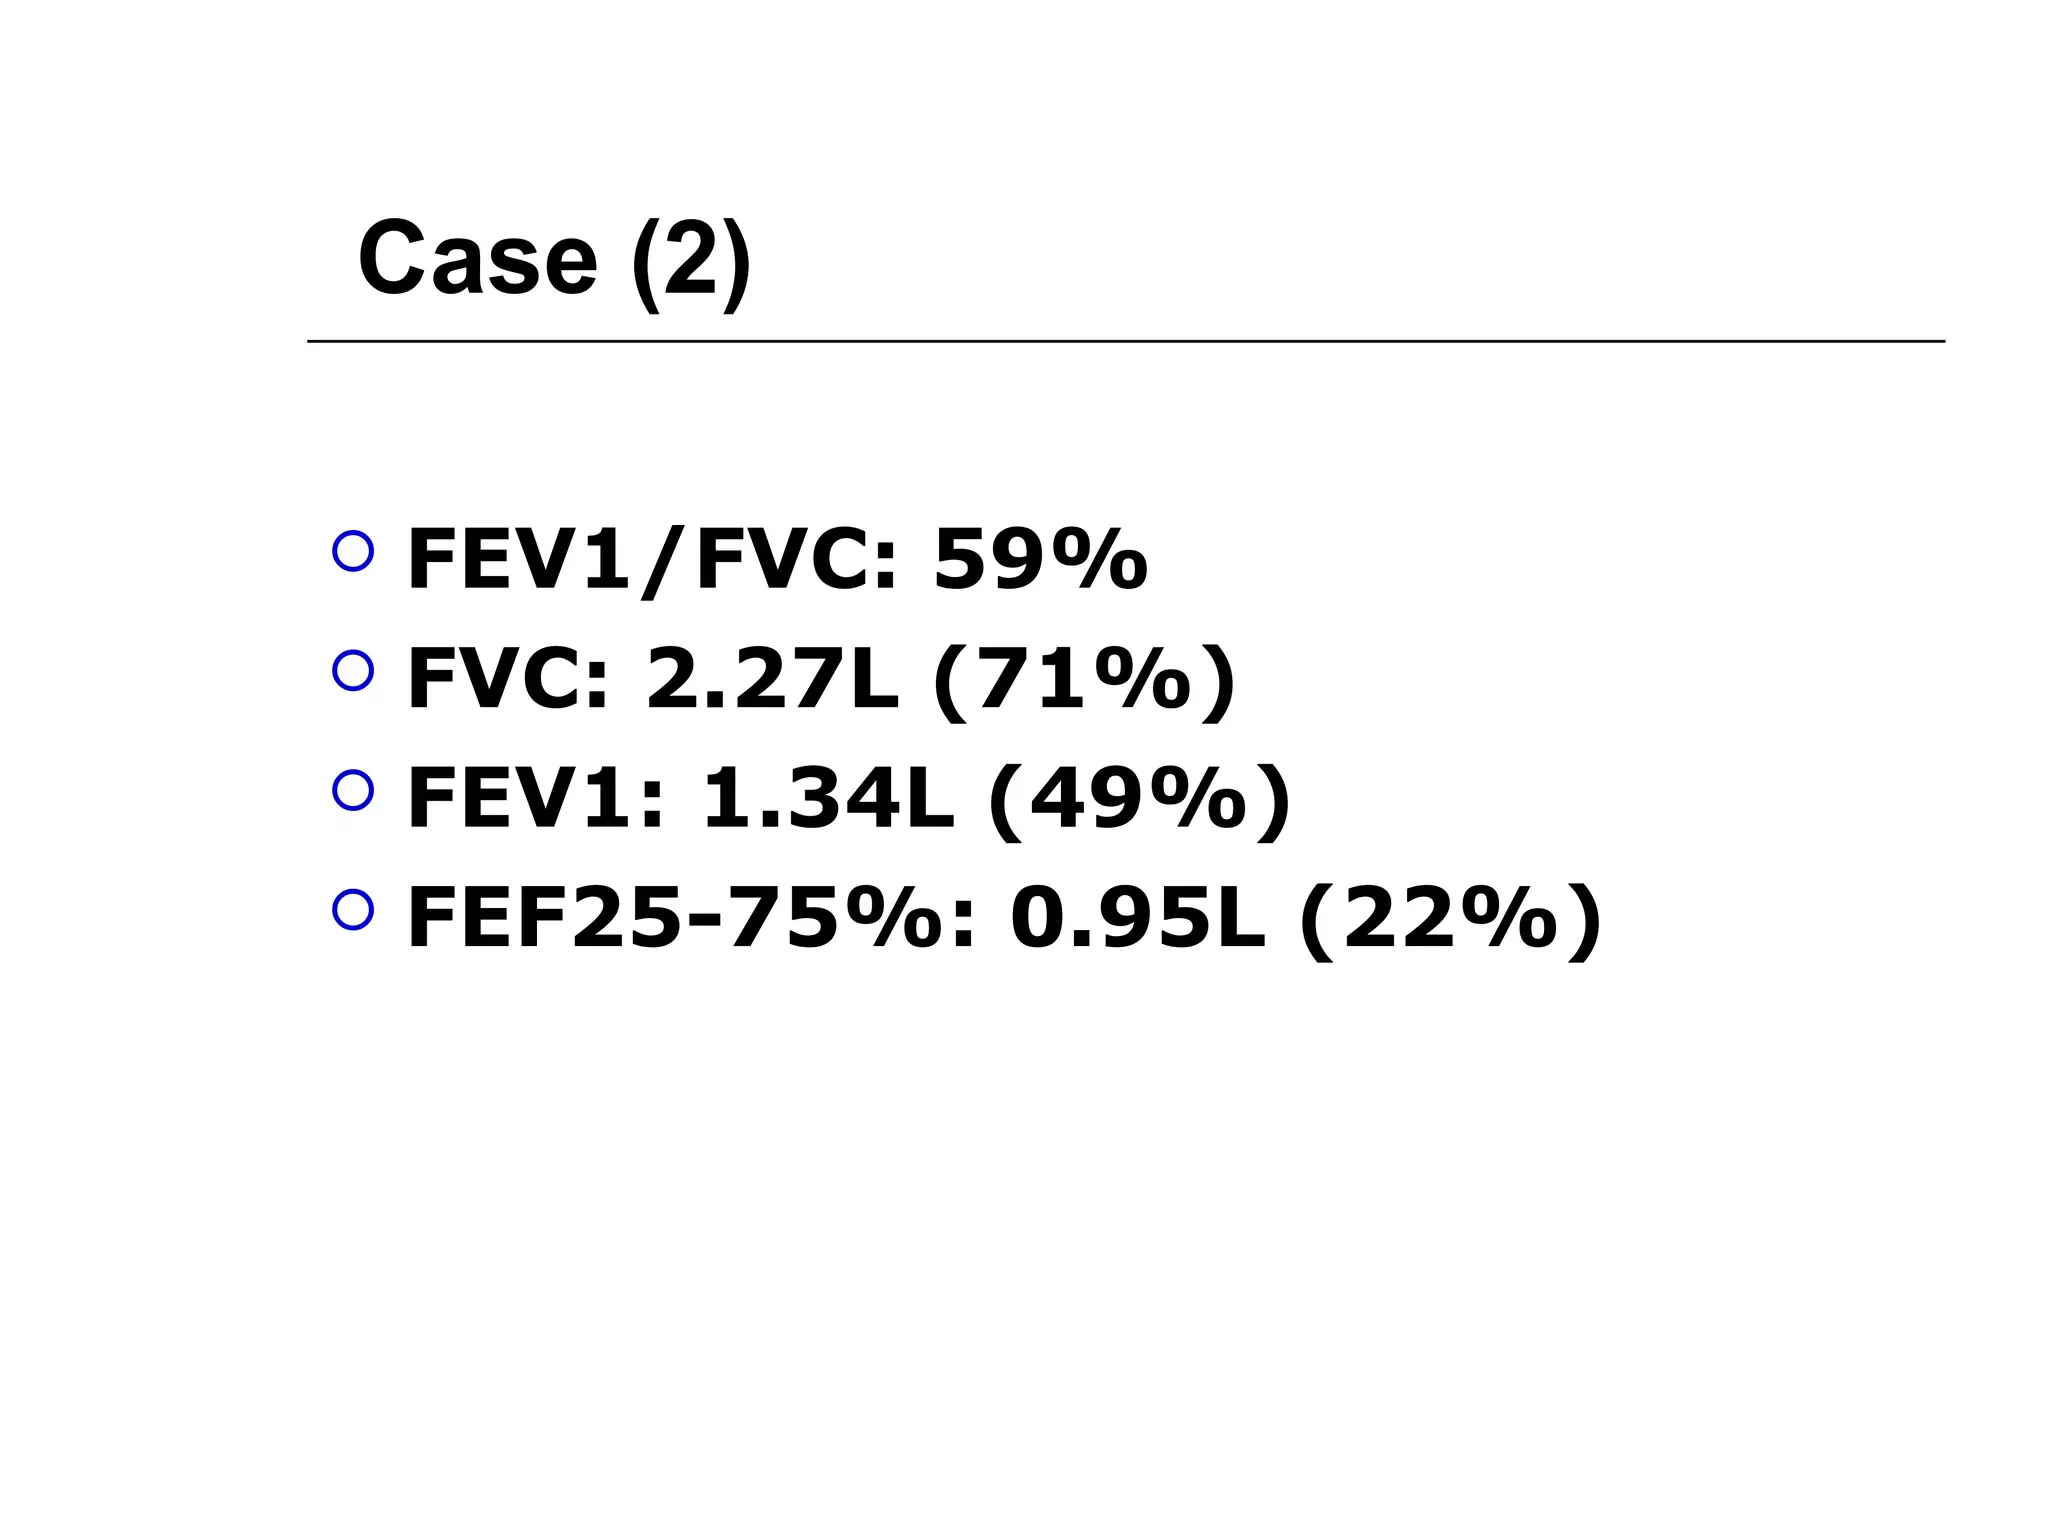
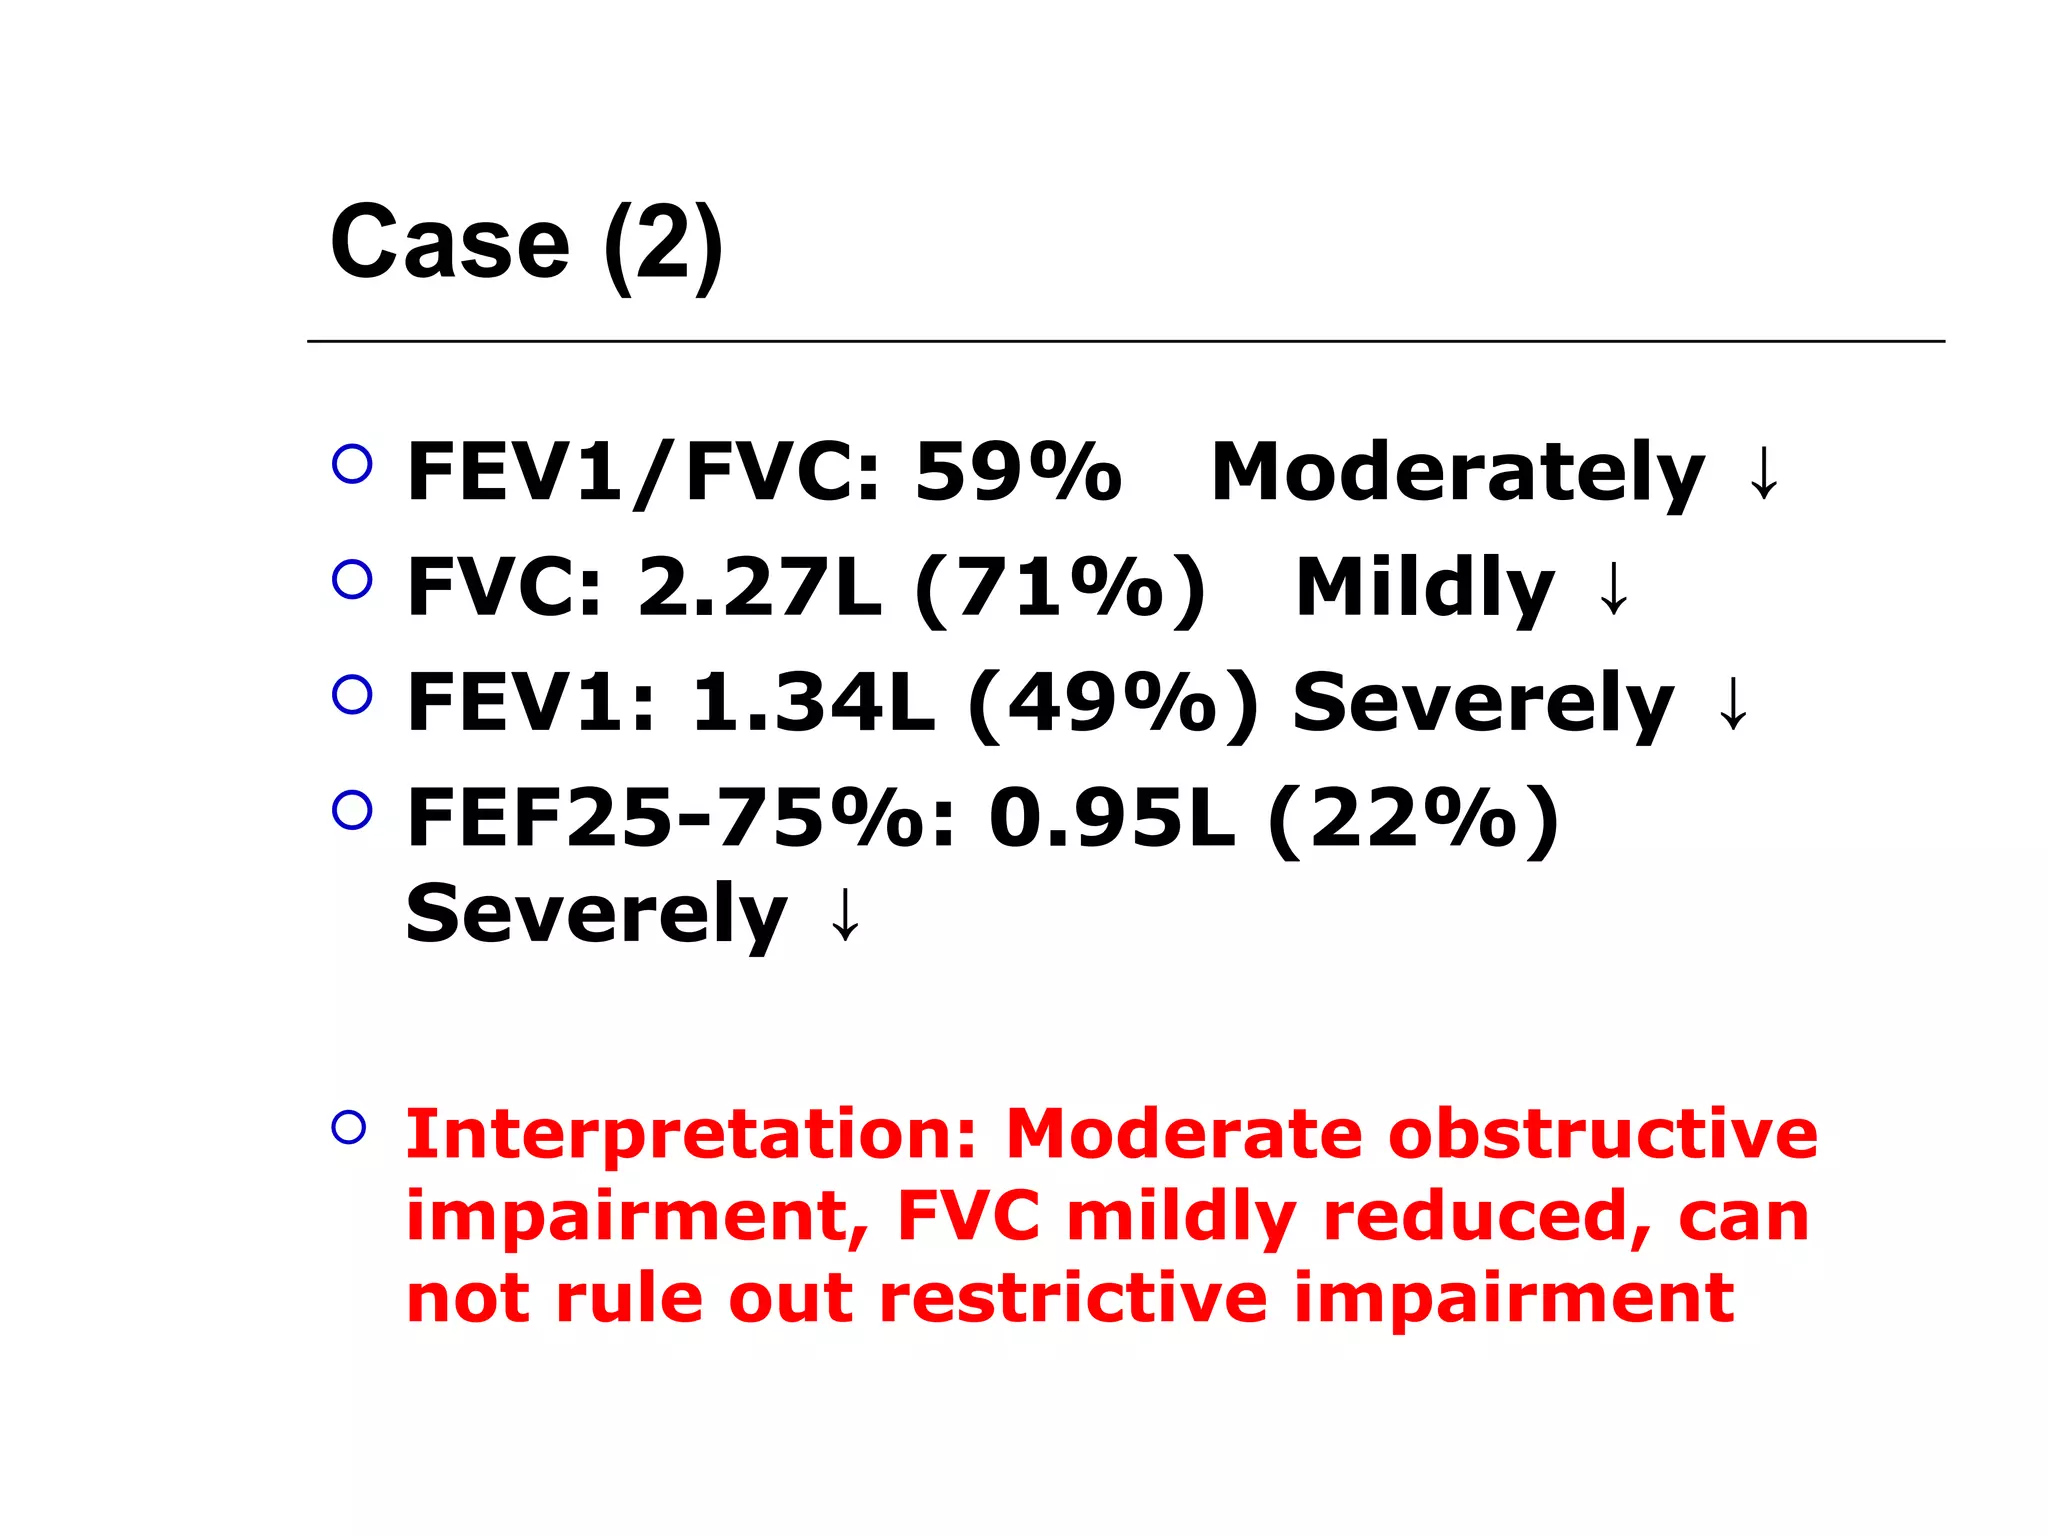
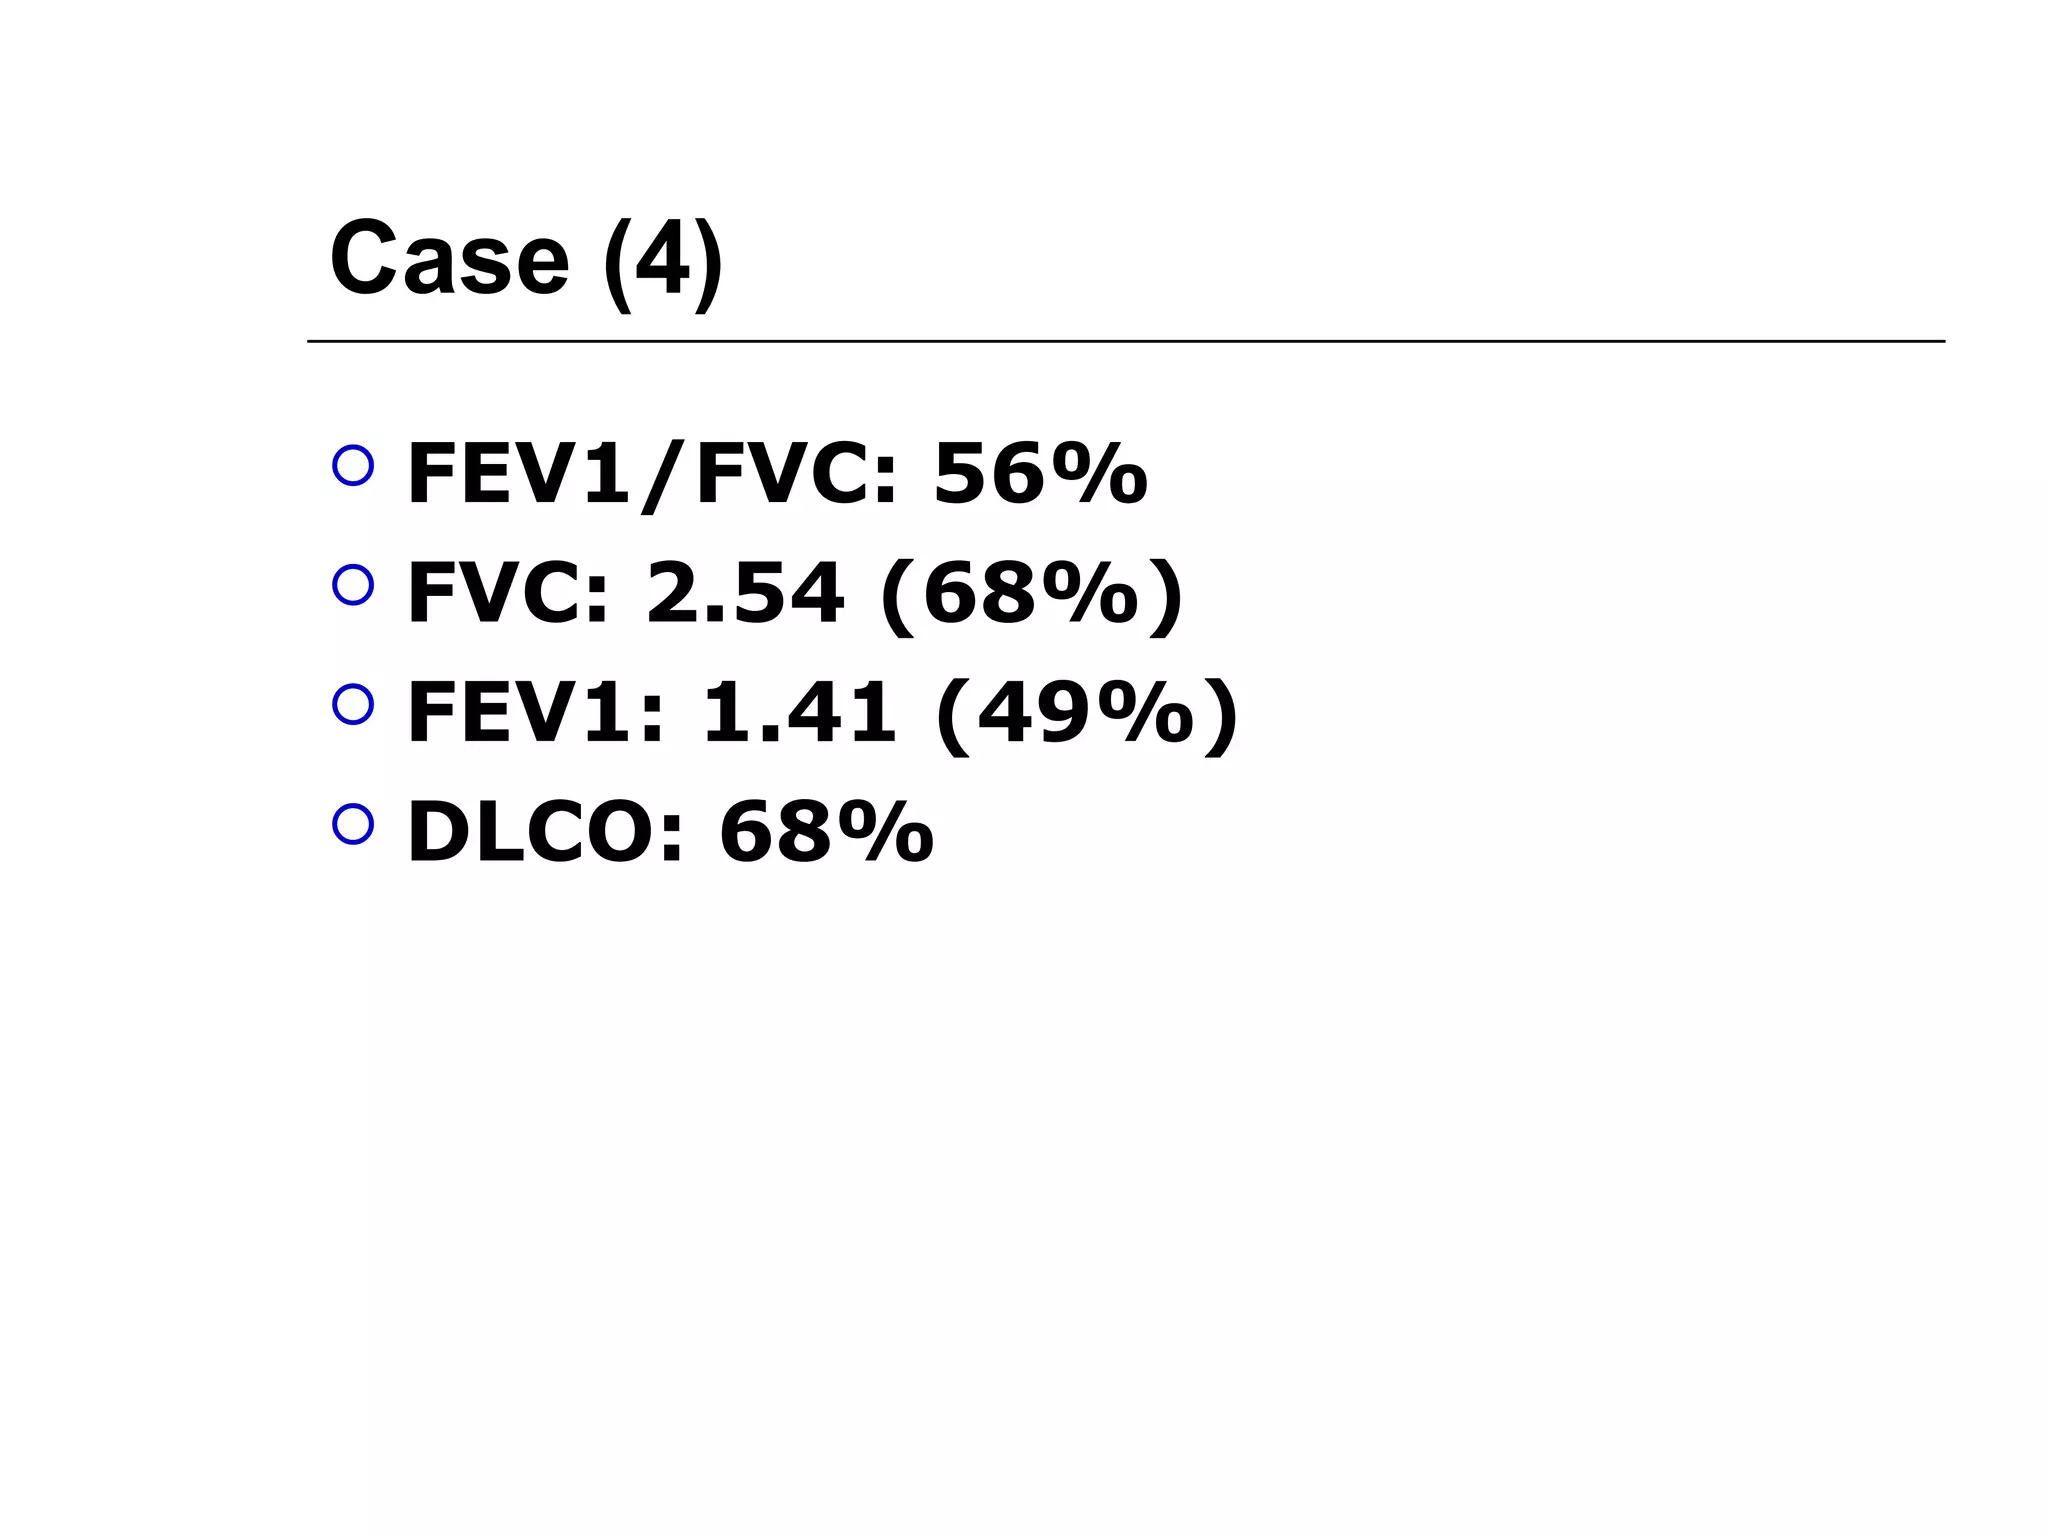
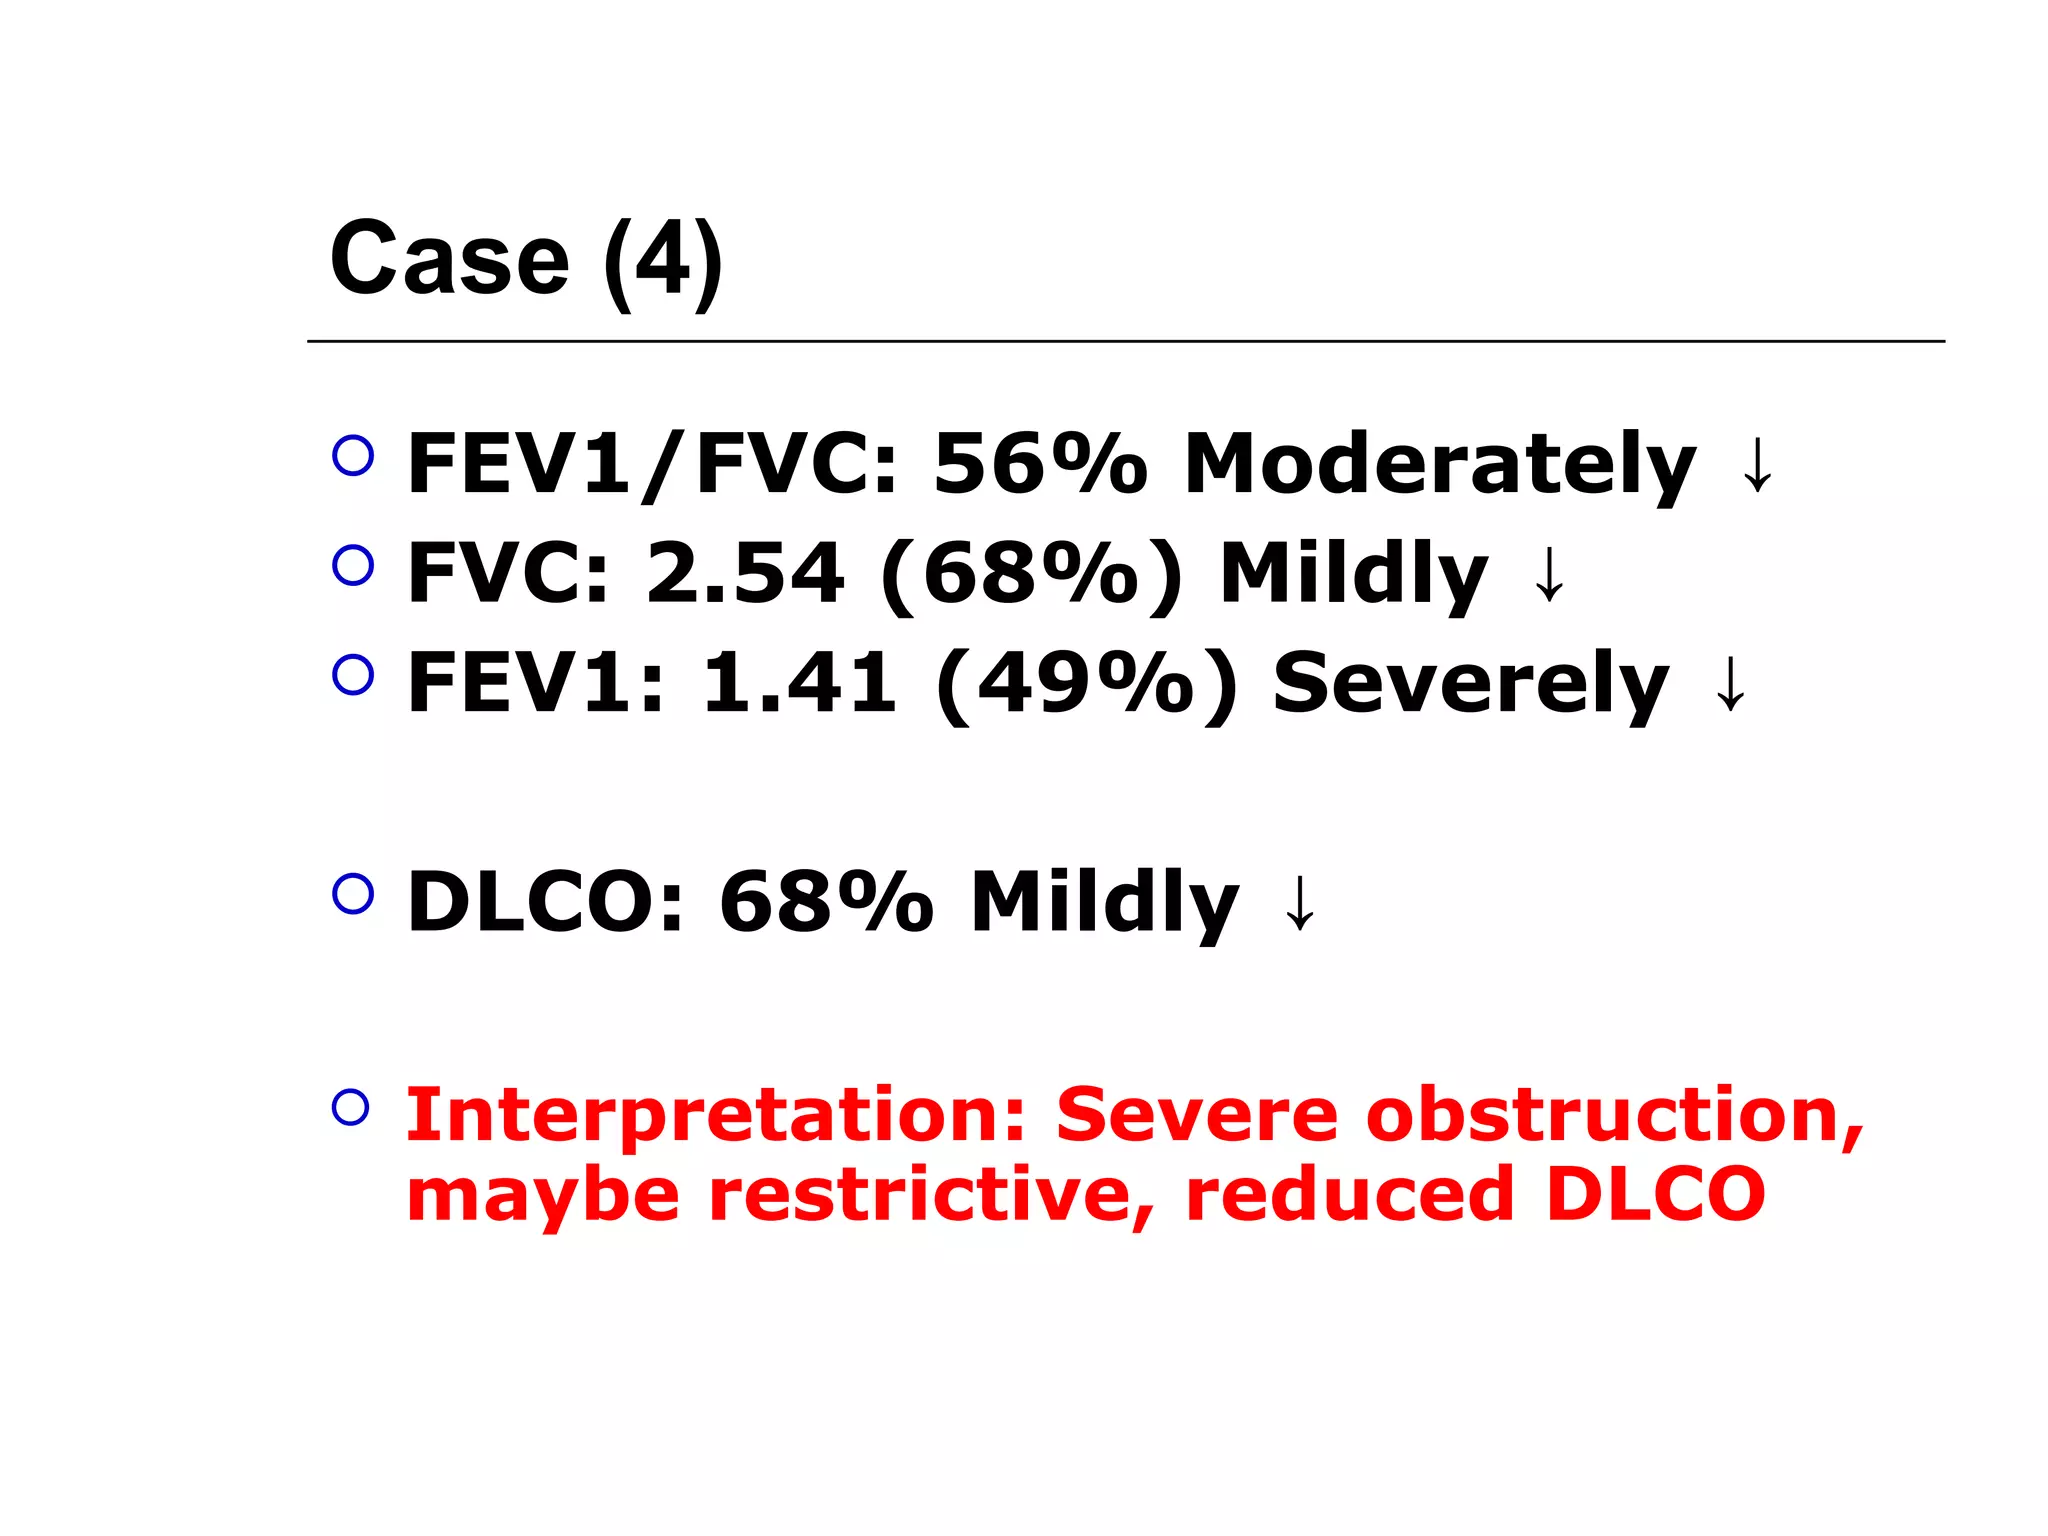
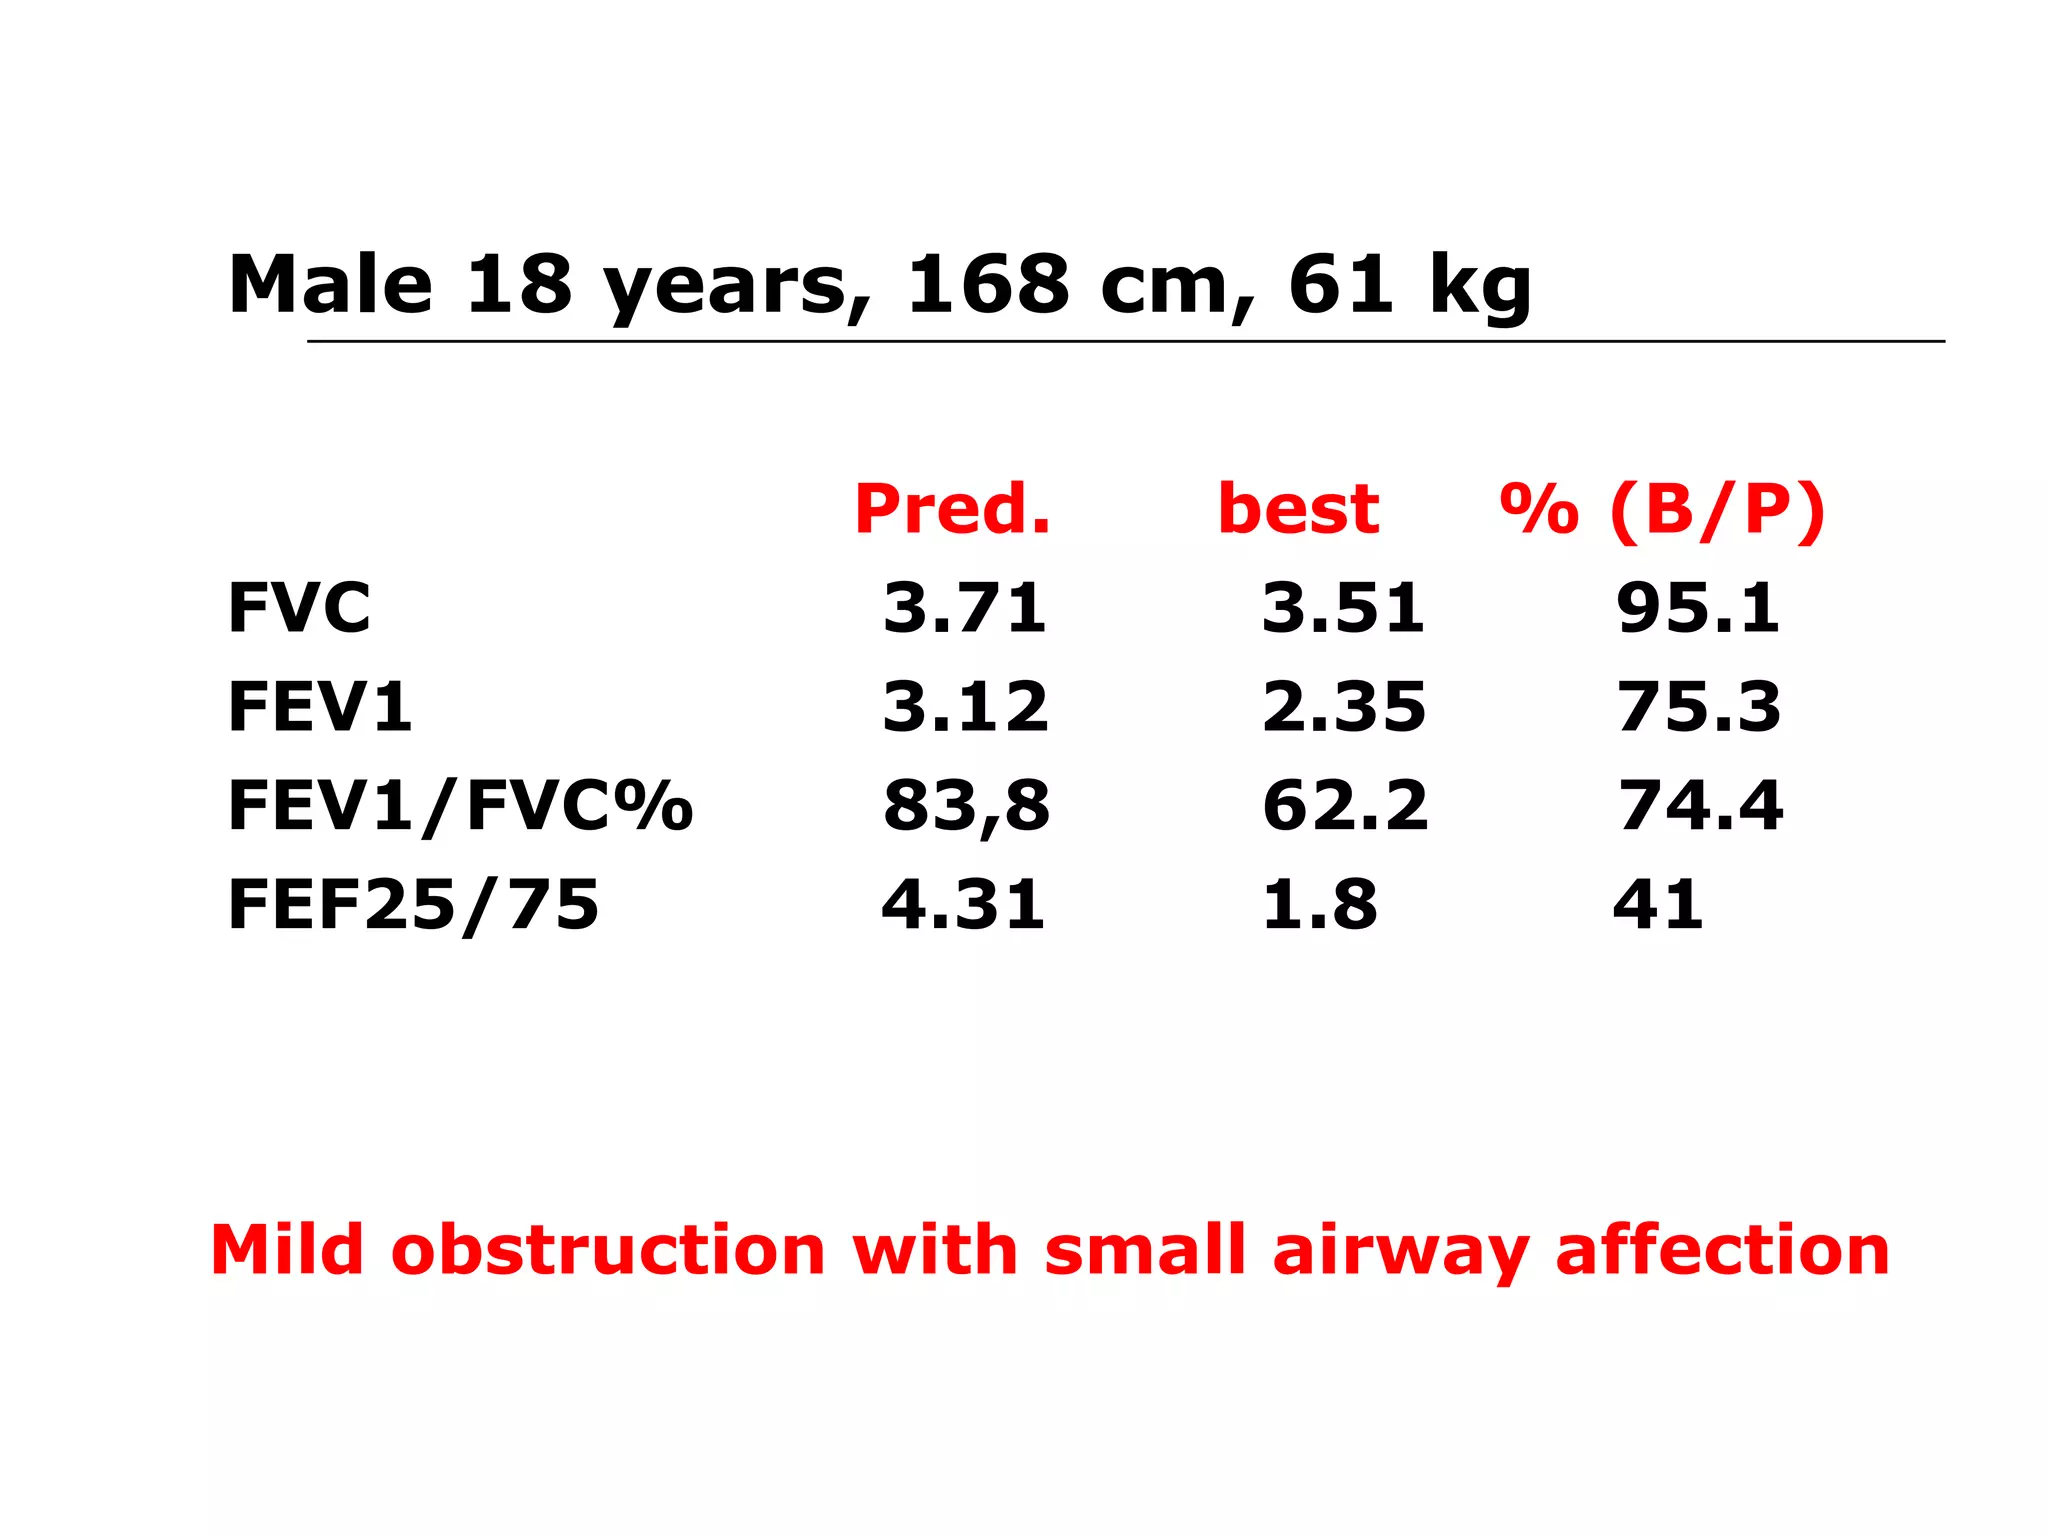
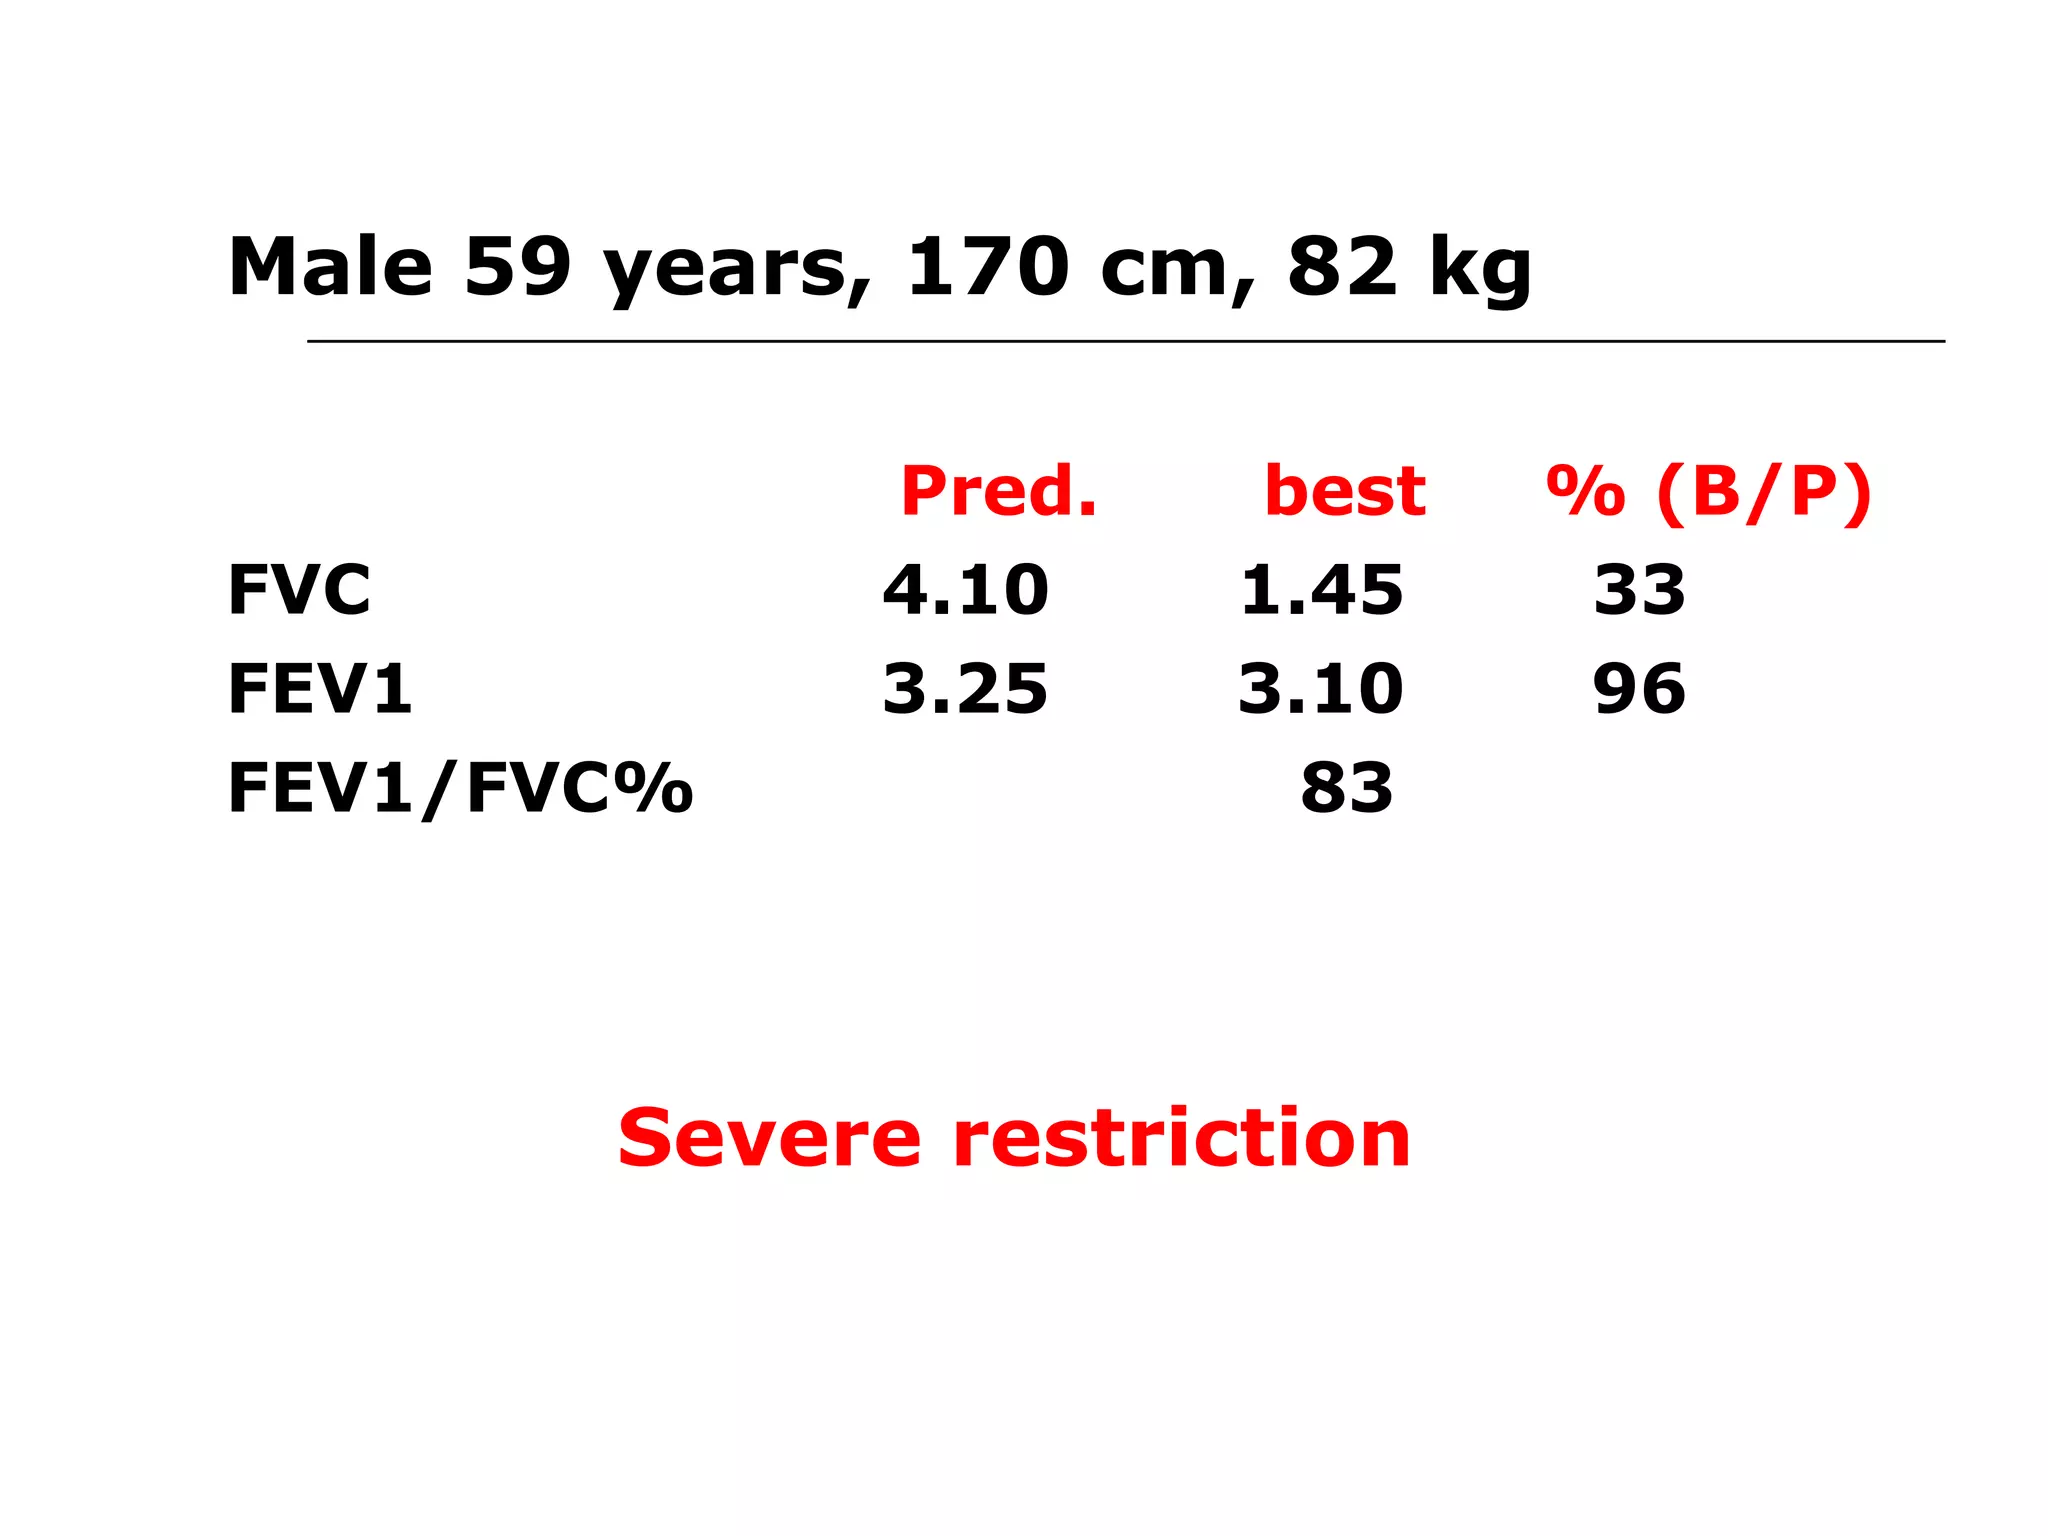
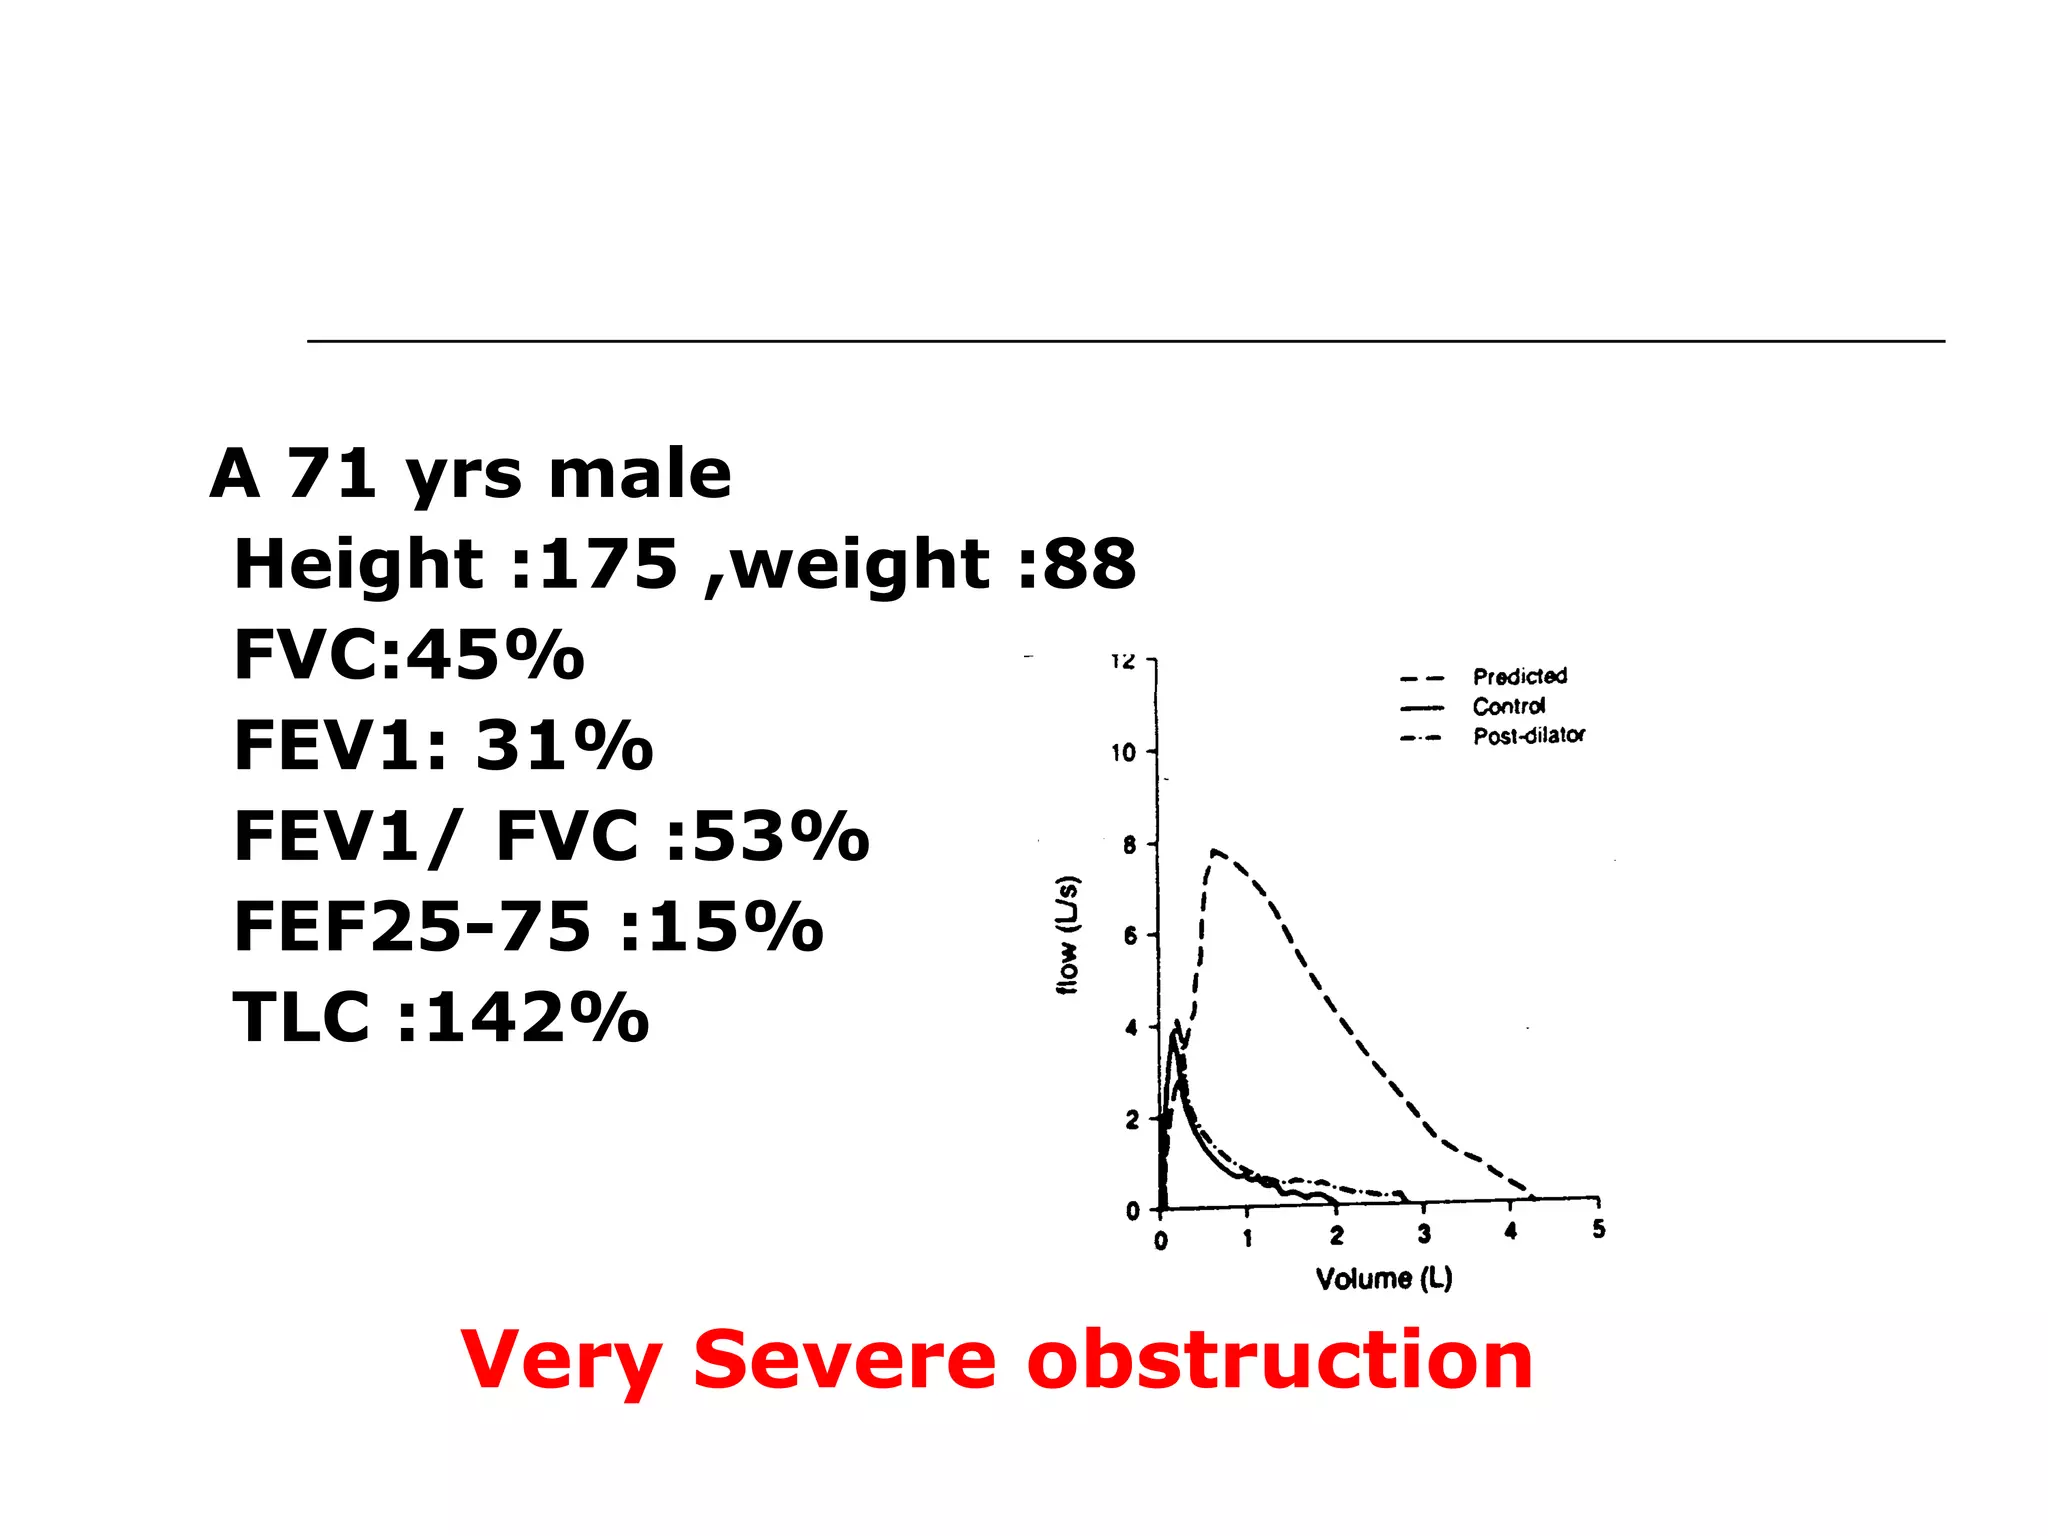
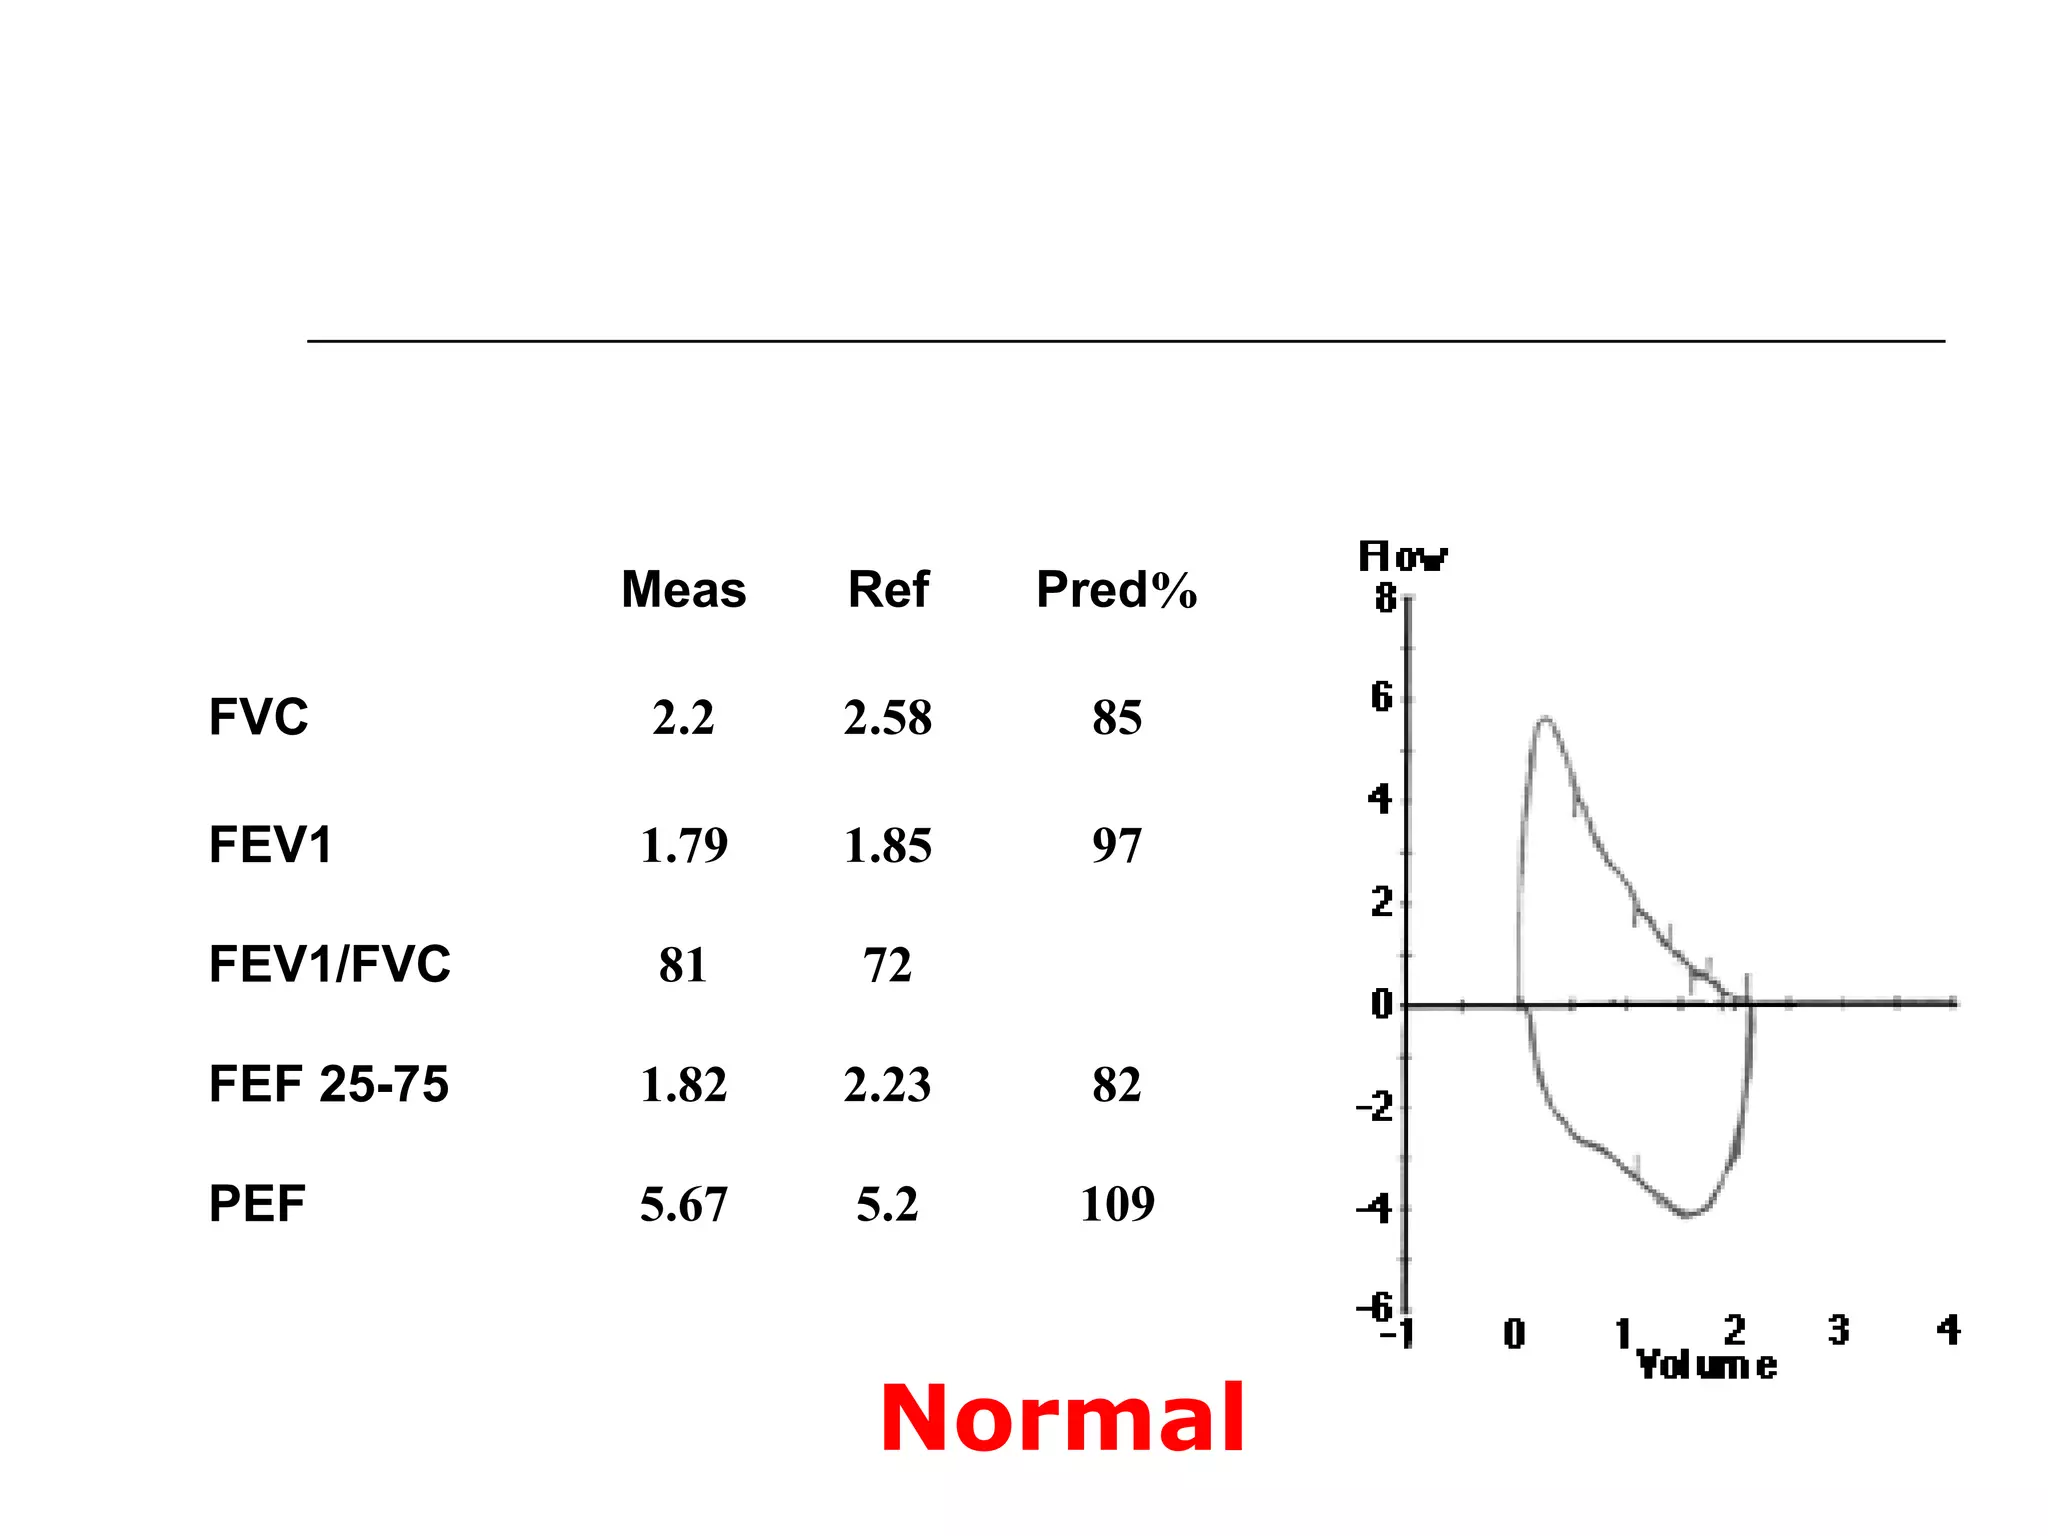
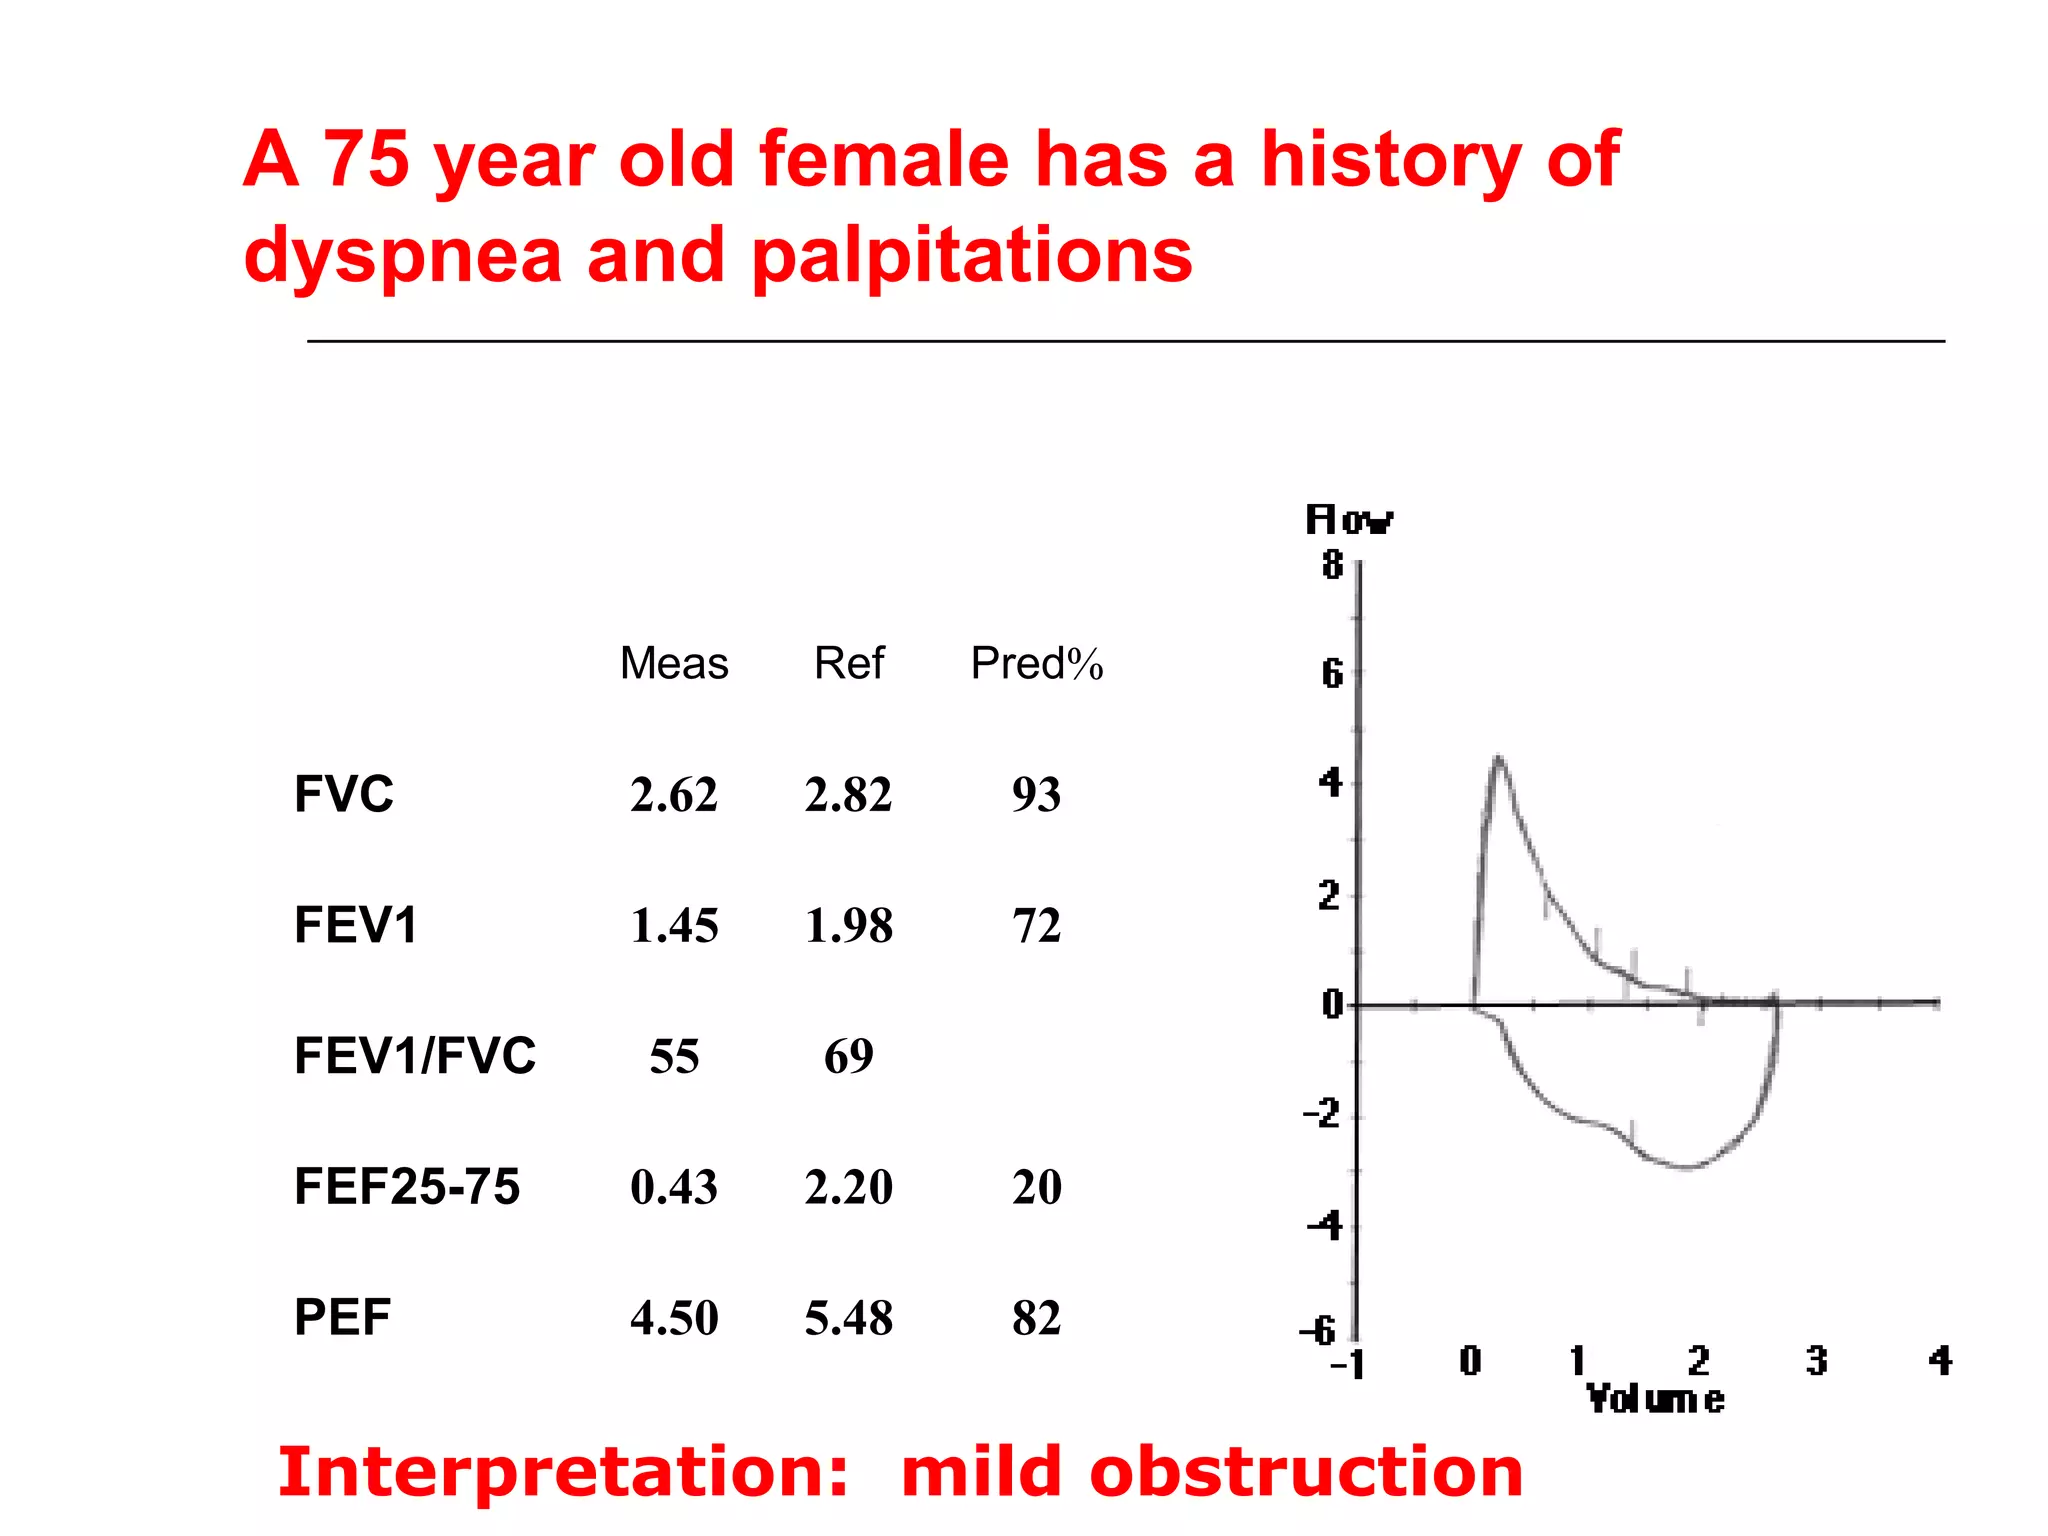
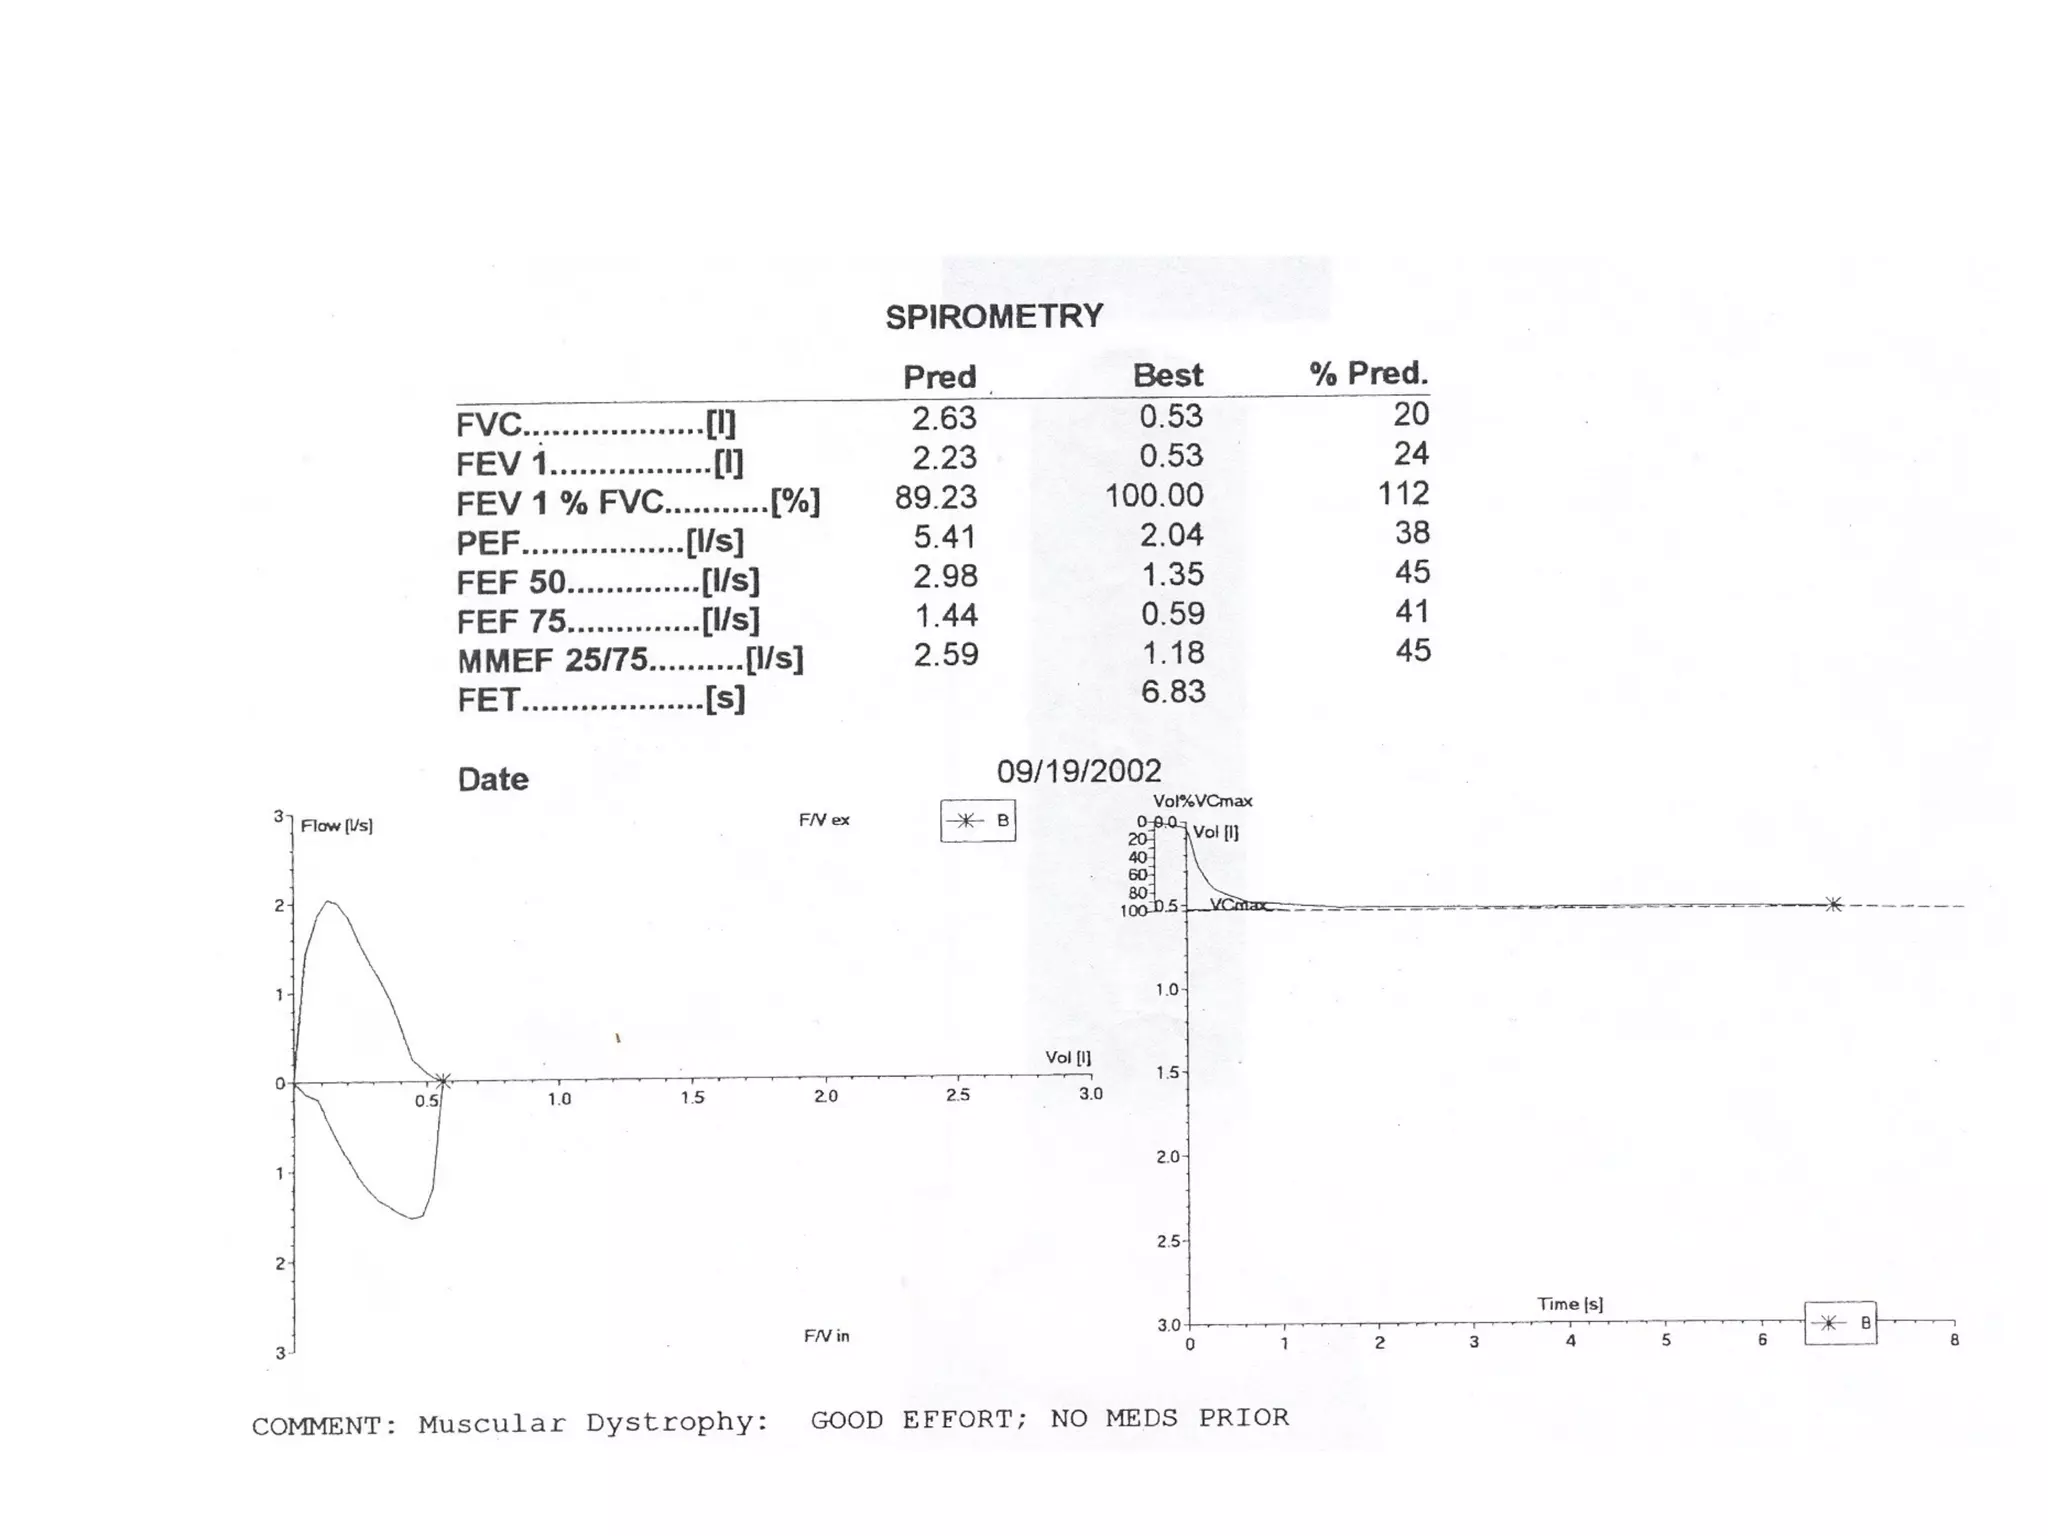
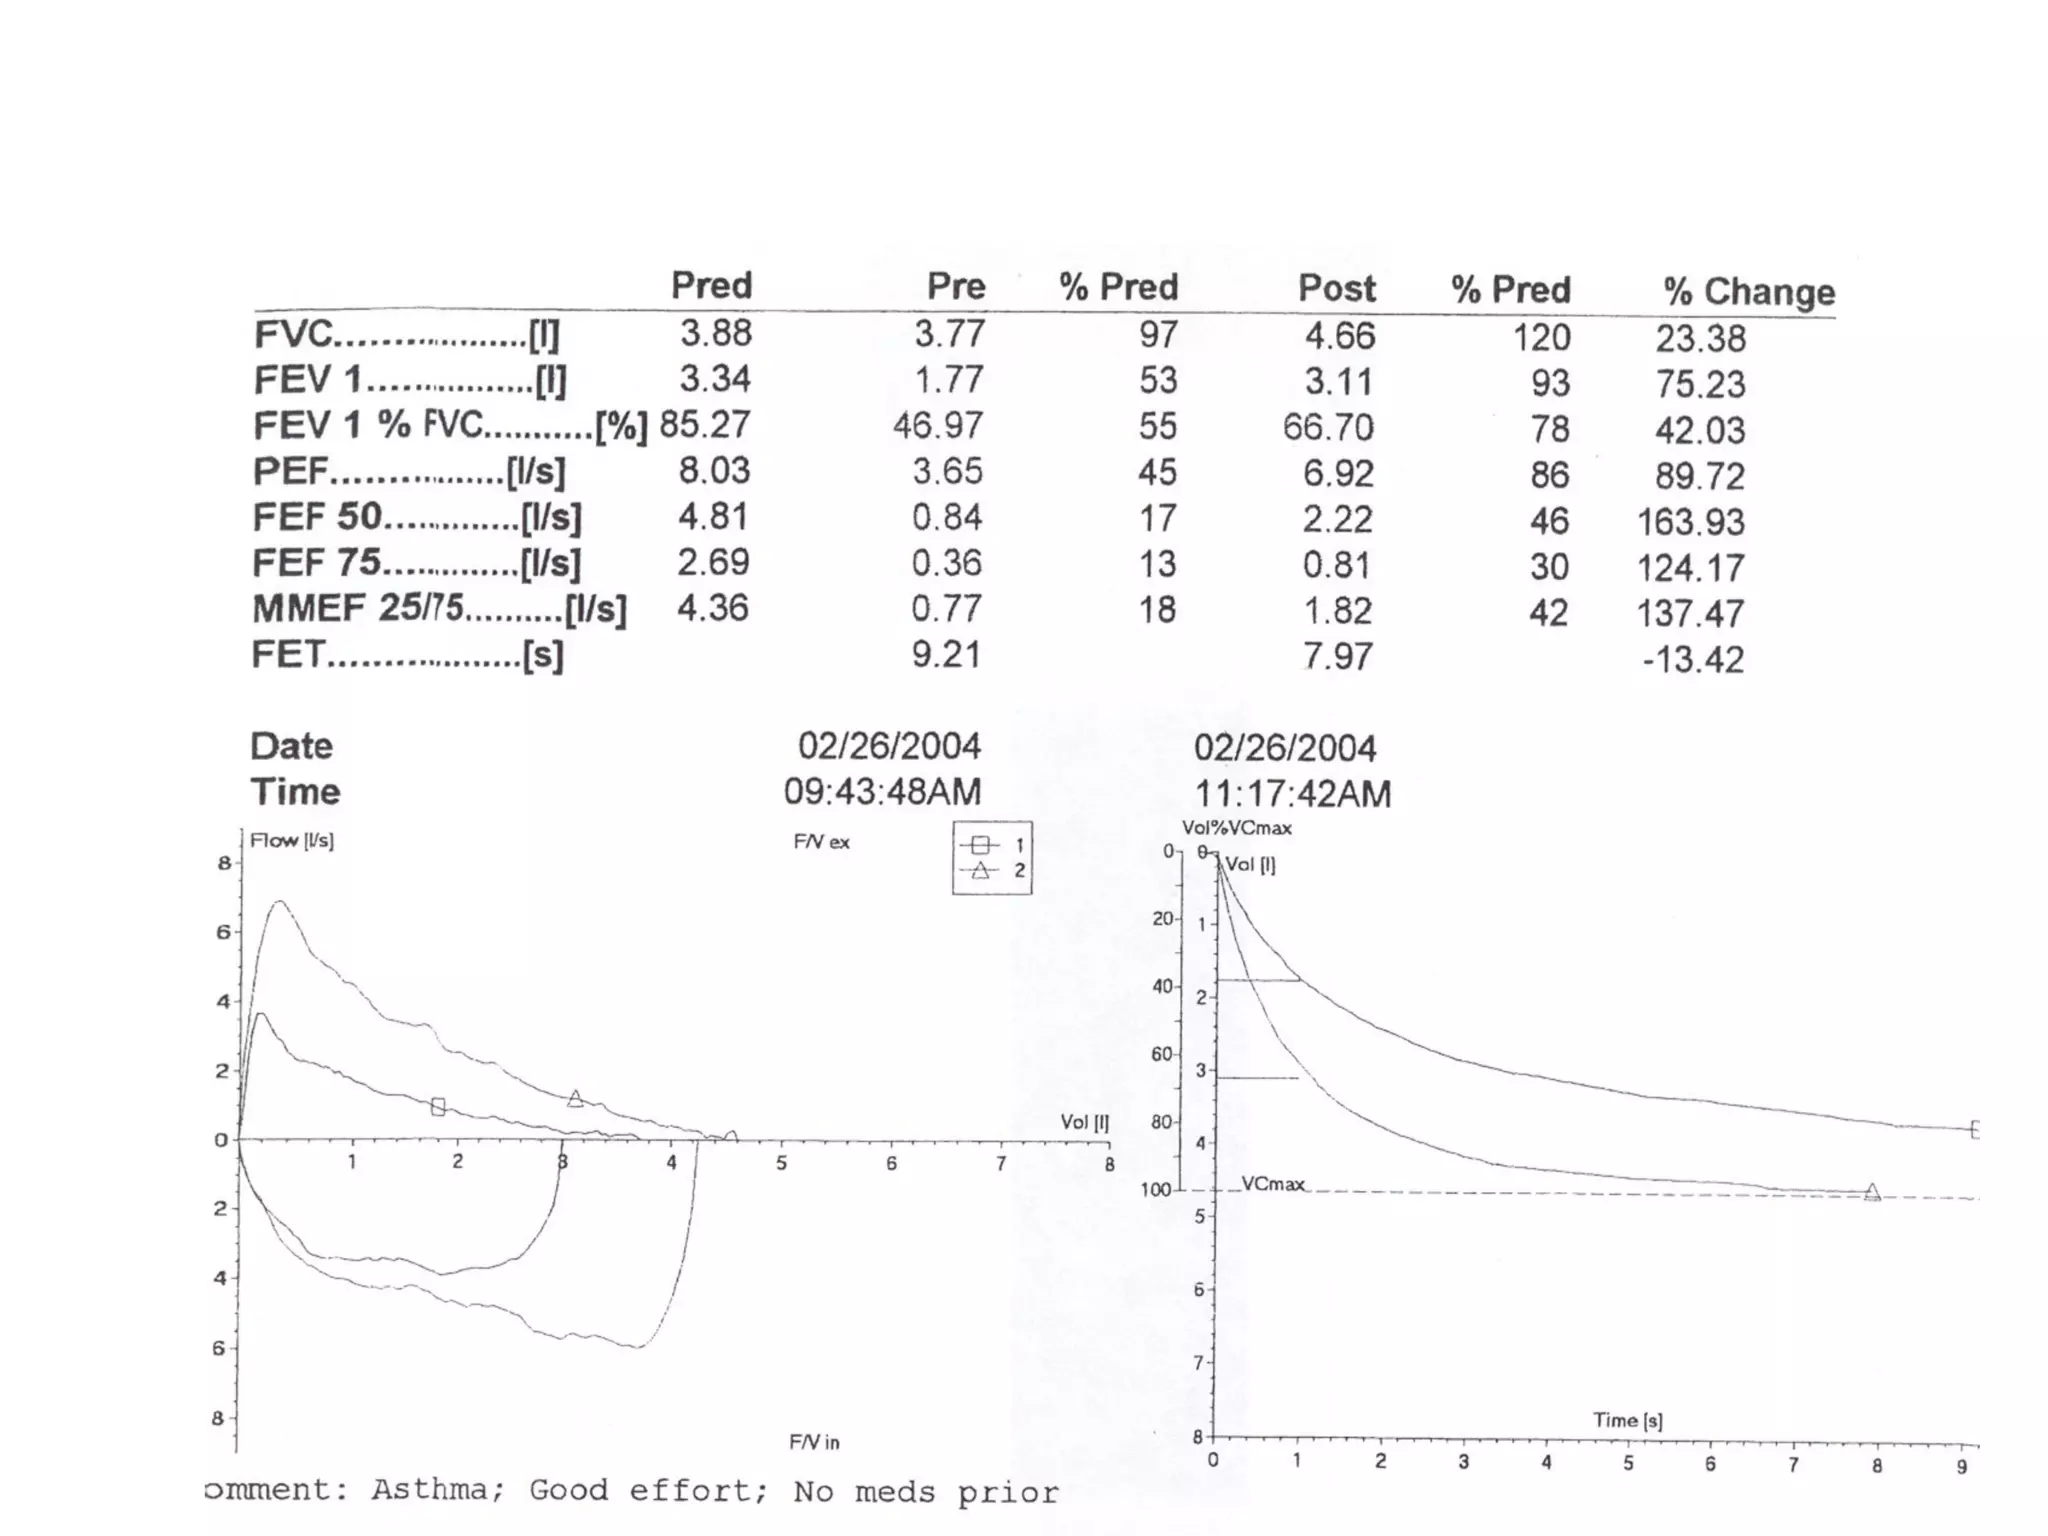
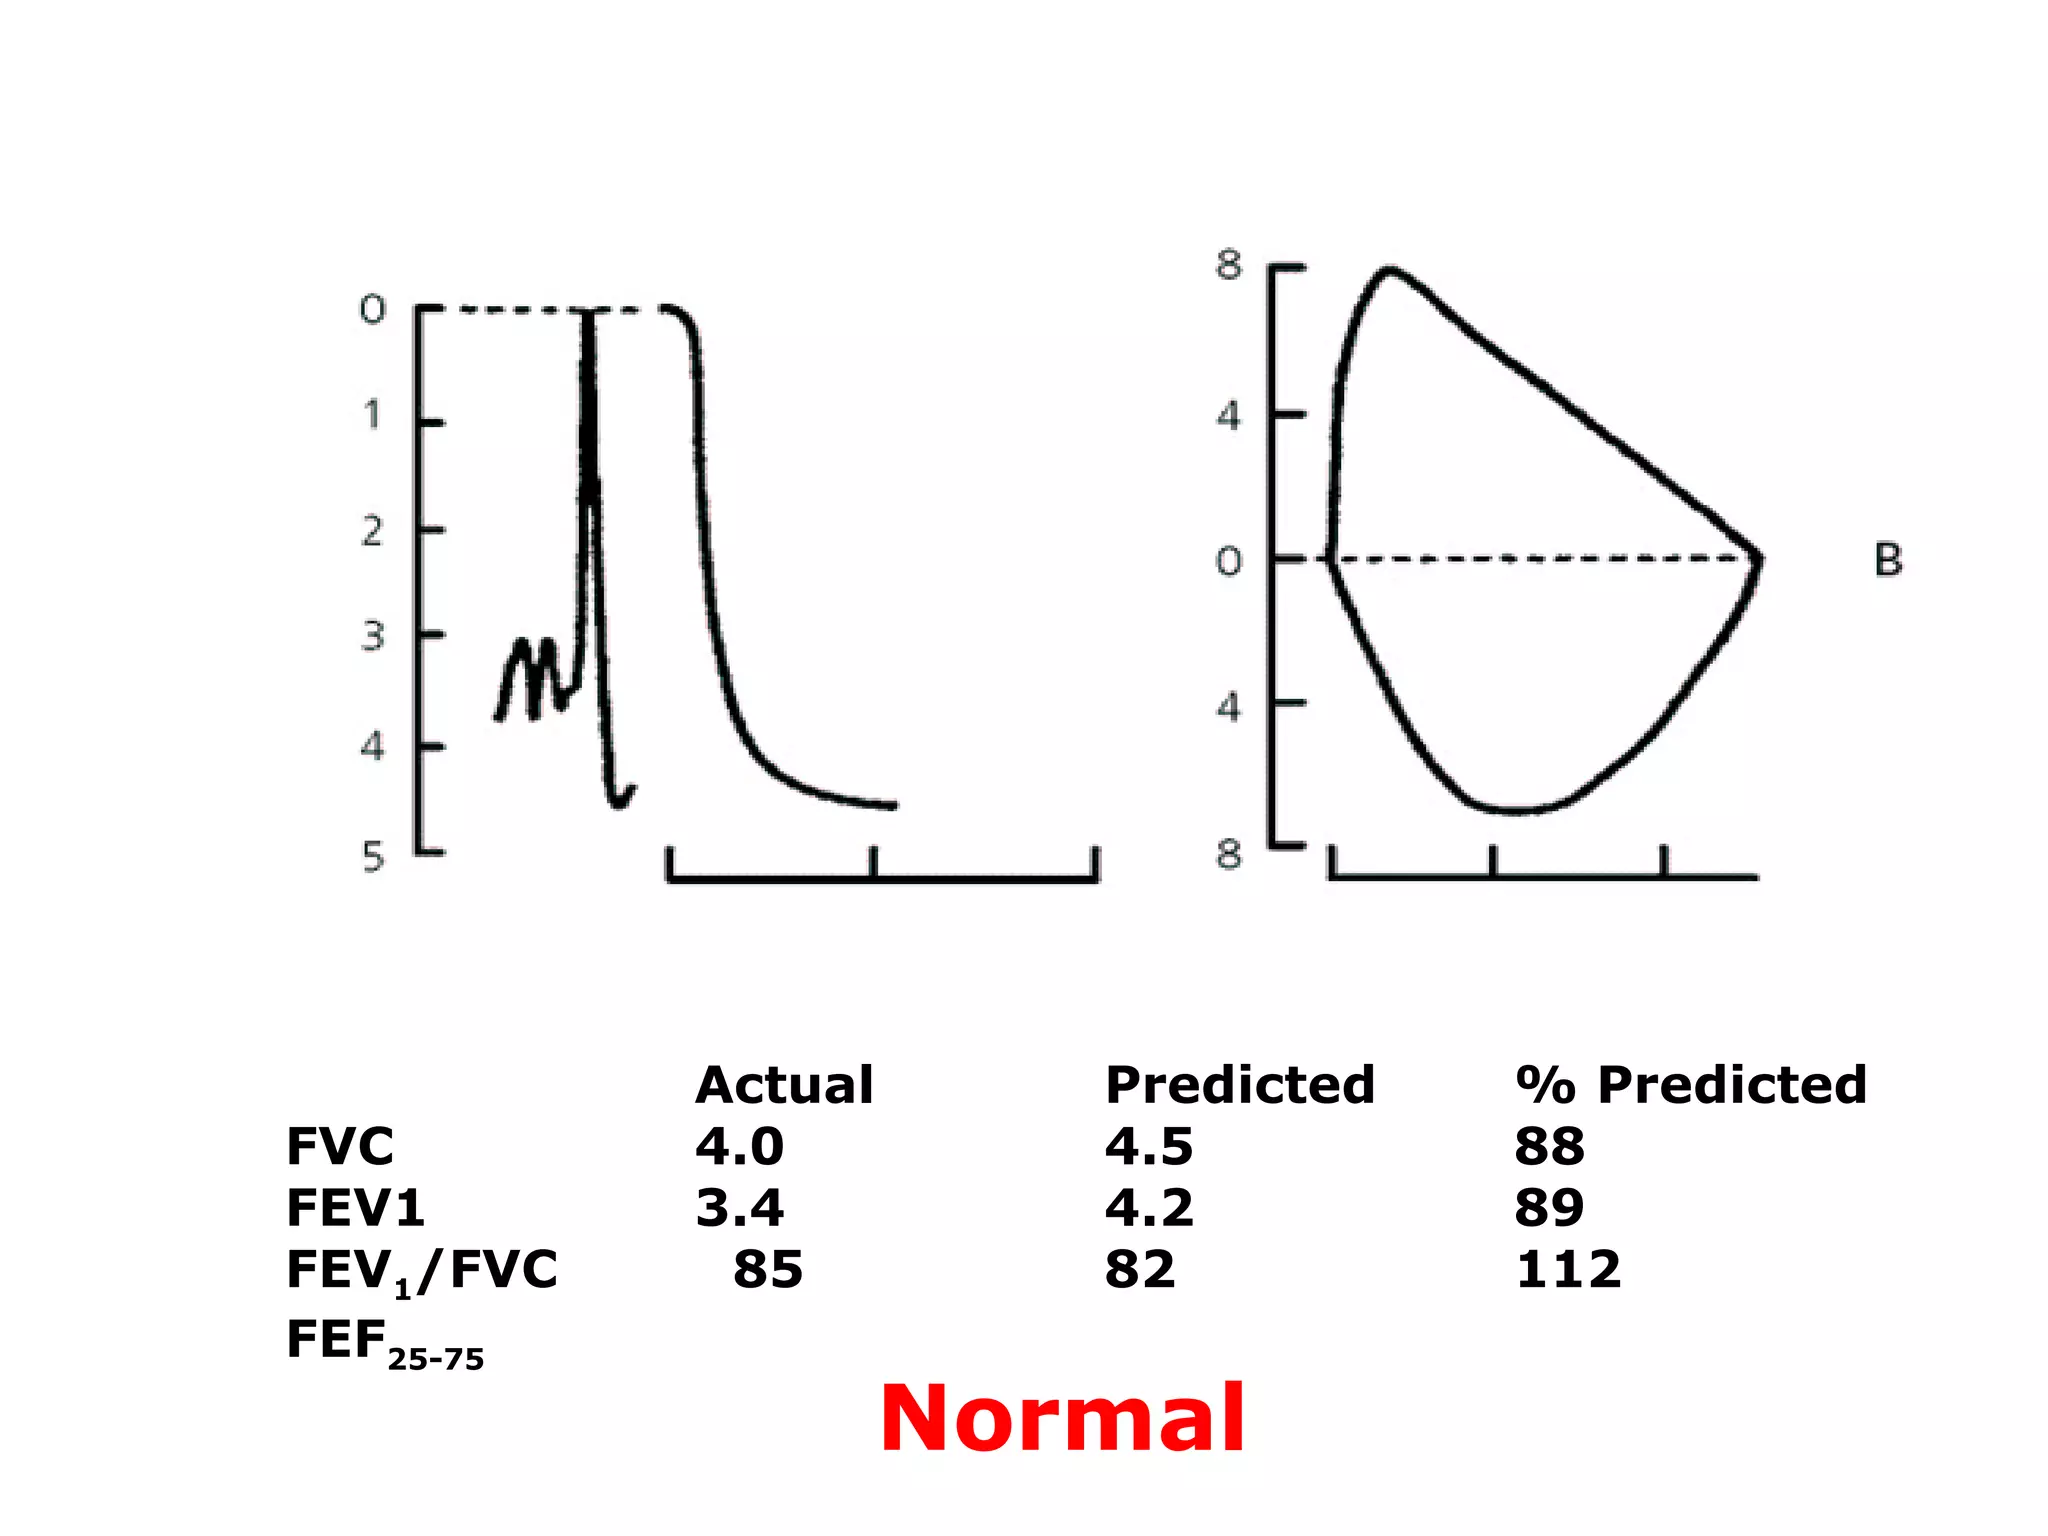
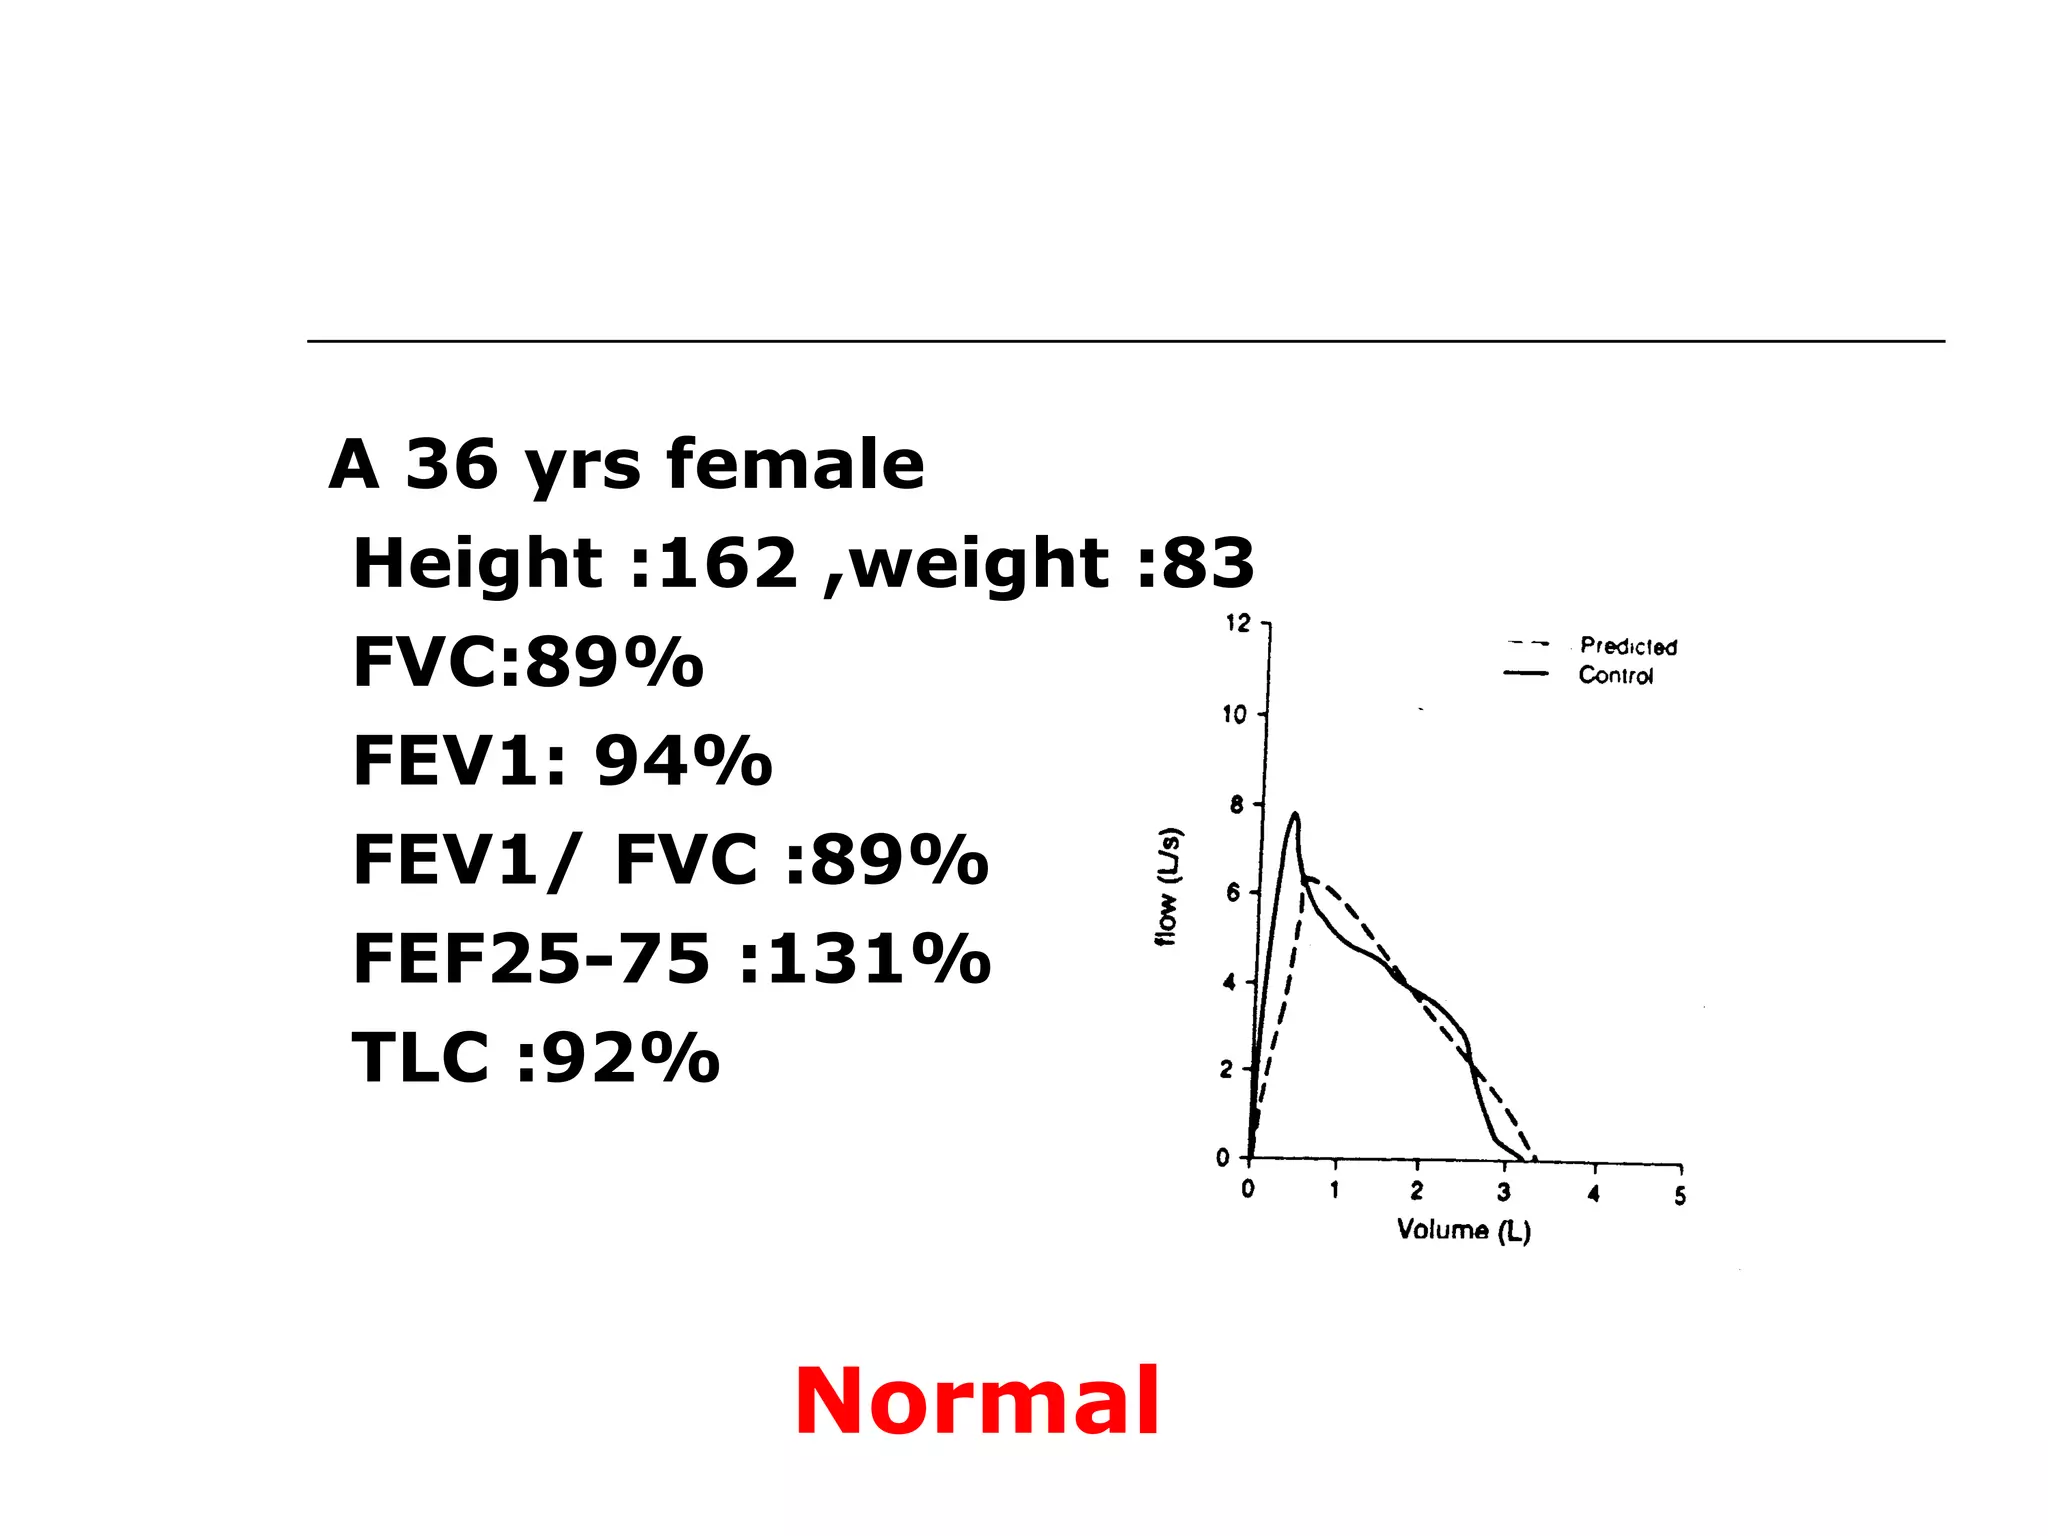
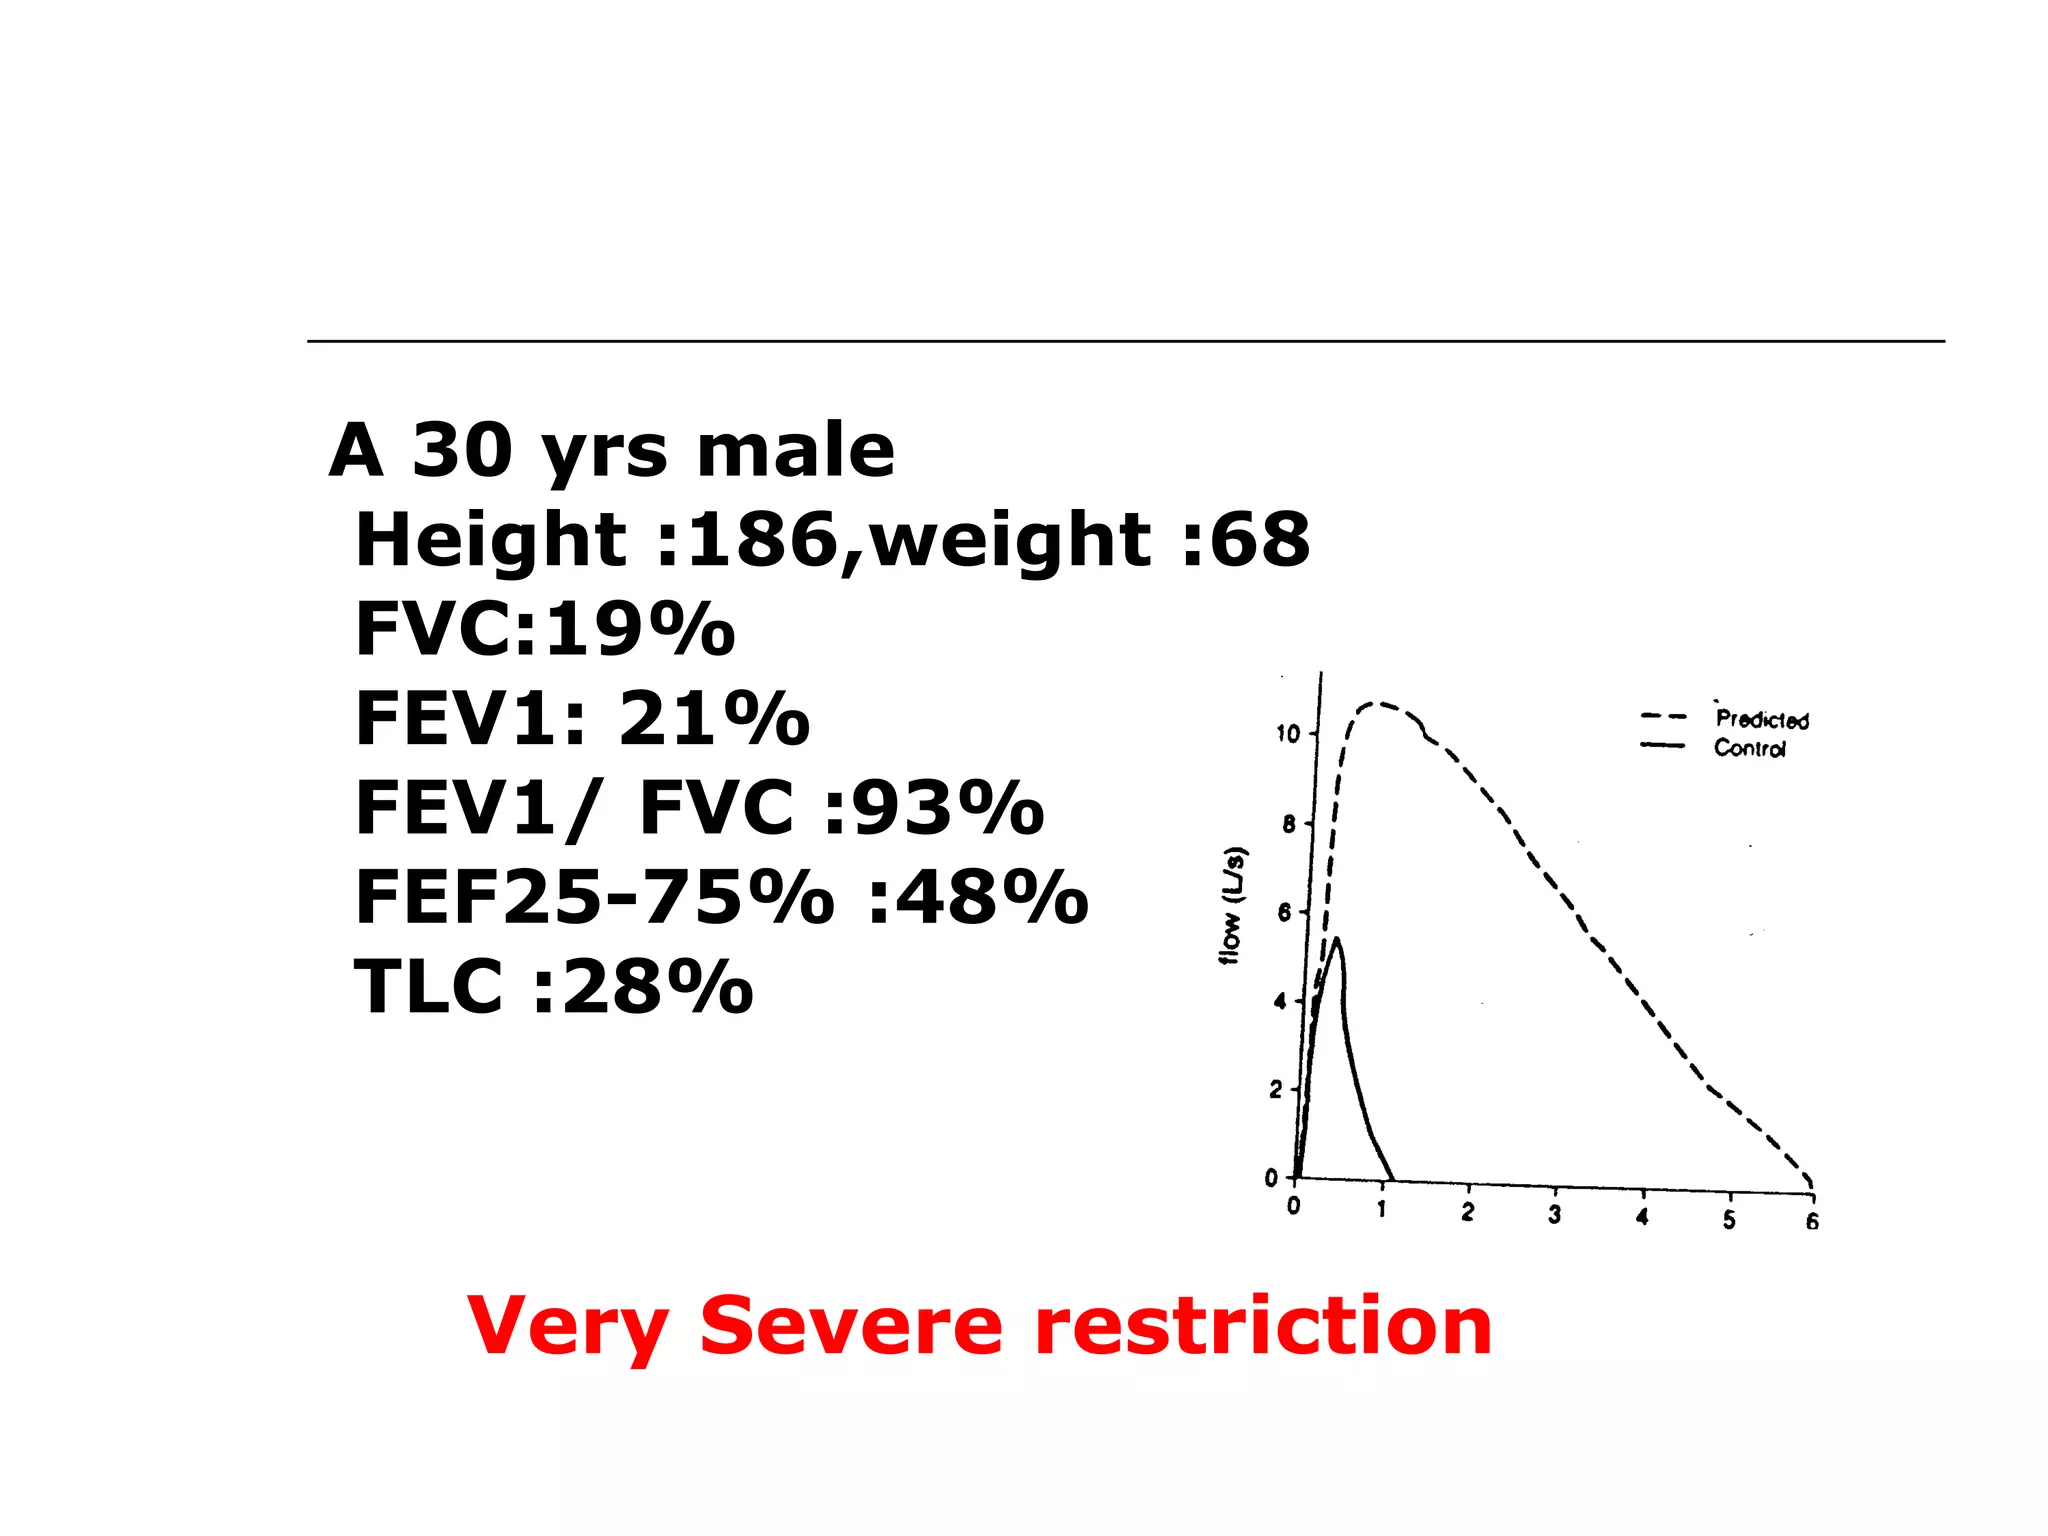
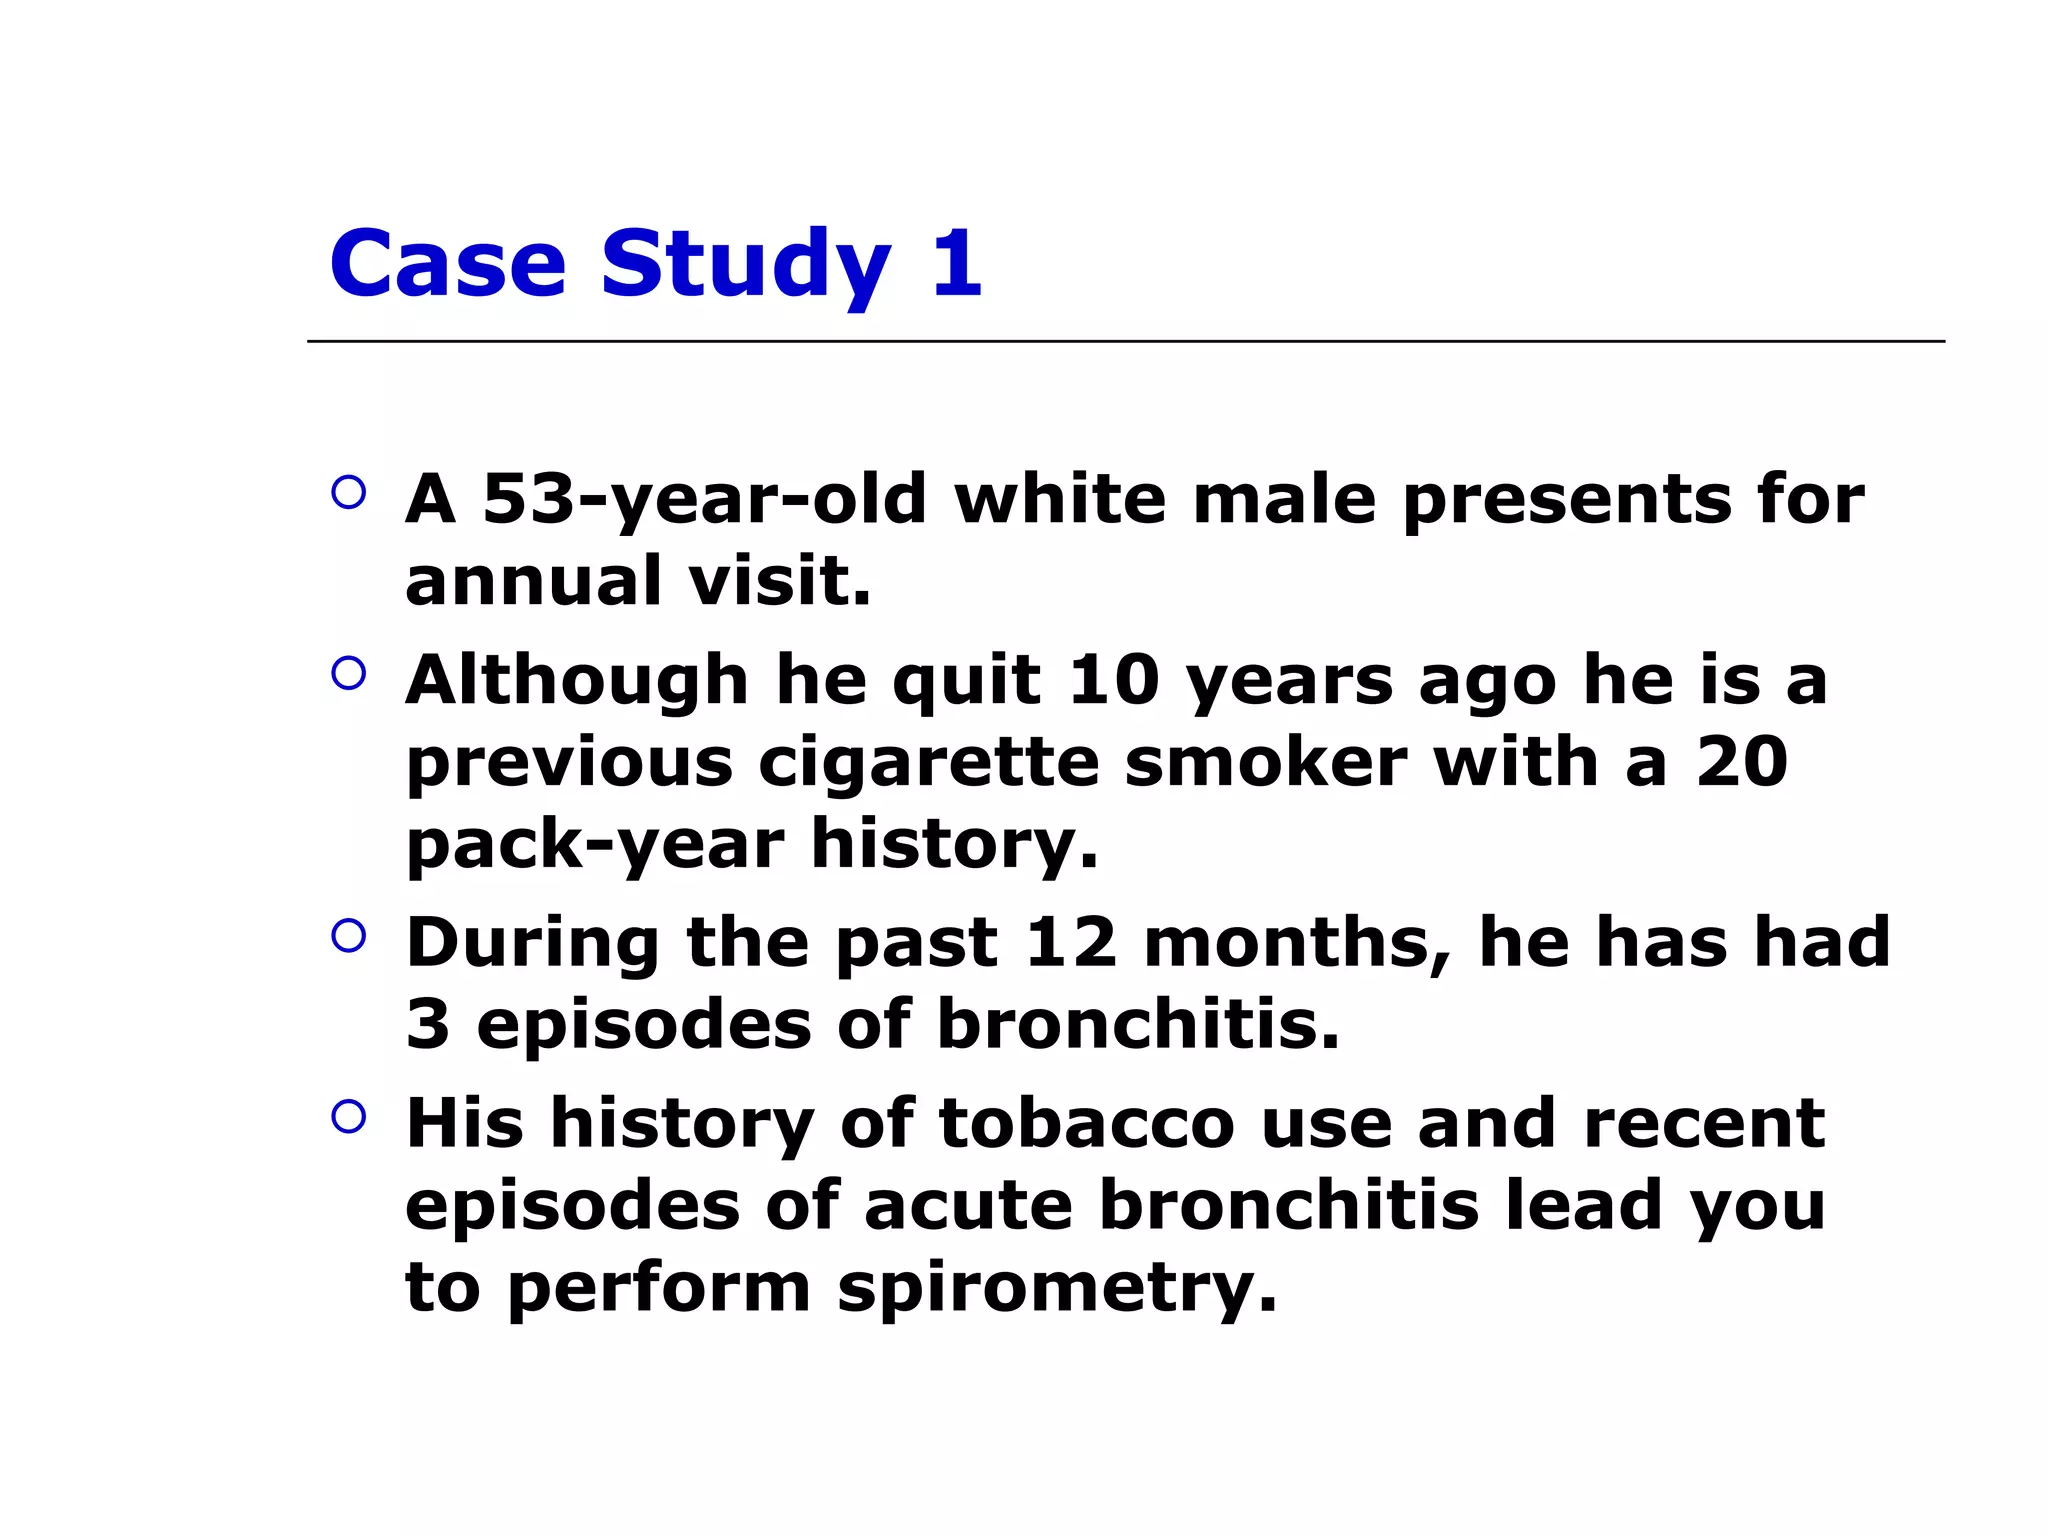
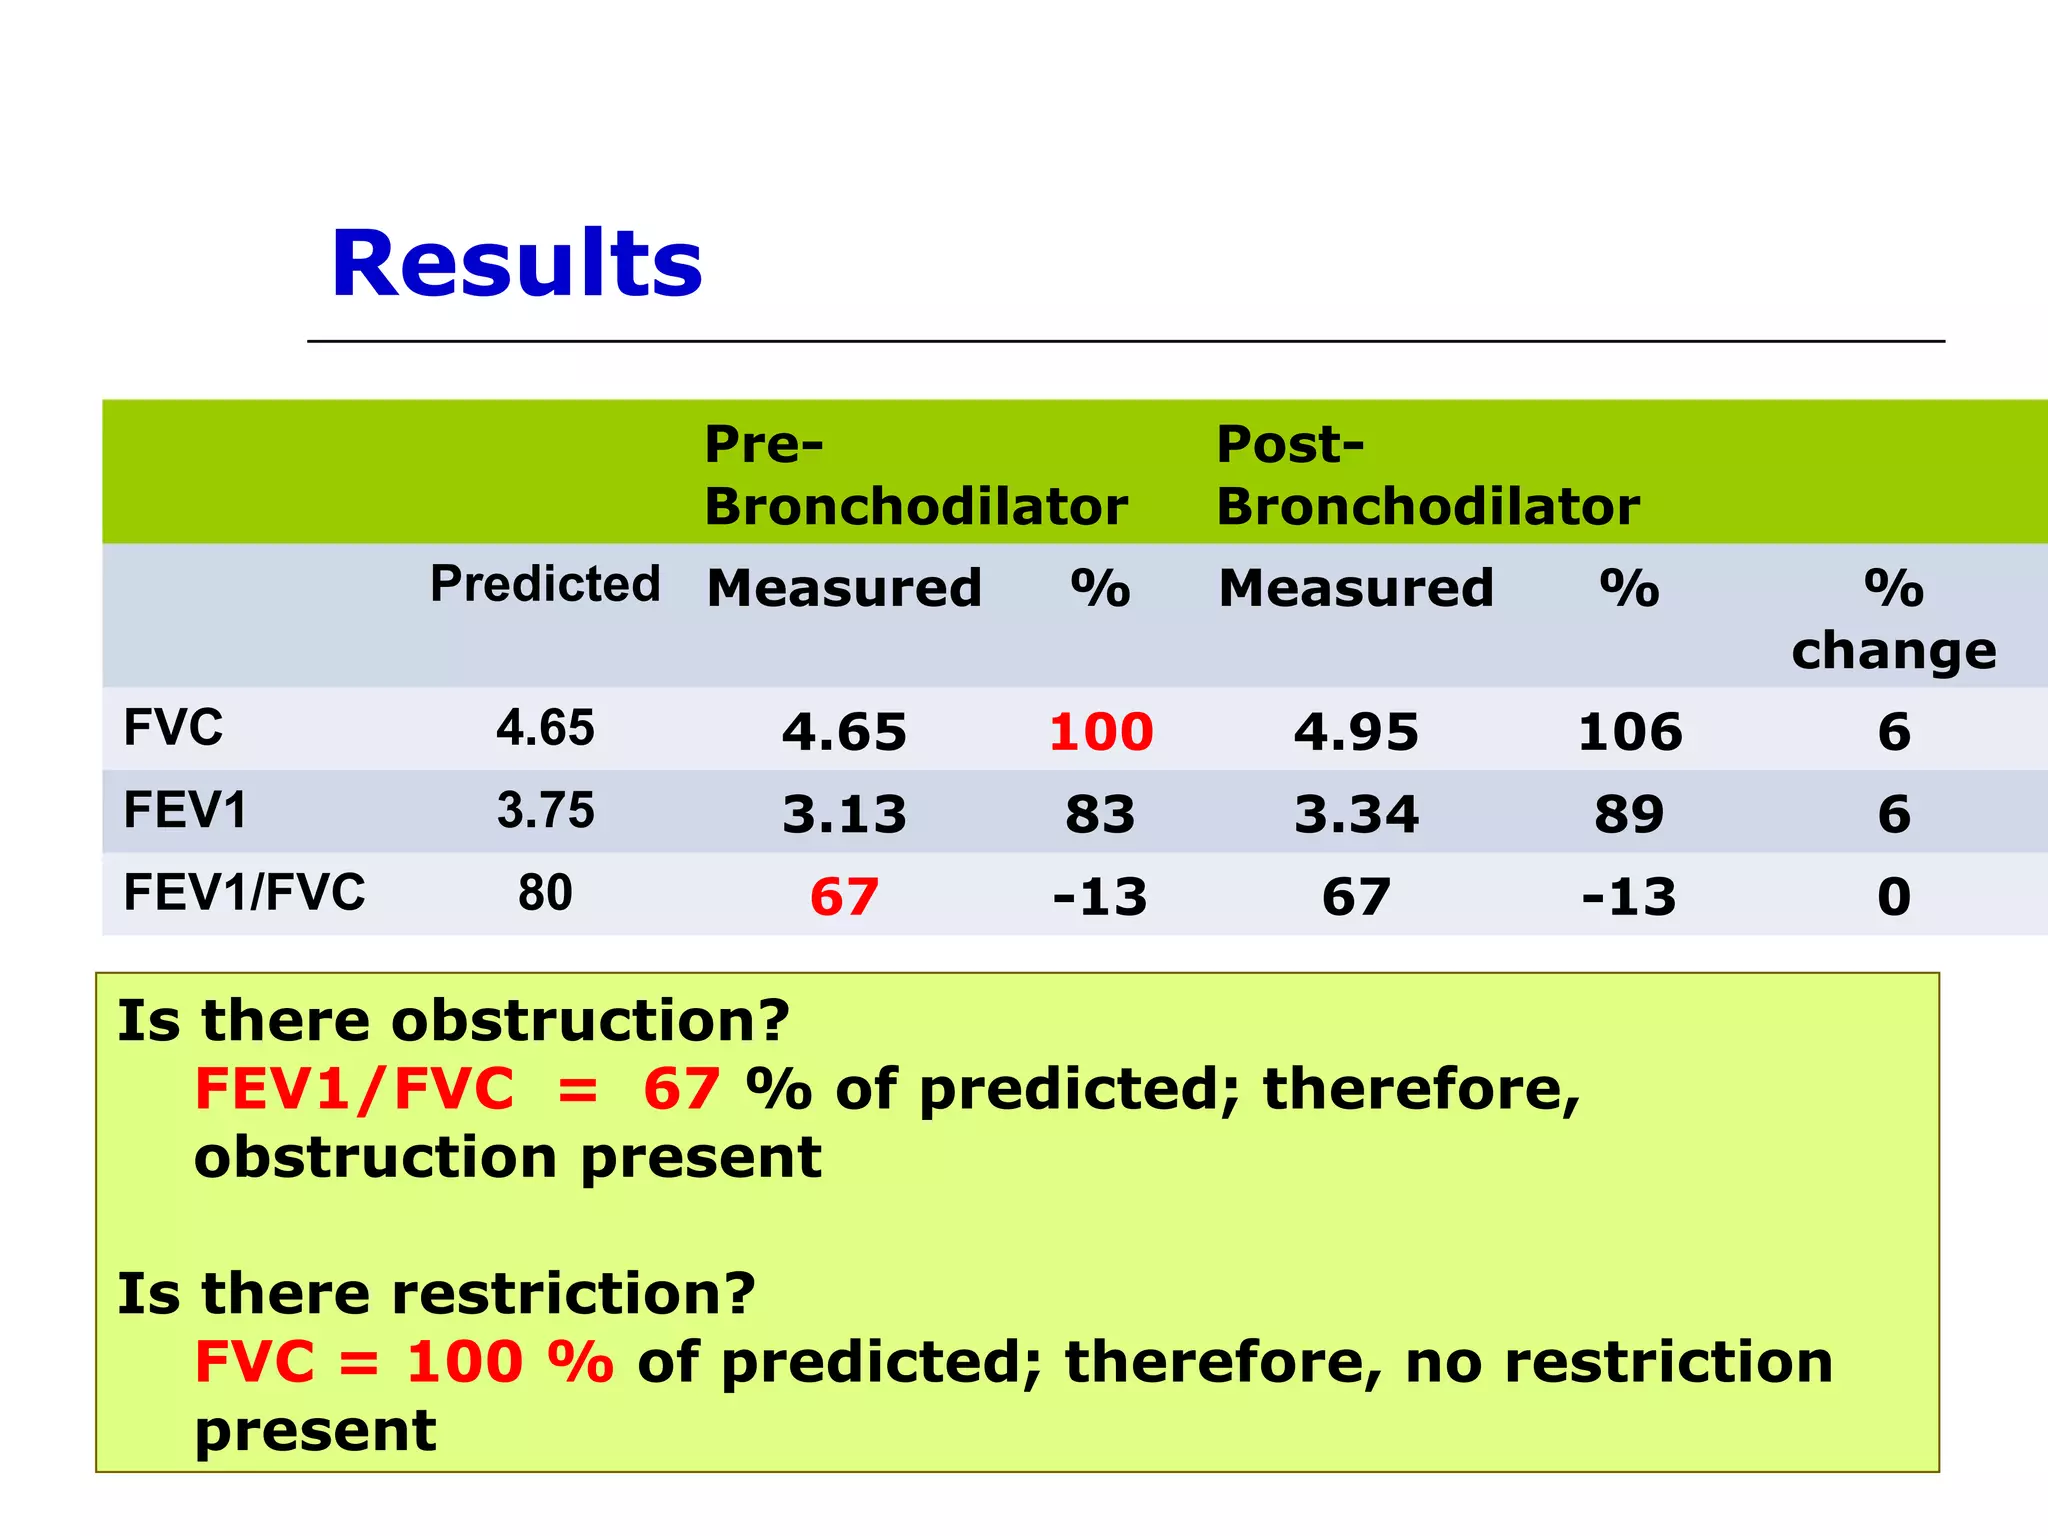
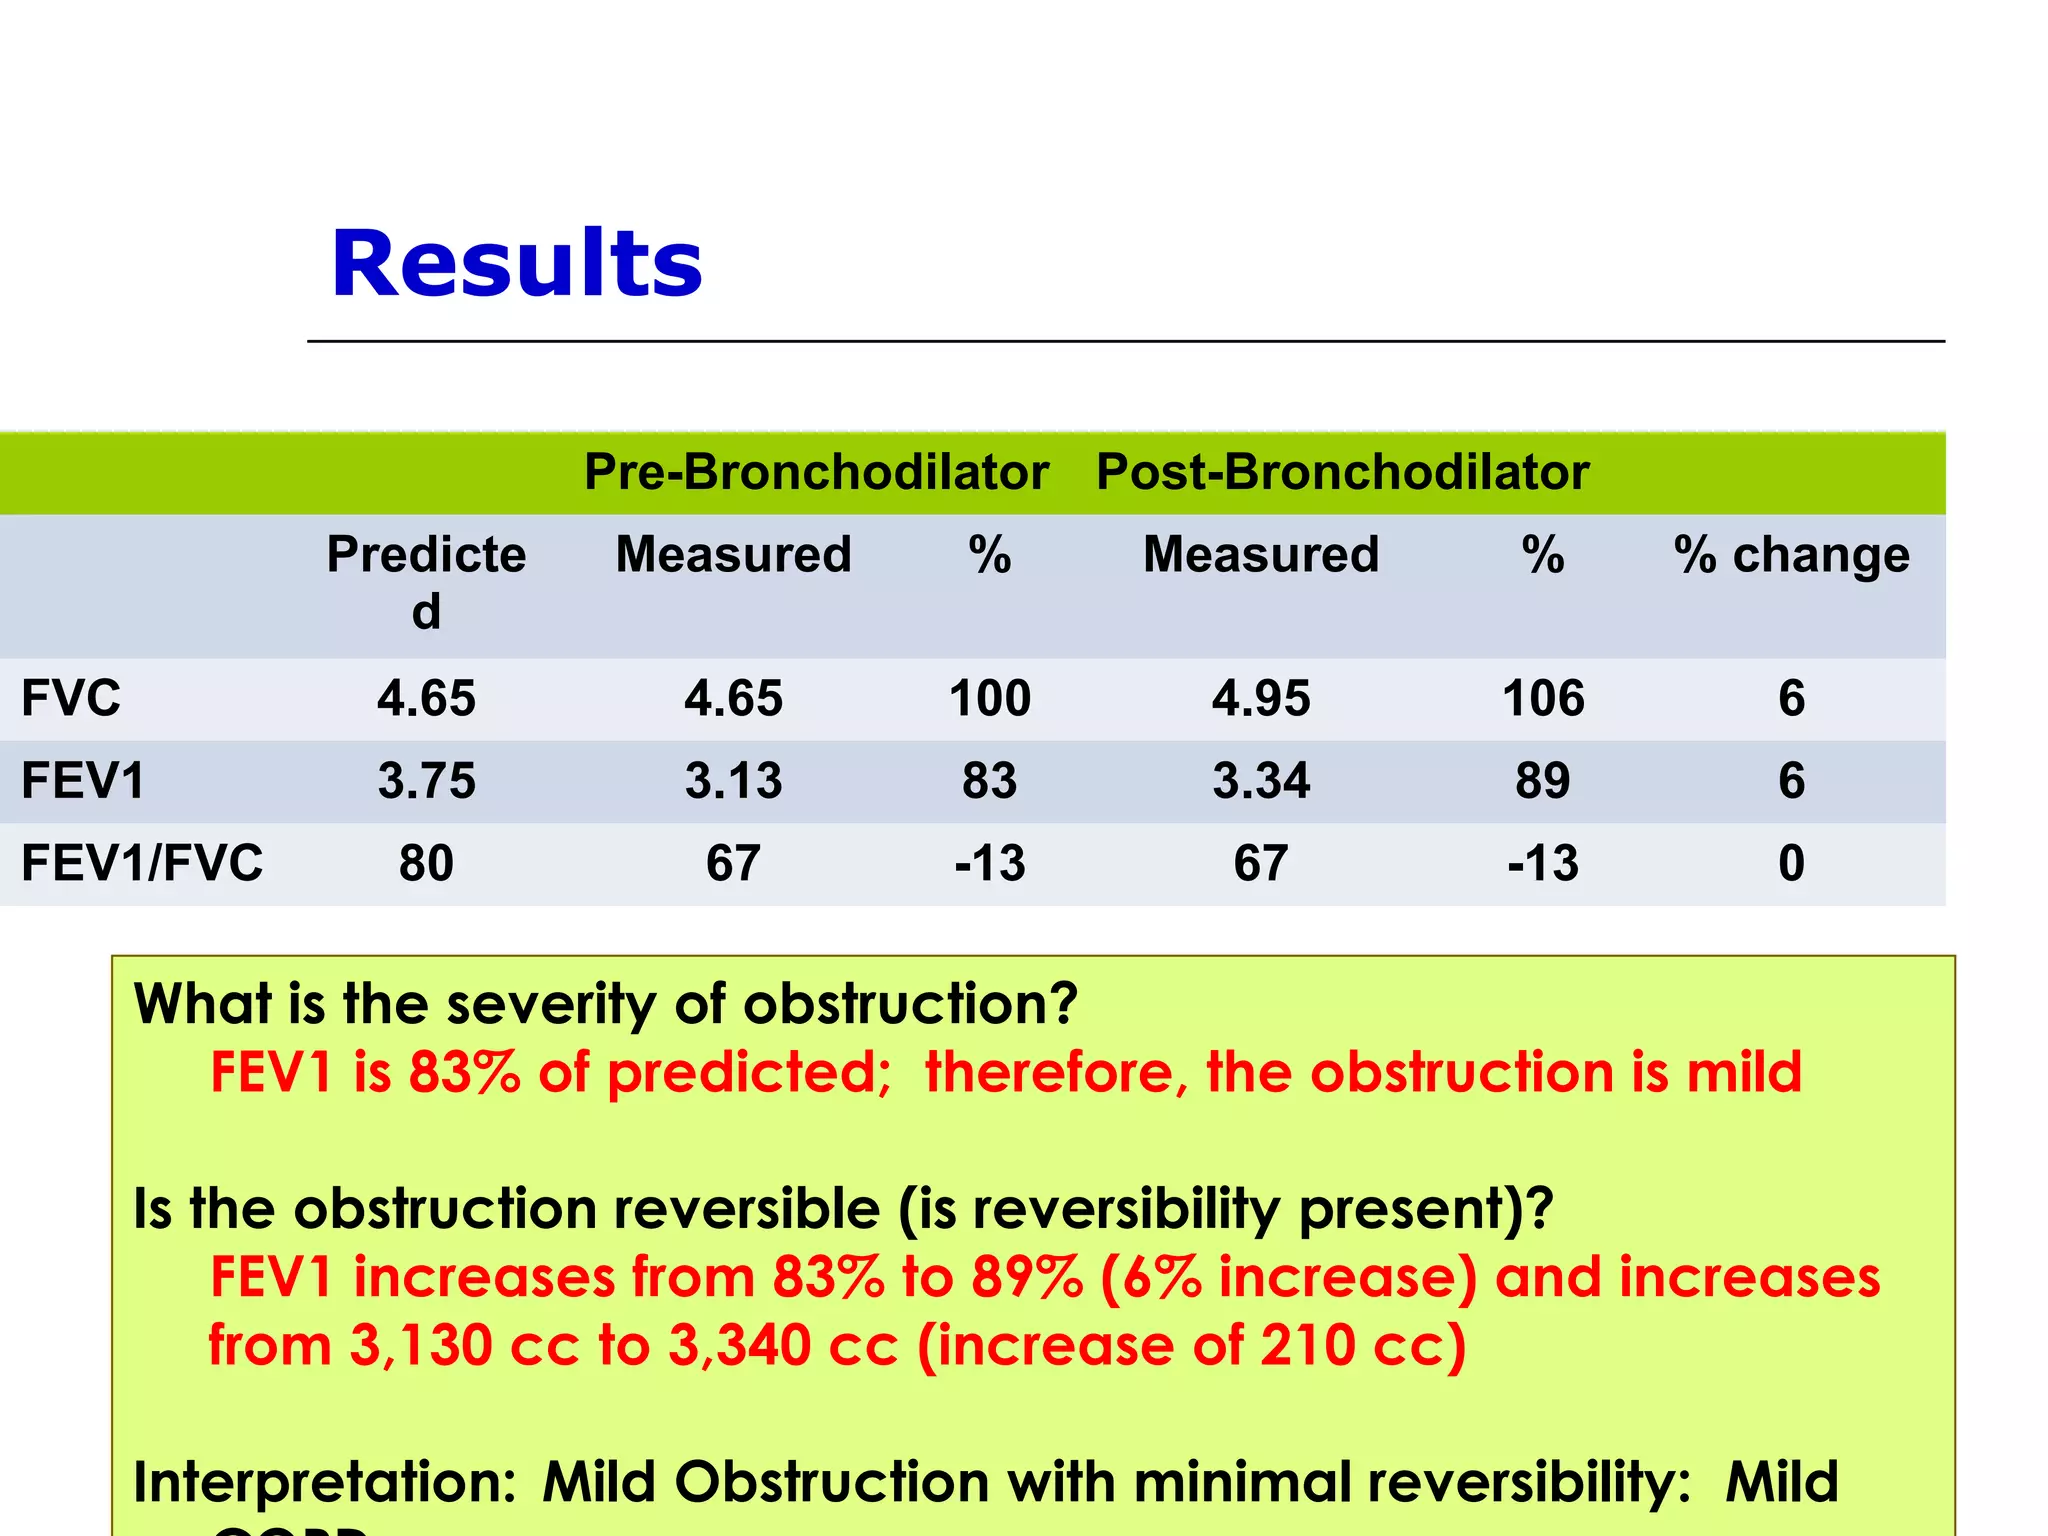
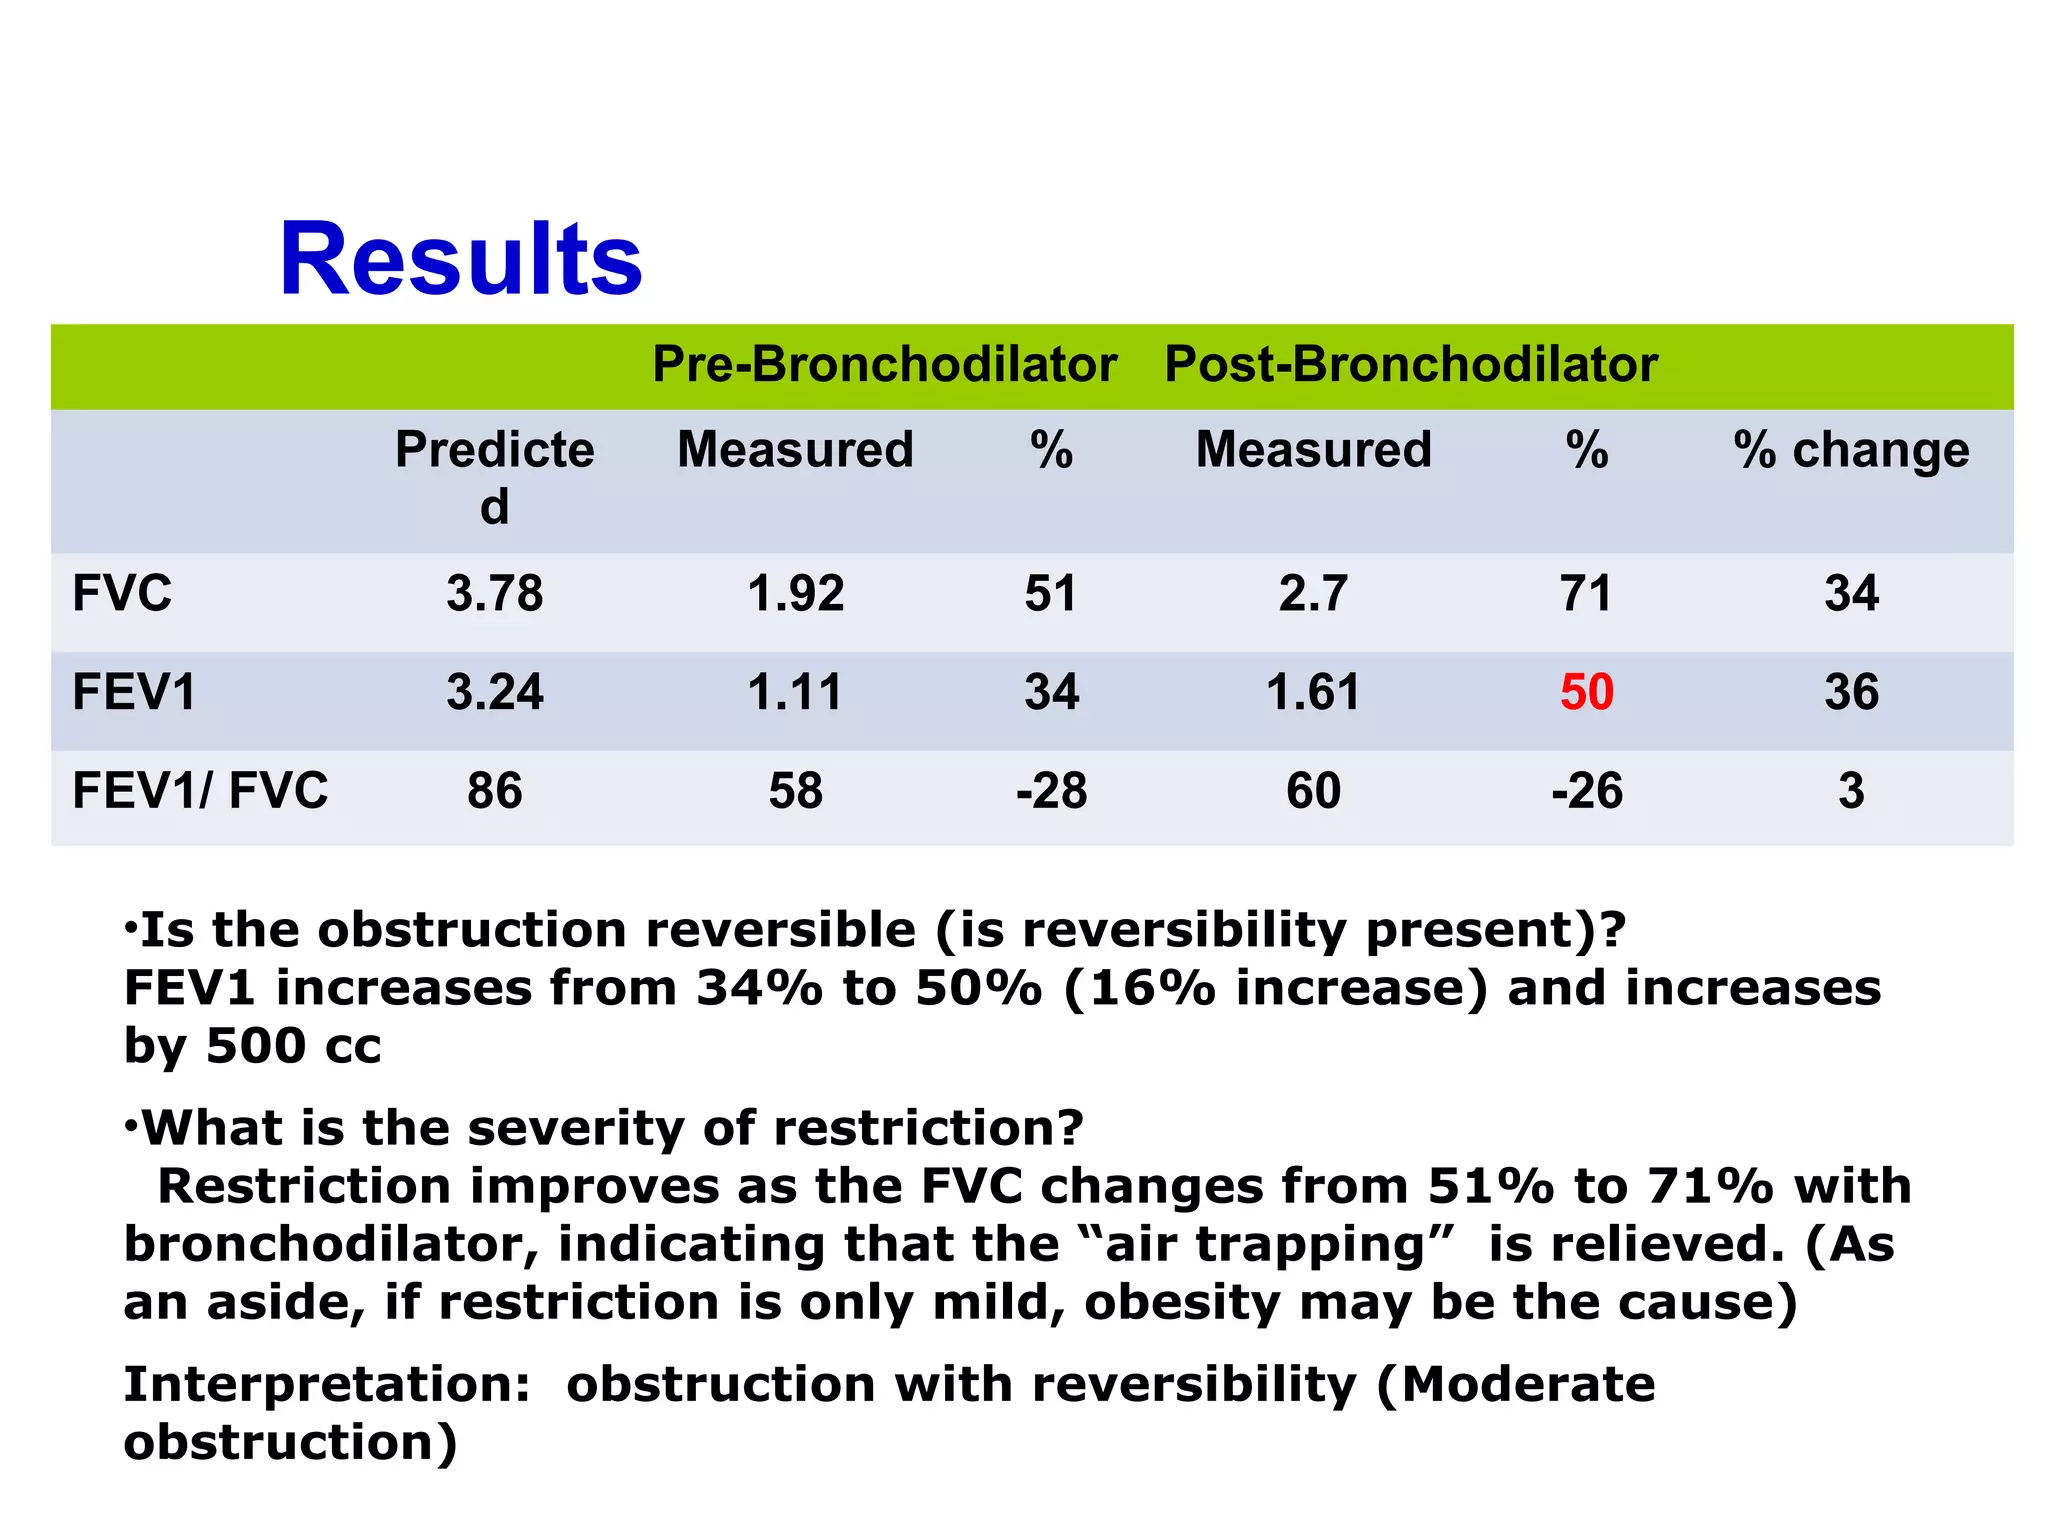
Key parameters from spirometry, case examples, comparative predicted values and interpretations.
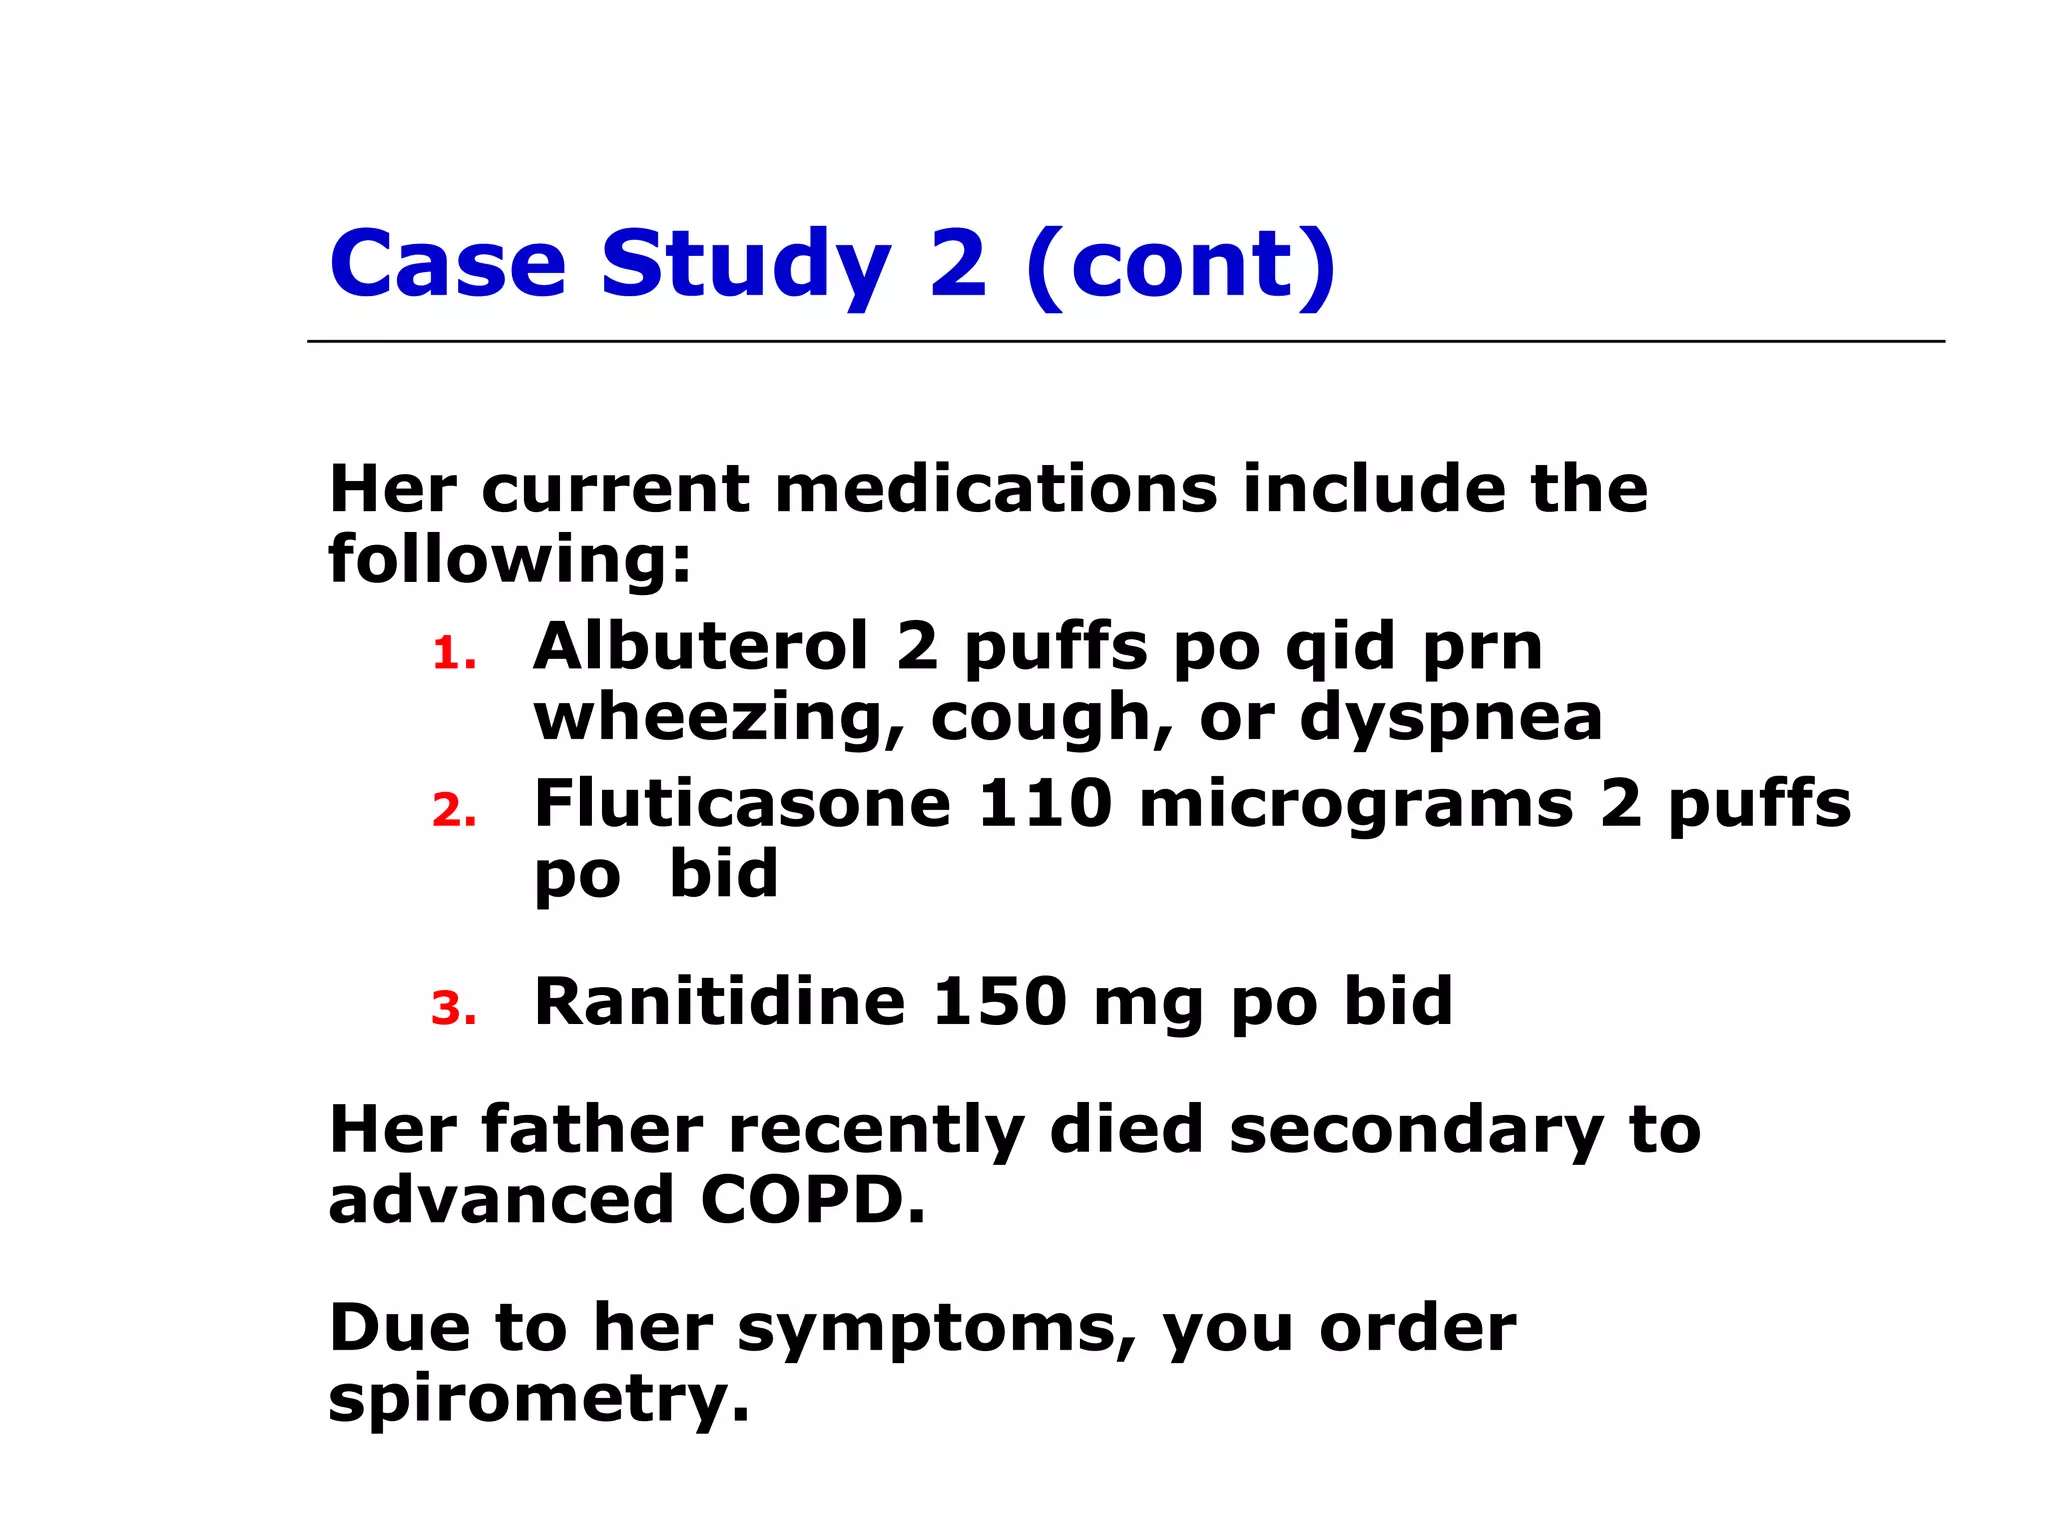
Case studies showcasing spirometry results interpretations including obstruction and restriction.


