This document provides guidelines for interpreting arterial blood gas results, including:
1. It describes how to summarize the acid-base and oxygenation status based on pH, PCO2, HCO3, PO2, and other values.
2. It outlines the steps to determine if a disturbance is respiratory or metabolic in nature, and whether it is acute or chronic.
3. Causes and compensation mechanisms for various acid-base imbalances like respiratory acidosis/alkalosis and metabolic acidosis/alkalosis are reviewed.
An overview of the presentation's focus on arterial blood gas interpretation by Dr. Crisbert I. Cualteros.
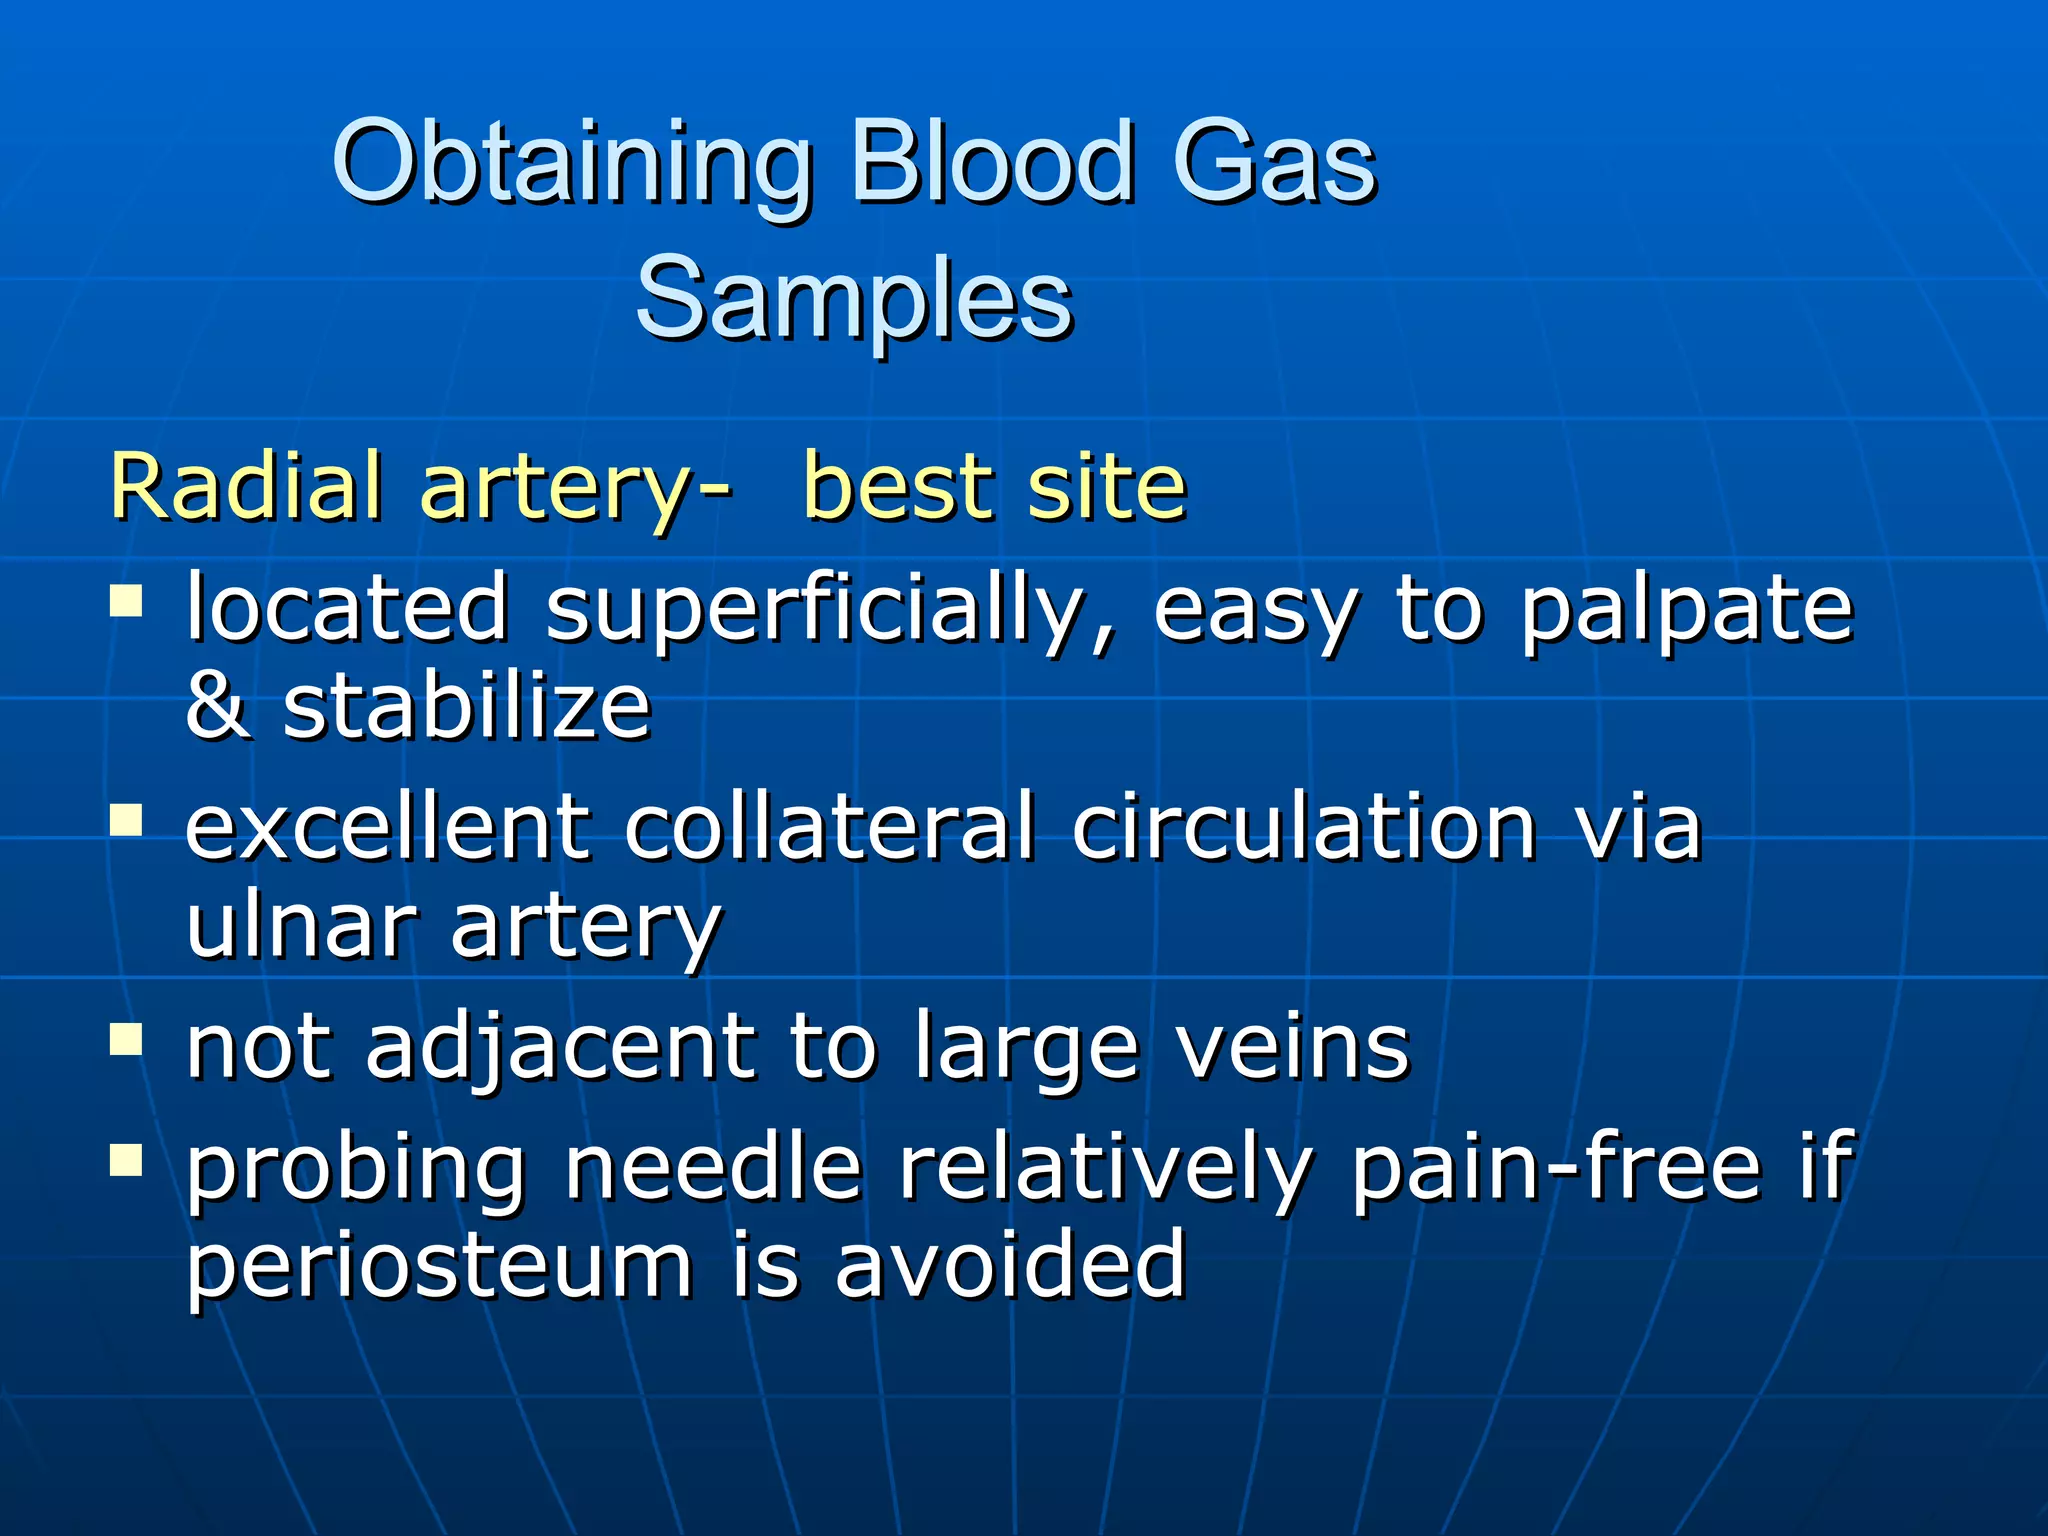
Discussion on obtaining blood gas samples focusing on radial artery techniques, including puncture methods and the importance of proper sample handling.
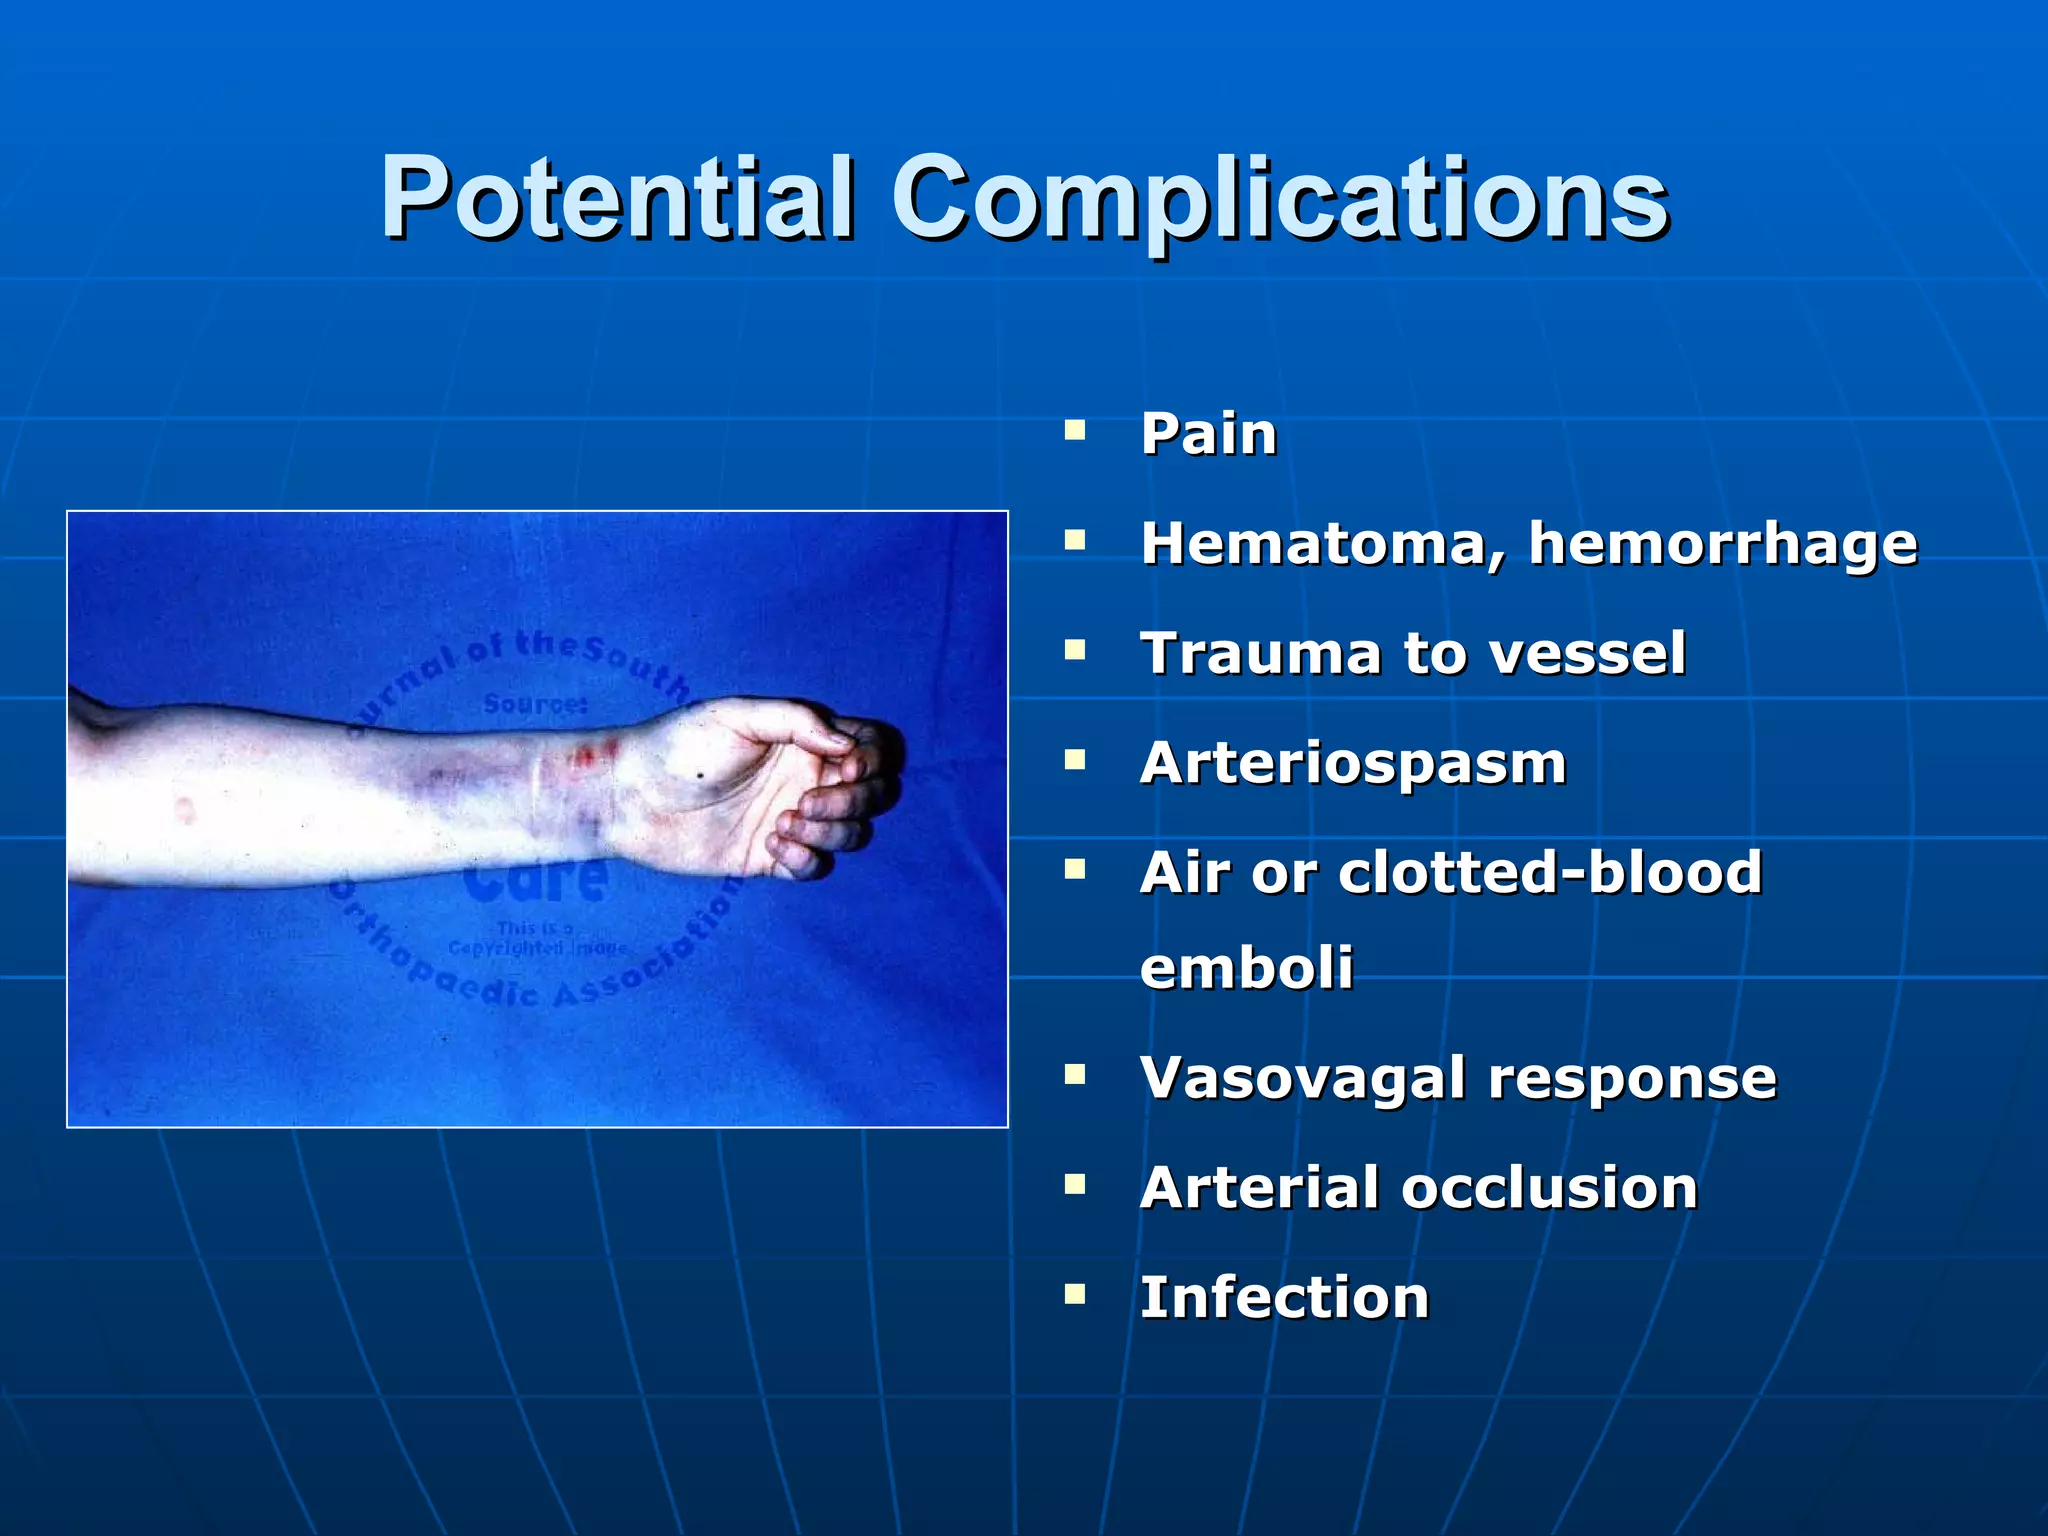
Highlights risks such as pain, hemorrhage, and infection associated with arterial blood gas sampling.
The necessity of ABG tests in assessing ventilation, acid-base balance, and oxygenation status.
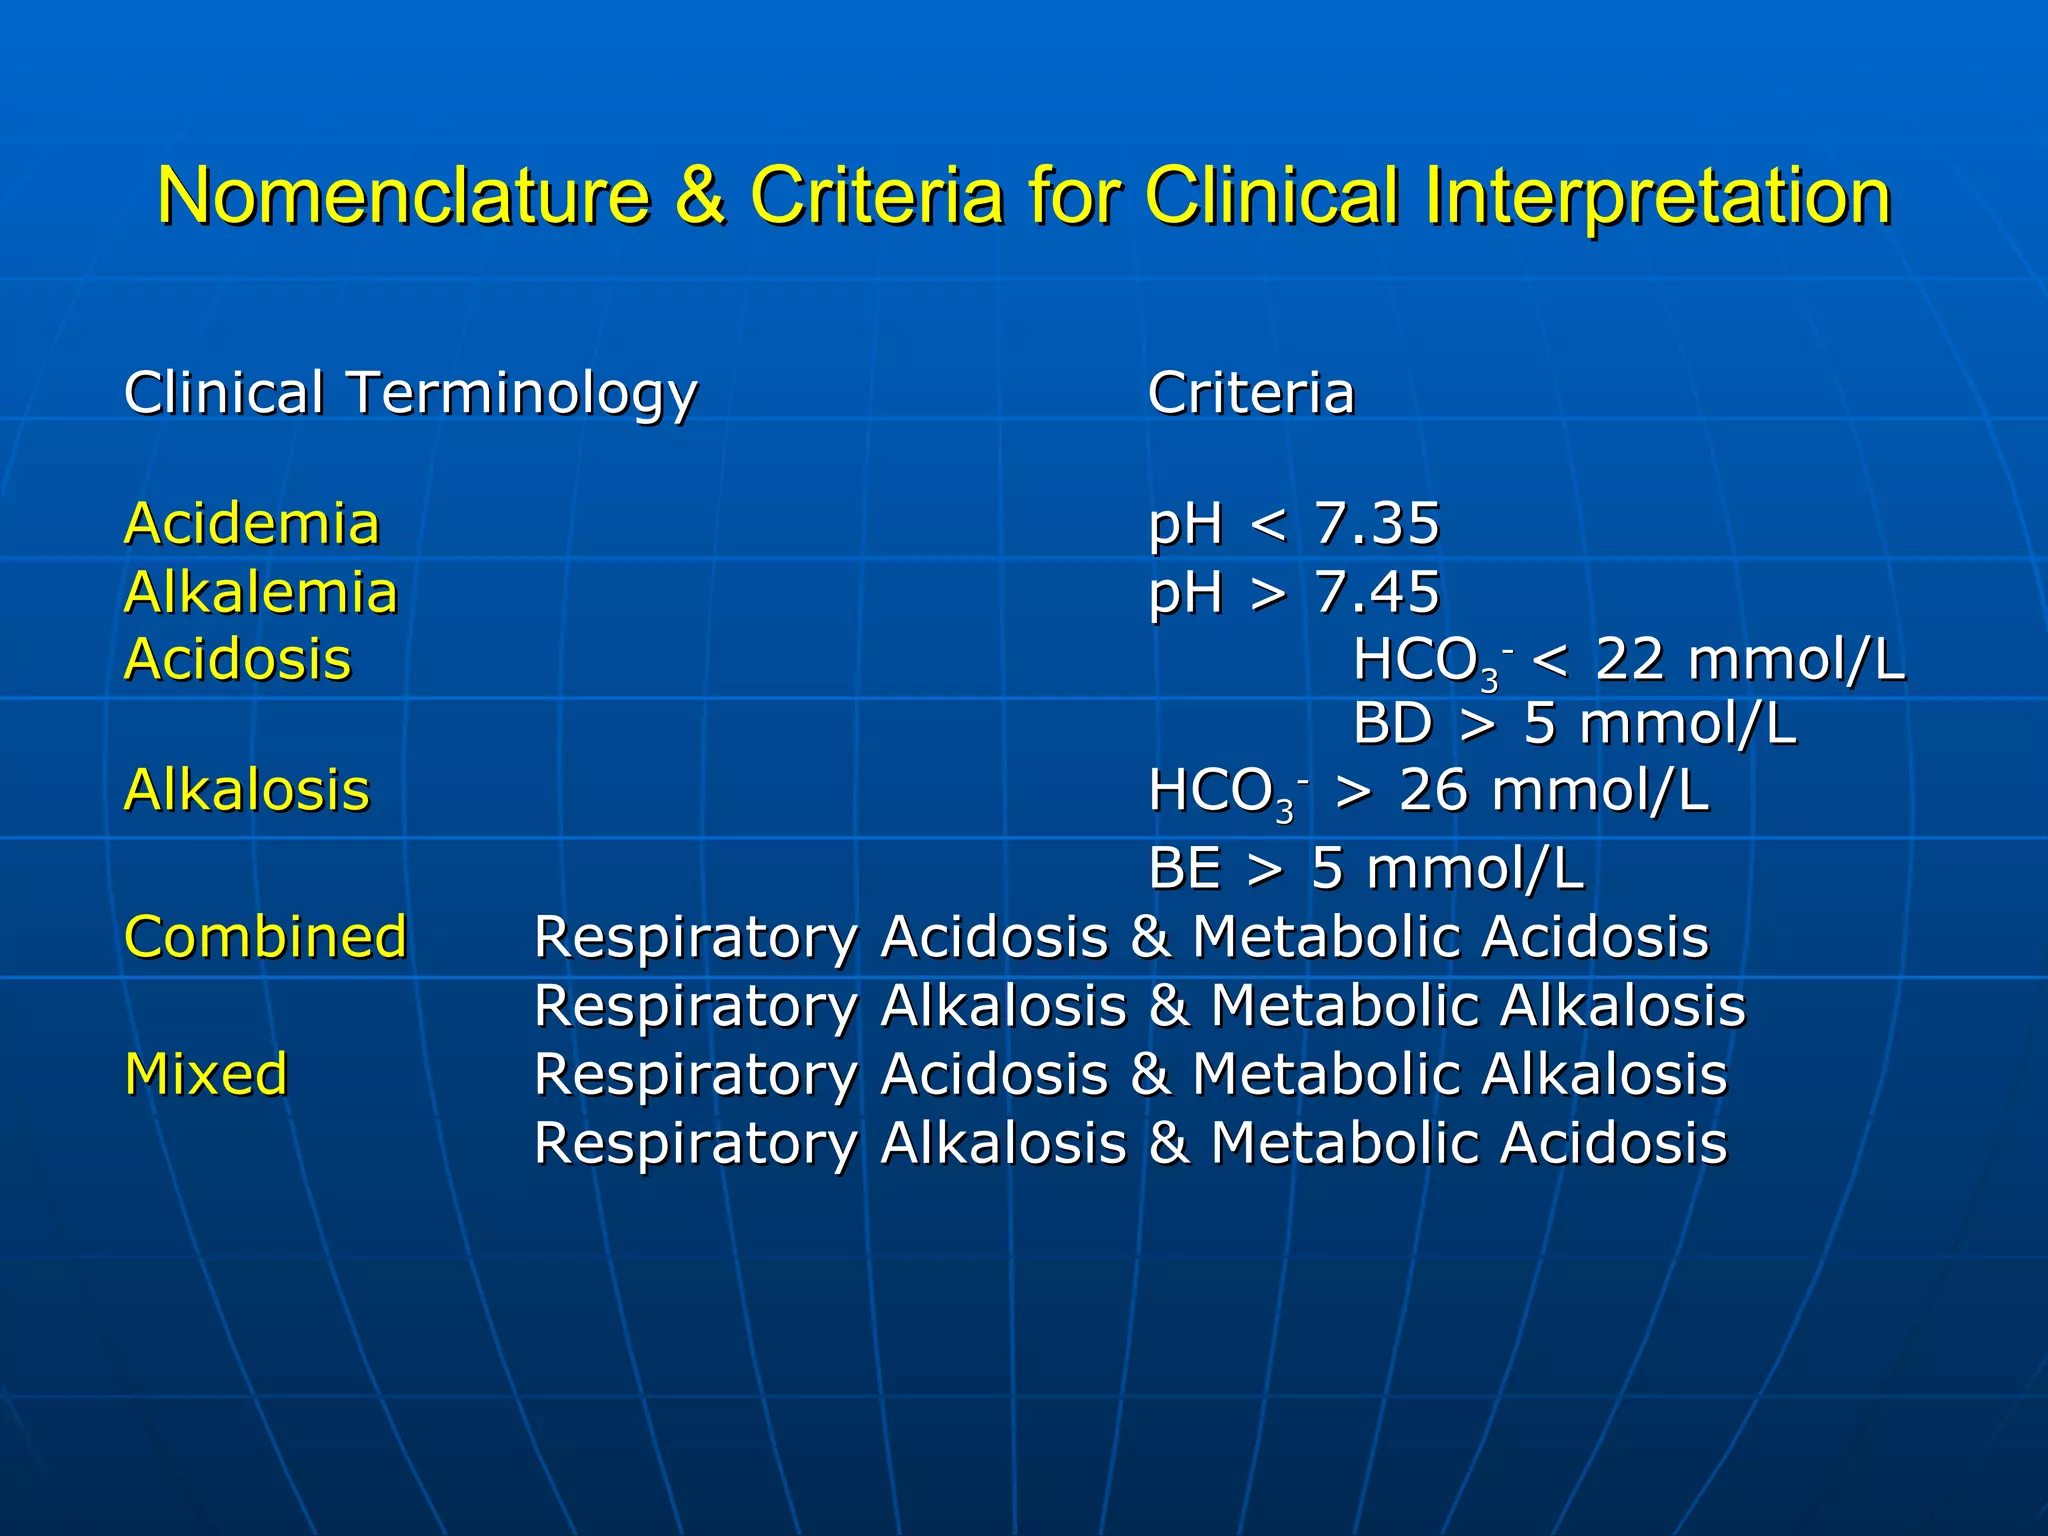
Importance of pH, HCO3-, and PCO2 levels in determining acid-base status using traditional nomenclature.
Base excess calculations and clinical criteria for interpreting acid-base imbalances, including acidemia and alkalemia.
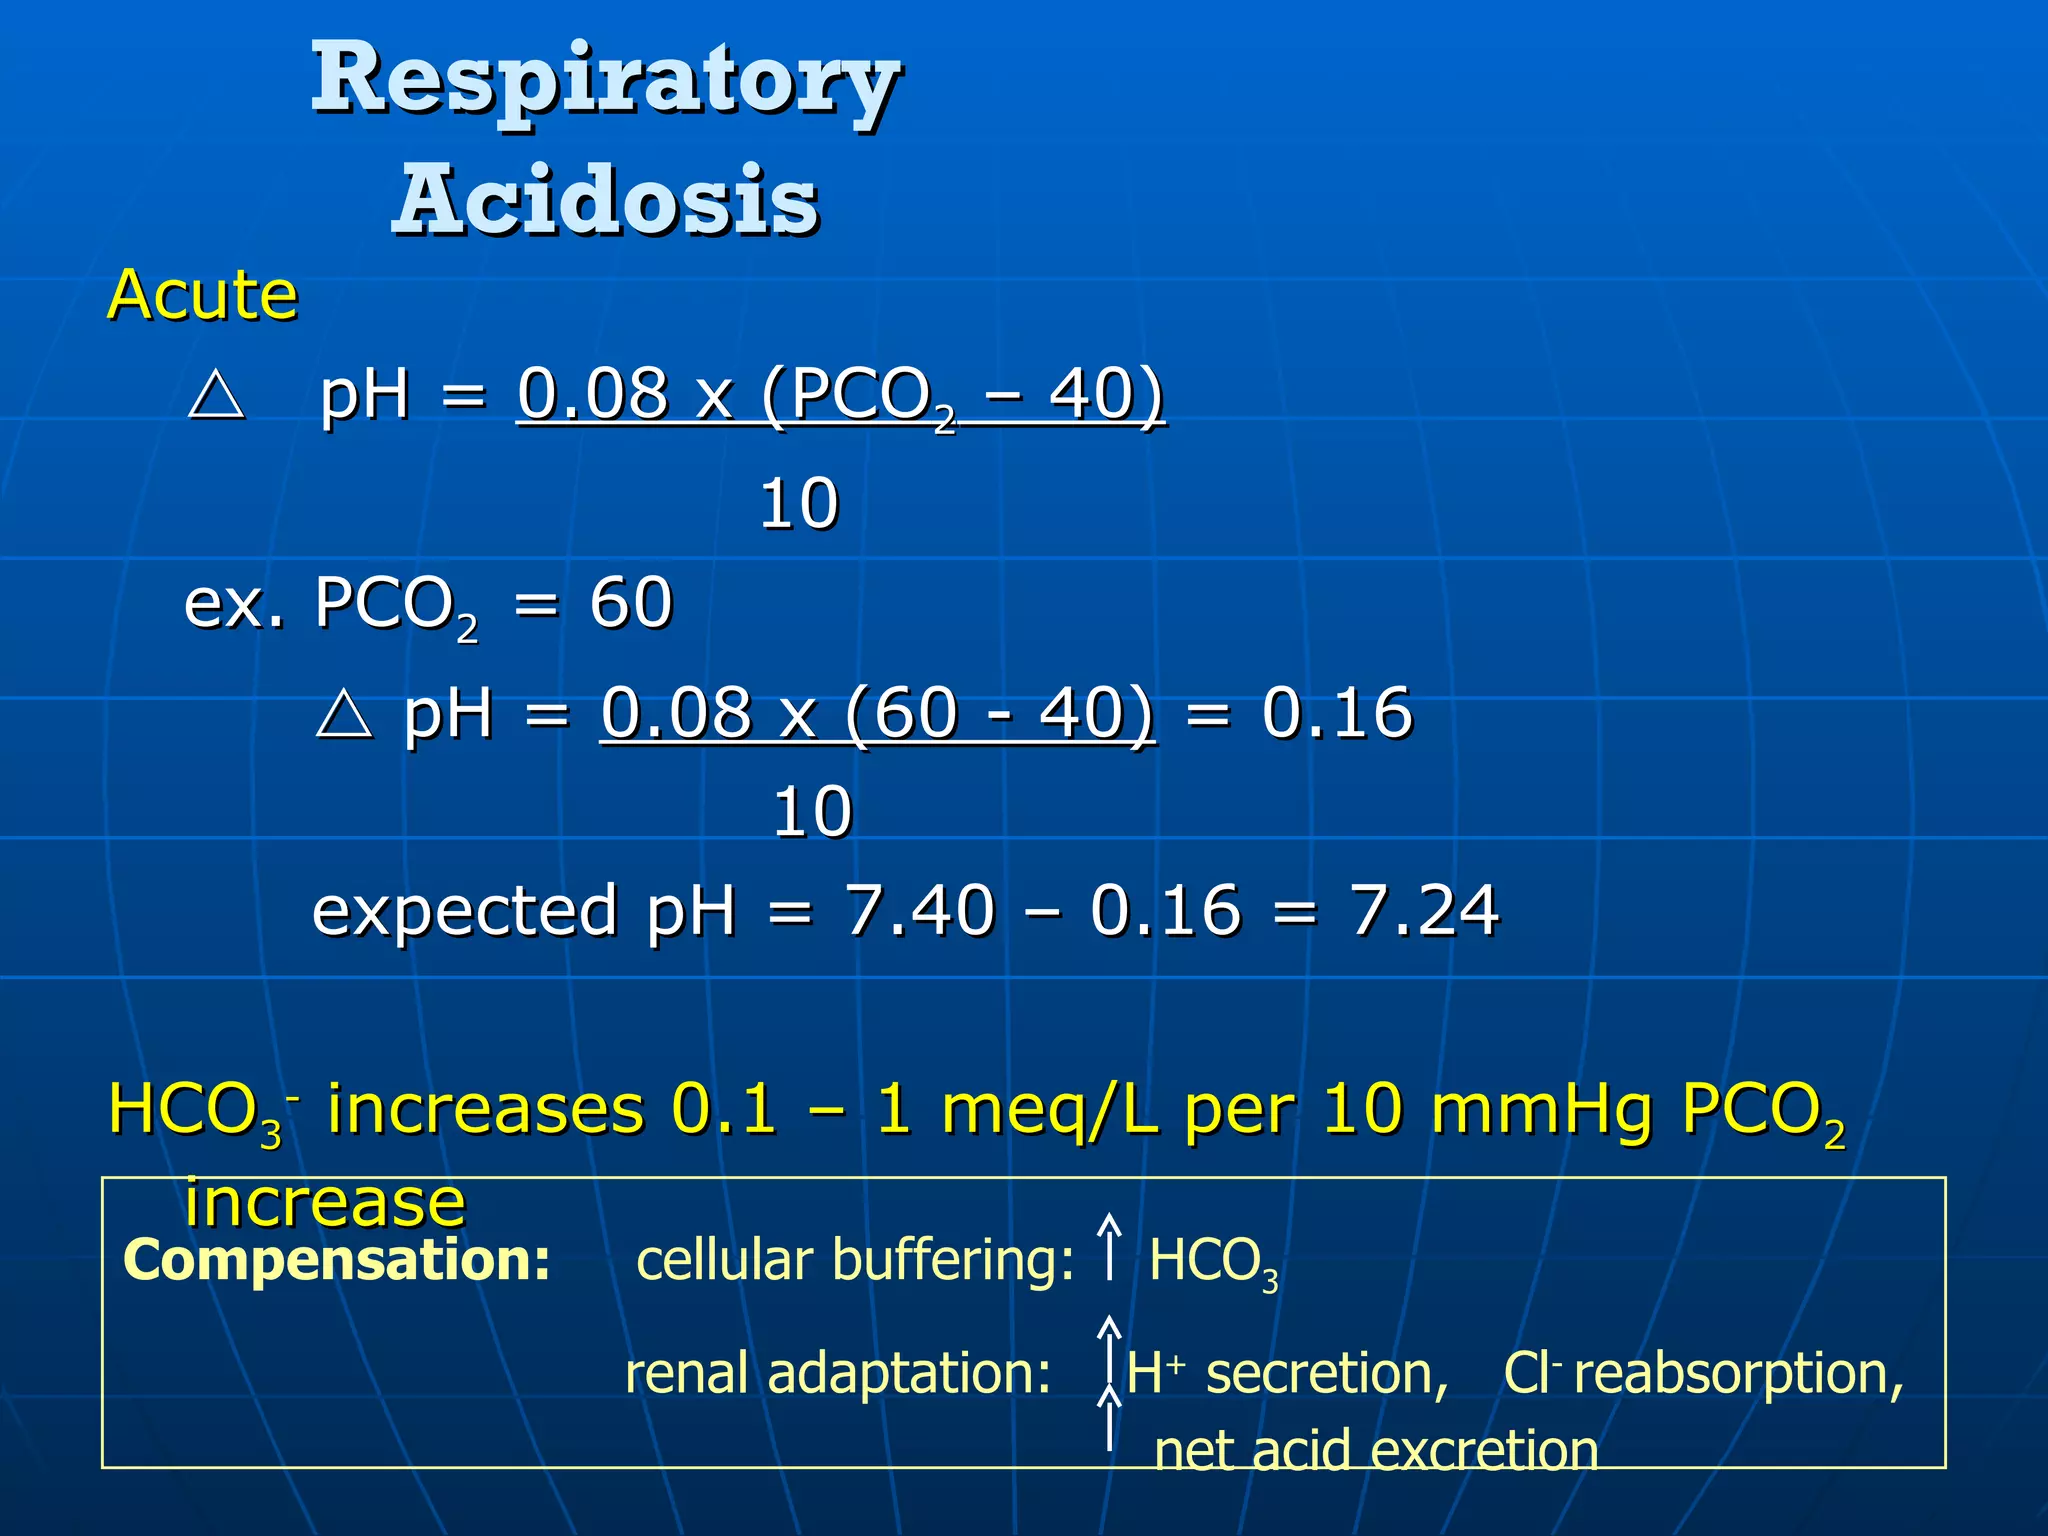
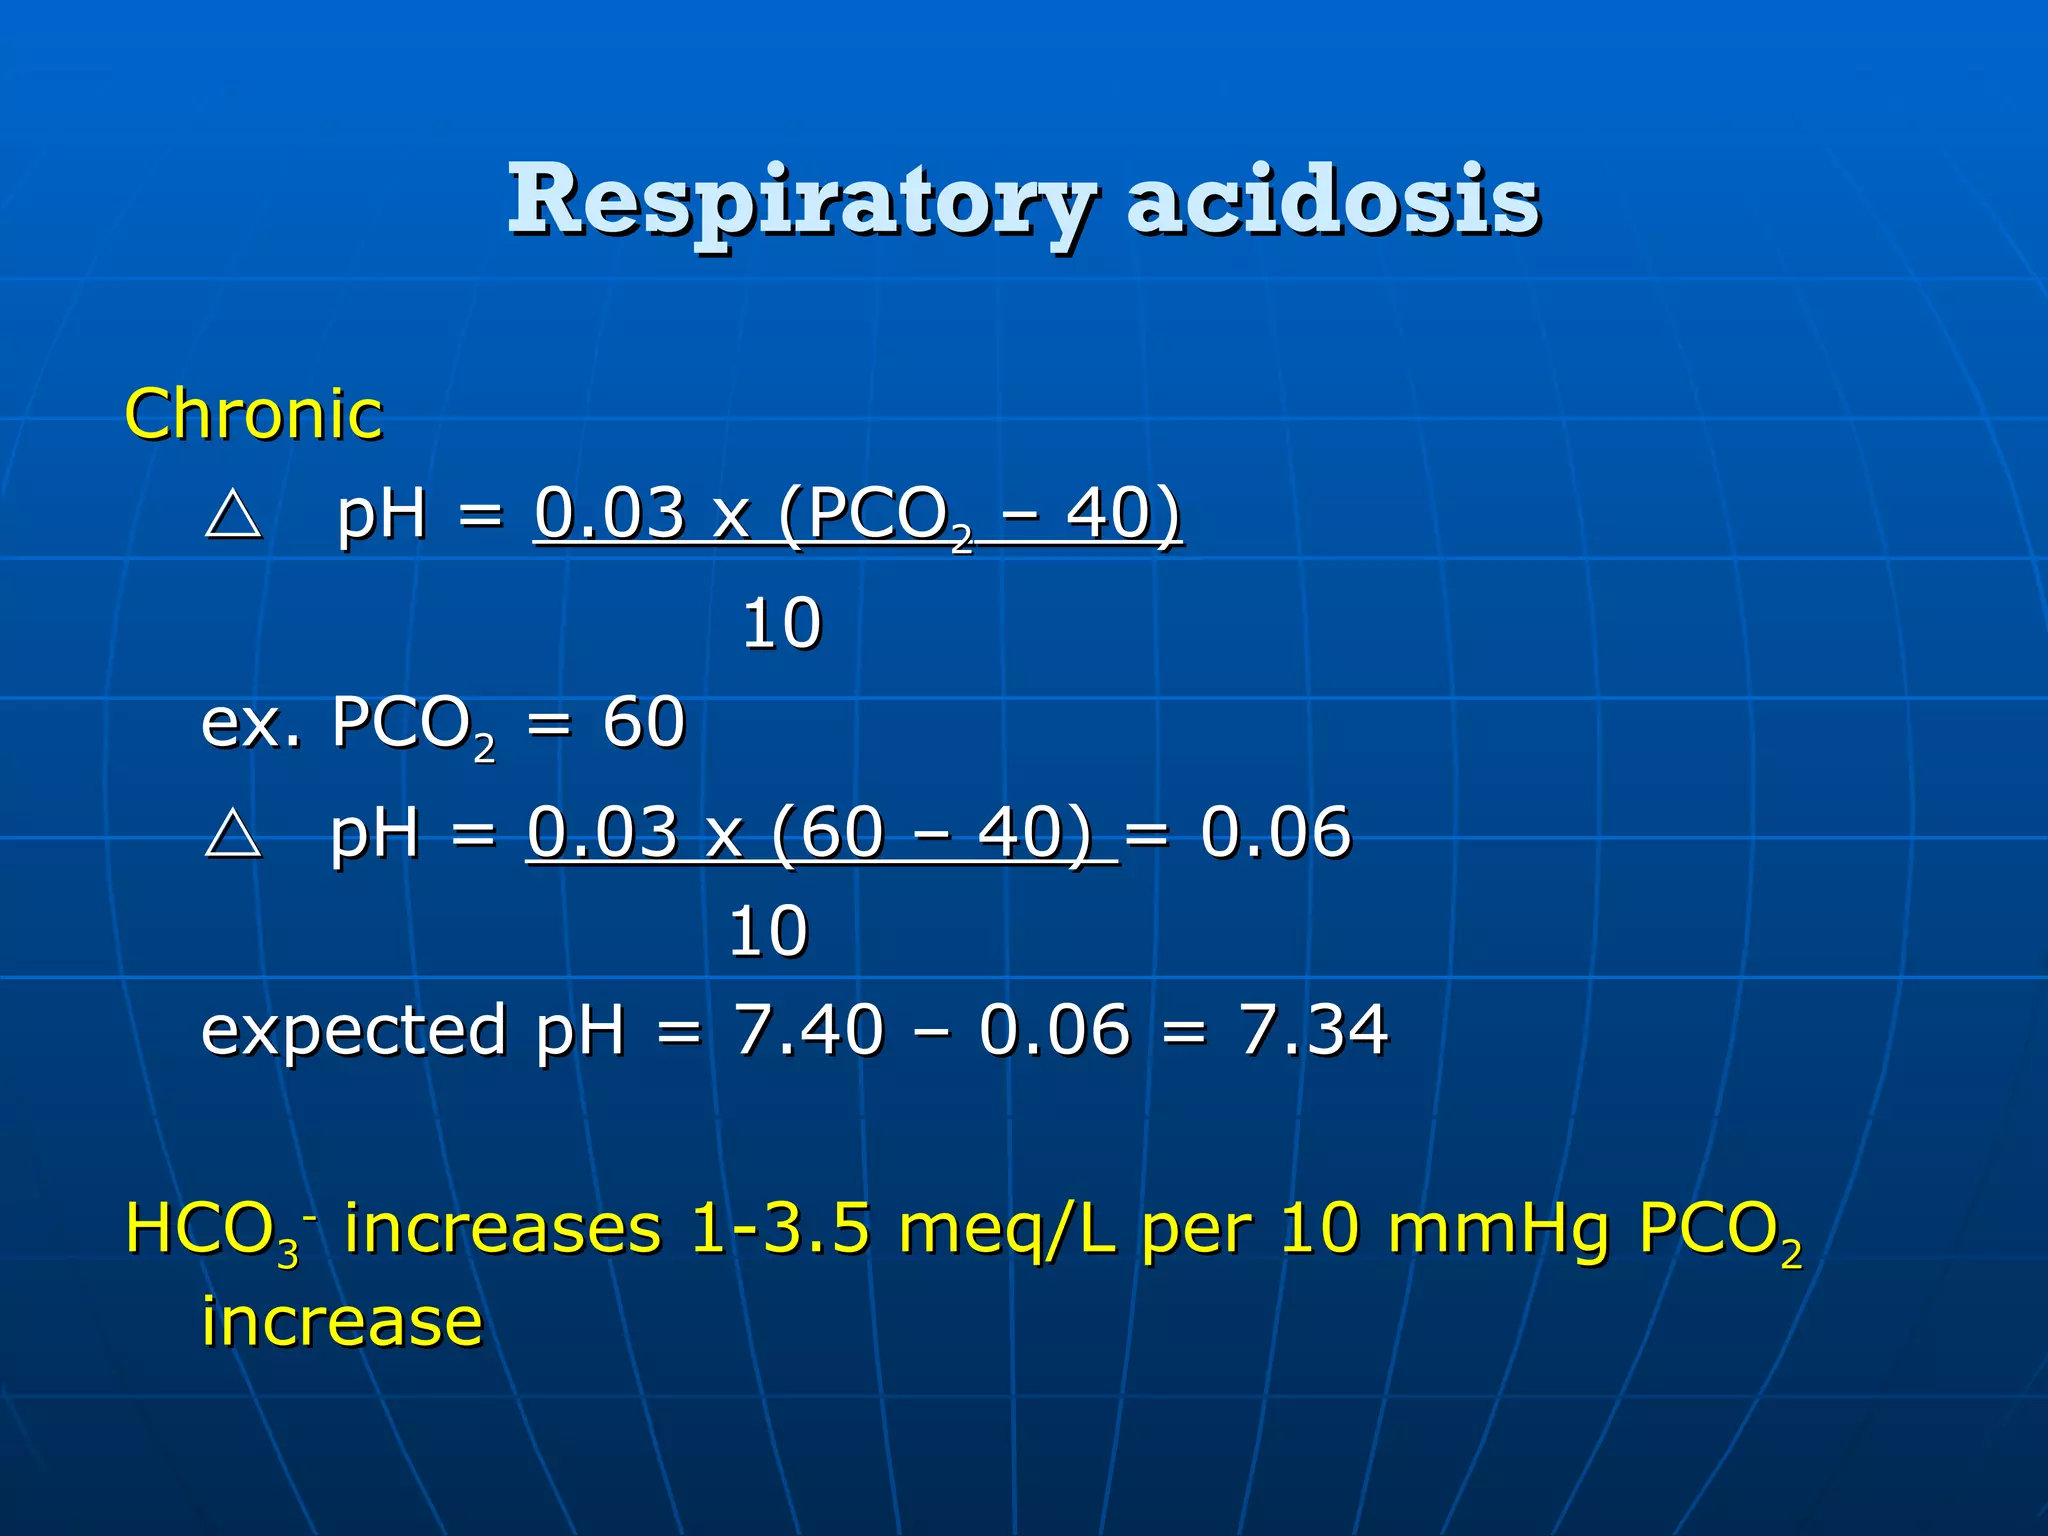
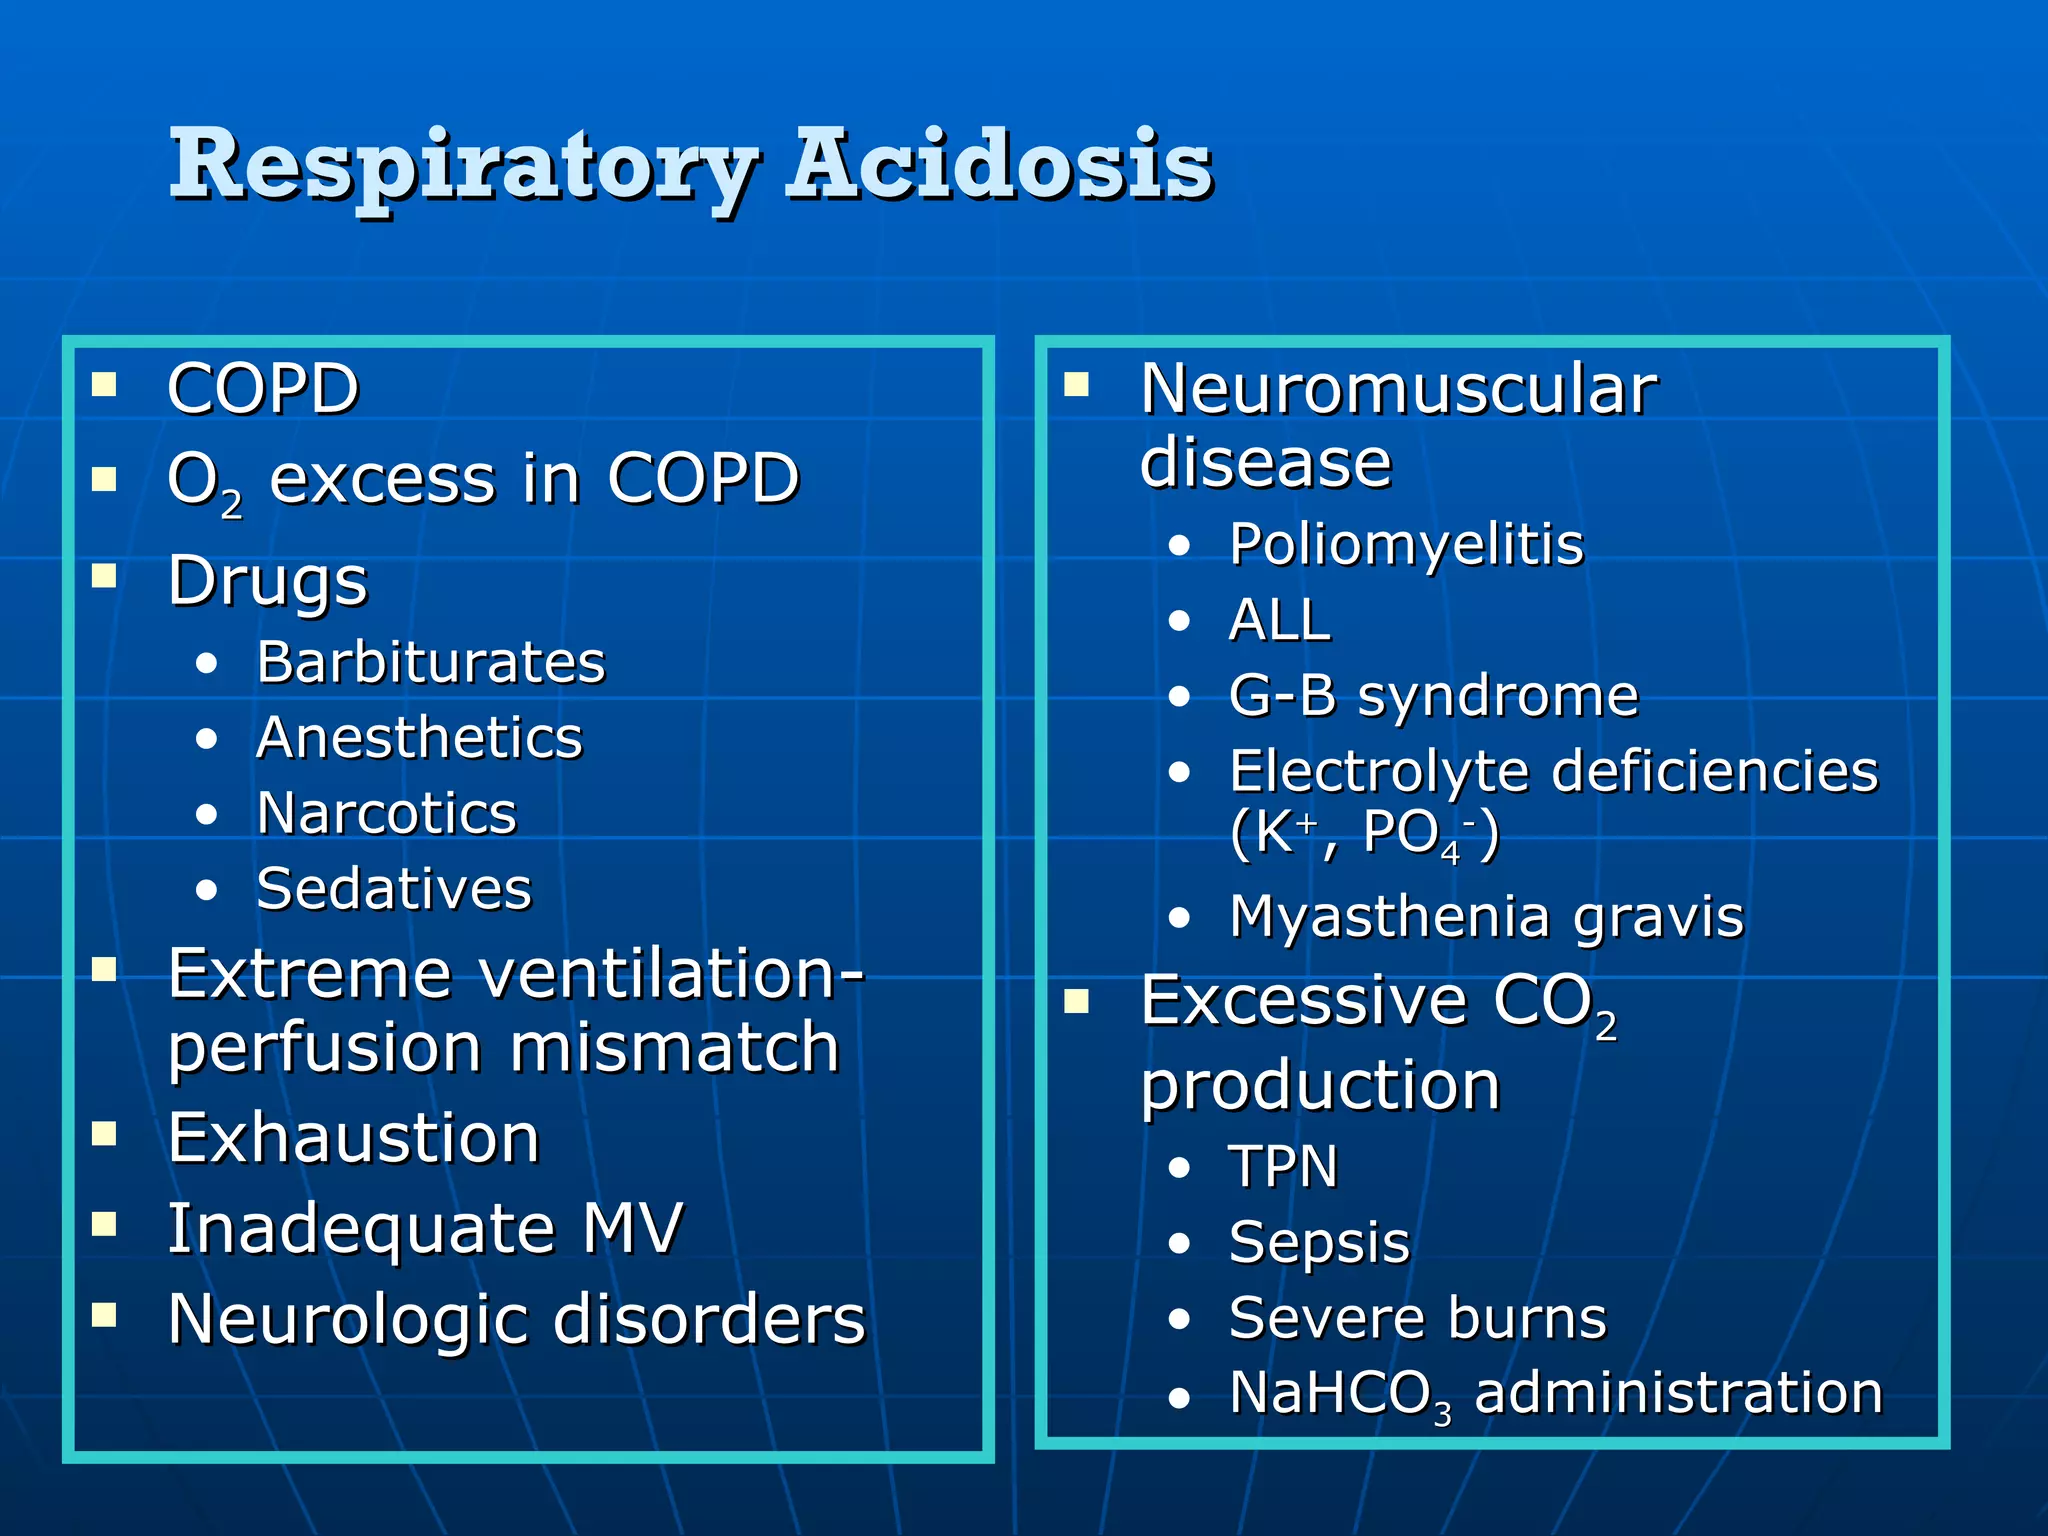
Details on acute and chronic respiratory acidosis, including calculation examples and contributing factors.
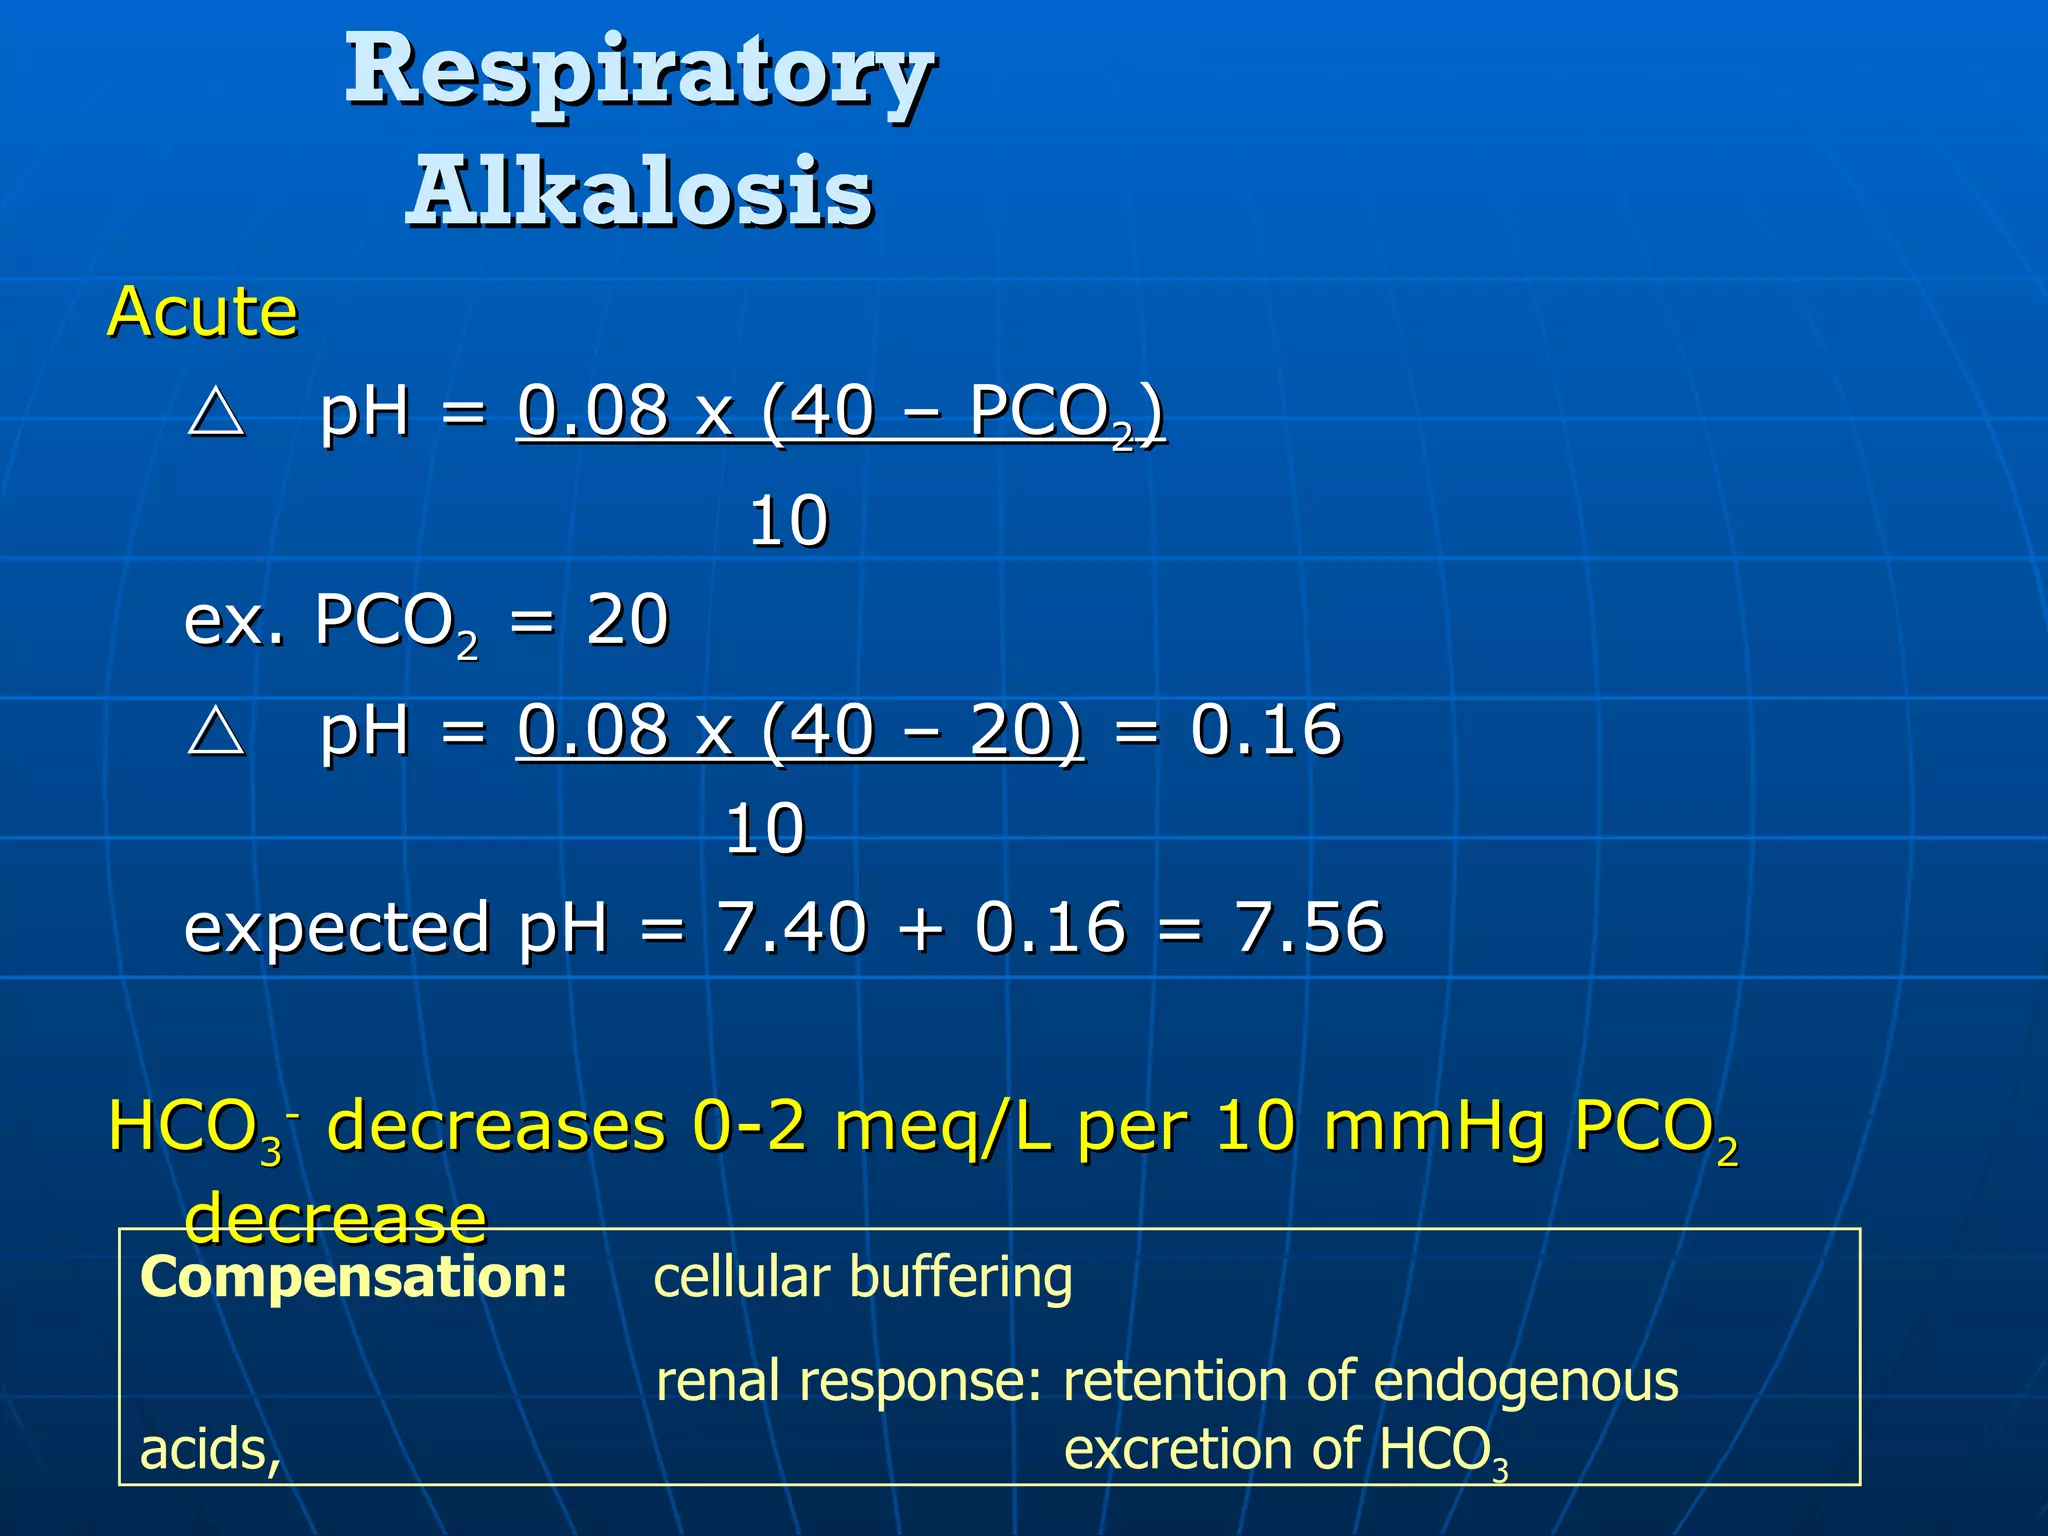
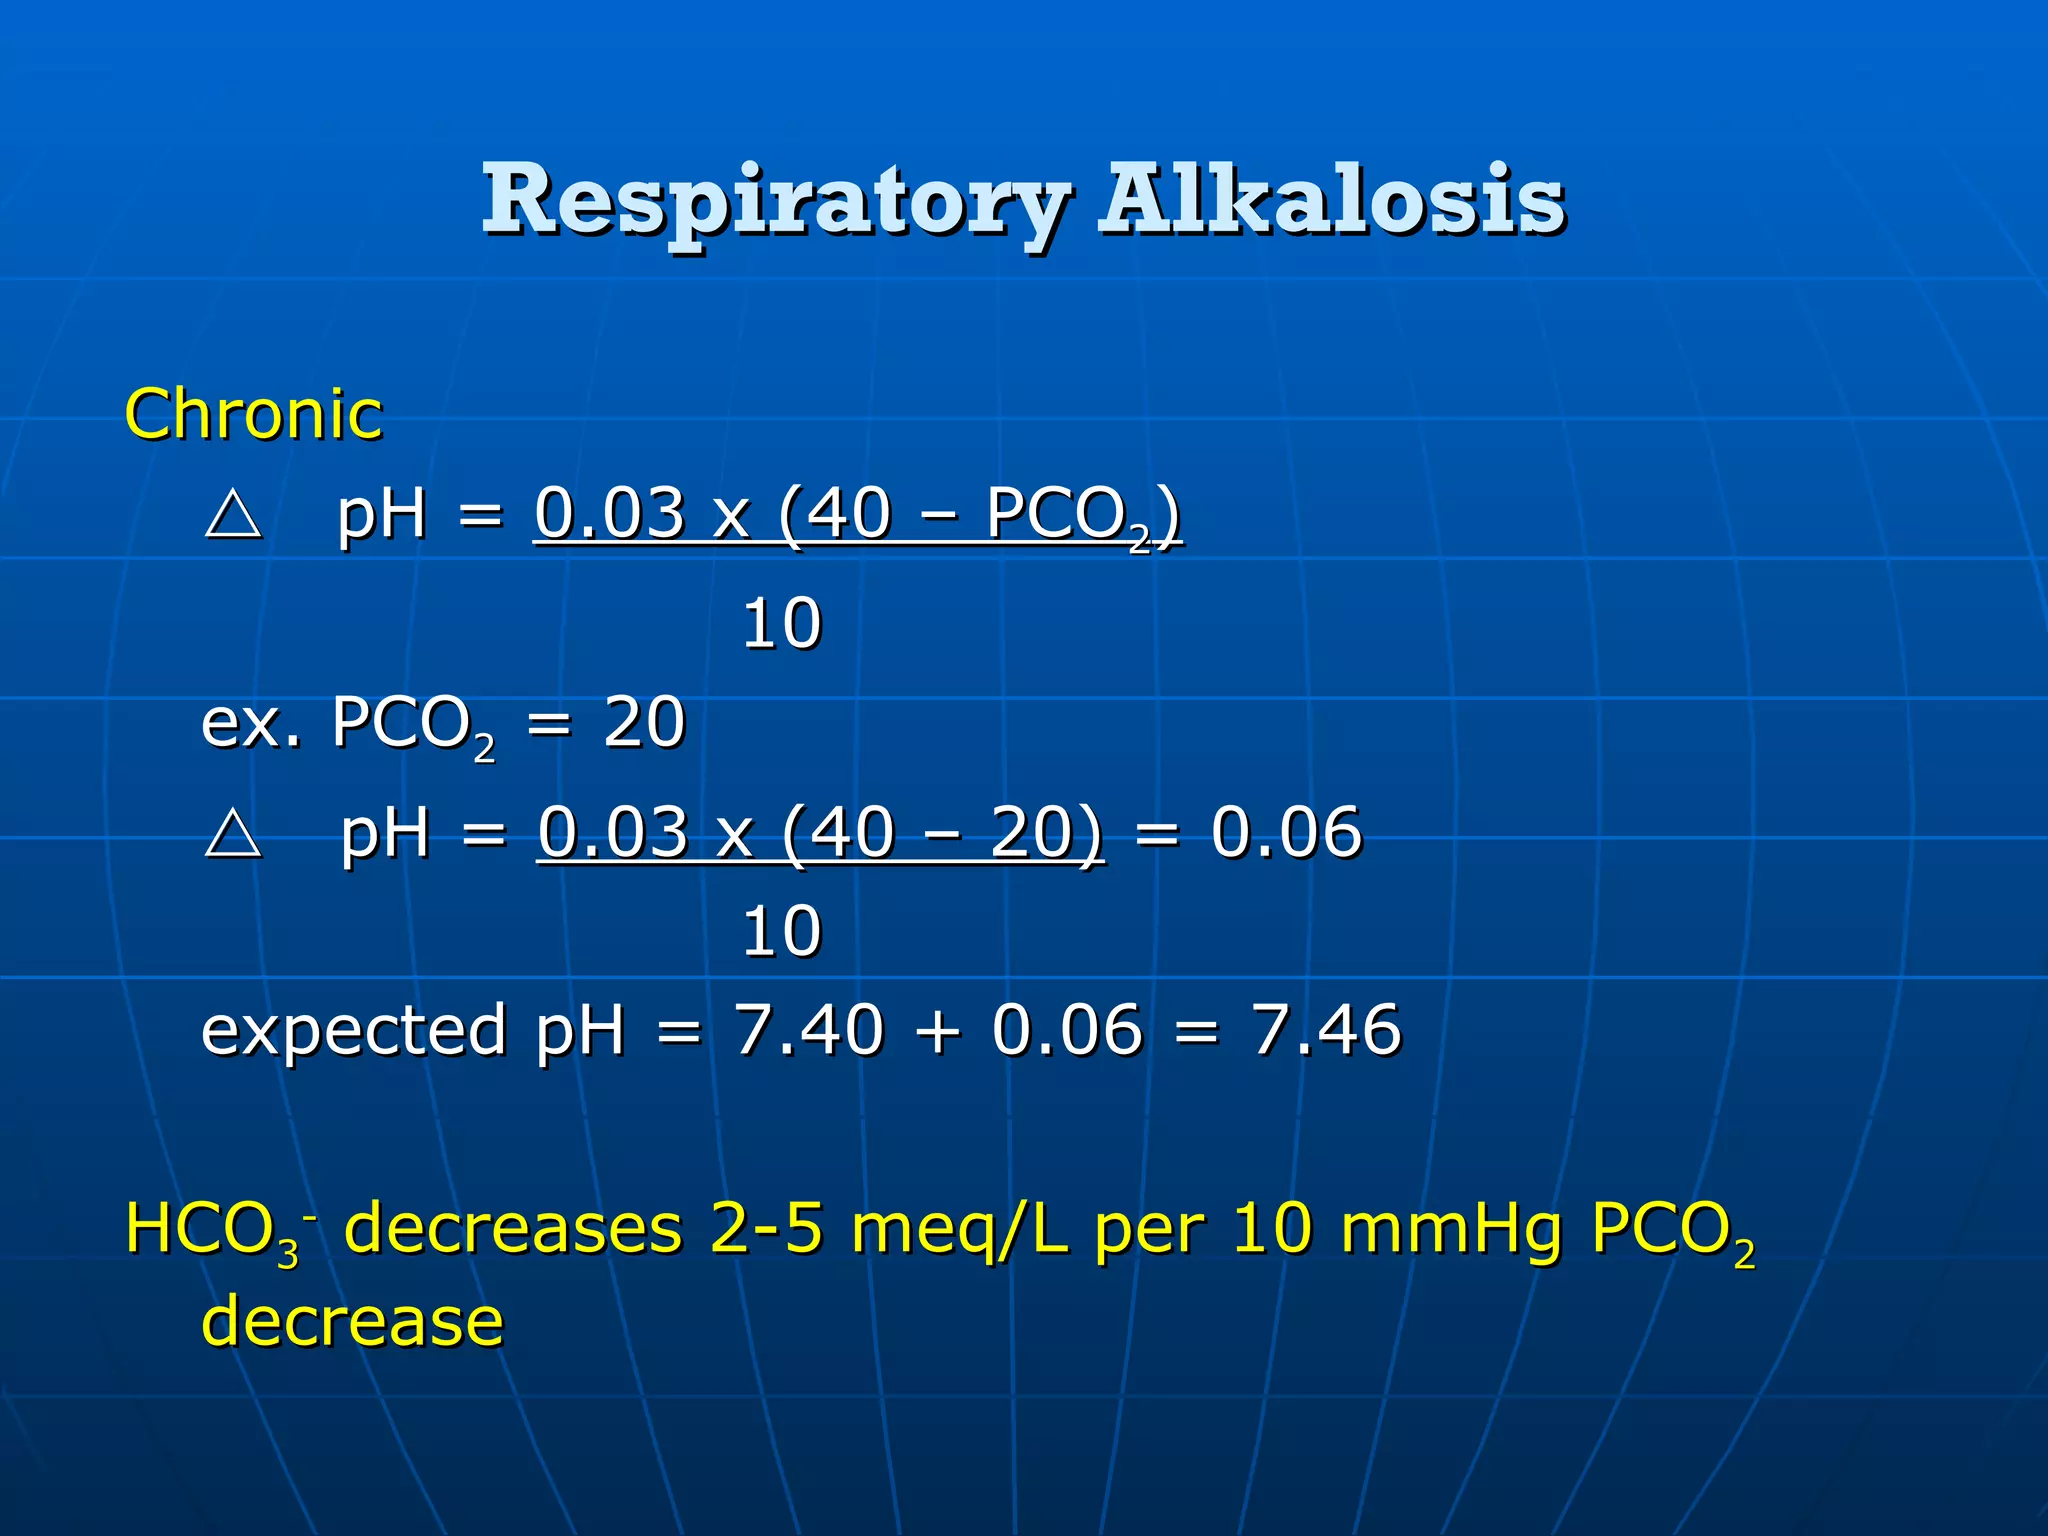
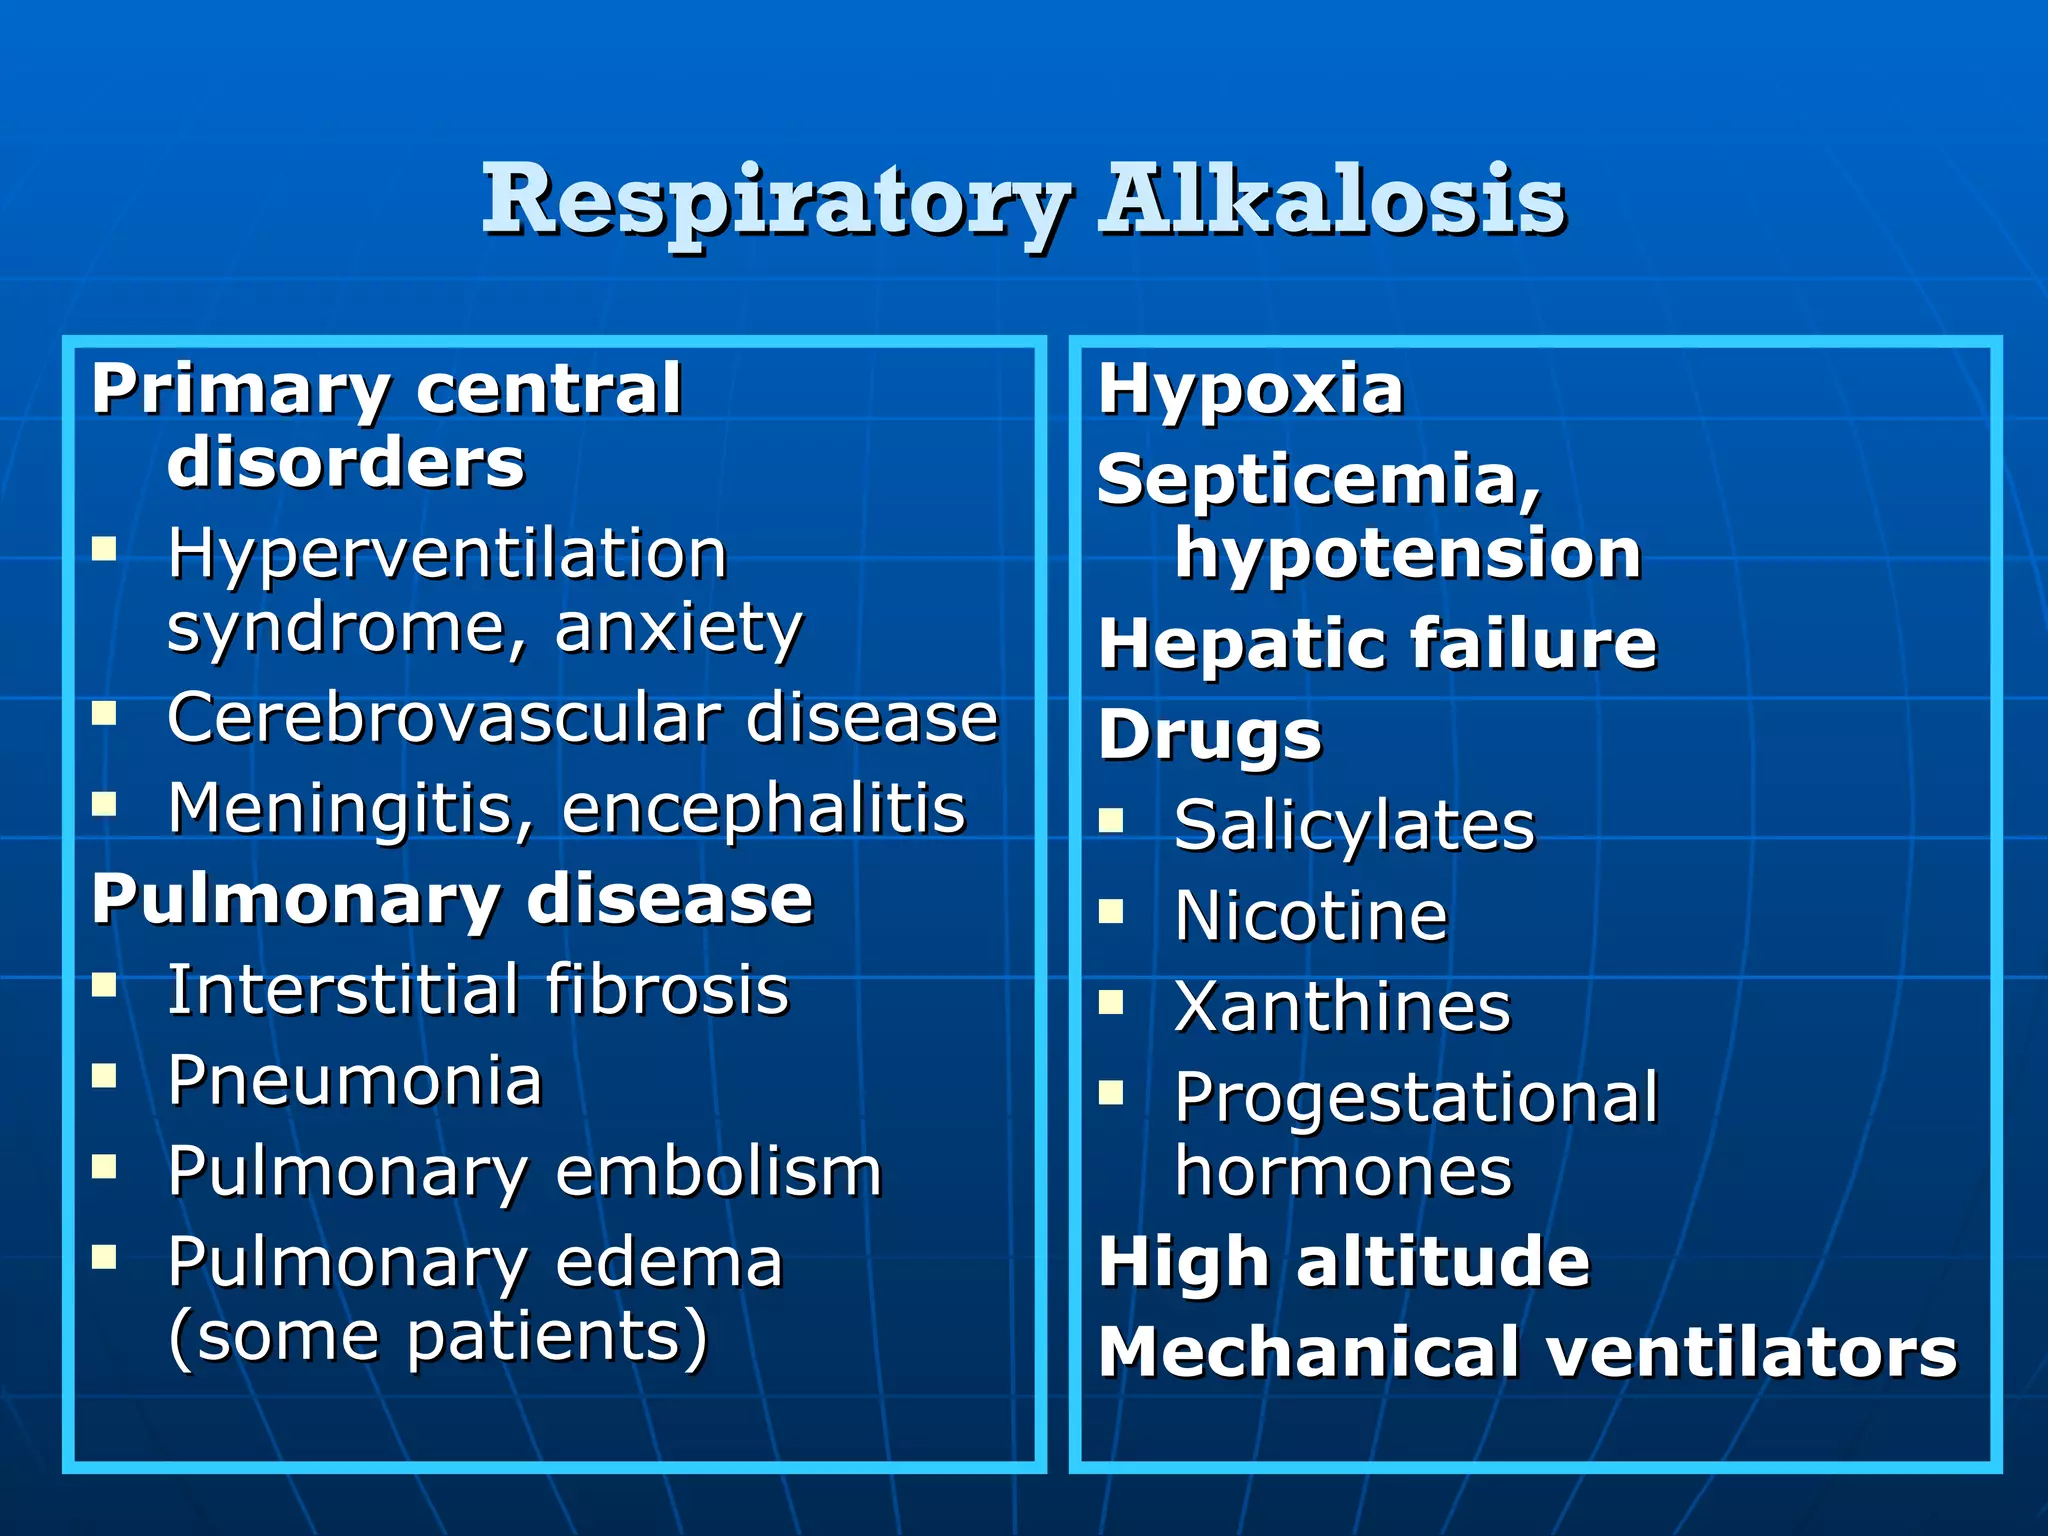
Explanation of acute and chronic respiratory alkalosis mechanisms, including compensatory responses.
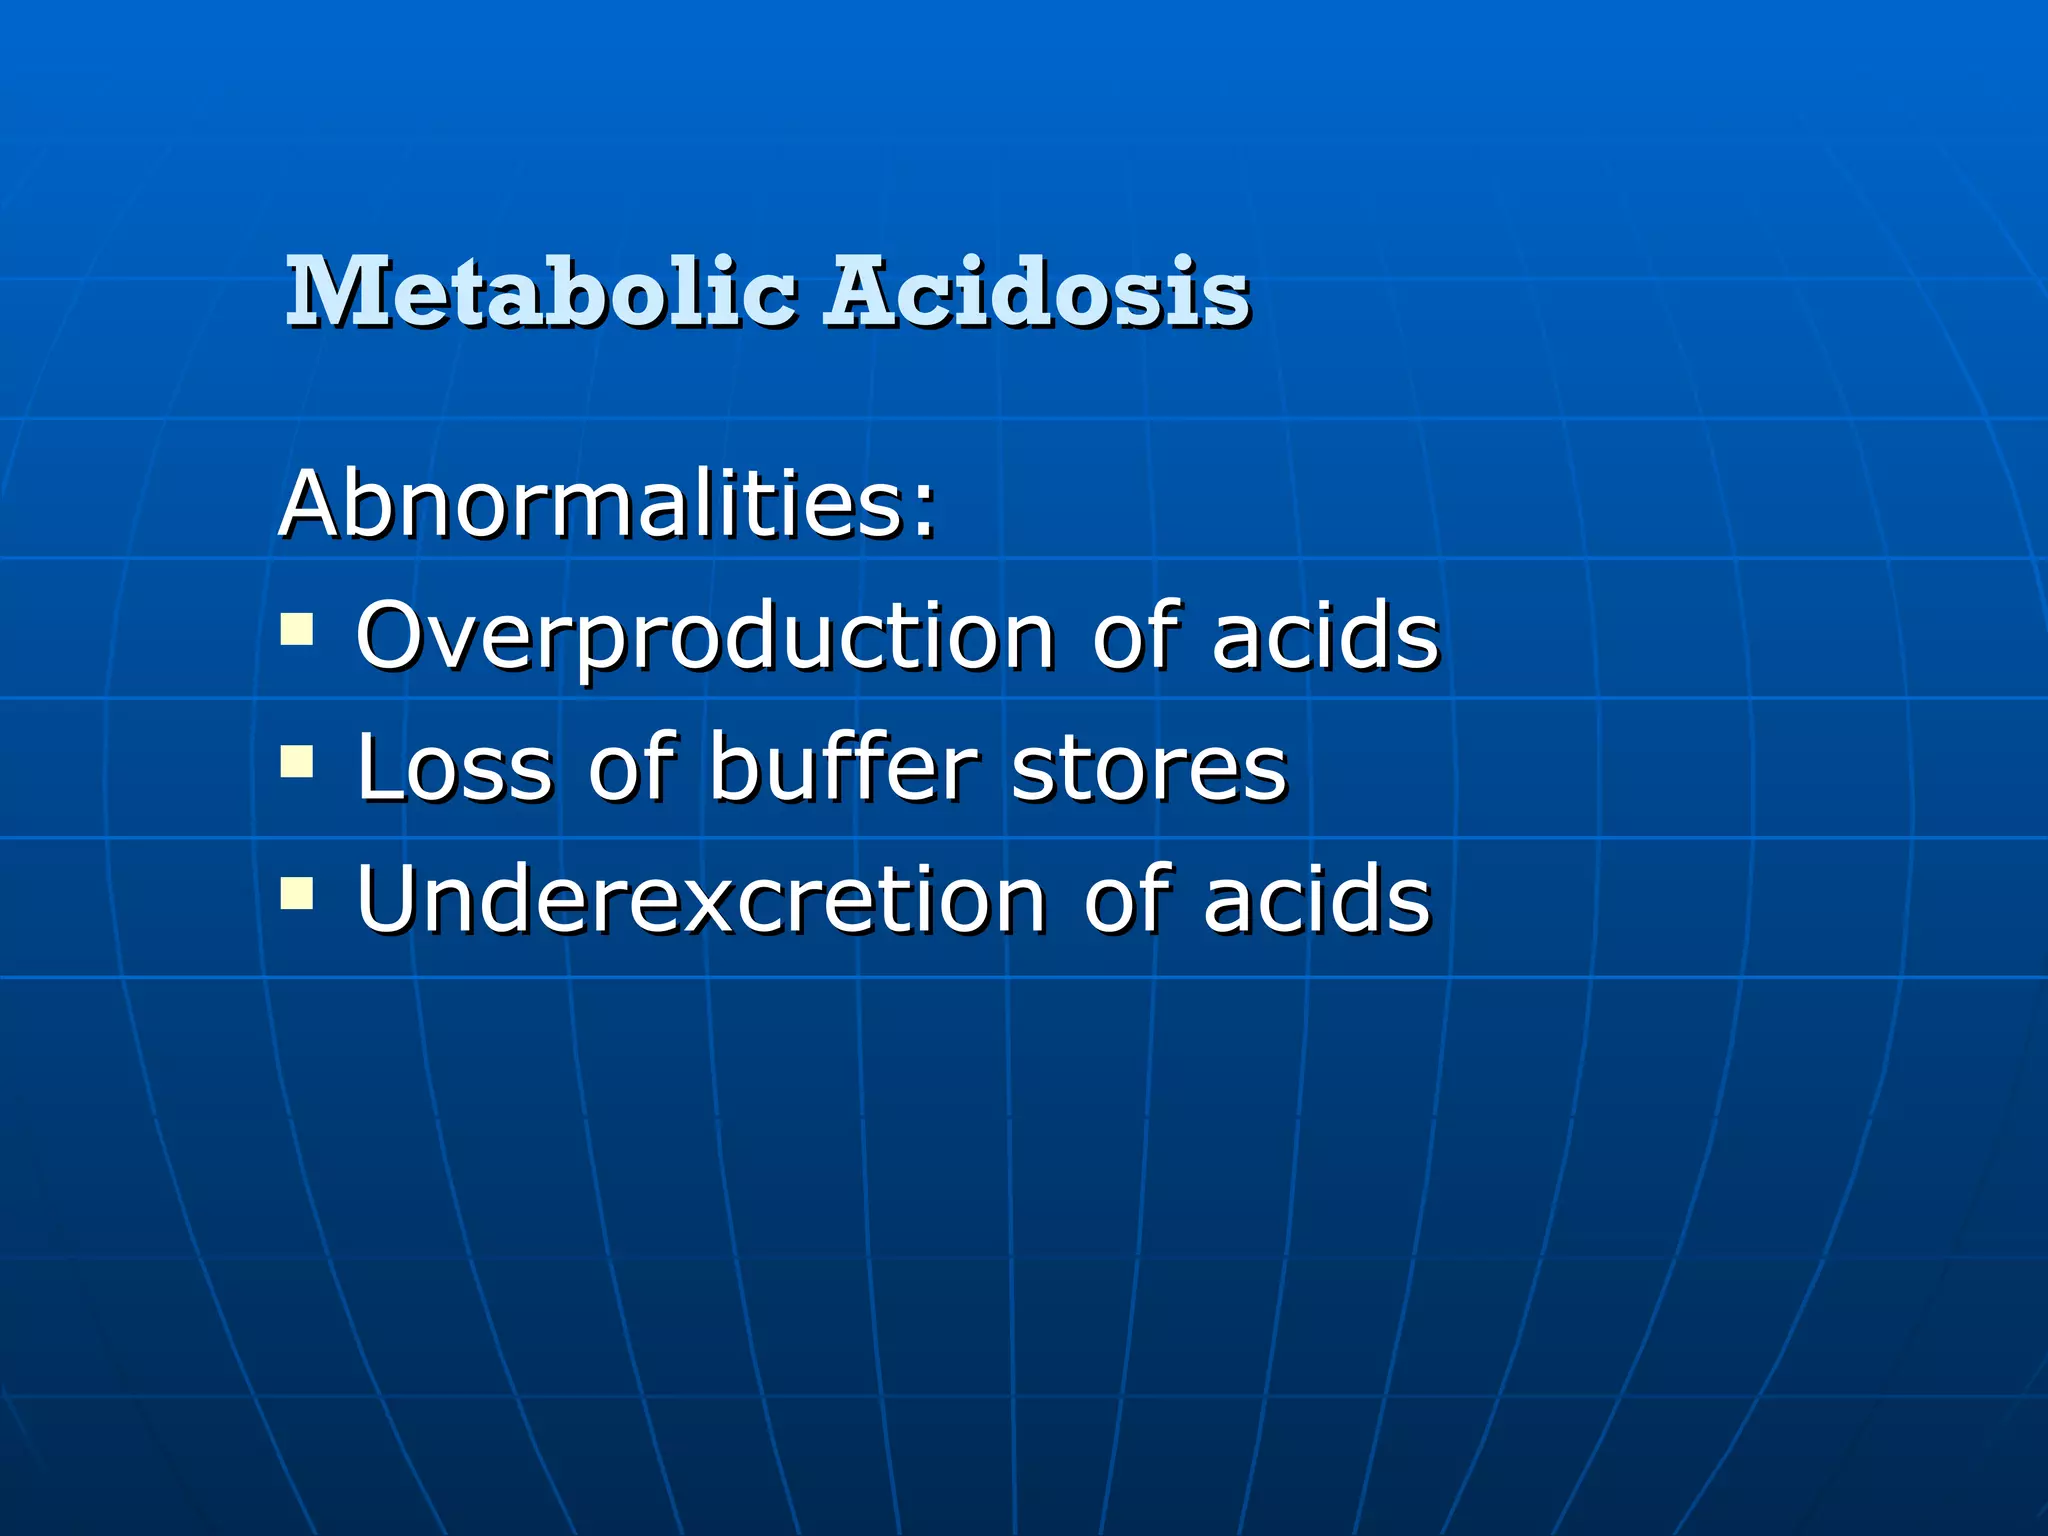
Defining metabolic acidosis, focusing on anion gap formations and abnormalities leading to acidosis.
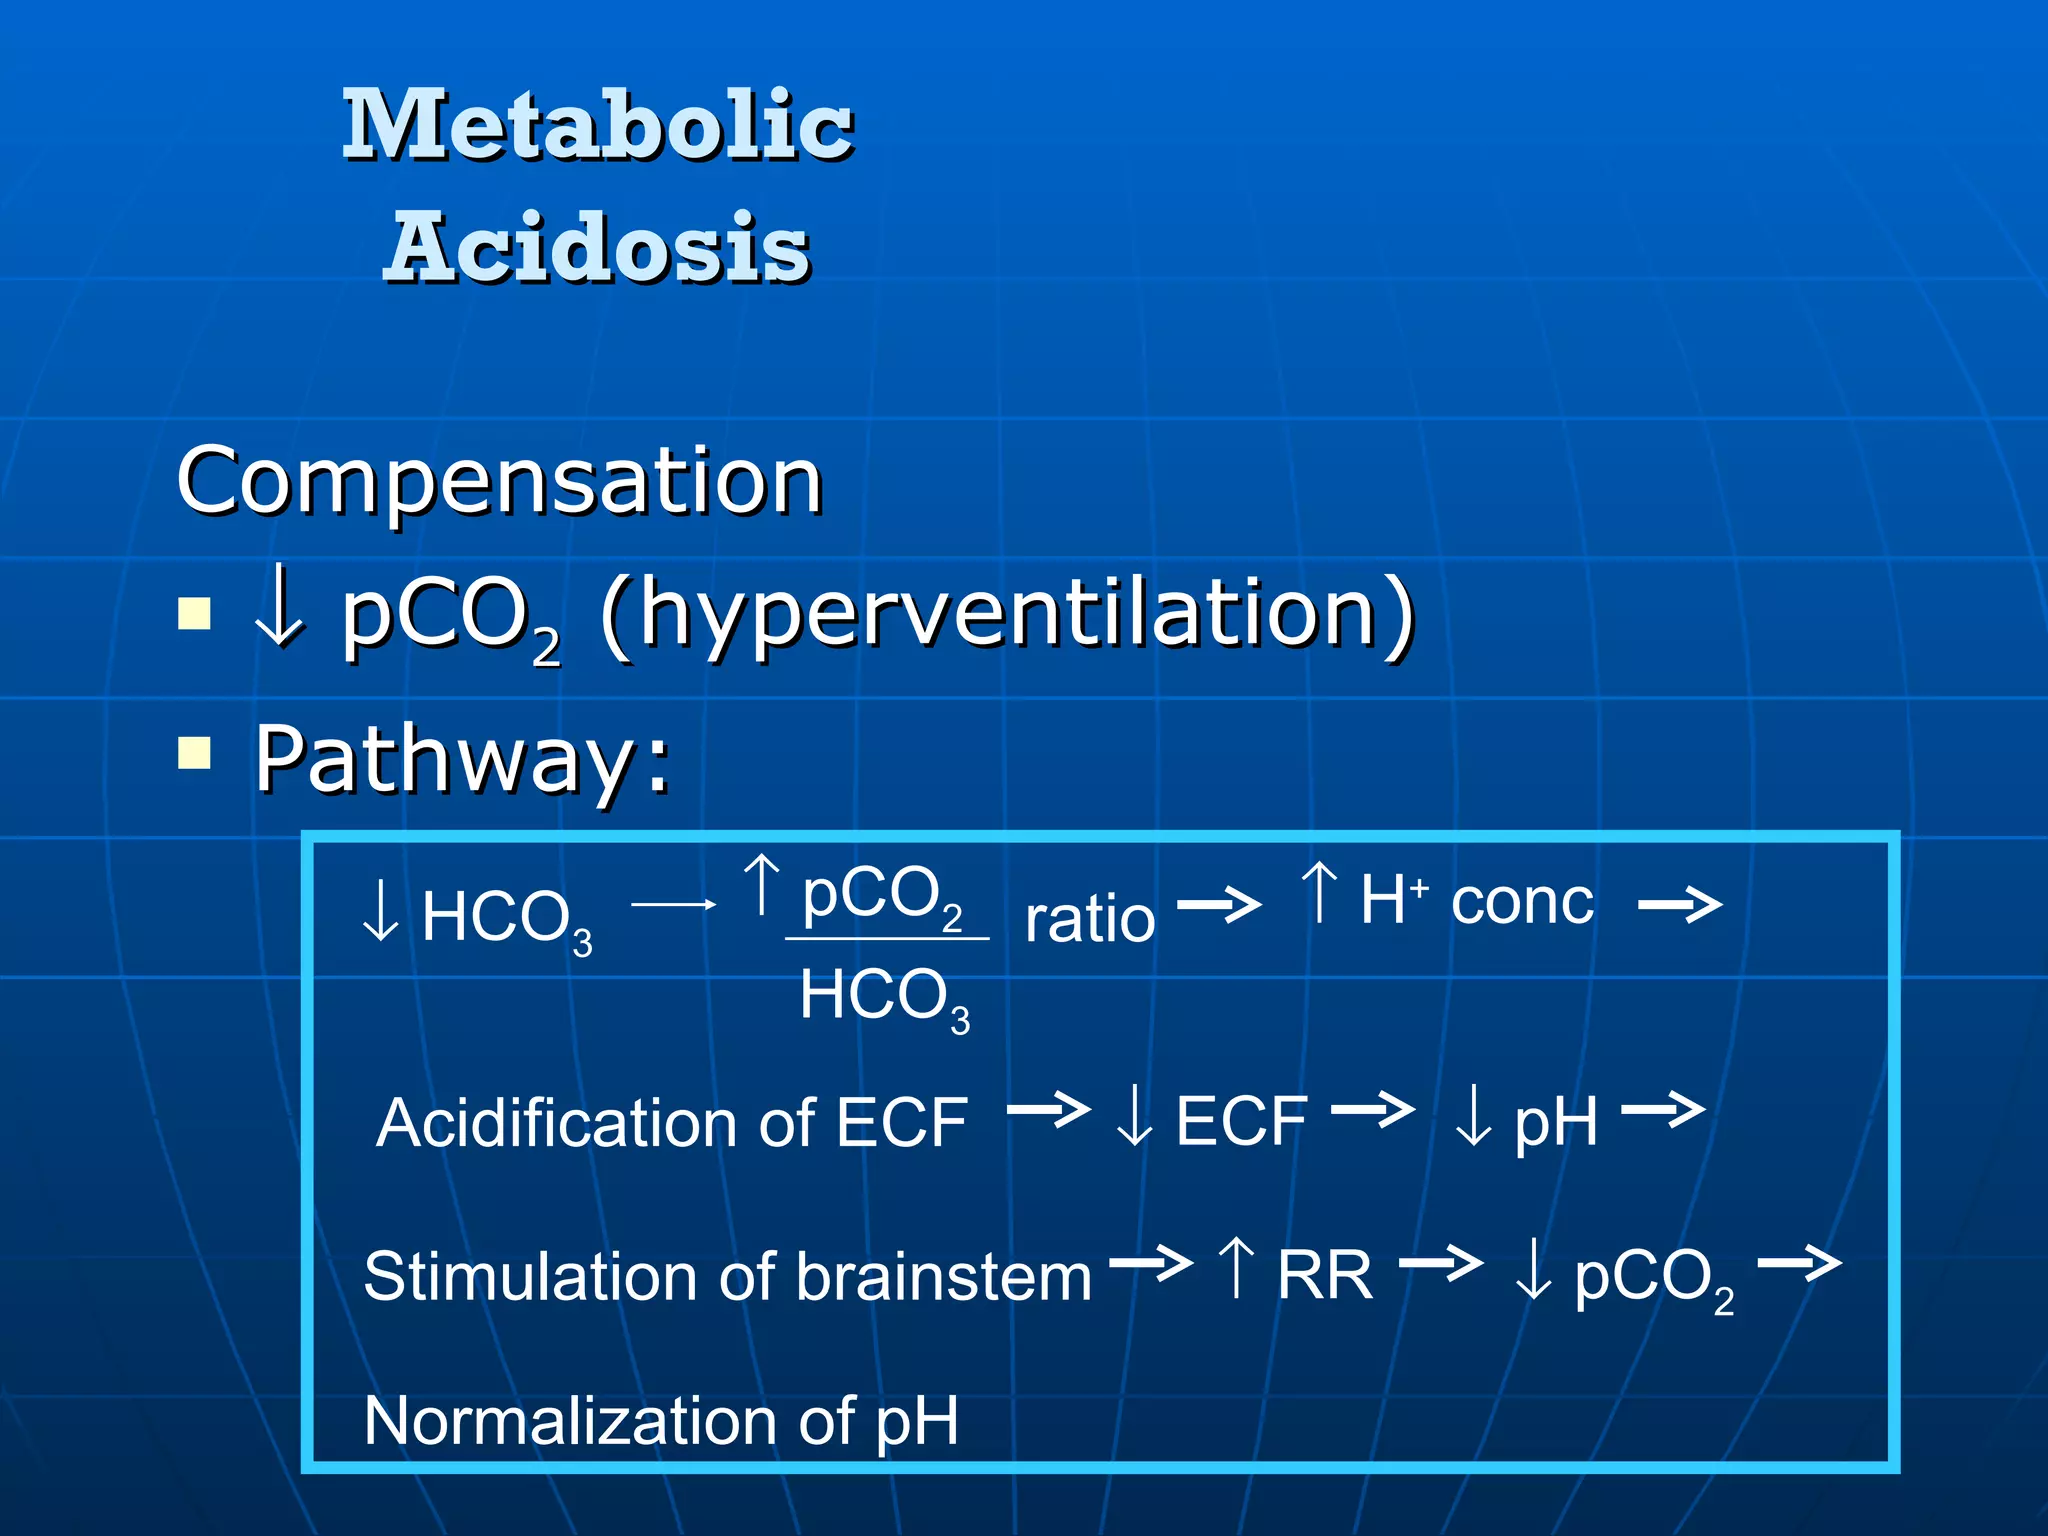
Compensatory mechanisms in metabolic acidosis, and correcting HCO3- for anion gap calculations.
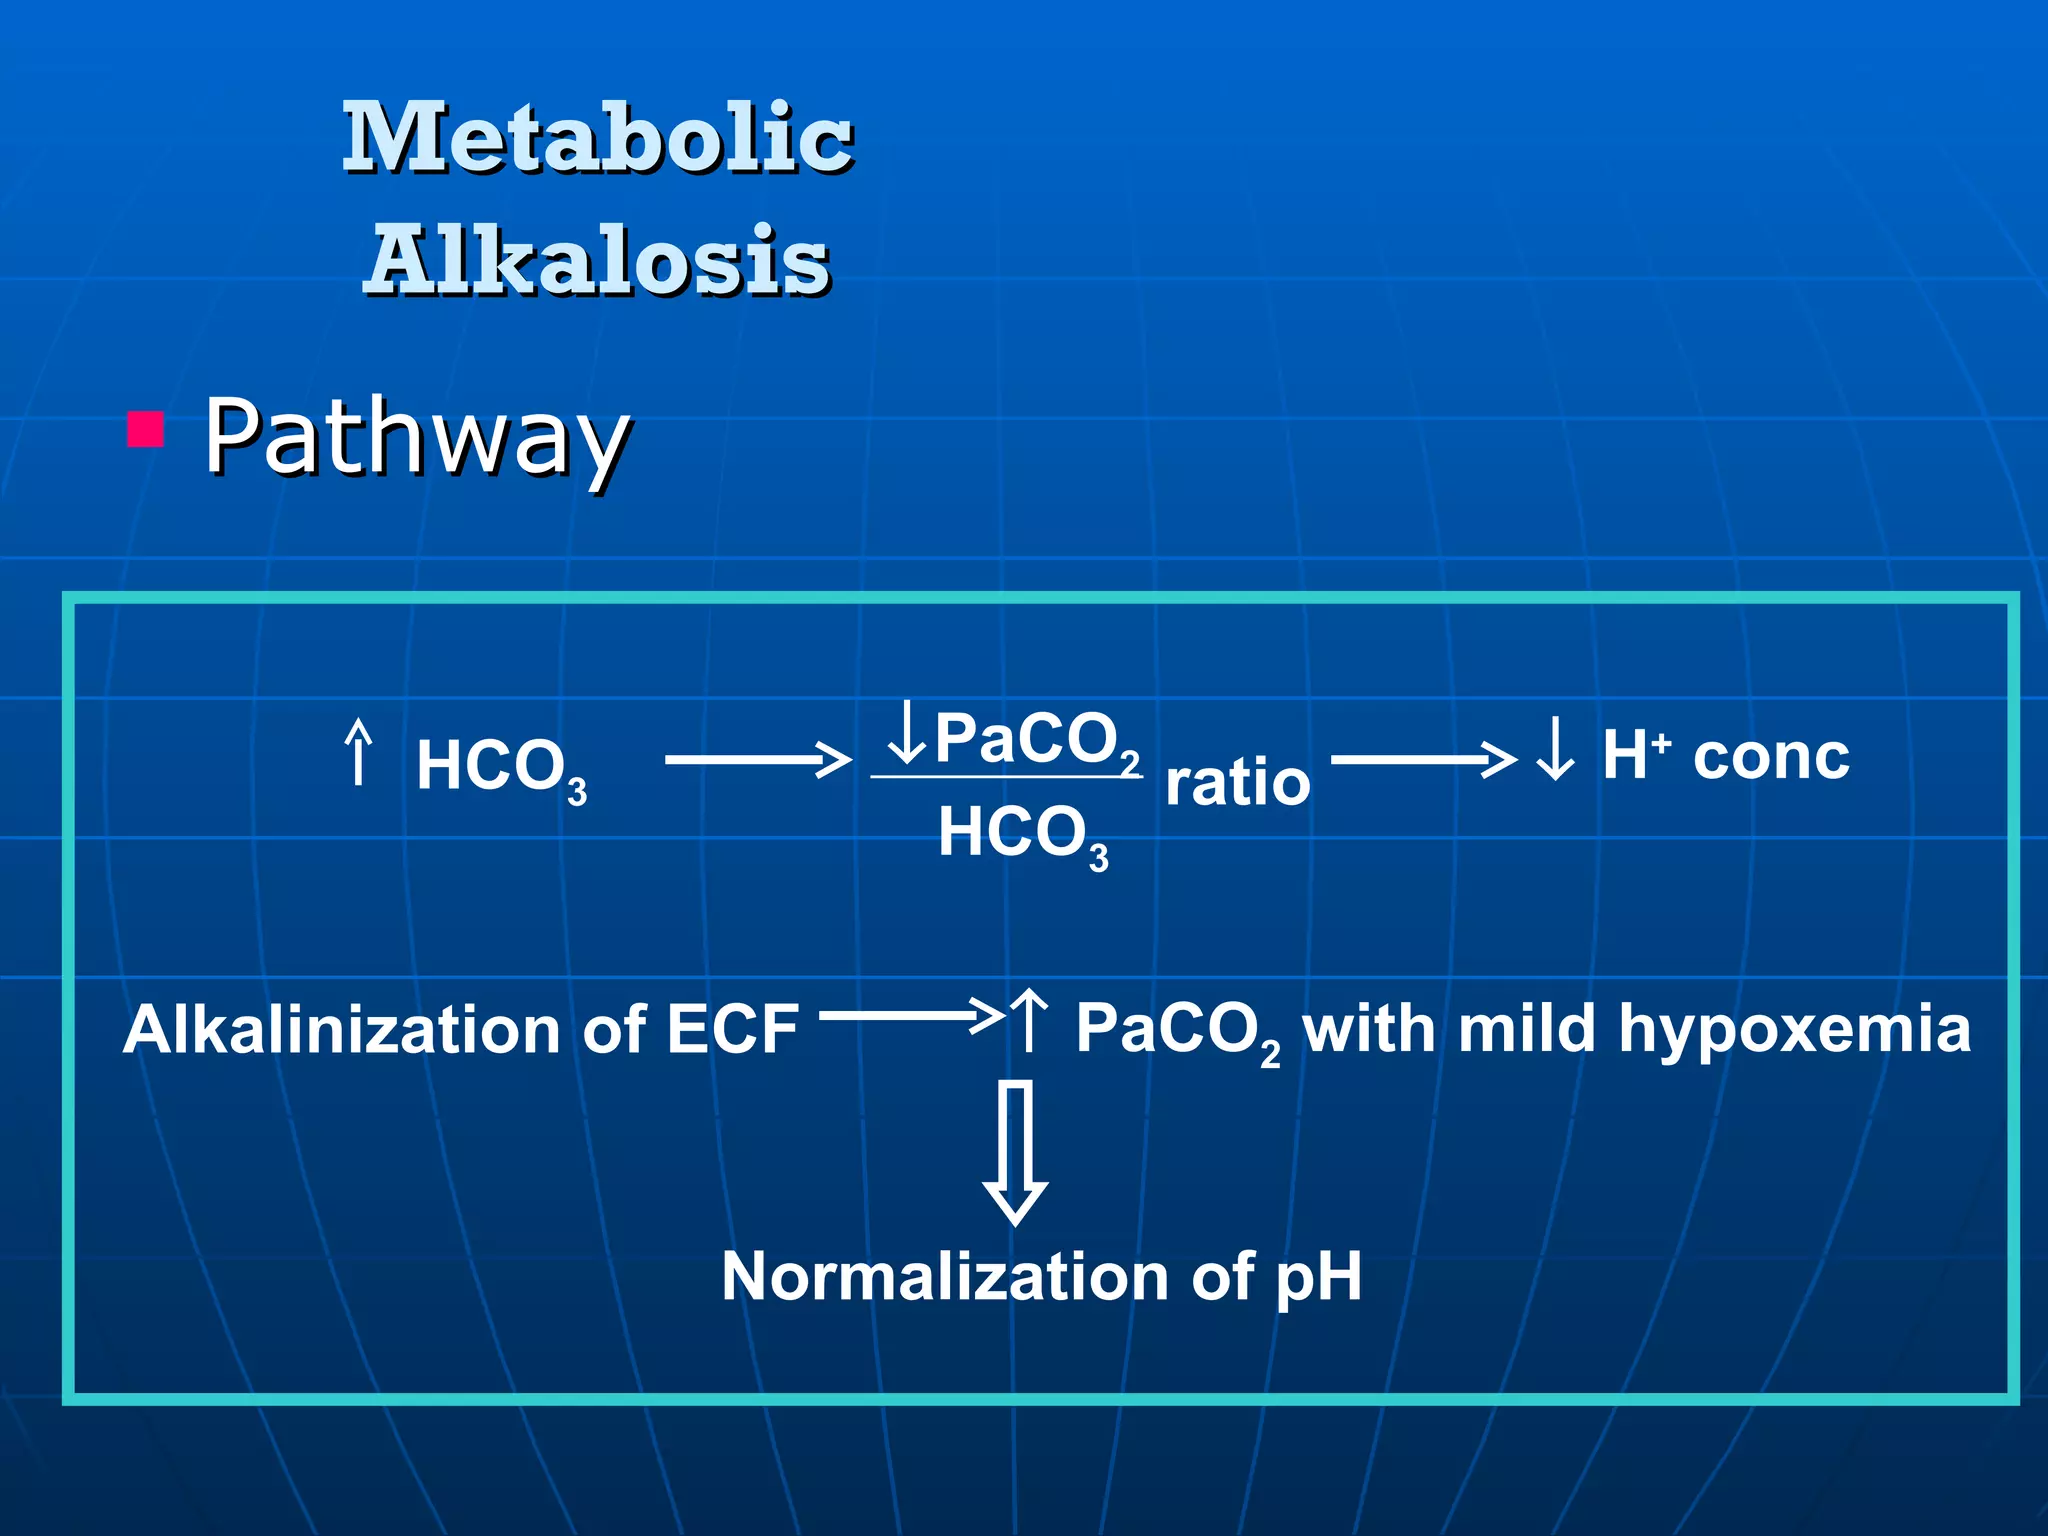
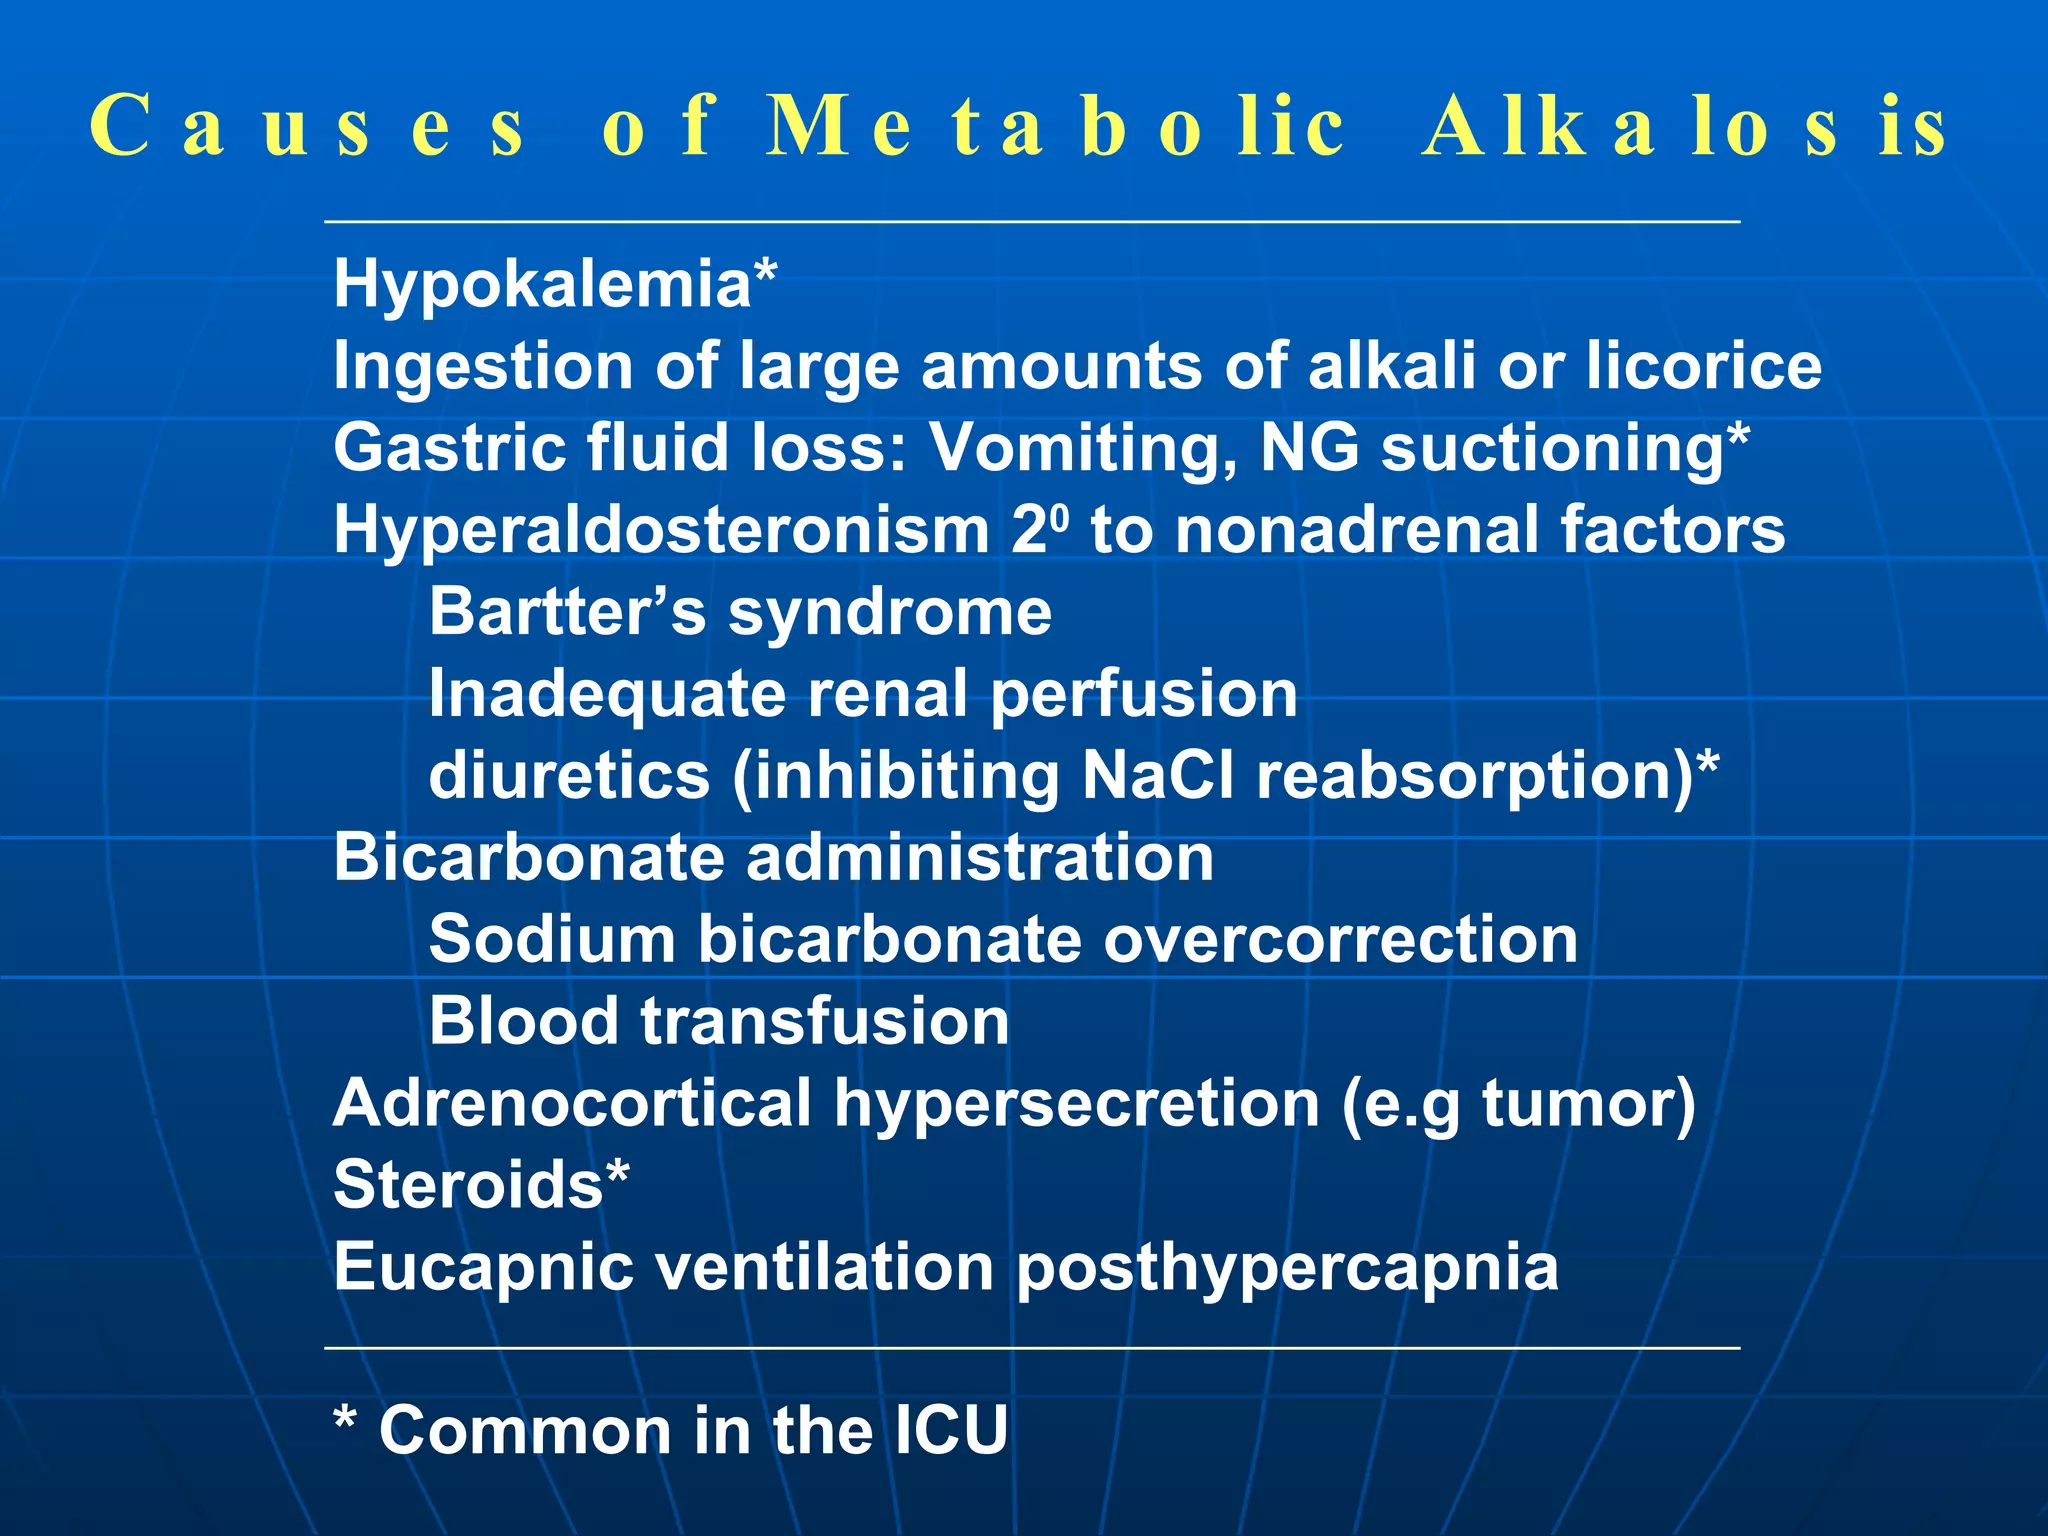
Discussion on metabolic alkalosis, covering expected PCO2 changes and common causes associated with the condition.
Exploring limits of compensation in acid-base disturbances, outlining specific thresholds for various conditions.
Steps for identifying acid-base disturbances, focusing on patient analysis and classification of the condition.
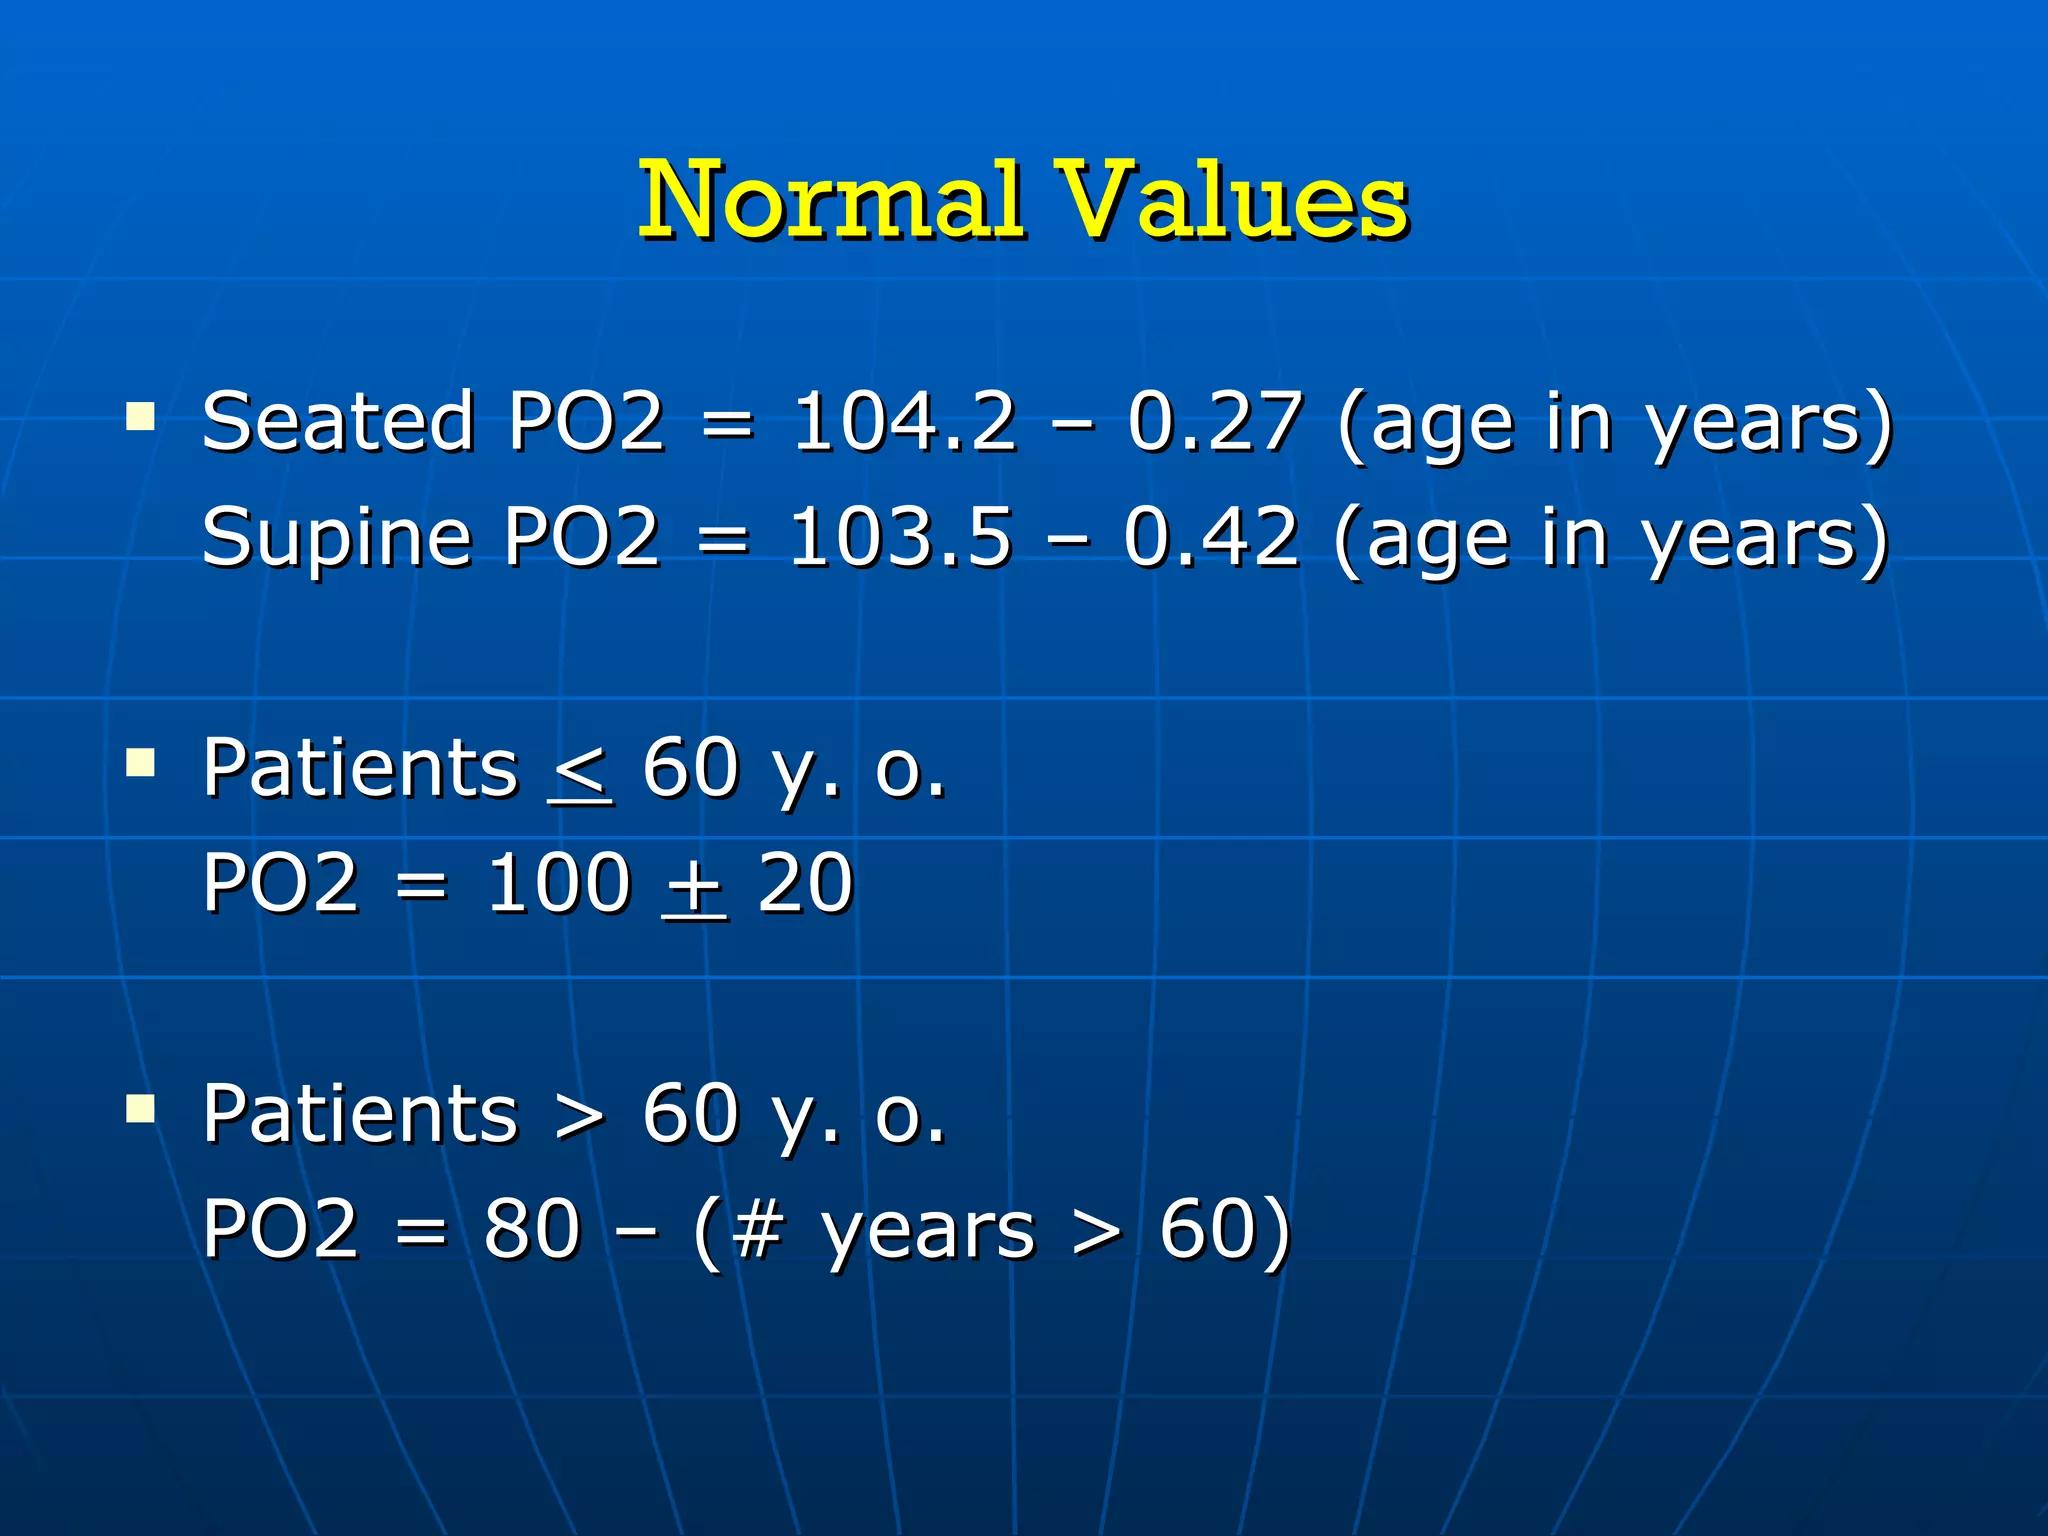
Introduction to evaluating a patient's oxygenation status, with normal values based on age.
Guidelines to evaluate if a patient is hypoxemic or normoxemic and how to analyze oxygenation levels.
Closing statement thanking the audience for their attention and summarizing key aspects presented.
Obtaining Blood GasSamples Radial artery- best site located superficially, easy to palpate & stabilize excellent collateral circulation via ulnar artery not adjacent to large veins probing needle relatively pain-free if periosteum is avoided
3.
Technique for Radial Artery Puncture Explain process to patient. Examine skin, palpate radial & ulnar arteries. Perform modified Allen Test.
4.
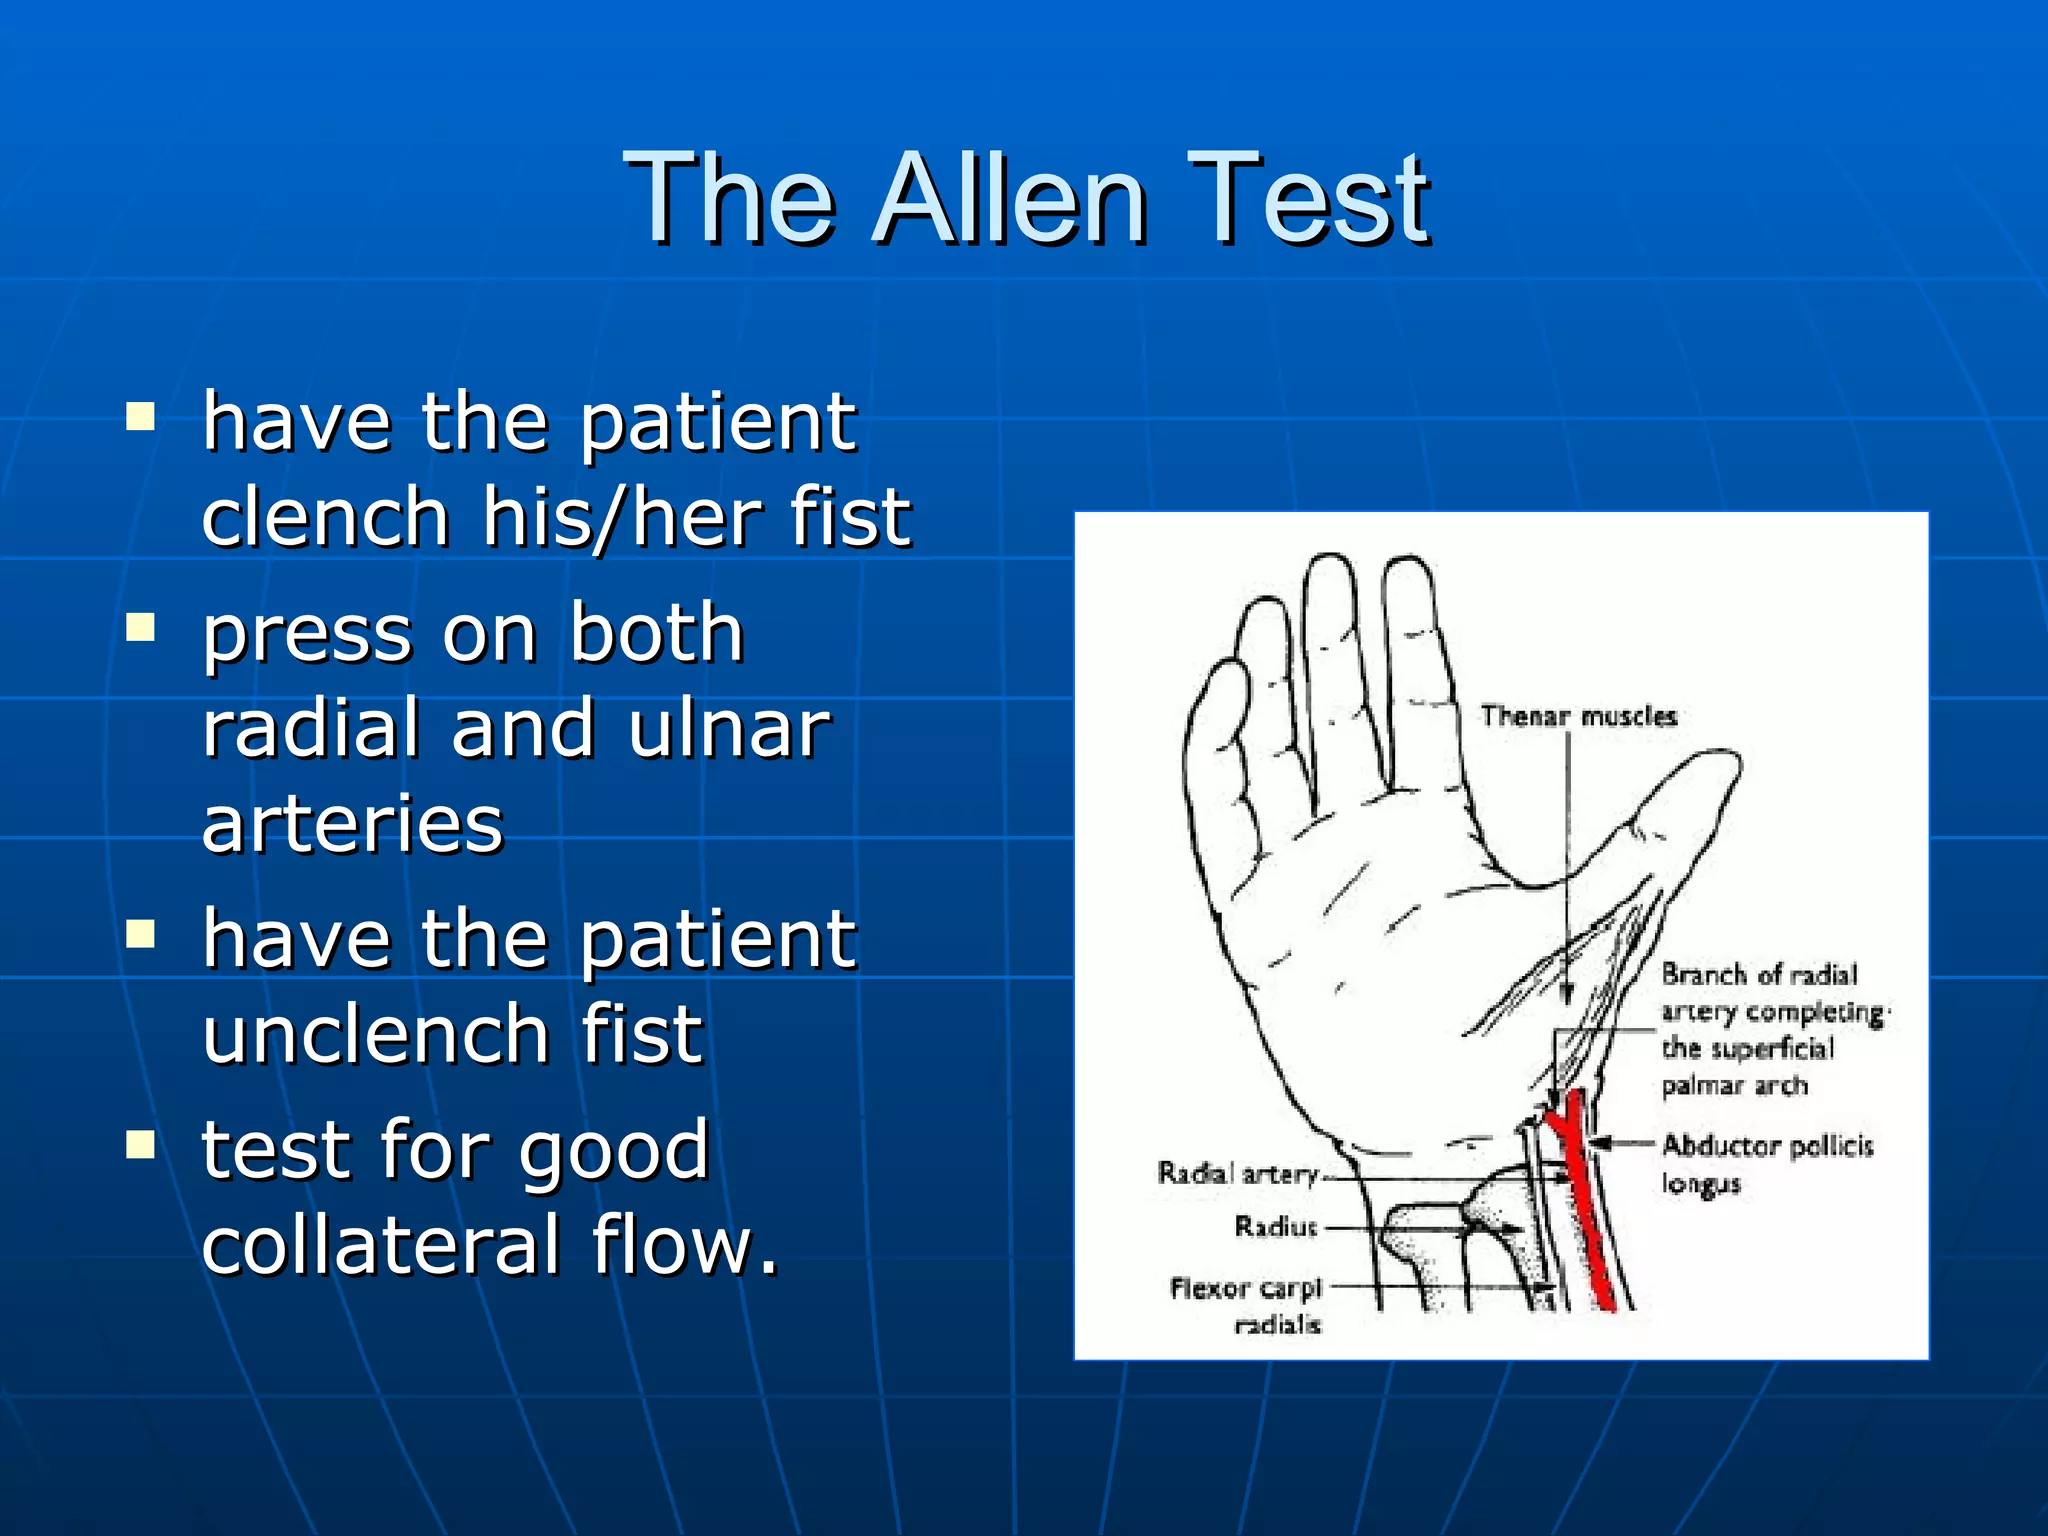
The Allen Testhave the patient clench his/her fist press on both radial and ulnar arteries have the patient unclench fist test for good collateral flow.
5.
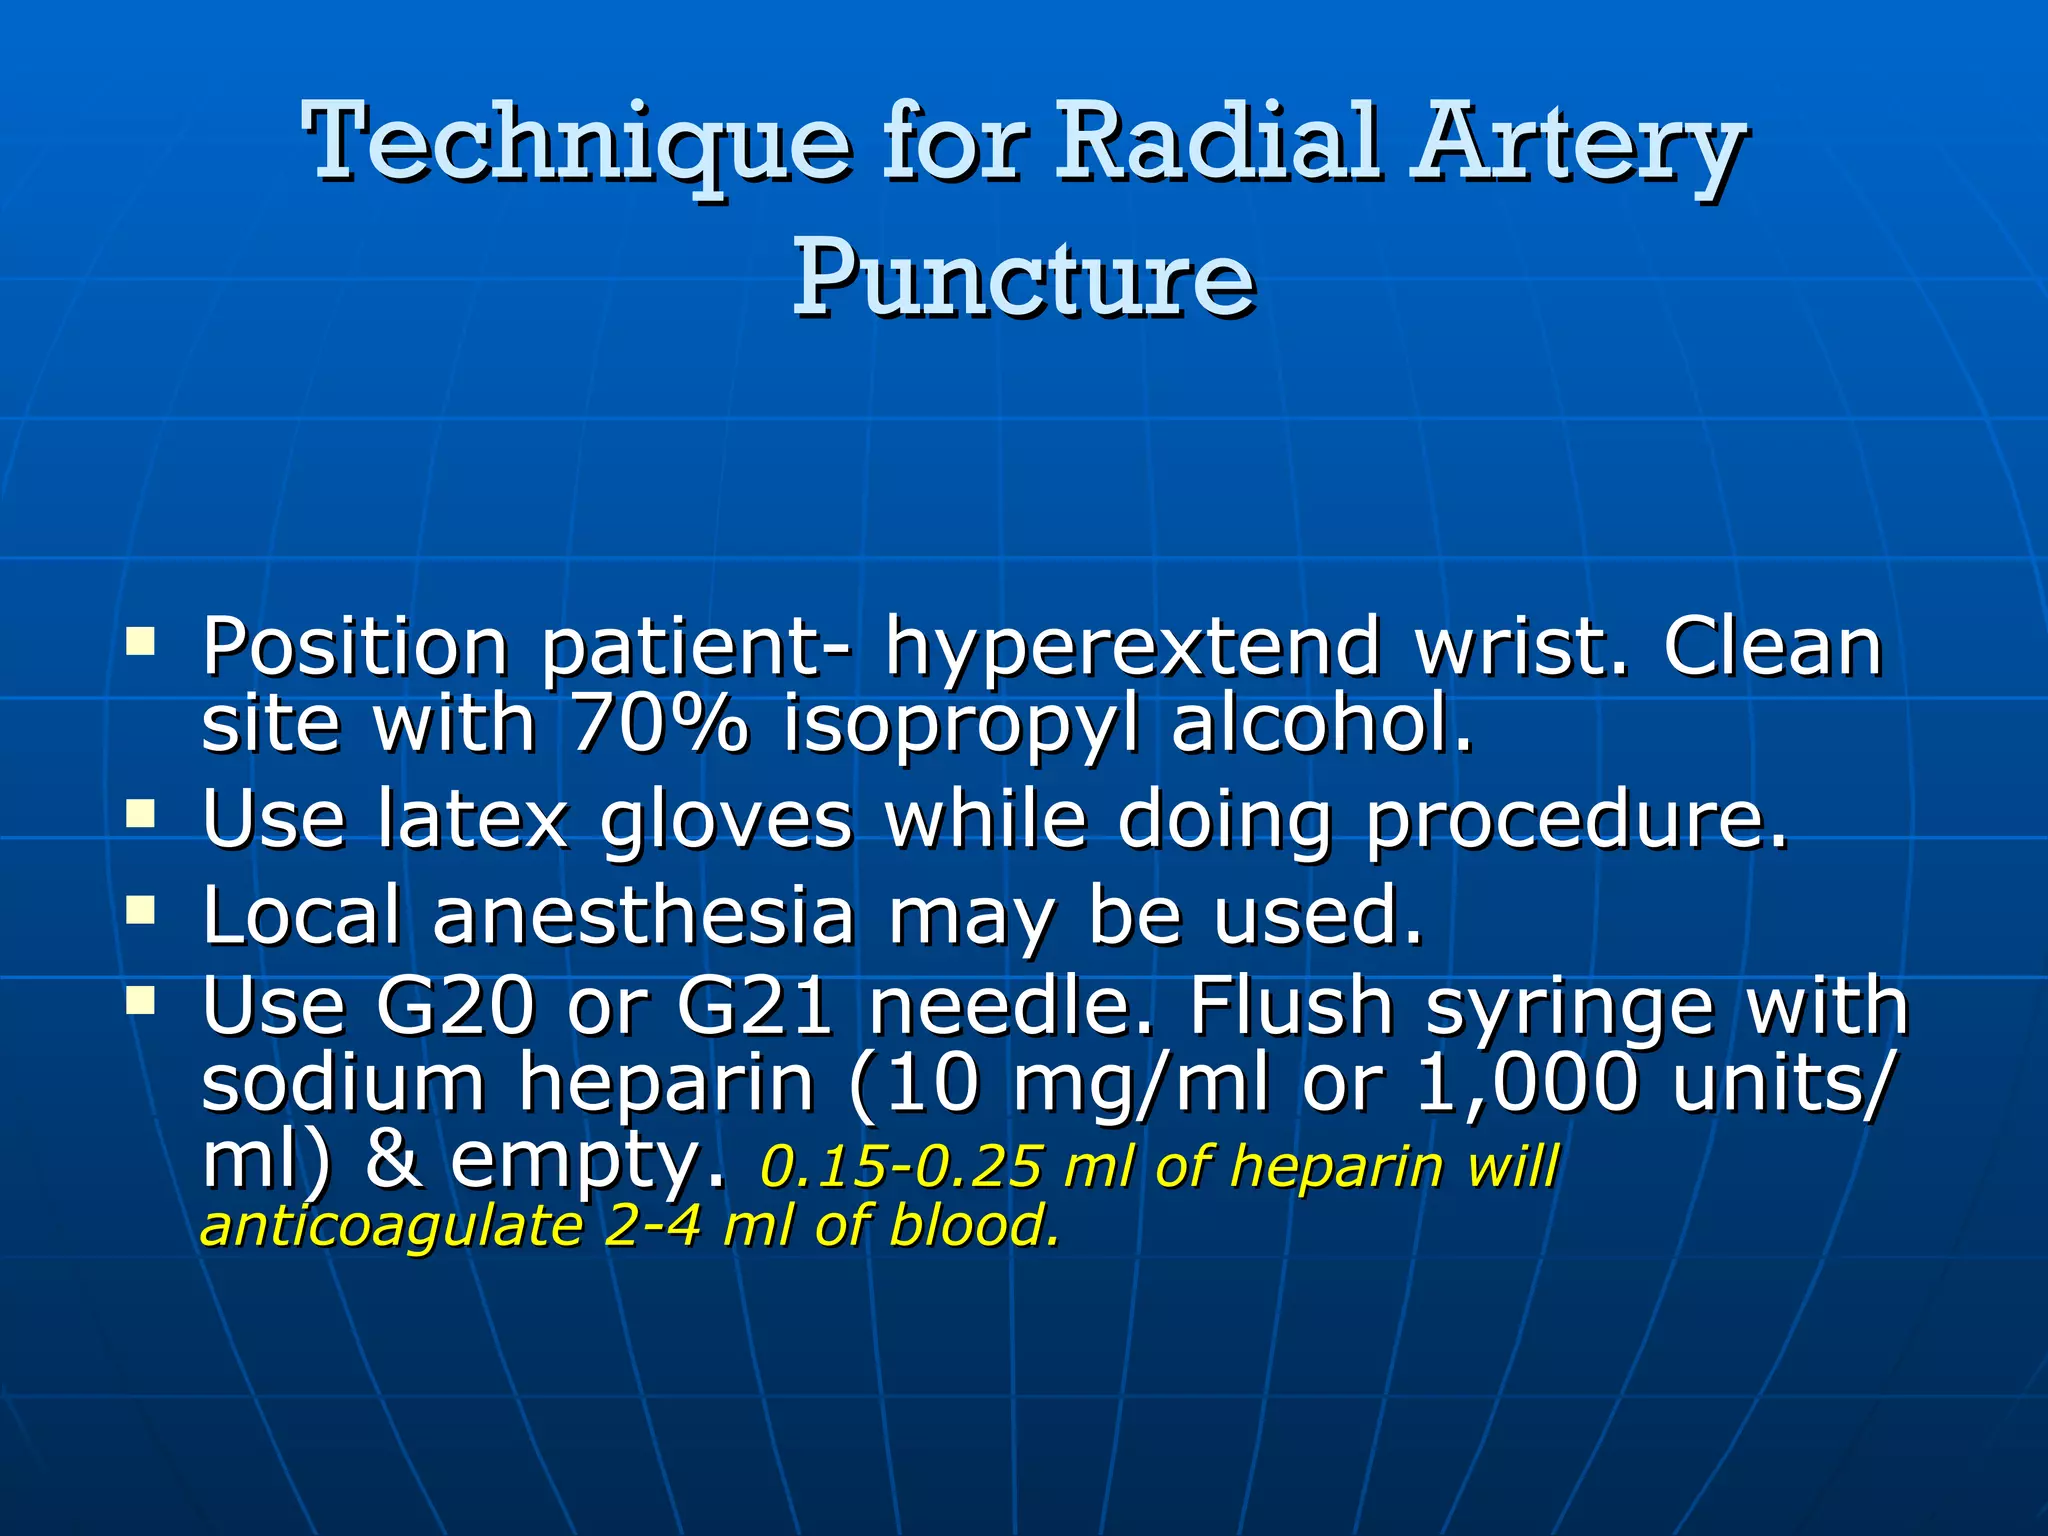
Technique for RadialArtery Puncture Position patient- hyperextend wrist. Clean site with 70% isopropyl alcohol. Use latex gloves while doing procedure. Local anesthesia may be used. Use G20 or G21 needle. Flush syringe with sodium heparin (10 mg/ml or 1,000 units/ml) & empty. 0.15-0.25 ml of heparin will anticoagulate 2-4 ml of blood.
6.
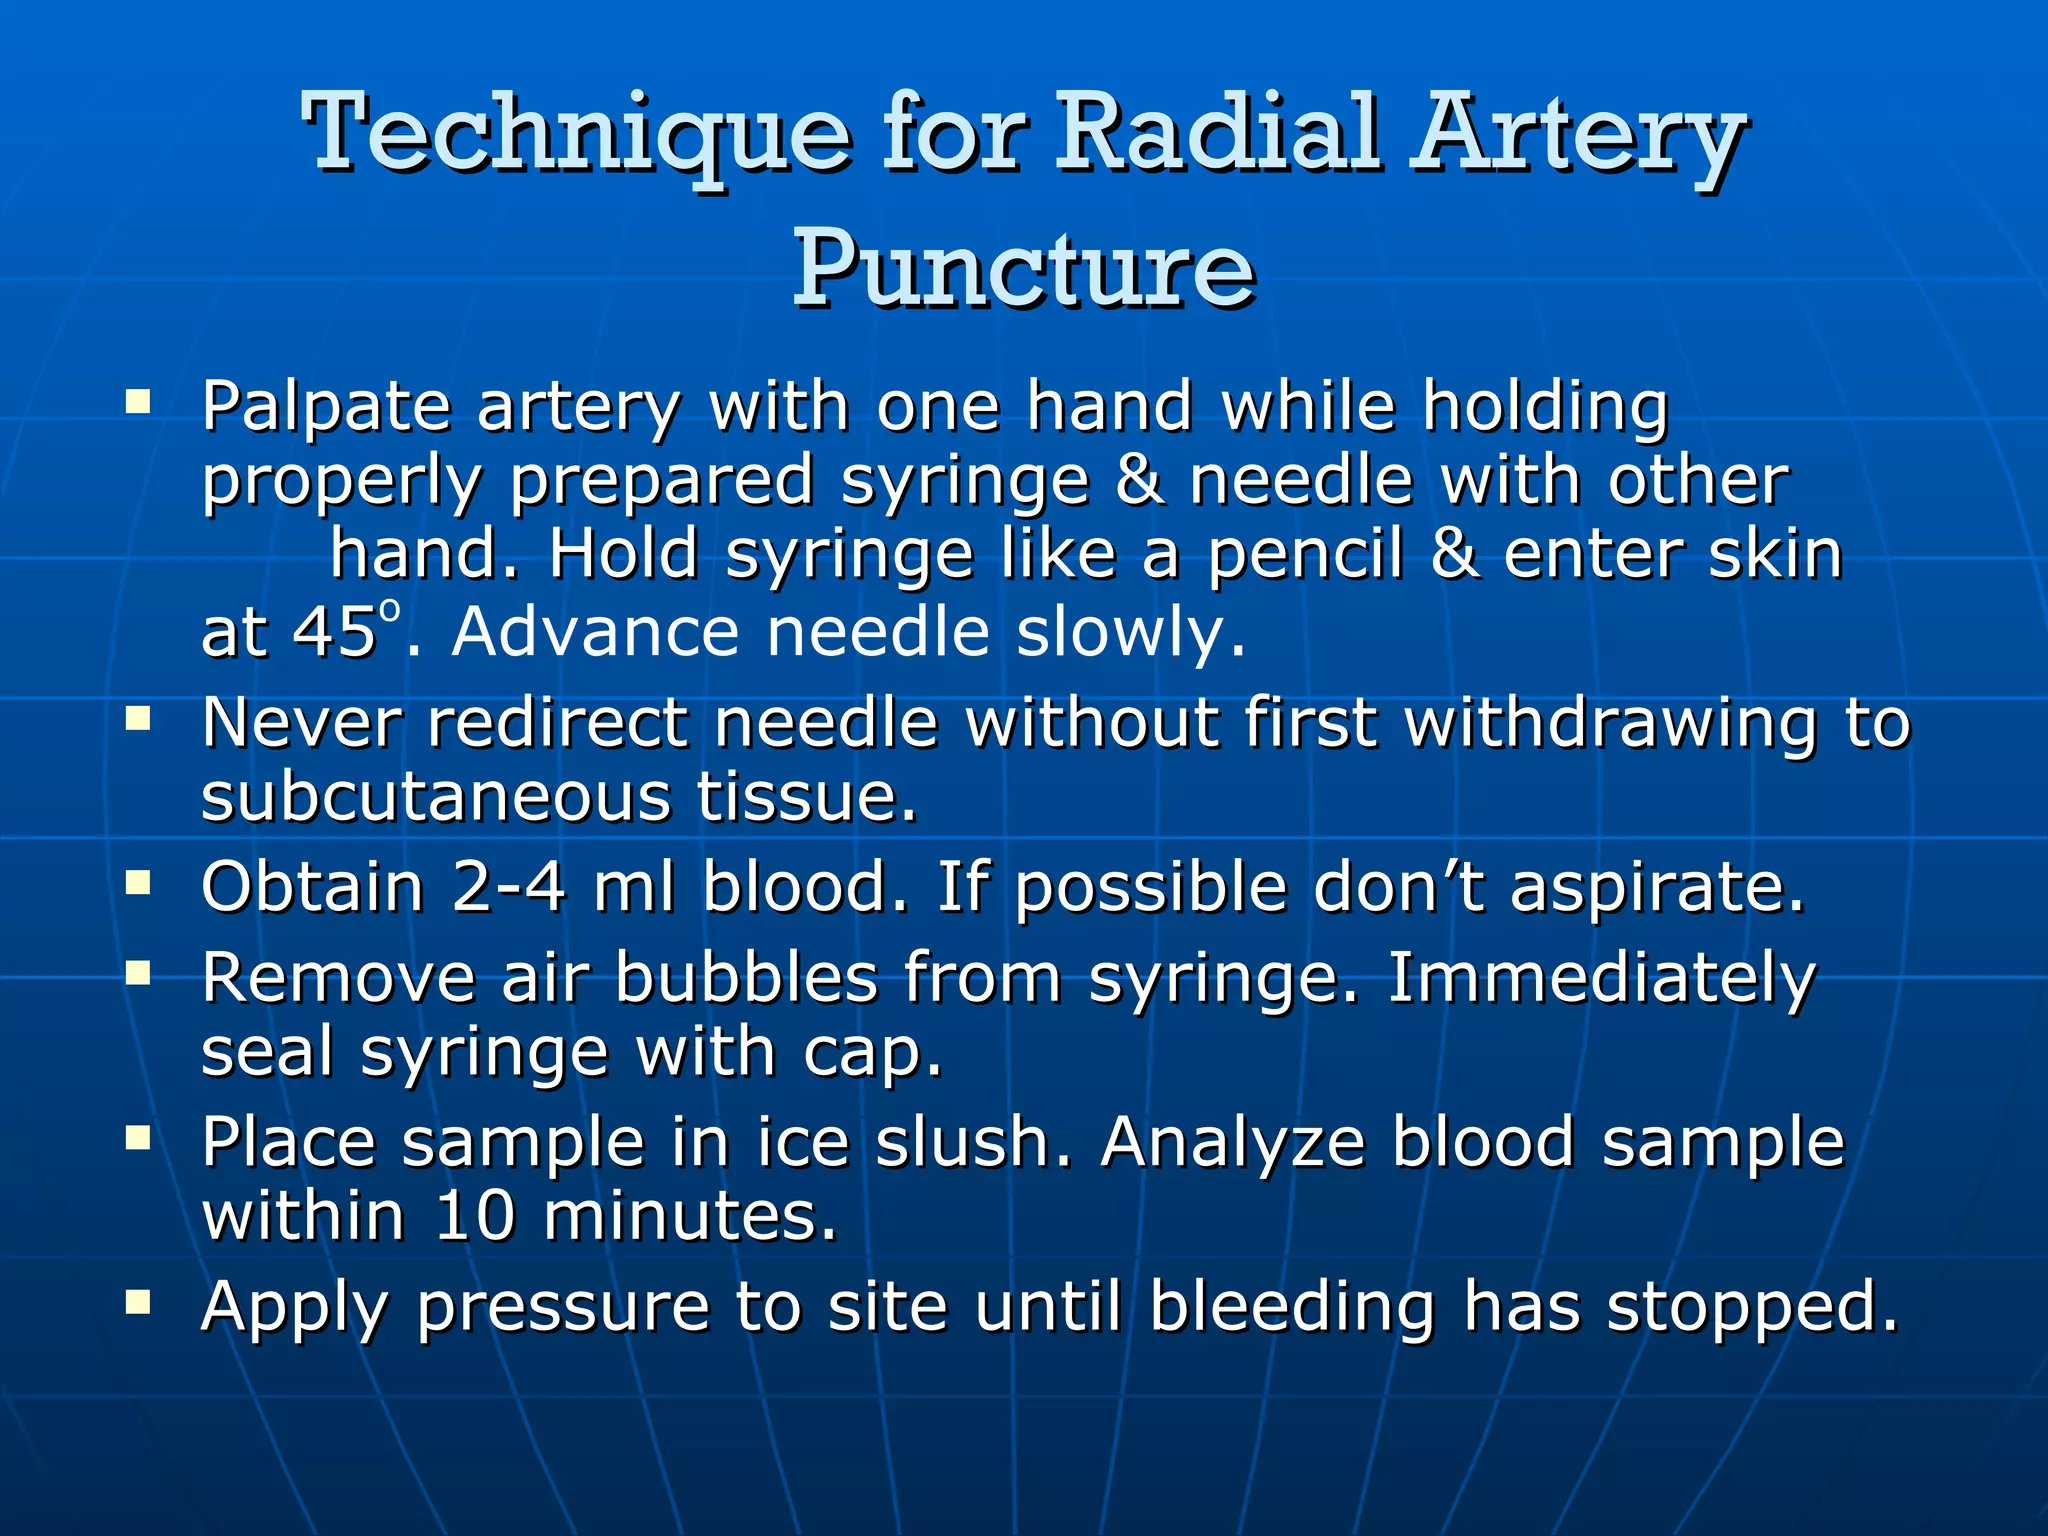
Technique for RadialArtery Puncture Palpate artery with one hand while holding properly prepared syringe & needle with other hand. Hold syringe like a pencil & enter skin at 45 o . Advance needle slowly. Never redirect needle without first withdrawing to subcutaneous tissue. Obtain 2-4 ml blood. If possible don’t aspirate. Remove air bubbles from syringe. Immediately seal syringe with cap. Place sample in ice slush. Analyze blood sample within 10 minutes. Apply pressure to site until bleeding has stopped.
7.
Potential Complications PainHematoma, hemorrhage Trauma to vessel Arteriospasm Air or clotted-blood emboli Vasovagal response Arterial occlusion Infection
8.
Indications for ABGAssess ventilation & acid-base balance Assess oxygenation status
Traditional Metabolic Acid-BaseNomenclature (+) N Compensated (chronic) (+) Partly compensated (subacute) (+) N Uncompensated (acute) Metabolic alkalosis (-) N Compensated (chronic) (-) Partly compensated (subacute) (-) N Uncompensated (acute) Metabolic acidosis BE [HCO3]p PCO 2 pH Nomenclature
12.
Traditional Respiratory Acid-BaseNomenclature N Compensated (chronic) Partly compensated (subacute) N N Uncompensated (acute) Respiratory alkalosis N Compensated (chronic) Partly compensated (subacute) N N Uncompensated (acute) Respiratory acidosis BE [HCO3]p PCO2 pH Nomenclature
13.
Base Excess/ DeficitBlood with large buffering capacity: significant changes in acid content with little change in free H + concentrations (pH) Acidemia or alkalemia: buffering capacity, > potential for pH change from any given change in H + content Buffering capacity depends on: [HCO 3 - ] RBC mass other factors Base excess/deficit= (measured pH – predicted pH) x 100 x 2/3 Normal metabolic acid-base status: + 3 mmol/L Relatively balanced metabolic acid-base status: + 5 mmol/L Clinically significant imbalance: + 10 mmol/L
14.
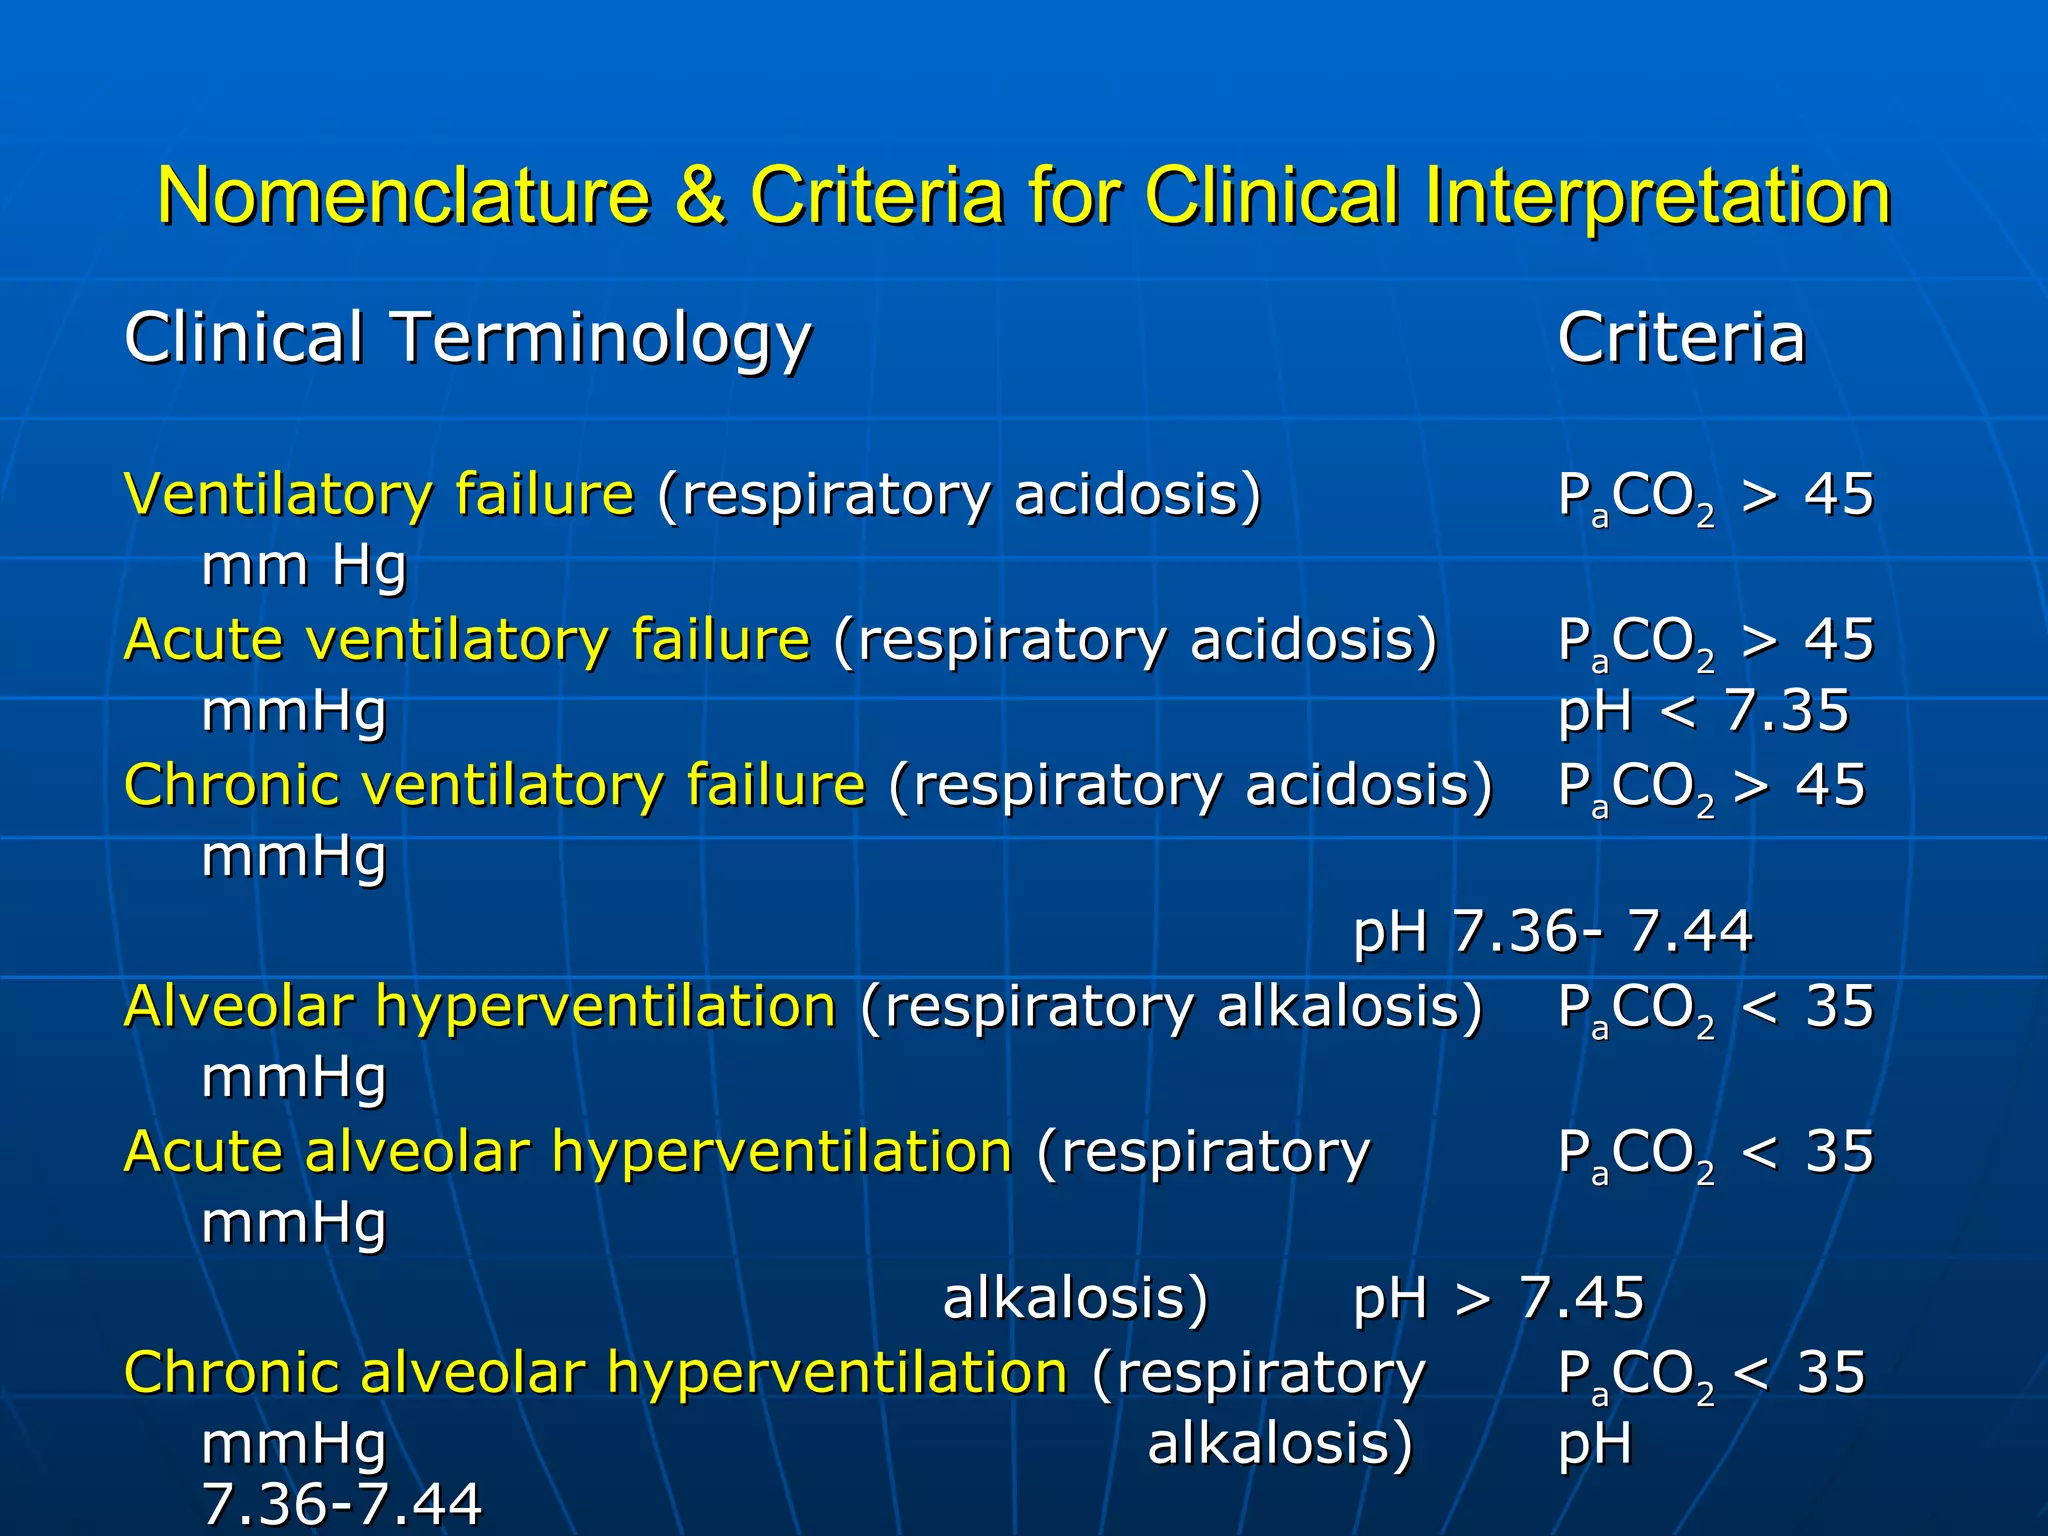
Nomenclature & Criteriafor Clinical Interpretation Clinical Terminology Criteria Ventilatory failure (respiratory acidosis) P a CO 2 > 45 mm Hg Acute ventilatory failure (respiratory acidosis) P a CO 2 > 45 mmHg pH < 7.35 Chronic ventilatory failure (respiratory acidosis) P a CO 2 > 45 mmHg pH 7.36- 7.44 Alveolar hyperventilation (respiratory alkalosis) P a CO 2 < 35 mmHg Acute alveolar hyperventilation (respiratory P a CO 2 < 35 mmHg alkalosis) pH > 7.45 Chronic alveolar hyperventilation (respiratory P a CO 2 < 35 mmHg alkalosis) pH 7.36-7.44
Metabolic Acidosis AnionGap artificial disparity between major plasma cations & anions that are routinely measured major plasma cations – major plasma anions [Na + ] – ([Cl - ] + [HCO3 - ]) 12 + 2 (normal) Minor cations: K + , Ca ++ Minor anions: phosphates, sulfates, organic anions
23.
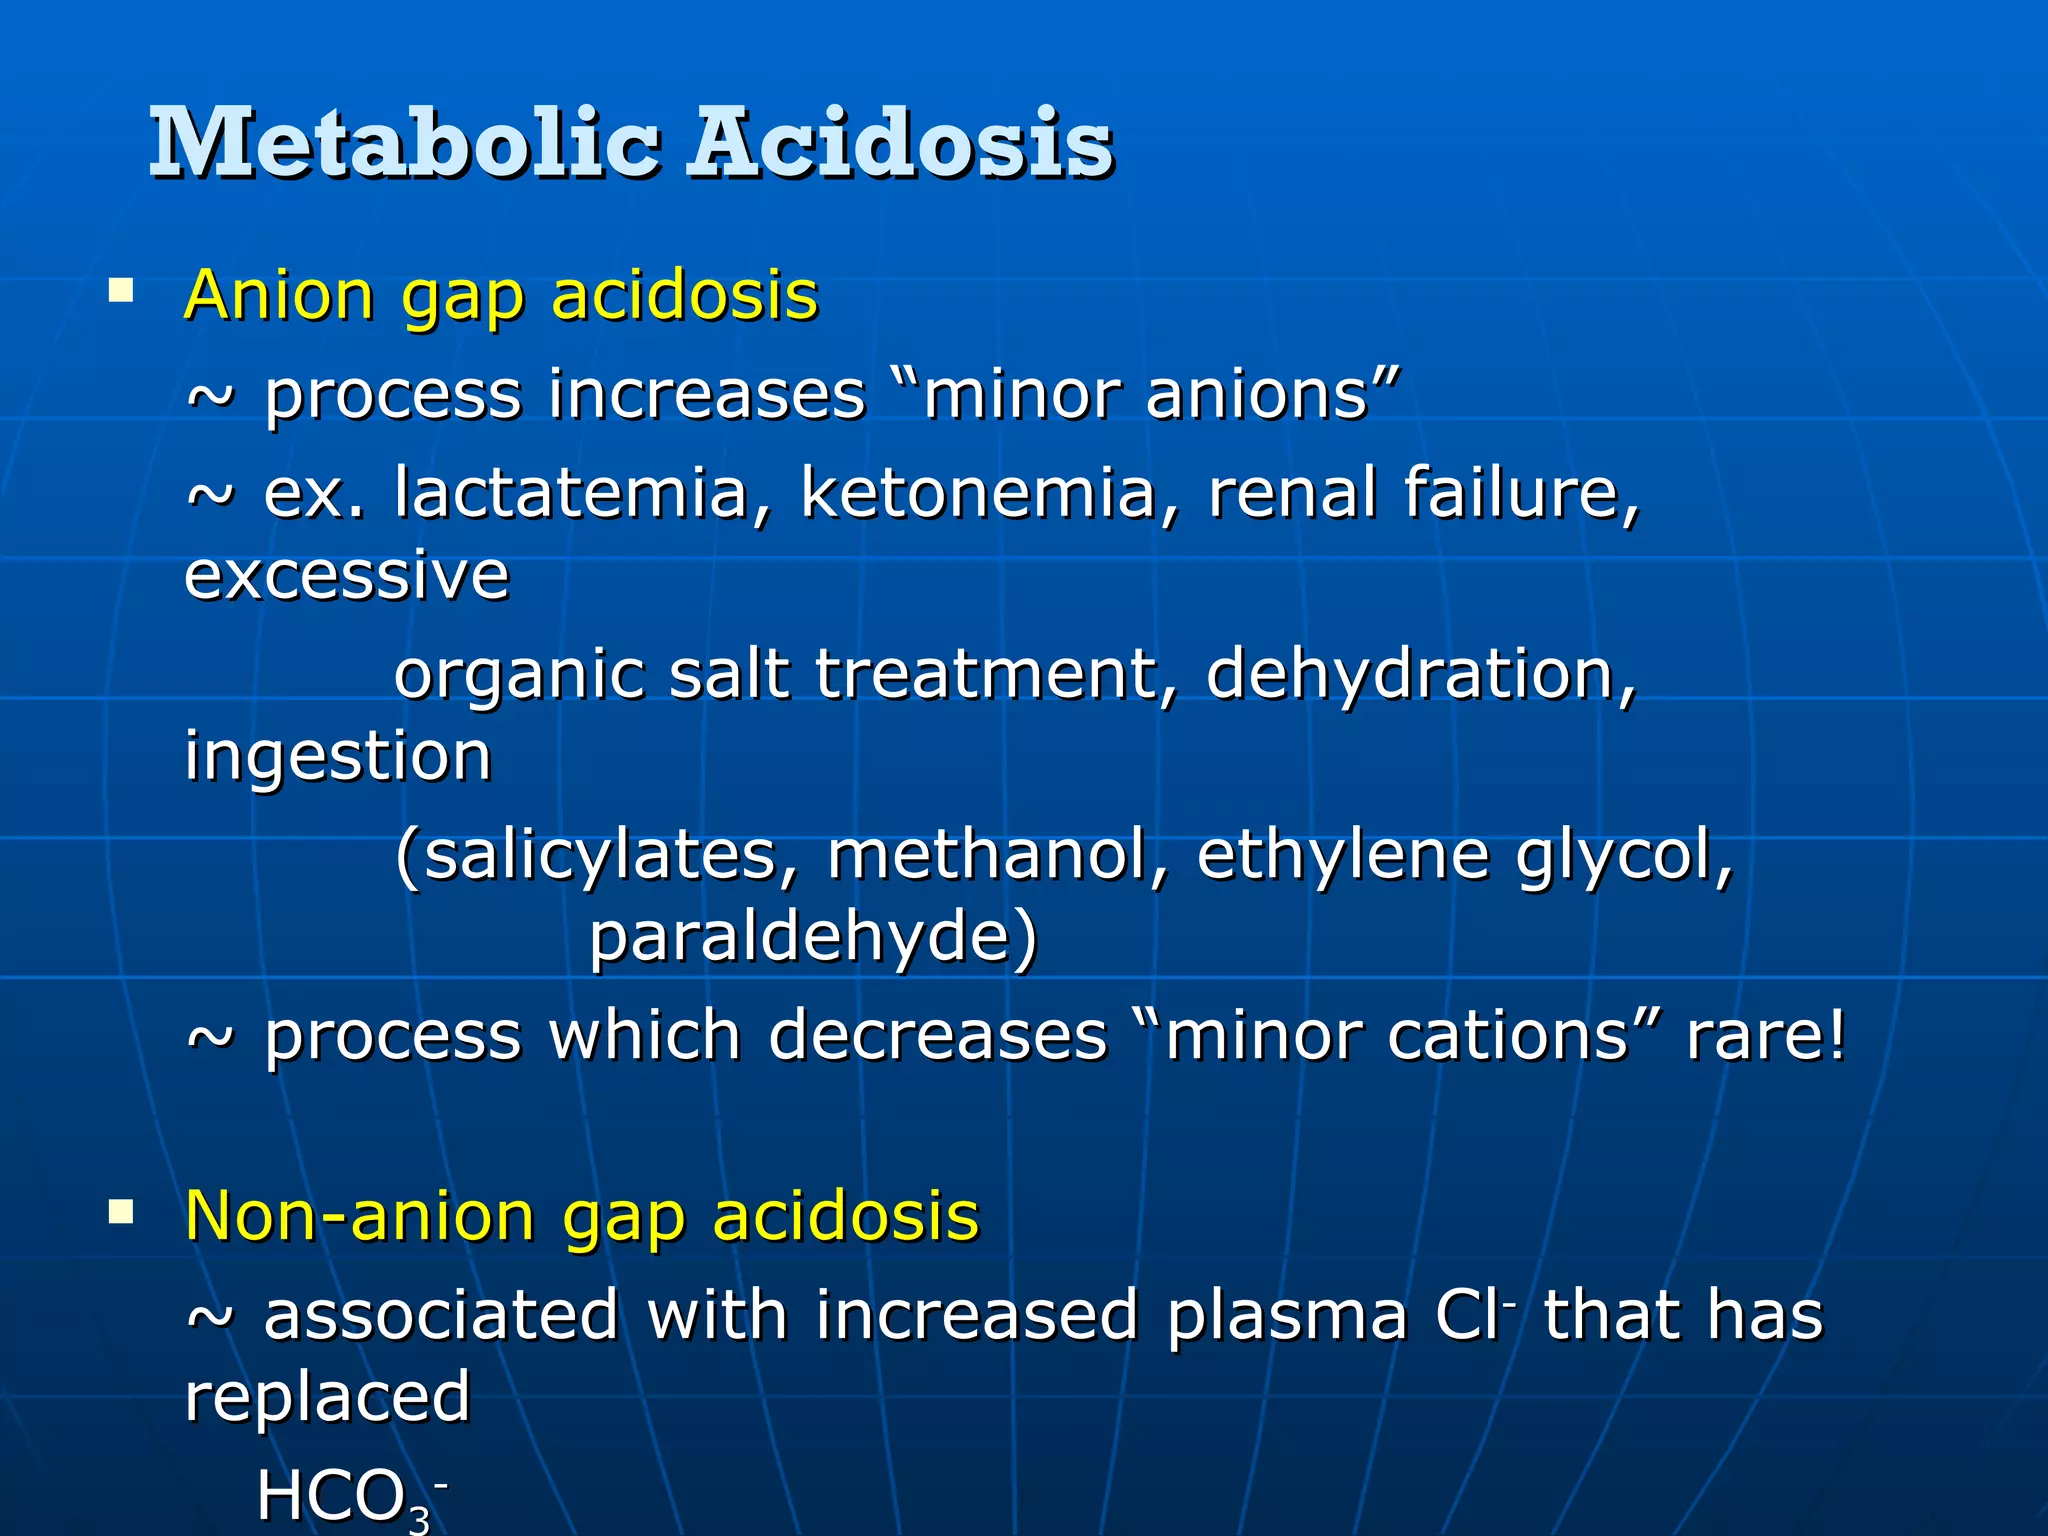
Metabolic Acidosis Aniongap acidosis ~ process increases “minor anions” ~ ex. lactatemia, ketonemia, renal failure, excessive organic salt treatment, dehydration, ingestion (salicylates, methanol, ethylene glycol, paraldehyde) ~ process which decreases “minor cations” rare! Non-anion gap acidosis ~ associated with increased plasma Cl - that has replaced HCO 3 - ~ ex. GI loss of HCO 3 - (diarrhea), renal wasting of HCO 3 - (RTA), ingestion of acids, parenteral hyperalimentation, carbonic anhydrase inhibitors
Steps for AnalyzingAcid- Base Disturbances Is patient acidemic or alkalotic? pH Is disturbance primarily respiratory or metabolic? PCO 2 , [HCO 3 - ] If disturbance respiratory, is it acute or chronic? If disturbance metabolic, is anion gap normal or abnormal? If disturbance metabolic, is the respiratory system compensating adequately? If disturbance is anion gap metabolic acidosis, are there any other metabolic disturbances present?
1. Is thepatient hypoxemic or normoxemic? Indices of Oxygenation: a. AaDO 2 = PAO 2 – PaO 2 PAO 2 = FiO 2 (713) – PaCO 2 0.8 PaO 2 = obtained from blood gas determination b. aAO 2 = PaO 2 PAO 2 c. P/F ratio = PO 2 FiO 2 Normal Value: patients < 60 y. o. > 400 patients > 60 y. o. expected P/F = 400 – [(age in years – 60) x 5] Actual P/F Ratio < expected = hypoxemic Actual P/F Ratio > expected = normoxemic
38.
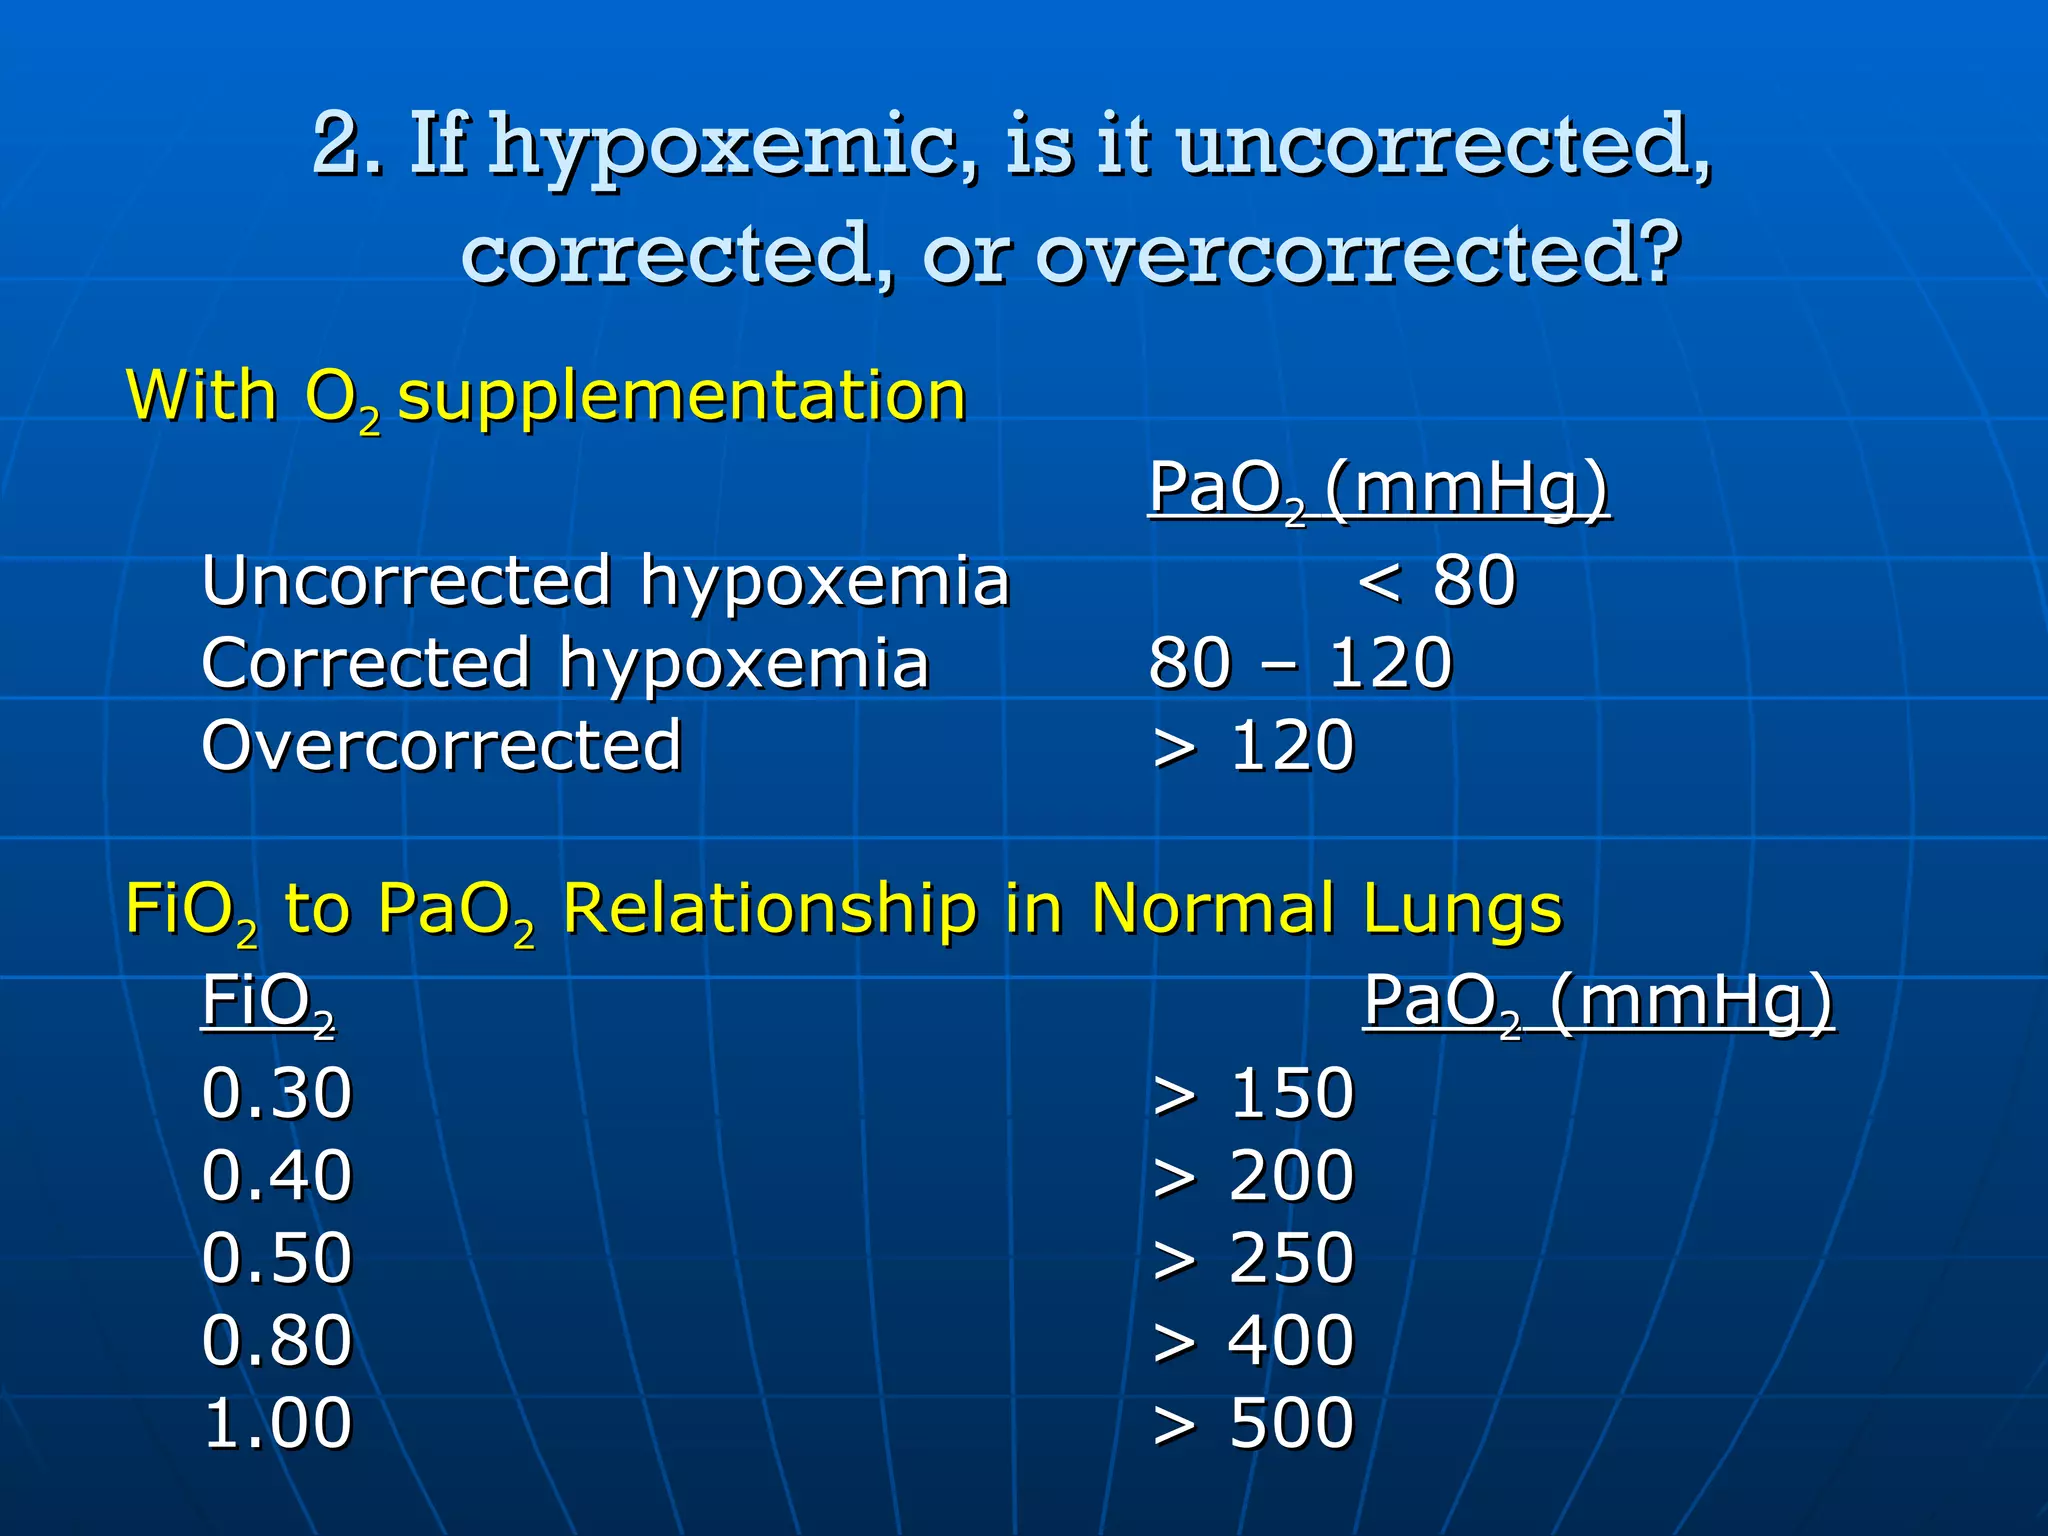
2. If hypoxemic,is it uncorrected, corrected, or overcorrected? With O 2 supplementation PaO 2 (mmHg) Uncorrected hypoxemia < 80 Corrected hypoxemia 80 – 120 Overcorrected > 120 FiO 2 to PaO 2 Relationship in Normal Lungs FiO 2 PaO 2 (mmHg) 0.30 > 150 0.40 > 200 0.50 > 250 0.80 > 400 1.00 > 500
39.
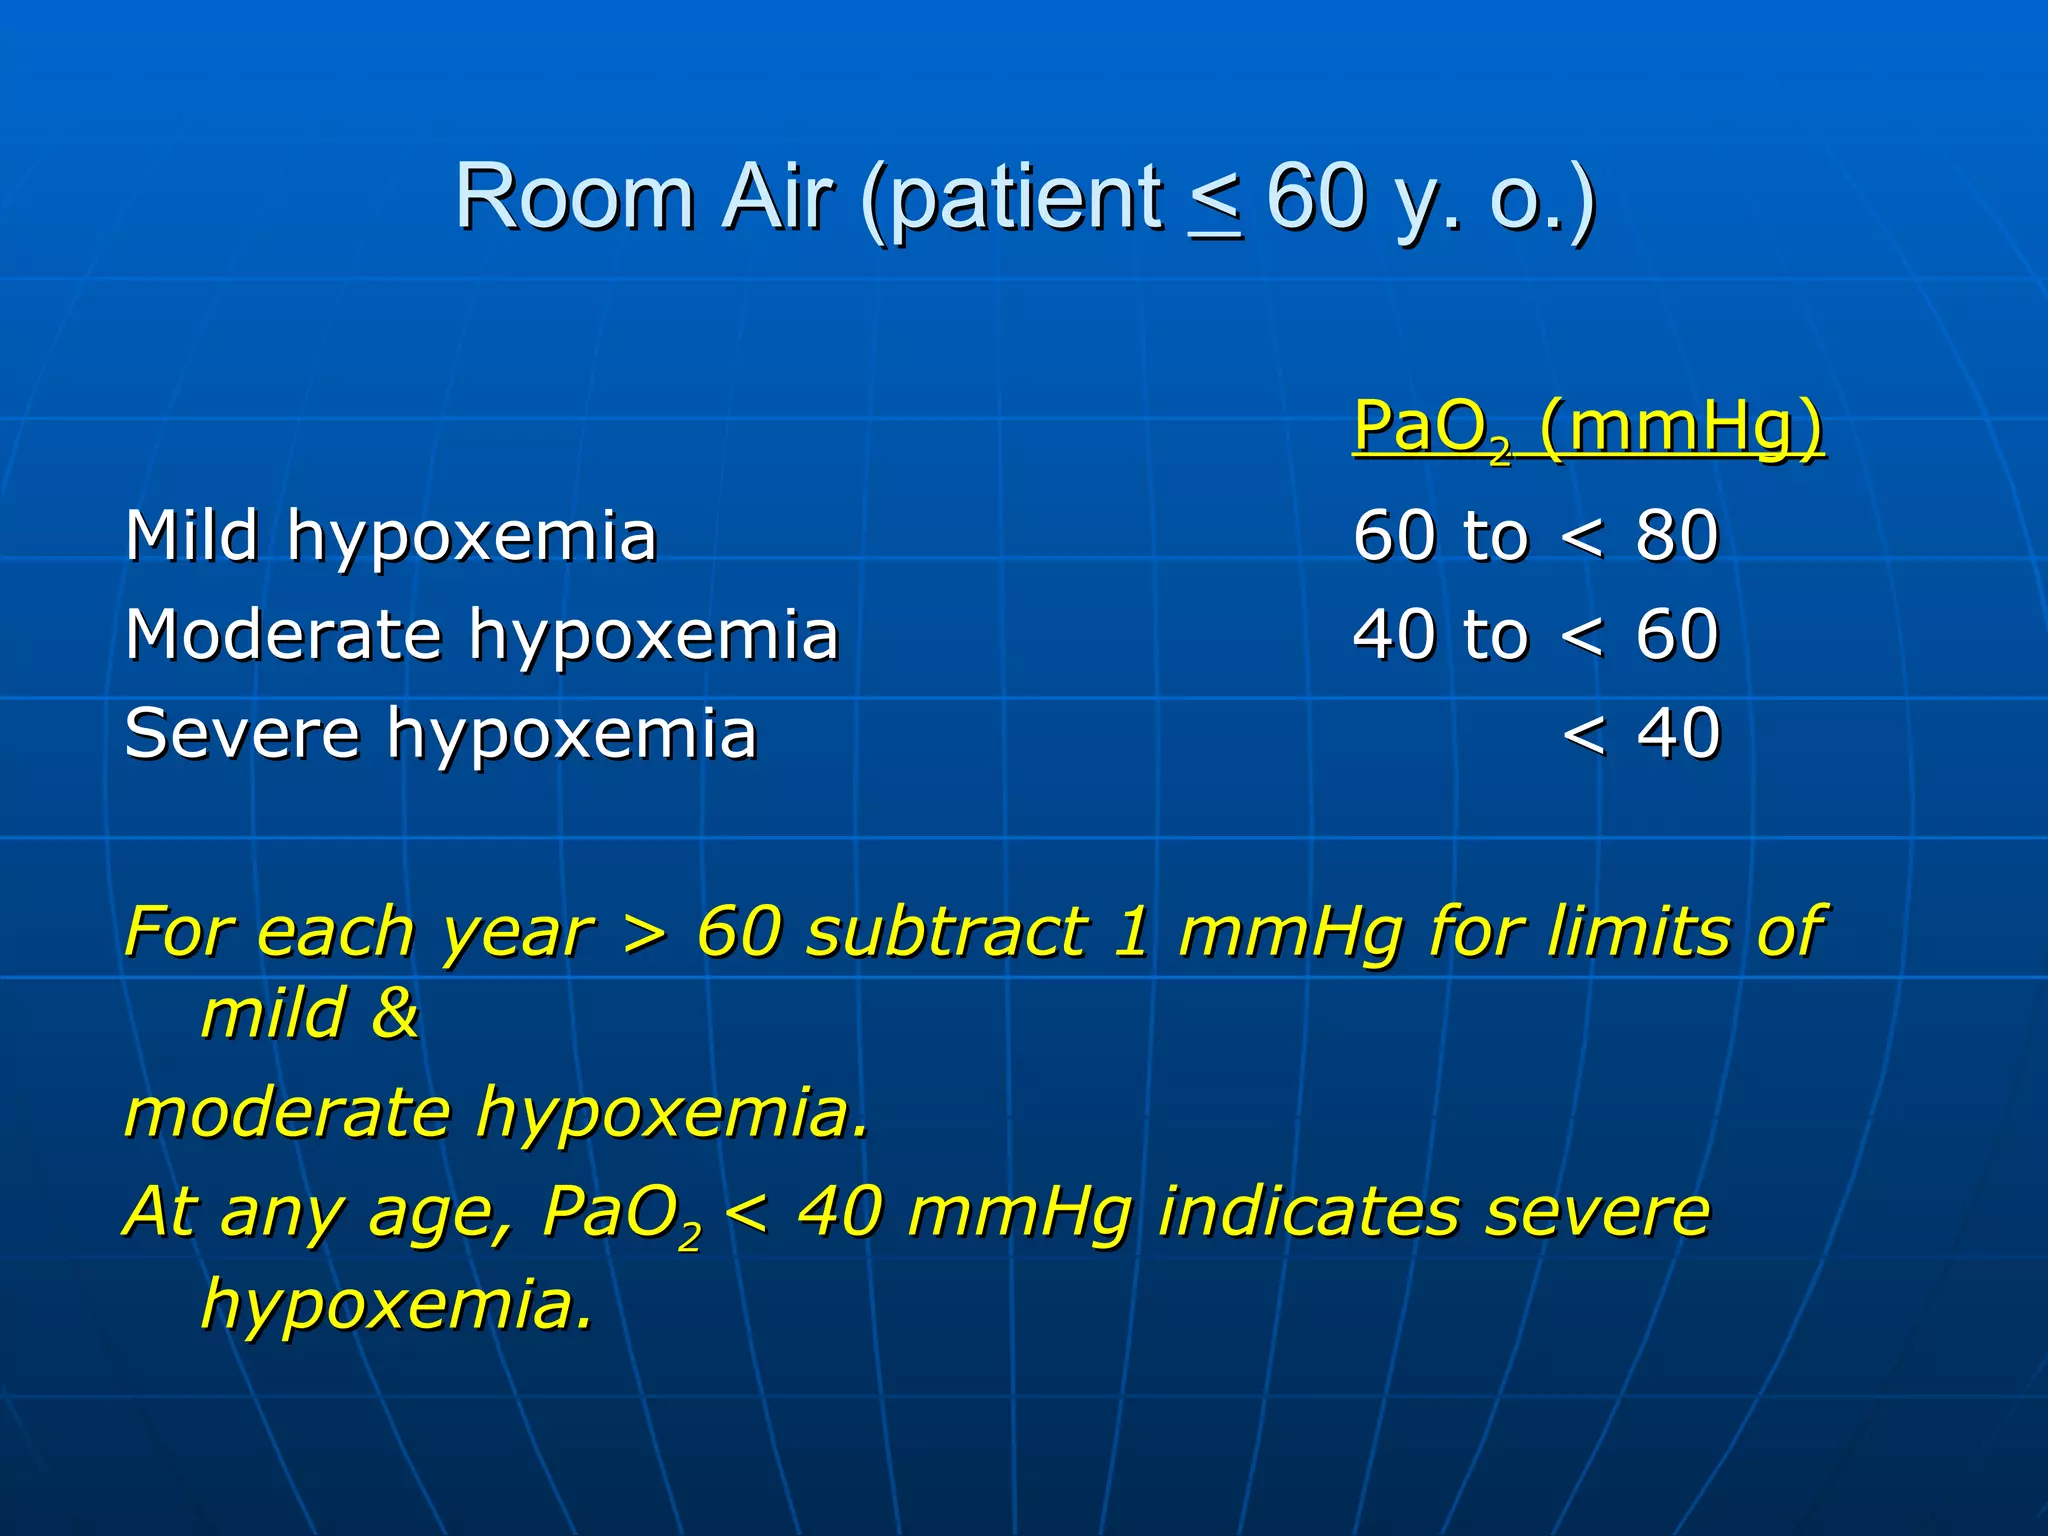
Room Air (patient < 60 y. o.) PaO 2 (mmHg) Mild hypoxemia 60 to < 80 Moderate hypoxemia 40 to < 60 Severe hypoxemia < 40 For each year > 60 subtract 1 mmHg for limits of mild & moderate hypoxemia. At any age, PaO 2 < 40 mmHg indicates severe hypoxemia.
![Henderson-Hasselbach Parameters & their normal laboratory ranges pH= [HCO 3 ]p P C02 > 26 < 35 > 7.45 Alkalotic < 22 > 45 < 7.35 Acidotic 22-26 35-45 7.35-7.45 Normal [HCO3]p (mmol/L) PCO2 (mmHg) pH](https://image.slidesharecdn.com/basicsinarterialbloodgasinterpretation-090907073413-phpapp02/75/Basics-In-Arterial-Blood-Gas-Interpretation-10-2048.jpg)
![Traditional Metabolic Acid-Base Nomenclature (+) N Compensated (chronic) (+) Partly compensated (subacute) (+) N Uncompensated (acute) Metabolic alkalosis (-) N Compensated (chronic) (-) Partly compensated (subacute) (-) N Uncompensated (acute) Metabolic acidosis BE [HCO3]p PCO 2 pH Nomenclature](https://image.slidesharecdn.com/basicsinarterialbloodgasinterpretation-090907073413-phpapp02/75/Basics-In-Arterial-Blood-Gas-Interpretation-11-2048.jpg)
![Traditional Respiratory Acid-Base Nomenclature N Compensated (chronic) Partly compensated (subacute) N N Uncompensated (acute) Respiratory alkalosis N Compensated (chronic) Partly compensated (subacute) N N Uncompensated (acute) Respiratory acidosis BE [HCO3]p PCO2 pH Nomenclature](https://image.slidesharecdn.com/basicsinarterialbloodgasinterpretation-090907073413-phpapp02/75/Basics-In-Arterial-Blood-Gas-Interpretation-12-2048.jpg)
![Base Excess/ Deficit Blood with large buffering capacity: significant changes in acid content with little change in free H + concentrations (pH) Acidemia or alkalemia: buffering capacity, > potential for pH change from any given change in H + content Buffering capacity depends on: [HCO 3 - ] RBC mass other factors Base excess/deficit= (measured pH – predicted pH) x 100 x 2/3 Normal metabolic acid-base status: + 3 mmol/L Relatively balanced metabolic acid-base status: + 5 mmol/L Clinically significant imbalance: + 10 mmol/L](https://image.slidesharecdn.com/basicsinarterialbloodgasinterpretation-090907073413-phpapp02/75/Basics-In-Arterial-Blood-Gas-Interpretation-13-2048.jpg)
![Metabolic Acidosis Anion Gap artificial disparity between major plasma cations & anions that are routinely measured major plasma cations – major plasma anions [Na + ] – ([Cl - ] + [HCO3 - ]) 12 + 2 (normal) Minor cations: K + , Ca ++ Minor anions: phosphates, sulfates, organic anions](https://image.slidesharecdn.com/basicsinarterialbloodgasinterpretation-090907073413-phpapp02/75/Basics-In-Arterial-Blood-Gas-Interpretation-22-2048.jpg)
![Metabolic Acidosis Expected PCO 2 = ( [HCO 3 - ] x 1.5) + 8 + 2 ex. [HCO 3 - ] = 11 expected PCO 2 = (11 x 1.5) + 8 + 2 = 22.5- 26.5 PCO 2 decreases 1- 1.5 mmHg per 1 meq/L HCO 3 - decrease](https://image.slidesharecdn.com/basicsinarterialbloodgasinterpretation-090907073413-phpapp02/75/Basics-In-Arterial-Blood-Gas-Interpretation-25-2048.jpg)

![Corrected [HCO 3 - ] for Anion Gap Metabolic Acidosis Measured serum [HCO 3 - ] + (anion gap – 12)](https://image.slidesharecdn.com/basicsinarterialbloodgasinterpretation-090907073413-phpapp02/75/Basics-In-Arterial-Blood-Gas-Interpretation-28-2048.jpg)
![Metabolic Alkalosis Expected PCO 2 = ( [HCO 3 - ] x 0.75 ) + 20 + 5 ex. [HCO 3 - ] = 34 expected PCO 2 = (34 x 0.75) + 20 + 5 = 40.5- 50.5 PCO 2 increases 0.5- 1 mmHg per 1 meq/L HCO 3 - increase](https://image.slidesharecdn.com/basicsinarterialbloodgasinterpretation-090907073413-phpapp02/75/Basics-In-Arterial-Blood-Gas-Interpretation-29-2048.jpg)
![Limits of Compensation 0.5- 1/ 1 meq/L [HCO 3 - ] Metabolic Alkalosis 1- 1.5/ 1 meq/L [HCO 3 - ] Metabolic Acidosis 2- 5/ 10 mmHg PCO 2 Chronic 0- 2/ 10 mmHg PCO 2 Acute Respiratory Alkalosis 1- 3.5/ 10 mmHg PCO 2 Chronic 0.1- 1/ 10 mmHg PCO 2 Acute Respiratory Acidosis PCO 2 mmHg [HCO 3 - ] meq/L Imbalance](https://image.slidesharecdn.com/basicsinarterialbloodgasinterpretation-090907073413-phpapp02/75/Basics-In-Arterial-Blood-Gas-Interpretation-32-2048.jpg)
![Steps for Analyzing Acid- Base Disturbances Is patient acidemic or alkalotic? pH Is disturbance primarily respiratory or metabolic? PCO 2 , [HCO 3 - ] If disturbance respiratory, is it acute or chronic? If disturbance metabolic, is anion gap normal or abnormal? If disturbance metabolic, is the respiratory system compensating adequately? If disturbance is anion gap metabolic acidosis, are there any other metabolic disturbances present?](https://image.slidesharecdn.com/basicsinarterialbloodgasinterpretation-090907073413-phpapp02/75/Basics-In-Arterial-Blood-Gas-Interpretation-33-2048.jpg)


![1. Is the patient hypoxemic or normoxemic? Indices of Oxygenation: a. AaDO 2 = PAO 2 – PaO 2 PAO 2 = FiO 2 (713) – PaCO 2 0.8 PaO 2 = obtained from blood gas determination b. aAO 2 = PaO 2 PAO 2 c. P/F ratio = PO 2 FiO 2 Normal Value: patients < 60 y. o. > 400 patients > 60 y. o. expected P/F = 400 – [(age in years – 60) x 5] Actual P/F Ratio < expected = hypoxemic Actual P/F Ratio > expected = normoxemic](https://image.slidesharecdn.com/basicsinarterialbloodgasinterpretation-090907073413-phpapp02/75/Basics-In-Arterial-Blood-Gas-Interpretation-37-2048.jpg)