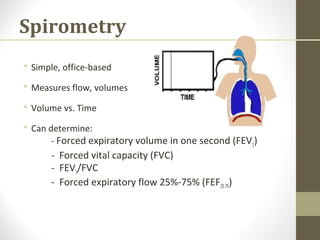
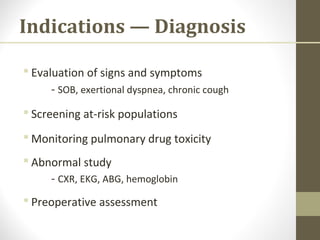
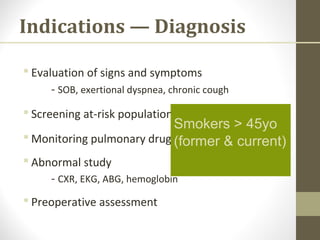
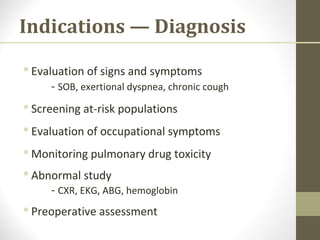
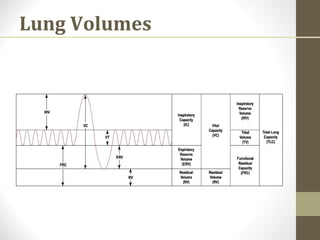
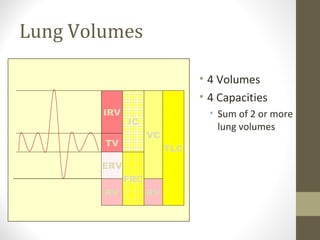
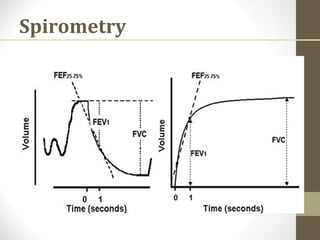
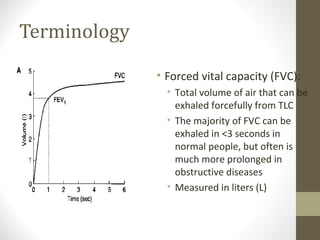
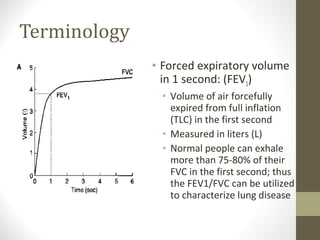
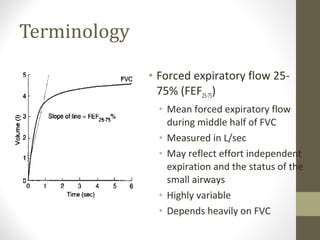
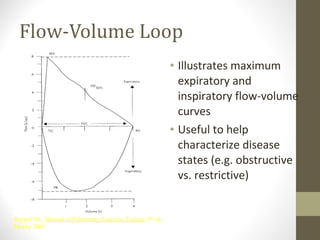
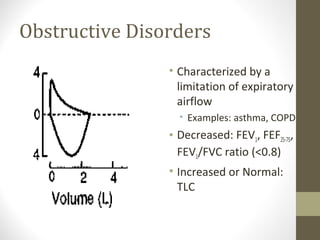
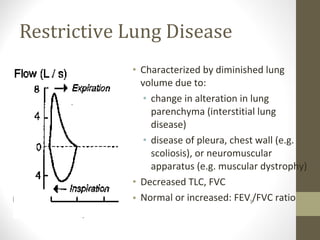
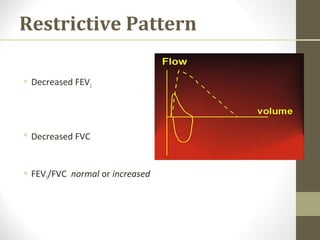
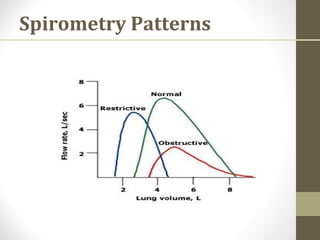
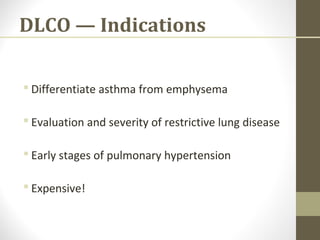
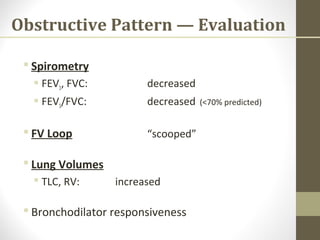
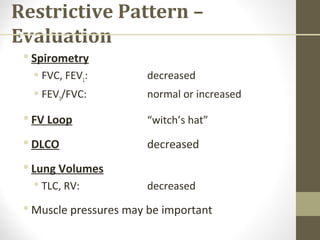
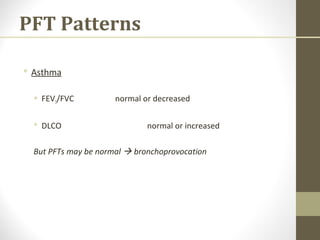
Pulmonary function tests (PFTs) evaluate the different components of the respiratory system including the airways, lungs, blood vessels and chest wall muscles. Spirometry is the most common PFT and measures how much air the patient can inhale and exhale. It evaluates values like the forced vital capacity (FVC), forced expiratory volume in 1 second (FEV1), and the FEV1/FVC ratio. Obstructive patterns show reduced FEV1 and FVC with a low FEV1/FVC ratio while restrictive patterns have reduced FVC but a normal or increased FEV1/FVC ratio. PFTs are useful for diagnosing conditions like asthma, COPD, and inter
A technique used to measure air flow in and out of the lungs.
A recording of lung volumes and capacities defined by the respiratory process. These recordings may be static (untimed) or dynamic (timed).
Assesses the integrated mechanical functions of lungs, chest wall and respiratory muscles.
The gold standard for diagnosis, assessment and monitoring of COPD.
Better than PEFR (which is effort dependent) for demonstrating airway obstruction in BA.
The most commonly used PFT
Pulmonary function tests (PFTs) are noninvasive tests that show how well the lungs are working. The tests measure lung volume, capacity, rates of flow, and gas exchange. This information can help your healthcare provider diagnose and decide the treatment of certain lung disorders.
Gas exchange between the alveoli and the pulmonary capillary blood occurs by diffusion, as will be discussed in the next chapter. Diffusion of oxygen and carbon dioxide occurs passively, according to their concentration differences across the alveolar-capillary barrier. These concentration differences must be maintained by ventilation of the alveoli and perfusion of the pulmonary capillaries.
Alveolar ventilation brings oxygen into the lung and removes carbon dioxide from it. Similarly, the mixed venous blood brings carbon dioxide into the lung and takes up alveolar oxygen. The alveolar Image not available. and Image not available. are thus determined by the relationship between alveolar ventilation and pulmonary capillary perfusion. Alterations in the ratio of ventilation to perfusion, called the Image not available., will result in changes in the alveolar Image not available. and Image not available., as well as in gas delivery to or removal from the lung.
Alveolar ventilation is normally about 4 to 6 L/min and pulmonary blood flow (which is equal to cardiac output) has a similar range, and so the Image not available. for the whole lung is in the range of 0.8 to 1.2. Image not available. However, ventilation and perfusion must be matched on the alveolar-capillary level, and the Image not available. for the whole lung is really of interest only as an approximation of the situation in all the alveolar-capillary units of the lung. For instance, suppose that all 5 L/min of the cardiac output went to the left lung and all 5 L/min of alveolar ventilation went to the right lung. The whole lung Image not available. would be 1.0, but there would be no gas exchange because there could be no gas diffusion between the ventilated alveoli and the perfused pulmonary capillaries.
Oxygen is delivered to the alveolus by alveolar ventilation, is removed from the alveolus as it diffuses into the pulmonary capillary blood, and is carried away by blood flow. Similarly, carbon dioxide is delivered to the alveolus in the mixed venous blood and diffuses into the alveolus in the pulmonary capillary. The carbon dioxide is removed from the alveolus by alveolar ventilation. As will be discussed in Chapter 6, at resting cardiac outputs the diffusion of both oxygen and carbon dioxide is normally limited by pulmonary perfusion. Thus, the alveolar partial pressures of both oxygen and carbon dioxide are determined by the Image not available. If the Image not available. in an alveolar-capillary unit increases, the delivery of oxygen relative to its removal will increase, as will the removal ...
C Rip allows the generation of flow volume loops which increases ease of workflow. Titrating CPAP and evaluating flow limitation during sleep becomes a simple matter of shape recognition.
Pulmonary function tests (PFT) are series of tests that measure lung function and aid in the management of patients with respiratory disease.
They are performed using standardized equipment and can be used for diagnosis, prognostication, management and follow-up of patients with pulmonary pathology.
Although PFT may not identify the exact pathology, it broadly classifies respiratory disorders as either obstructive or restrictive. In this session , the role of PFT in the measurement of lung mechanics and diagnosis of various diseases will be discussed in detail.
Comparing Evolved Extractive Text Summary Scores of Bidirectional Encoder Rep...University of Maribor
Â
Slides from:
11th International Conference on Electrical, Electronics and Computer Engineering (IcETRAN), NiĹĄ, 3-6 June 2024
Track: Artificial Intelligence
https://www.etran.rs/2024/en/home-english/
Professional air quality monitoring systems provide immediate, on-site data for analysis, compliance, and decision-making.
Monitor common gases, weather parameters, particulates.
Richard's entangled aventures in wonderlandRichard Gill
Â
Since the loophole-free Bell experiments of 2020 and the Nobel prizes in physics of 2022, critics of Bell's work have retreated to the fortress of super-determinism. Now, super-determinism is a derogatory word - it just means "determinism". Palmer, Hance and Hossenfelder argue that quantum mechanics and determinism are not incompatible, using a sophisticated mathematical construction based on a subtle thinning of allowed states and measurements in quantum mechanics, such that what is left appears to make Bell's argument fail, without altering the empirical predictions of quantum mechanics. I think however that it is a smoke screen, and the slogan "lost in math" comes to my mind. I will discuss some other recent disproofs of Bell's theorem using the language of causality based on causal graphs. Causal thinking is also central to law and justice. I will mention surprising connections to my work on serial killer nurse cases, in particular the Dutch case of Lucia de Berk and the current UK case of Lucy Letby.
What is greenhouse gasses and how many gasses are there to affect the Earth.moosaasad1975
Â
What are greenhouse gasses how they affect the earth and its environment what is the future of the environment and earth how the weather and the climate effects.
(May 29th, 2024) Advancements in Intravital Microscopy- Insights for Preclini...Scintica Instrumentation
Â
Intravital microscopy (IVM) is a powerful tool utilized to study cellular behavior over time and space in vivo. Much of our understanding of cell biology has been accomplished using various in vitro and ex vivo methods; however, these studies do not necessarily reflect the natural dynamics of biological processes. Unlike traditional cell culture or fixed tissue imaging, IVM allows for the ultra-fast high-resolution imaging of cellular processes over time and space and were studied in its natural environment. Real-time visualization of biological processes in the context of an intact organism helps maintain physiological relevance and provide insights into the progression of disease, response to treatments or developmental processes.
In this webinar we give an overview of advanced applications of the IVM system in preclinical research. IVIM technology is a provider of all-in-one intravital microscopy systems and solutions optimized for in vivo imaging of live animal models at sub-micron resolution. The systemâs unique features and user-friendly software enables researchers to probe fast dynamic biological processes such as immune cell tracking, cell-cell interaction as well as vascularization and tumor metastasis with exceptional detail. This webinar will also give an overview of IVM being utilized in drug development, offering a view into the intricate interaction between drugs/nanoparticles and tissues in vivo and allows for the evaluation of therapeutic intervention in a variety of tissues and organs. This interdisciplinary collaboration continues to drive the advancements of novel therapeutic strategies.
Observation of Ioâs Resurfacing via Plume Deposition Using Ground-based Adapt...SĂŠrgio Sacani
Â
Since volcanic activity was first discovered on Io from Voyager images in 1979, changes
on Ioâs surface have been monitored from both spacecraft and ground-based telescopes.
Here, we present the highest spatial resolution images of Io ever obtained from a groundbased telescope. These images, acquired by the SHARK-VIS instrument on the Large
Binocular Telescope, show evidence of a major resurfacing event on Ioâs trailing hemisphere. When compared to the most recent spacecraft images, the SHARK-VIS images
show that a plume deposit from a powerful eruption at Pillan Patera has covered part
of the long-lived Pele plume deposit. Although this type of resurfacing event may be common on Io, few have been detected due to the rarity of spacecraft visits and the previously low spatial resolution available from Earth-based telescopes. The SHARK-VIS instrument ushers in a new era of high resolution imaging of Ioâs surface using adaptive
optics at visible wavelengths.
Introduction:
RNA interference (RNAi) or Post-Transcriptional Gene Silencing (PTGS) is an important biological process for modulating eukaryotic gene expression.
It is highly conserved process of posttranscriptional gene silencing by which double stranded RNA (dsRNA) causes sequence-specific degradation of mRNA sequences.
dsRNA-induced gene silencing (RNAi) is reported in a wide range of eukaryotes ranging from worms, insects, mammals and plants.
This process mediates resistance to both endogenous parasitic and exogenous pathogenic nucleic acids, and regulates the expression of protein-coding genes.
What are small ncRNAs?
micro RNA (miRNA)
short interfering RNA (siRNA)
Properties of small non-coding RNA:
Involved in silencing mRNA transcripts.
Called âsmallâ because they are usually only about 21-24 nucleotides long.
Synthesized by first cutting up longer precursor sequences (like the 61nt one that Lee discovered).
Silence an mRNA by base pairing with some sequence on the mRNA.
Discovery of siRNA?
The first small RNA:
In 1993 Rosalind Lee (Victor Ambros lab) was studying a non- coding gene in C. elegans, lin-4, that was involved in silencing of another gene, lin-14, at the appropriate time in the
development of the worm C. elegans.
Two small transcripts of lin-4 (22nt and 61nt) were found to be complementary to a sequence in the 3' UTR of lin-14.
Because lin-4 encoded no protein, she deduced that it must be these transcripts that are causing the silencing by RNA-RNA interactions.
Types of RNAi ( non coding RNA)
MiRNA
Length (23-25 nt)
Trans acting
Binds with target MRNA in mismatch
Translation inhibition
Si RNA
Length 21 nt.
Cis acting
Bind with target Mrna in perfect complementary sequence
Piwi-RNA
Length ; 25 to 36 nt.
Expressed in Germ Cells
Regulates trnasposomes activity
MECHANISM OF RNAI:
First the double-stranded RNA teams up with a protein complex named Dicer, which cuts the long RNA into short pieces.
Then another protein complex called RISC (RNA-induced silencing complex) discards one of the two RNA strands.
The RISC-docked, single-stranded RNA then pairs with the homologous mRNA and destroys it.
THE RISC COMPLEX:
RISC is large(>500kD) RNA multi- protein Binding complex which triggers MRNA degradation in response to MRNA
Unwinding of double stranded Si RNA by ATP independent Helicase
Active component of RISC is Ago proteins( ENDONUCLEASE) which cleave target MRNA.
DICER: endonuclease (RNase Family III)
Argonaute: Central Component of the RNA-Induced Silencing Complex (RISC)
One strand of the dsRNA produced by Dicer is retained in the RISC complex in association with Argonaute
ARGONAUTE PROTEIN :
1.PAZ(PIWI/Argonaute/ Zwille)- Recognition of target MRNA
2.PIWI (p-element induced wimpy Testis)- breaks Phosphodiester bond of mRNA.)RNAse H activity.
MiRNA:
The Double-stranded RNAs are naturally produced in eukaryotic cells during development, and they have a key role in regulating gene expression .
This presentation explores a brief idea about the structural and functional attributes of nucleotides, the structure and function of genetic materials along with the impact of UV rays and pH upon them.
Deep Behavioral Phenotyping in Systems Neuroscience for Functional Atlasing a...Ana LuĂsa Pinho
Â
Functional Magnetic Resonance Imaging (fMRI) provides means to characterize brain activations in response to behavior. However, cognitive neuroscience has been limited to group-level effects referring to the performance of specific tasks. To obtain the functional profile of elementary cognitive mechanisms, the combination of brain responses to many tasks is required. Yet, to date, both structural atlases and parcellation-based activations do not fully account for cognitive function and still present several limitations. Further, they do not adapt overall to individual characteristics. In this talk, I will give an account of deep-behavioral phenotyping strategies, namely data-driven methods in large task-fMRI datasets, to optimize functional brain-data collection and improve inference of effects-of-interest related to mental processes. Key to this approach is the employment of fast multi-functional paradigms rich on features that can be well parametrized and, consequently, facilitate the creation of psycho-physiological constructs to be modelled with imaging data. Particular emphasis will be given to music stimuli when studying high-order cognitive mechanisms, due to their ecological nature and quality to enable complex behavior compounded by discrete entities. I will also discuss how deep-behavioral phenotyping and individualized models applied to neuroimaging data can better account for the subject-specific organization of domain-general cognitive systems in the human brain. Finally, the accumulation of functional brain signatures brings the possibility to clarify relationships among tasks and create a univocal link between brain systems and mental functions through: (1) the development of ontologies proposing an organization of cognitive processes; and (2) brain-network taxonomies describing functional specialization. To this end, tools to improve commensurability in cognitive science are necessary, such as public repositories, ontology-based platforms and automated meta-analysis tools. I will thus discuss some brain-atlasing resources currently under development, and their applicability in cognitive as well as clinical neuroscience.
Cancer cell metabolism: special Reference to Lactate PathwayAADYARAJPANDEY1
Â
Normal Cell Metabolism:
Cellular respiration describes the series of steps that cells use to break down sugar and other  chemicals to get the energy we need to function.
Energy is stored in the bonds of glucose and when glucose is broken down, much of that energy is released. Â
Cell utilize energy in the form of ATP.
The first step of respiration is called glycolysis. In a series of steps, glycolysis breaks glucose into two smaller molecules -Â a chemical called pyruvate. A small amount of ATP is formed during this process.Â
Most healthy cells continue the breakdown in a second process, called the Kreb's cycle. The Kreb's cycle allows cells to âburnâ the pyruvates made in glycolysis to get more ATP.
The last step in the breakdown of glucose is called oxidative phosphorylation (Ox-Phos).
It takes place in specialized cell structures called mitochondria. This process produces a large amount of ATP.  Importantly, cells need oxygen to complete oxidative phosphorylation.
If a cell completes only glycolysis, only 2 molecules of ATP are made per glucose. However, if the cell completes the entire respiration process (glycolysis - Kreb's - oxidative phosphorylation), about 36 molecules of ATP are created, giving it much more energy to use.
IN CANCER CELL:
Unlike healthy cells that "burn" the entire molecule of sugar to capture a large amount of energy as ATP, cancer cells are wasteful.
Cancer cells only partially break down sugar molecules. They overuse the first step of respiration, glycolysis. They frequently do not complete the second step, oxidative phosphorylation.
This results in only 2 molecules of ATP per each glucose molecule instead of the 36 or so ATPs healthy cells gain. As a result, cancer cells need to use a lot more sugar molecules to get enough energy to survive.Â
introduction to WARBERG PHENOMENA:
WARBURG EFFECT Usually, cancer cells are highly glycolytic (glucose addiction) and take up more glucose than do normal cells from outside.
Otto Heinrich Warburg (; 8 October 1883 â 1 August 1970) In 1931 was awarded the Nobel Prize in Physiology for his "discovery of the nature and mode of action of the respiratory enzyme.
WARNBURG EFFECT : Â cancer cells under aerobic (well-oxygenated) conditions to metabolize glucose to lactate (aerobic glycolysis) is known as the Warburg effect. Warburg made the observation that tumor slices consume glucose and secrete lactate at a higher rate than normal tissues.
2. Pulmonary function tests
(PFTs)
⢠Pulmonary function testing is a valuable
tool for evaluating the respiratory system
⢠comparing the measured values for
pulmonary function tests obtained on a
patient at any particular point with normal
values derived from population studies.
⢠The percentage of predicted normal is
used to grade the severity of the
abnormality.
4. PFTs
â˘Four lung components include :
The airways (large and small),
Lung parenchyma (alveoli,
interstitium),
Pulmonary vasculature, and
The bellows-pump mechanism
5. PFTs⢠PFTs can include:
simple screening spirometry, Flow Volume Loop
Formal lung volume measurement,
Bronchoprovocation testing
Diffusing capacity for carbon monoxide, and
Arterial blood gases. Measurement of maximal
respiratory pressures
⢠These studies may collectively be referred to as a
complete pulmonary function survey.
6. Spirometry
â˘Measurement of the pattern of air
movement into and out of the lungs
during controlled ventilatory
maneuvers.
â˘Often done as a maximal expiratory
maneuver
7. Importance
⢠Patients and physicians have inaccurate
perceptions of severity of airflow
obstruction and/or severity of lung disease
by physical exam
⢠Provides objective evidence in identifying
patterns of disease
8. Spirometry
ď§ Simple, office-based
ď§ Measures flow, volumes
ď§ Volume vs. Time
ď§ Can determine:
- Forced expiratory volume in one second (FEV1)
- Forced vital capacity (FVC)
- FEV1/FVC
- Forced expiratory flow 25%-75% (FEF25-75)
9. Spirometry
The most readily available most useful
pulmonary function test
It takes ten to 15 minutes
carries no risk
10. Spirometry
⢠Spirometry is the most commonly used lung function
screening study.
⢠should be the clinician's first option
⢠other studies being reserved for specific indications
⢠easily performed
⢠in the ambulatory setting, physician's office, emergency
department, or inpatient setting.
11. Patient care/preparations
⢠Two choices are available with respect to bronchodilator and
medication use prior to testing. Patients may withhold oral
and inhaled bronchodilators to establish baseline lung
function and evaluate maximum bronchodilator response, or
they may continue taking medication as prescribed. If
medications are withheld, a risk of exacerbation of bronchial
spasm exists.
12. Spirometry
⢠The slow vital capacity (SVC) can also be measured with
spirometers
collect data for at least 30 seconds
when airways obstruction is present, the forced vital capacity
(FVC) is reduced and
slow vital capacity (SVC) may be normal
13. Spirometry
⢠When the slow or forced vital capacity is within the normal
range: No significant restrictive
disorder .
No need to measure static lung volumes (residual volume and
total lung capacity).
14. Indications â Diagnosis
ď§ Evaluation of signs and symptoms
- SOB, exertional dyspnea, chronic cough
ď§ Screening at-risk populations
ď§ Monitoring pulmonary drug toxicity
ď§ Abnormal study
- CXR, EKG, ABG, hemoglobin
ď§ Preoperative assessment
16. Indications â Diagnosis
ď§ Evaluation of signs and symptoms
- SOB, exertional dyspnea, chronic cough
ď§ Screening at-risk populations
ď§ Evaluation of occupational symptoms
ď§ Monitoring pulmonary drug toxicity
ď§ Abnormal study
- CXR, EKG, ABG, hemoglobin
ď§ Preoperative assessment
17. Indications â Prognostic
â Assess severity
â Follow response to therapy
â Determine further treatment goals
â Referral for surgery
â Disability
18. Contraindications for
spirometry
⢠Relative contraindications for spirometry include hemoptysis
of unknown origin, pneumothorax, unstable angina pectoris,
recent myocardial infarction, thoracic aneurysms, abdominal
aneurysms, cerebral aneurysms, recent eye surgery (increased
intraocular pressure during forced expiration), recent
abdominal or thoracic surgical procedures, and patients with a
history of syncope associated with forced exhalation
19. Spirometry
⢠Spirometry requires a voluntary maneuver in which a seated
patient inhales maximally from tidal respiration to total lung
capacity and then rapidly exhales to the fullest extent until no
further volume is exhaled at residual volume
20. Spirometry
⢠The maneuver may be performed in a forceful manner to
generate a forced vital capacity (FVC) or in a more relaxed
manner to generate a slow vital capacity (SVC).
21. ⢠In normal persons, the inspiratory vital capacity, the
expiratory SVC, and expiratory FVC are essentially equal.
However, in patients with obstructive airways disease, the
expiratory SVC is generally higher than the FVC.
24. acceptable spirometry
(ATS)
⢠1) minimal hesitation at the start of the forced expiration
(extrapolated volume (EV) <5% of the FVC or 0.15 L,
whichever is larger
⢠Time to PEF is <120 ms (optional until further information is
available)
(2) no cough in the first second of forced exhalation,
⢠3) meets 1 of 3 criteria that define a valid end-of-test
25. Valid end-of-test
⢠(a) smooth curvilinear rise of the volume-time tracing to a
plateau of at least 1-second duration;
(b) if a test fails to exhibit an expiratory
plateau, a forced expiratory time (FET) of 15 seconds; or
(c) when the patient
cannot or should not continue forced exhalation for valid
medical reasons.
26. ⢠If both of these criteria are not met, continue testing until:
Both of the criteria are met with analysis of additional
acceptable spirograms or
⢠A total of eight tests have been performed or
⢠Save a minimum of three best maneuvers
27. Acceptability Criteria
⢠Good start of test
⢠No coughing
⢠No variable flow
⢠No early termination
⢠Reproducibility
28. The volume-time tracing
⢠The volume-time tracing is most useful in assessing whether
the end-of-test criteria have been met
32. Repeatability Criteria
⢠After three acceptable spirograms have been obtained, apply
the following tests. Are the two largest FVCs within
0.2 L of each other?
⢠Are the two largest FEV1s within 0.2 L of each other?
⢠If both of these criteria are met, the test session may be
concluded
37. Mechanical Properties
⢠Compliance
⢠Describes the stiffness of the lungs
⢠Change in volume over the change in pressure
⢠Elastic recoil
⢠The tendency of the lung to return to itâs resting state
⢠A lung that is fully stretched has more elastic recoil and thus
larger maximal flows
39. Factors That Affect Lung Volumes
⢠Age
⢠Sex
⢠Height
⢠Weight
⢠Race
⢠Disease
40. Technique
⢠Have patient seated comfortably
⢠Closed-circuit technique
⢠Place nose clip on
⢠Have patient breathe on mouthpiece
⢠Have patient take a deep breath as fast as possible
⢠Blow out as hard as they can until you tell them to stop
41. Terminology
⢠Forced vital capacity (FVC):
⢠Total volume of air that can be
exhaled forcefully from TLC
⢠The majority of FVC can be
exhaled in <3 seconds in
normal people, but often is
much more prolonged in
obstructive diseases
⢠Measured in liters (L)
42. FVC
⢠Interpretation of % predicted:
⢠80-120% Normal
⢠70-79% Mild reduction
⢠50%-69%Moderate reduction
⢠<50% Severe reduction
FV
43. Terminology
⢠Forced expiratory volume
in 1 second: (FEV1)
⢠Volume of air forcefully
expired from full inflation
(TLC) in the first second
⢠Measured in liters (L)
⢠Normal people can exhale
more than 75-80% of their
FVC in the first second; thus
the FEV1/FVC can be utilized
to characterize lung disease
44. FEV1
⢠Interpretation of % predicted:
⢠>75% Normal
⢠60%-75%Mild obstruction
⢠50-59% Moderate obstruction
⢠<49% Severe obstruction
FE F
45. Terminology
⢠Forced expiratory flow 25-
75% (FEF25-75)
⢠Mean forced expiratory flow
during middle half of FVC
⢠Measured in L/sec
⢠May reflect effort independent
expiration and the status of the
small airways
⢠Highly variable
⢠Depends heavily on FVC
46. FEF25-75
⢠Interpretation of % predicted:
⢠>60% Normal
⢠40-60% Mild obstruction
⢠20-40% Moderate obstruction
⢠<10% Severe obstruction
47. Flow-Volume Loop
⢠Illustrates maximum
expiratory and
inspiratory flow-volume
curves
⢠Useful to help
characterize disease
states (e.g. obstructive
vs. restrictive)
Ruppel GL. Manual of Pulmonary Function Testing, 8th
ed.,
Mosby 2003
51. Restrictive Lung Disease
⢠Characterized by diminished lung
volume due to:
⢠change in alteration in lung
parenchyma (interstitial lung
disease)
⢠disease of pleura, chest wall (e.g.
scoliosis), or neuromuscular
apparatus (e.g. muscular dystrophy)
⢠Decreased TLC, FVC
⢠Normal or increased: FEV1/FVC ratio
60. Bronchodilator Response
ď§ Degree to which FEV1 improves with inhaled
bronchodilator
ď§ Documents reversible airflow obstruction
ď§ Significant response if:
- FEV1 increases by 12% and >200ml
ď§ Request if obstructive pattern on spirometry
68. Diffusing Capacity
ď§ Diffusing capacity of lungs for CO
ď§ Measures ability of lungs to transport inhaled gas
from alveoli to pulmonary capillaries
ď§ Depends on:
- alveolarâcapillary membrane
- hemoglobin concentration
- cardiac output
70. DLCO â Indications
ď§ Differentiate asthma from emphysema
ď§ Evaluation and severity of restrictive lung disease
ď§ Early stages of pulmonary hypertension
ď§ Expensive!
71. Bronchoprovocation
ď§ Useful for diagnosis of asthma in the setting of normal
pulmonary function tests
ď§ Common agents:
- Methacholine, Histamine, others
ď§ Diagnostic if: âĽ20% decrease in FEV1
73. PFT Interpretation Strategy
ď§ What is the clinical question?
ď§ What is ânormalâ?
ď§ Did the test meet American Thoracic Society (ATS) criteria?
ď§ Donât forget (or ignore) the flow volume loop!
Significant CXR findings include hyperinflation, increased interstitial markings, enlarged pulmonary arteries. Significant ECG findings include evidence of pulmonary HTN or COPD
(What might ECG show in a COPD patient? MAT, WAP, others)
Significant findings on ABG are hypoxemia or hypercapnia; elevated Hb may also be evident on CBC.
Preop assessment is rarely to tell surgeon not to operate, but to prepare for pulmonary complications such as pneumonia, prolonged mechanical ventilation, etc. Also for screening: this includes all current and former smokers &gt;45yoa, known COPD or asthma pts, also those scheduled for thoracic or upper abdominal surgery. If mod-severe obstruction identified and surgery can be delayed, can start prophylactic program of pulmonary hygiene, stop smoking, give inhaled bronchodilators or steroids, etc.
Image source: http://www.spirxpert.com/index.html
FEV1 is decreased out of proportion to FVC, which causes the ratio to decrease as well.
This is not a complete list, just some of the most common diseases that should be on your differential for obstructive lung disease.
Image source: http://www.spirxpert.com/index.html
FEV1 decreases in proportion to decrease in FVC, so ratio remains normal or even slightly increased
Restrictive lung disease is made up of intrinsic lung disease (causes inflammation and scarring (interstitial lung diseases) or fill the airspaces w/ debris, inflammation (exudate); extrinsic causes are chest wall or pleural diseases that mechanically compress the lung and prevent expansion. Neuromuscular causes decreases ability of respiratory muscles to inflate and deflate the lungs.
Lack of observed response to bronchodilator does not preclude use, b/c patients may have symptomatic benefit.
Can give 6-8wk trial of bronchodilator and/or inhaled corticosteroids (ICS) and reassess clinically, can also obtain FEV1 at that time.
HOLD MDI THE MORNING PRIOR TO TESTING.
Have patient breath out at max effort, then breath in quickly at max effort, creates a loop w/ differing patterns.
Upper airway = pharynx, larynx, trachea.
Image source: http://www.nationalasthma.org.au/html/management/spiro_book/index.asp
Vocal cord dysfunction: variable extrathoracic obstruction.
Tracheal stenosis: fixed obstruction (hx frequent intubations).
Rapid rise to peak flow rate, followed by fall in flow as pt exhales toward residual volume. Inspiratory curve is symmetrical.
Example of someone grabbing tracheaâcauses problems w/ inspiration and expiration = fixed obstruction
Vocal cord dysfunction: variable extrathoracic obstruction.
Endobronchial carcinoma: variable intrathoracic obstruction. (Rare to diagnose this on flow volume loop).
FVC is decreased in both obstructive and restrictive disease, so usually need to obtain lung volumes to see if restrictive component present (increased TLC).
Measure of gas exchange at alveolar-capillary membrane.
Changes in DLCO are one of the earliest signs of interstitial lung disease (ILD).
Pulmonary vascular disease = pulmonary emboli, pulmonary HTN.
Low DLCO is also a major predictor of desaturation during exercise.
So you have restrictive disease by spirometry and lung volumes. You get a DLCO and see it is normal. Thinking back to your differential diagnosis of restrictive lung disease (what are the four things on your differential?), what can you probably rule out? Answer = Interstitial lung disease.
This is where you would order max respiratory pressures, to evaluate for NM disease. Max inspiratory pressures are recorded as patientt is breathing through a blocked tube, also done for expiration. Should be decreased in NM disease.
Can always send patient home and tell them to come back when having symptoms, but this delays diagnosis. Another alternative is measure peak flow variability at home.
If suspected asthma but has not responded to therapy, think of obtaining flow volume loop to see if there is vocal cord dysfunction = variable extrathoracic obstruction.
Now weâre going to put it all togetherâŚ
Donât need a DLCO, but if were decreased would make you think emphysema, if normal then chronic bronchitis.
IF restrictive pattern, youâre going to want to get DLCO b/c it tells you whether the restriction is due to parenchymal disease (which will change your management), or NM, pleural or CW disease
Remember that DLCO should be normal in chronic bronchitis because it affects the more proximal airways which is not where your gas exchange takes place.