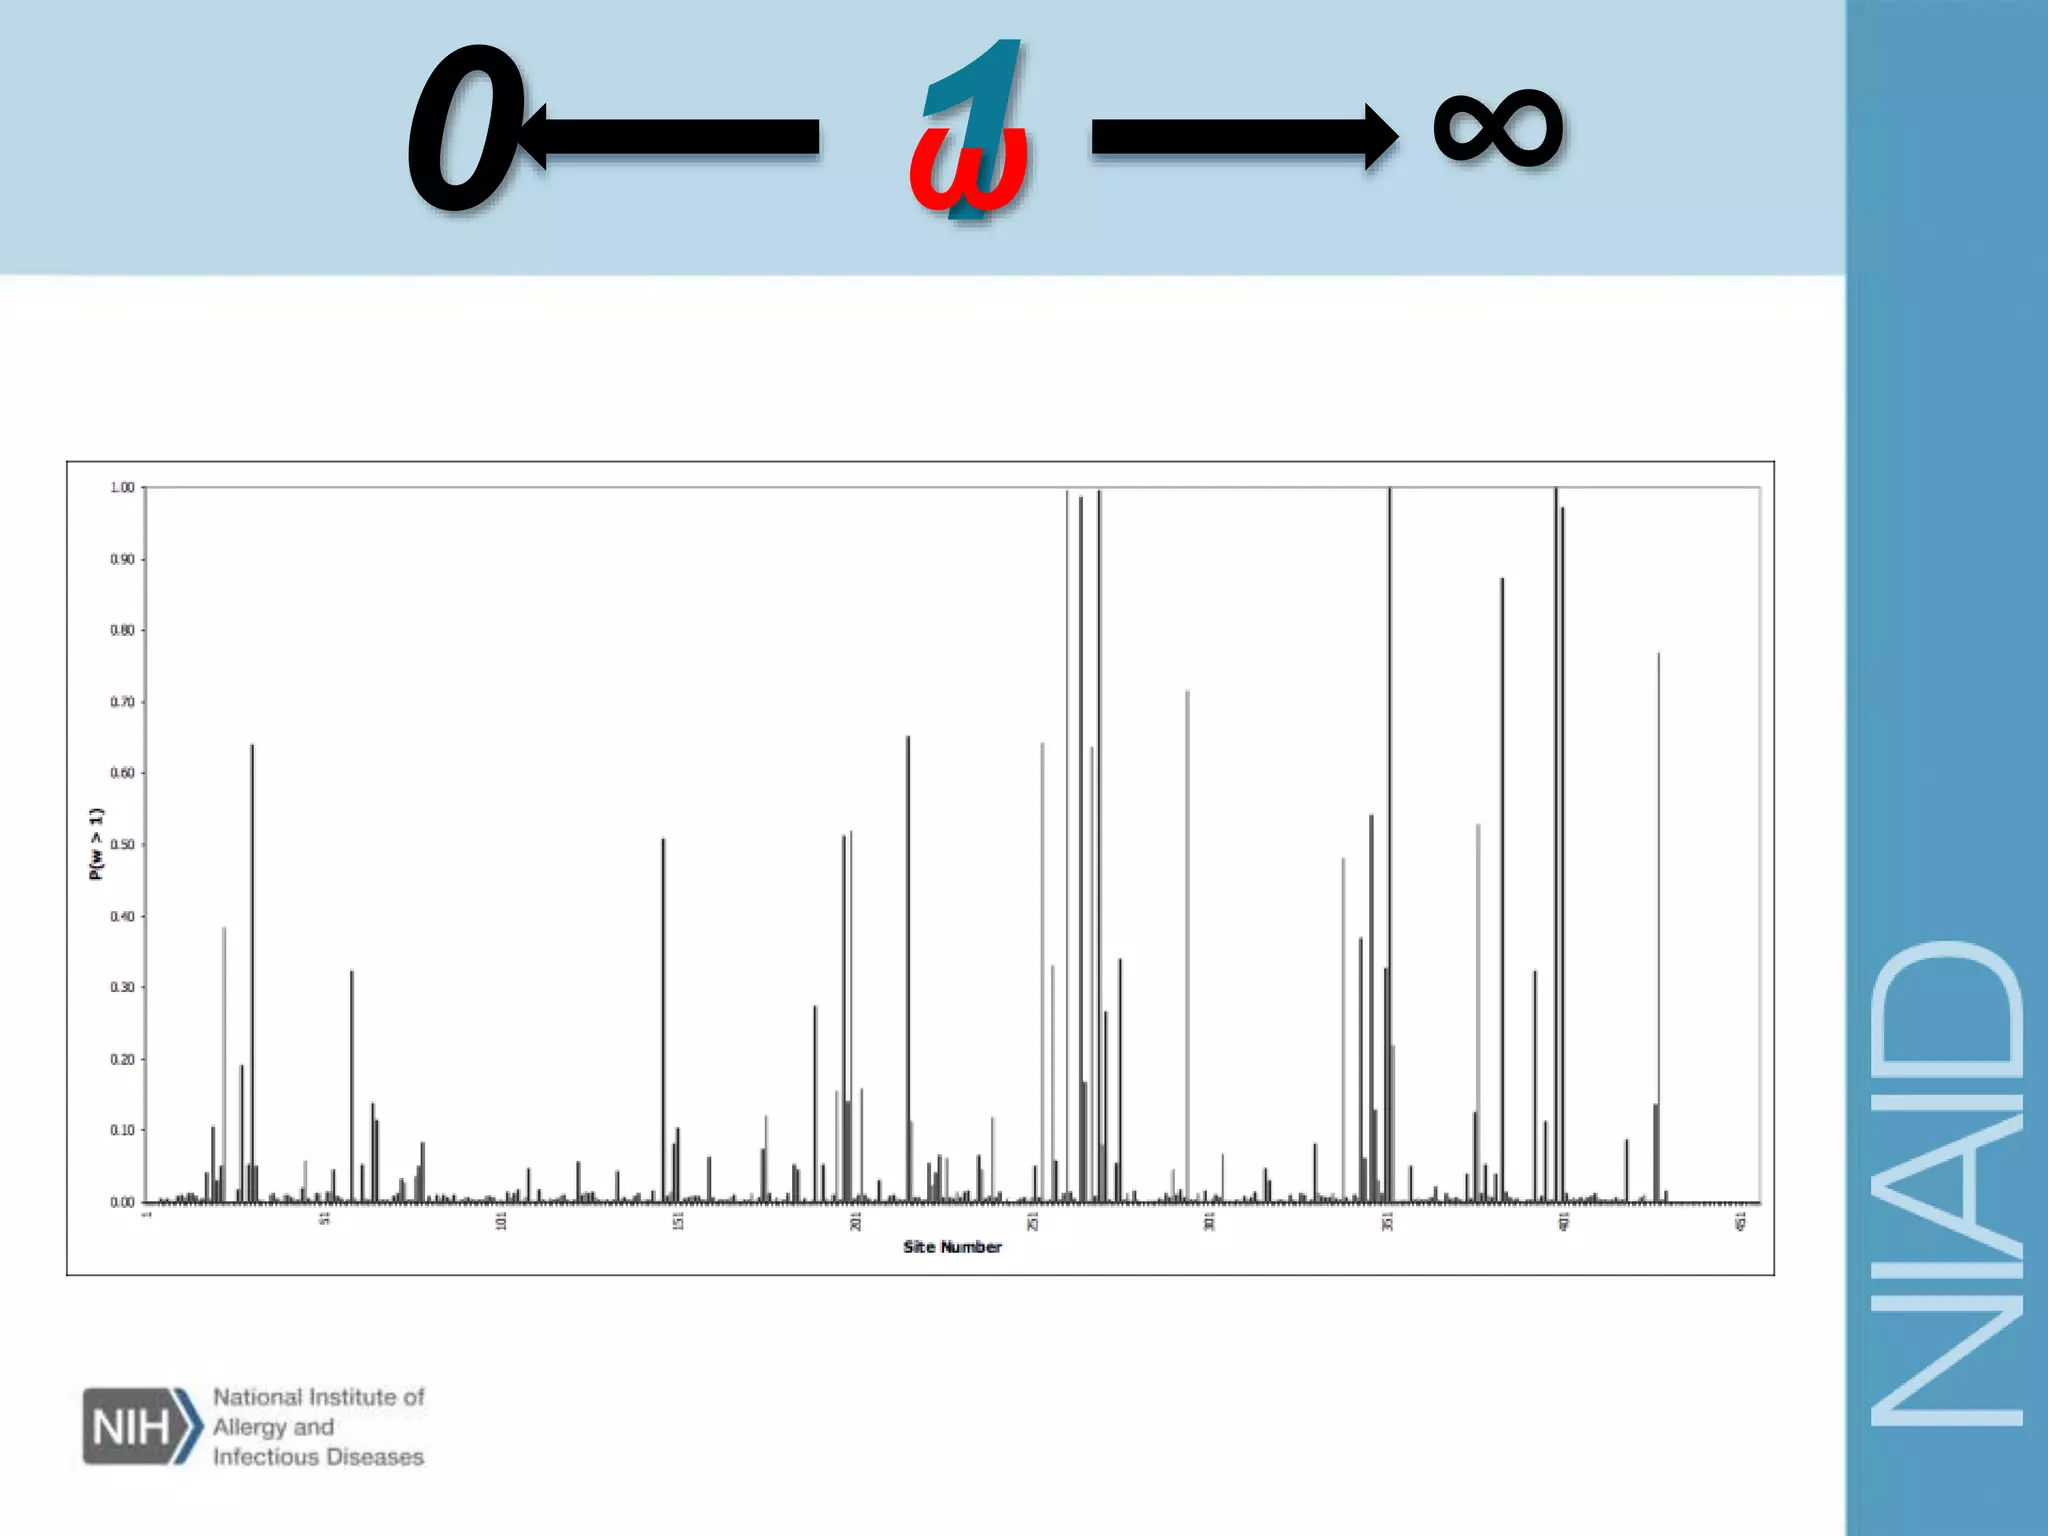
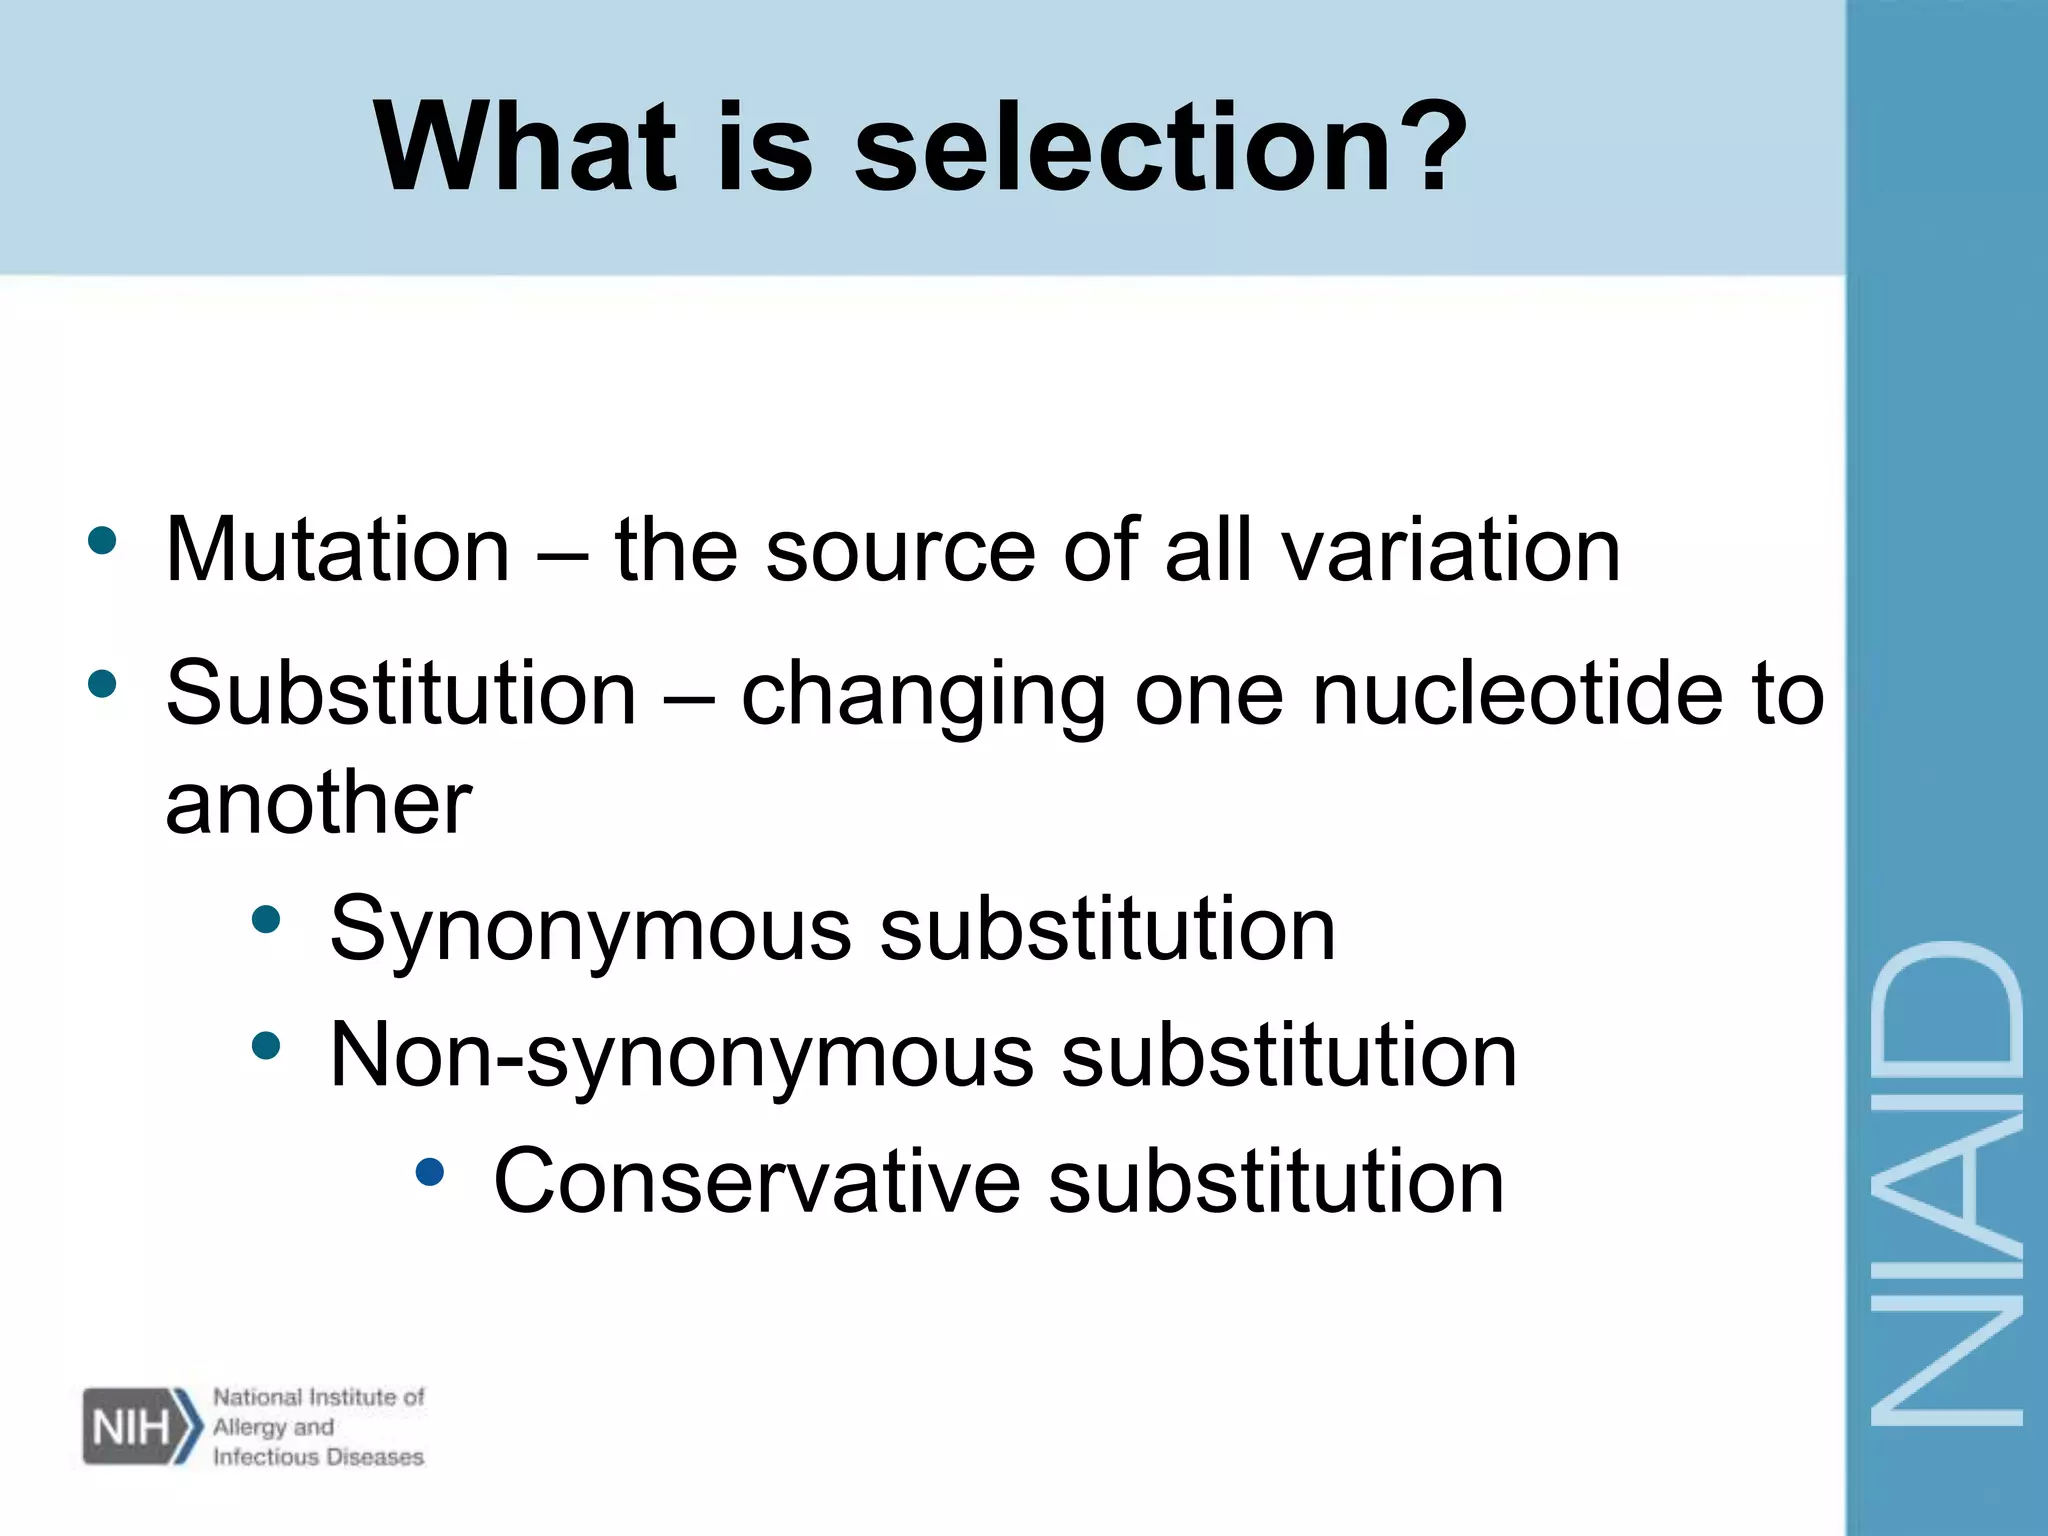
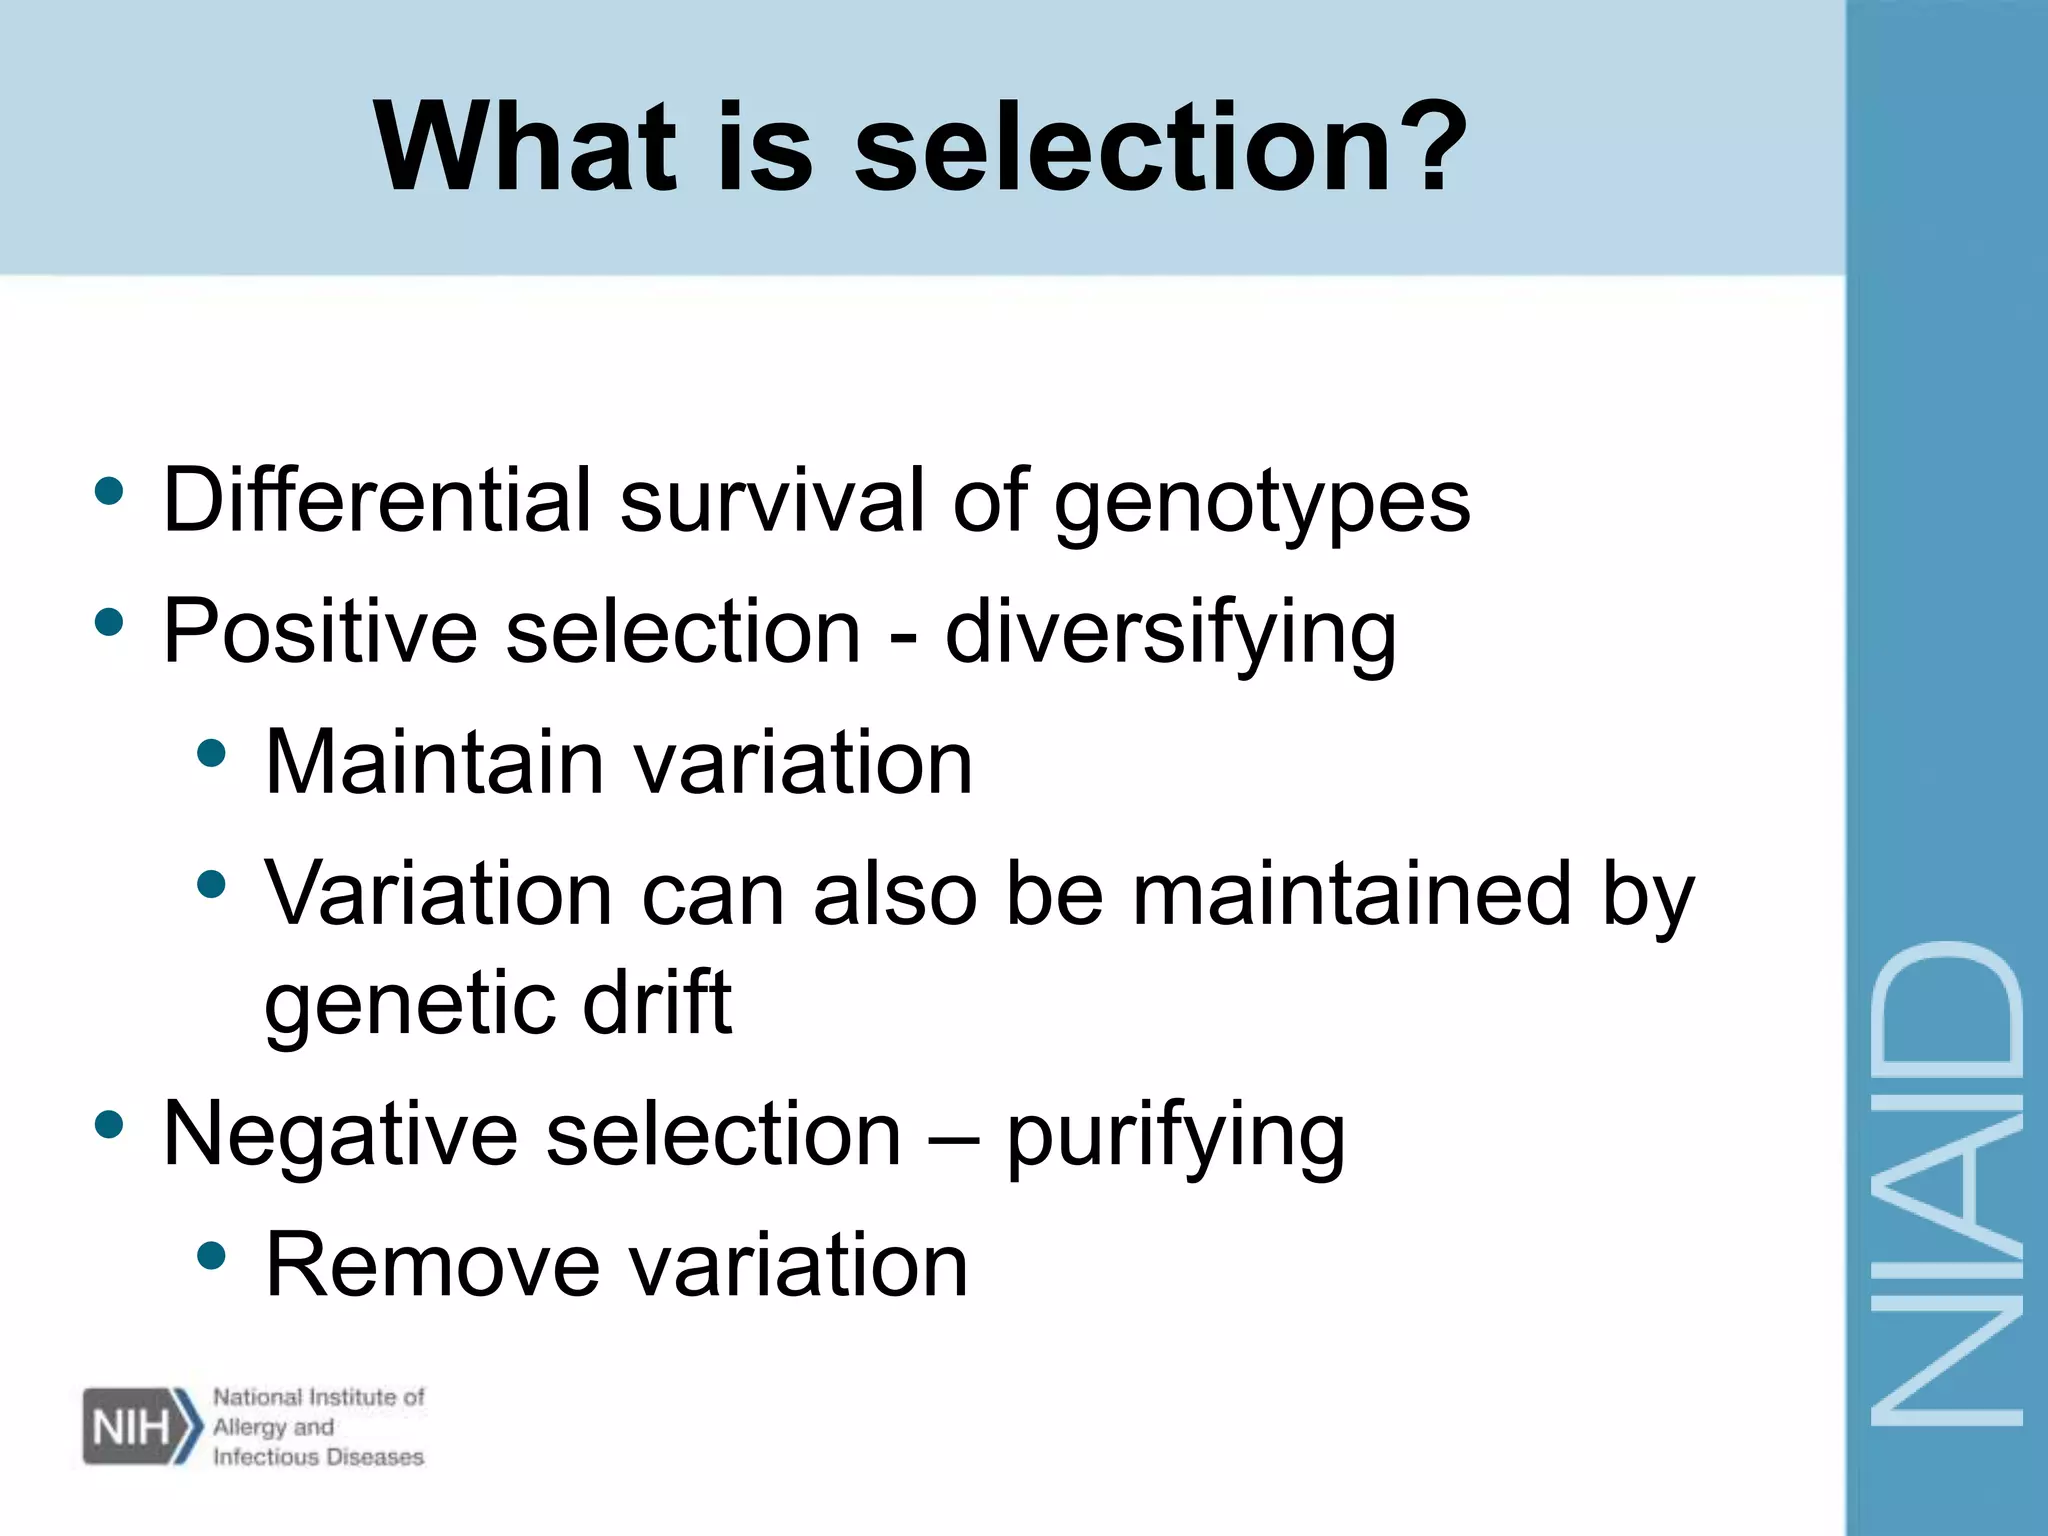
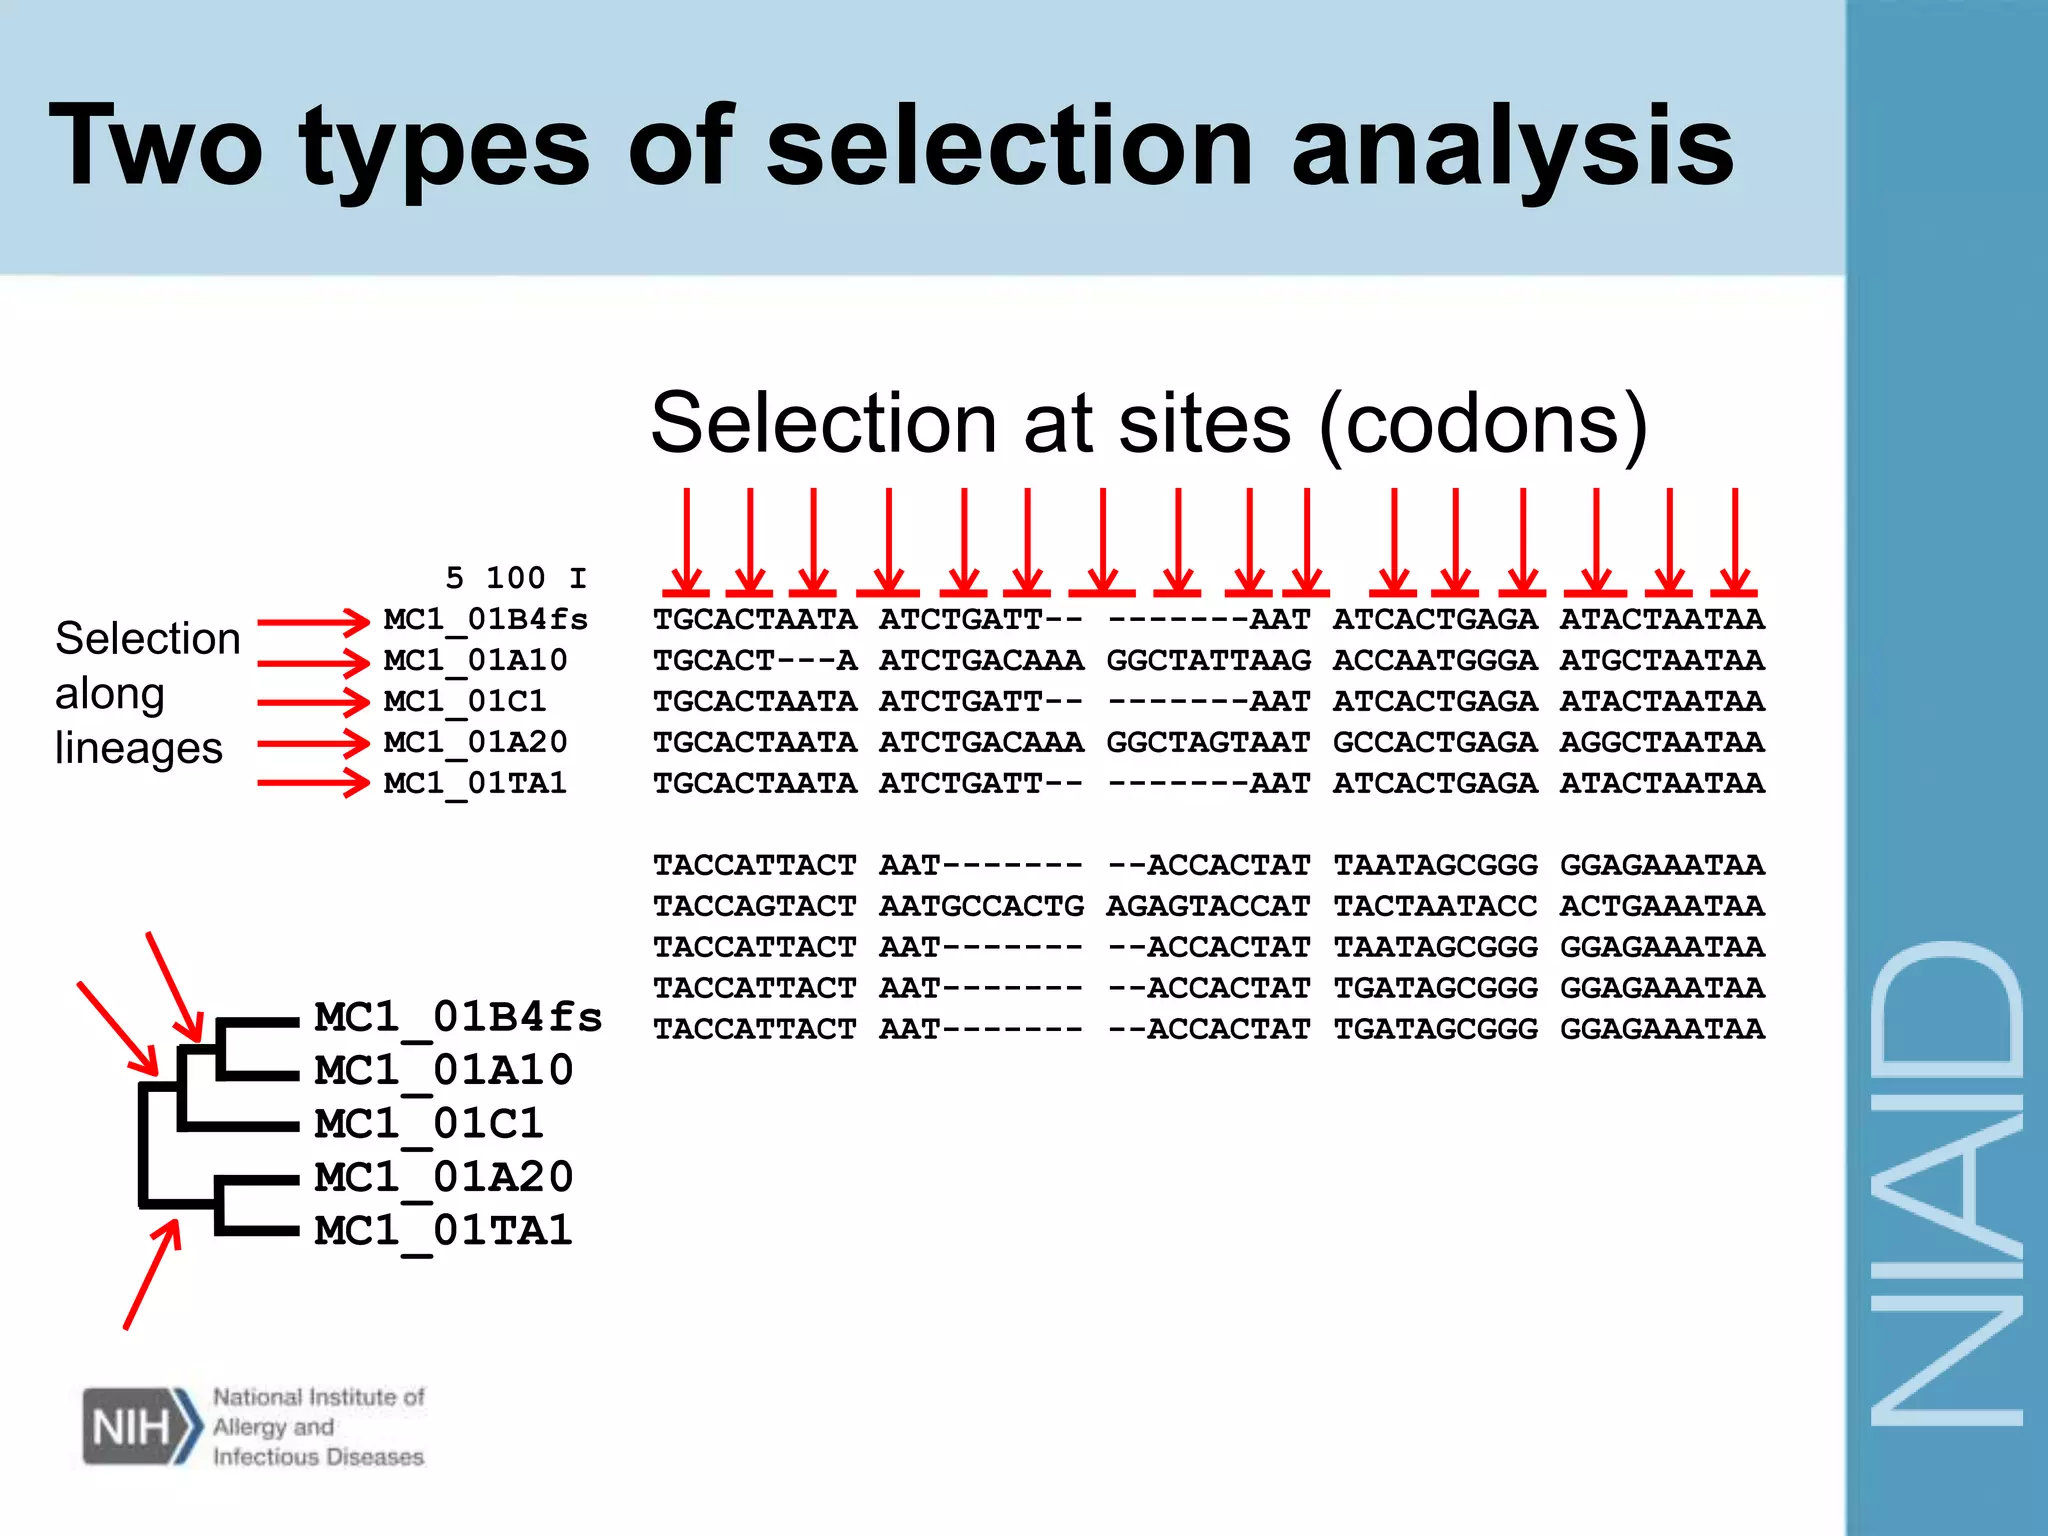
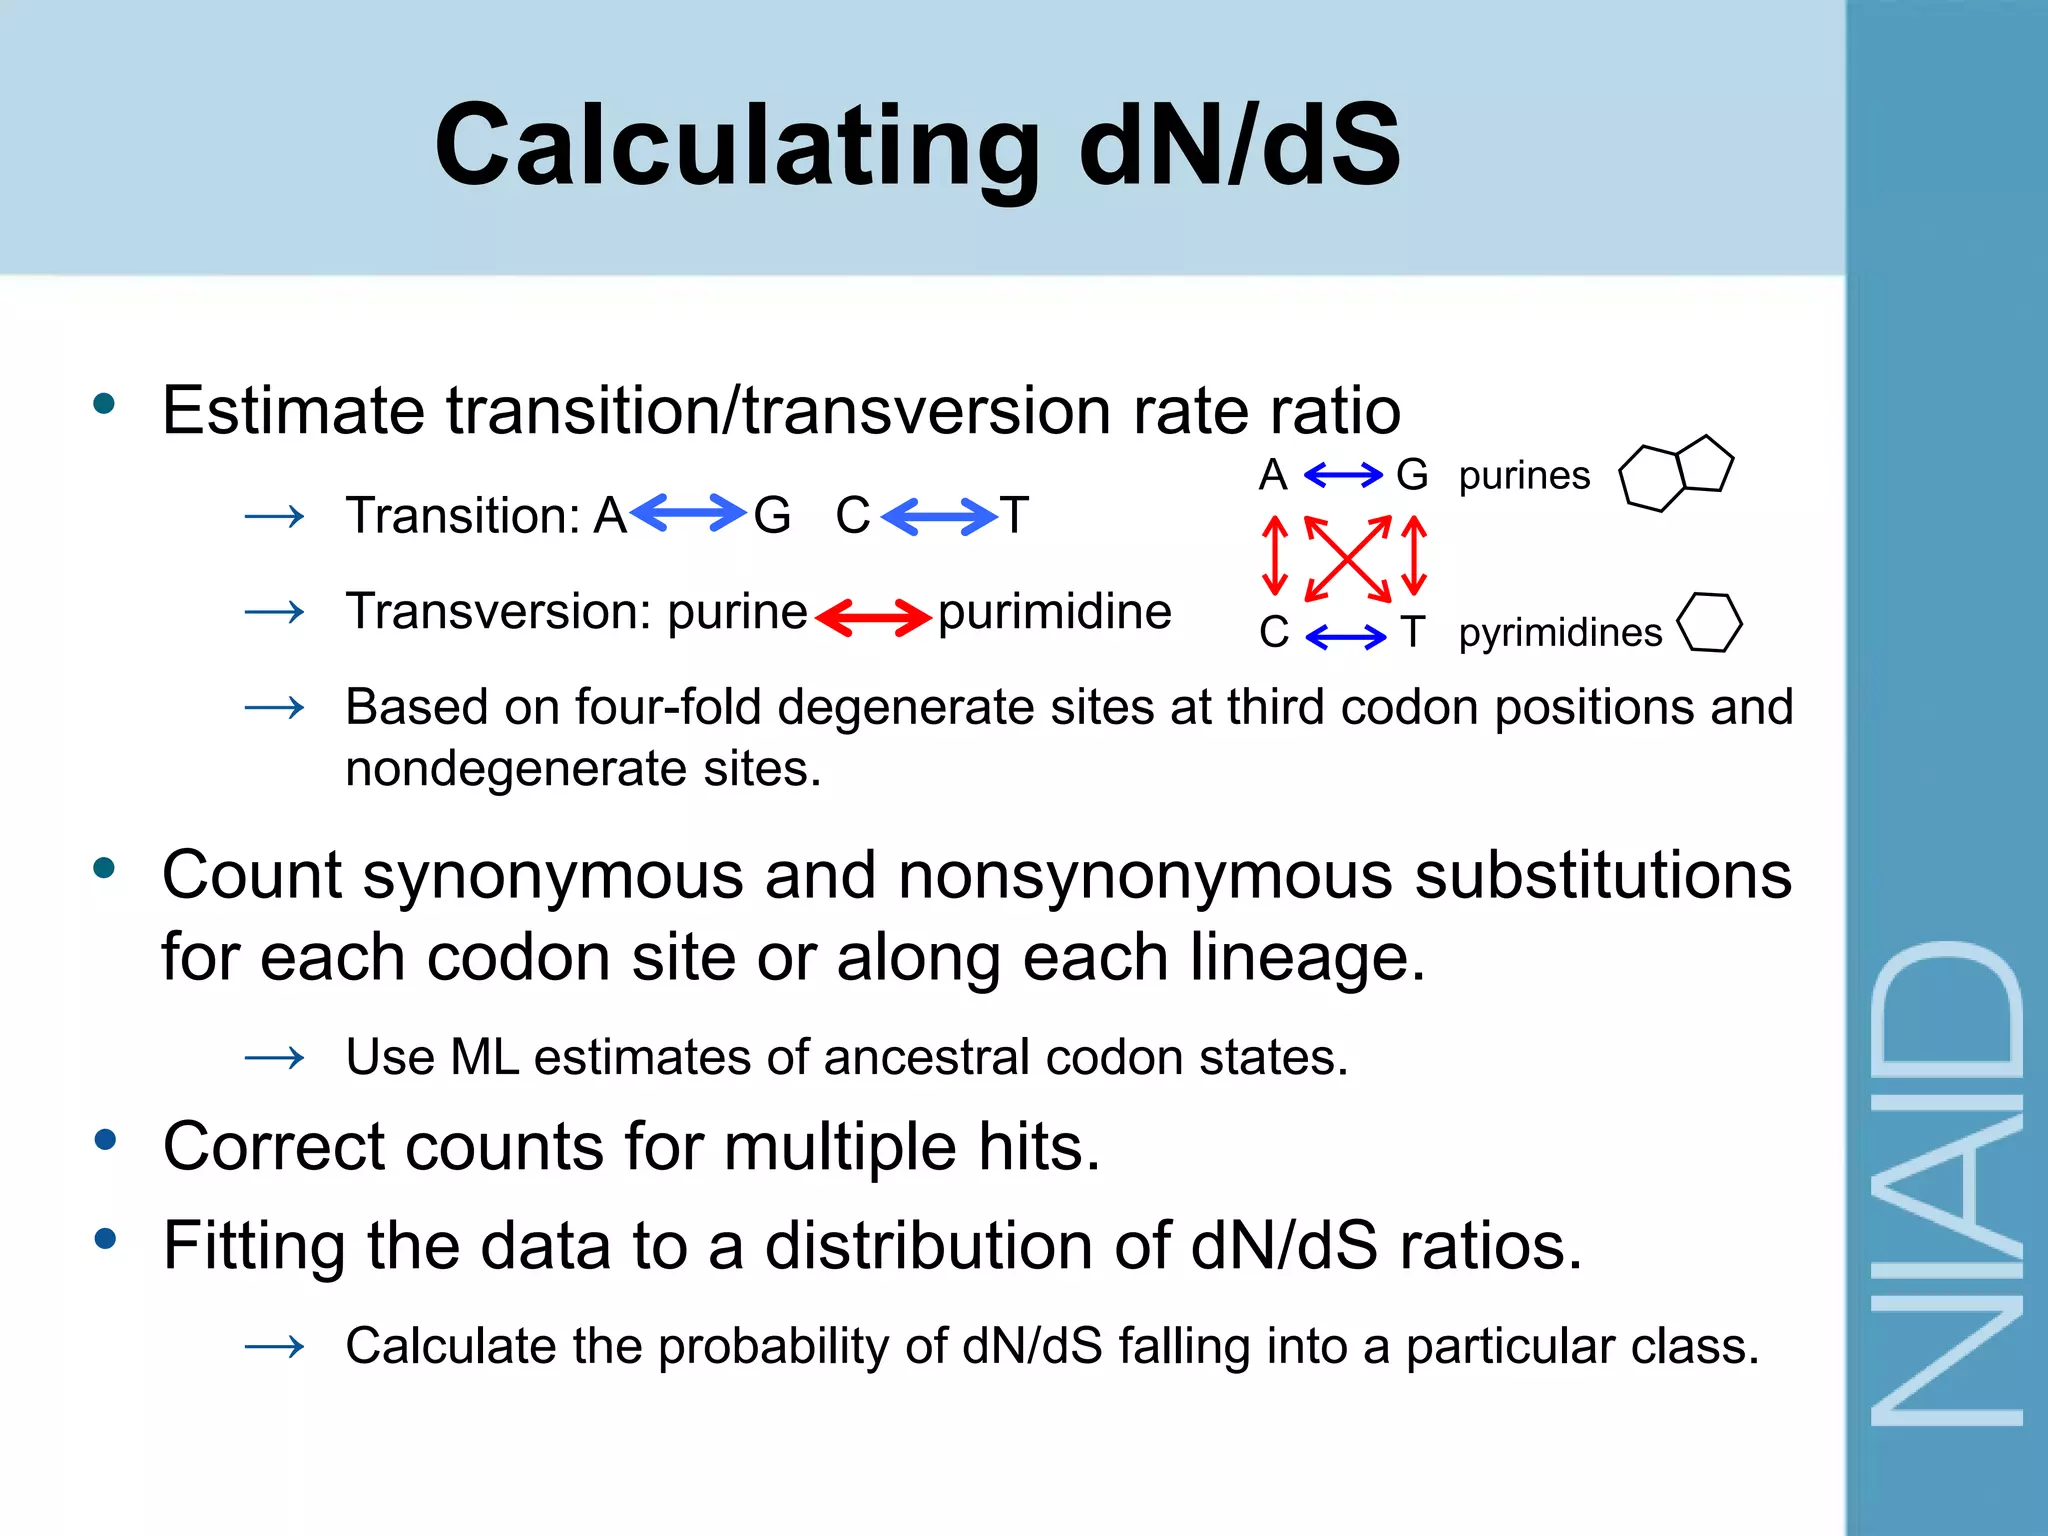
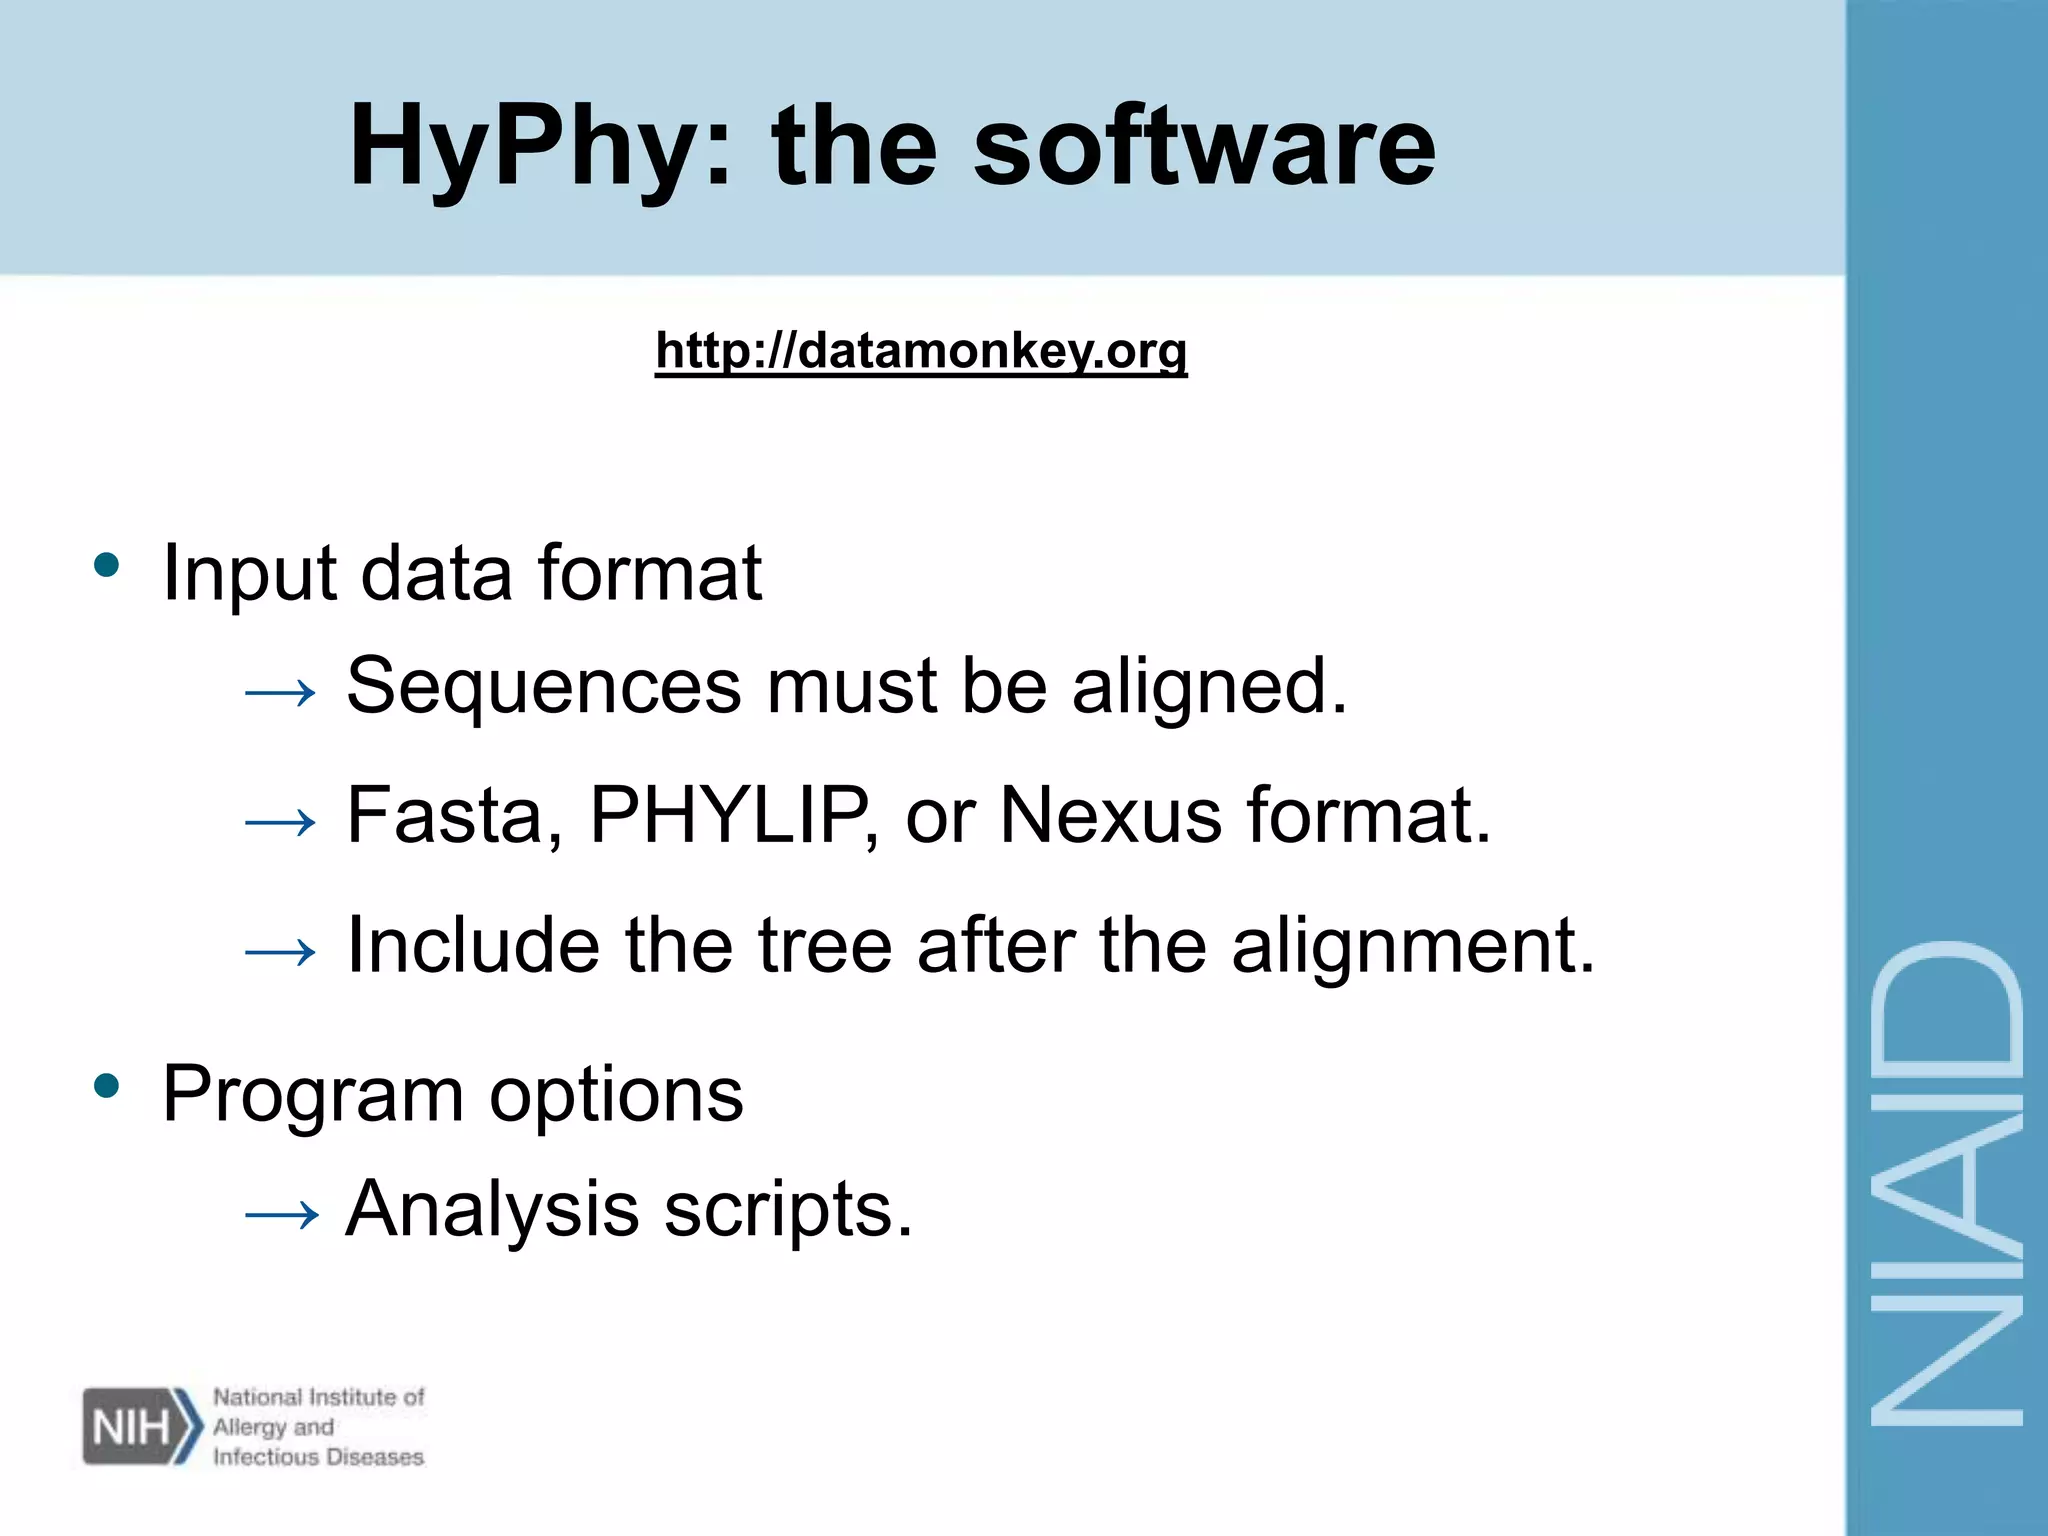
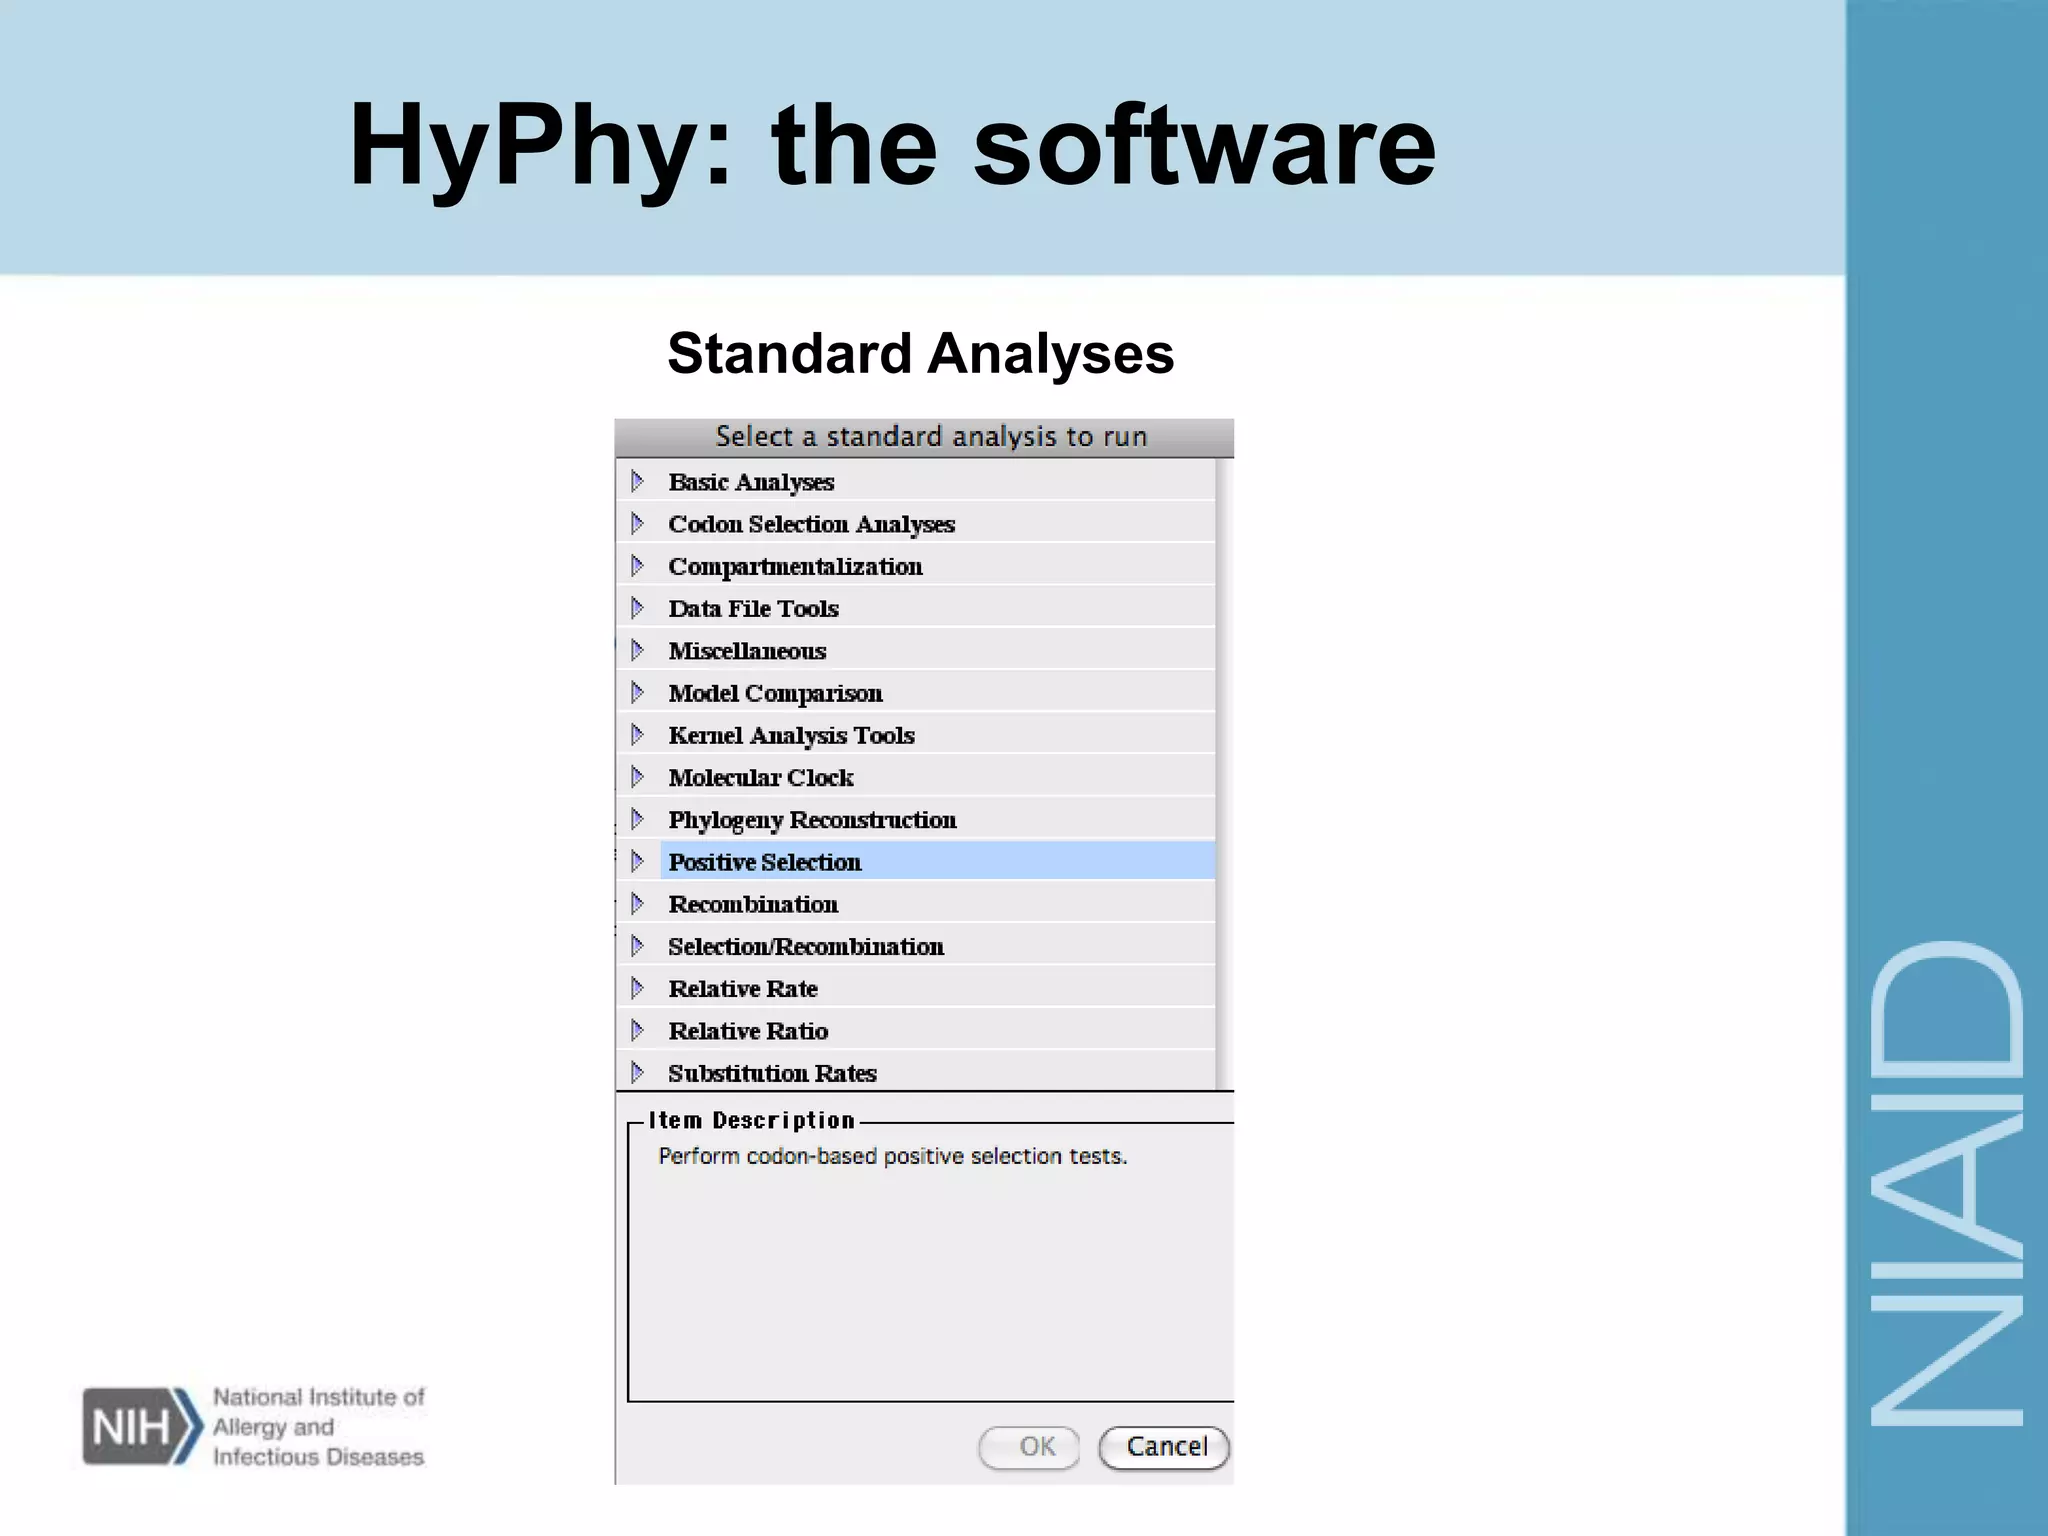
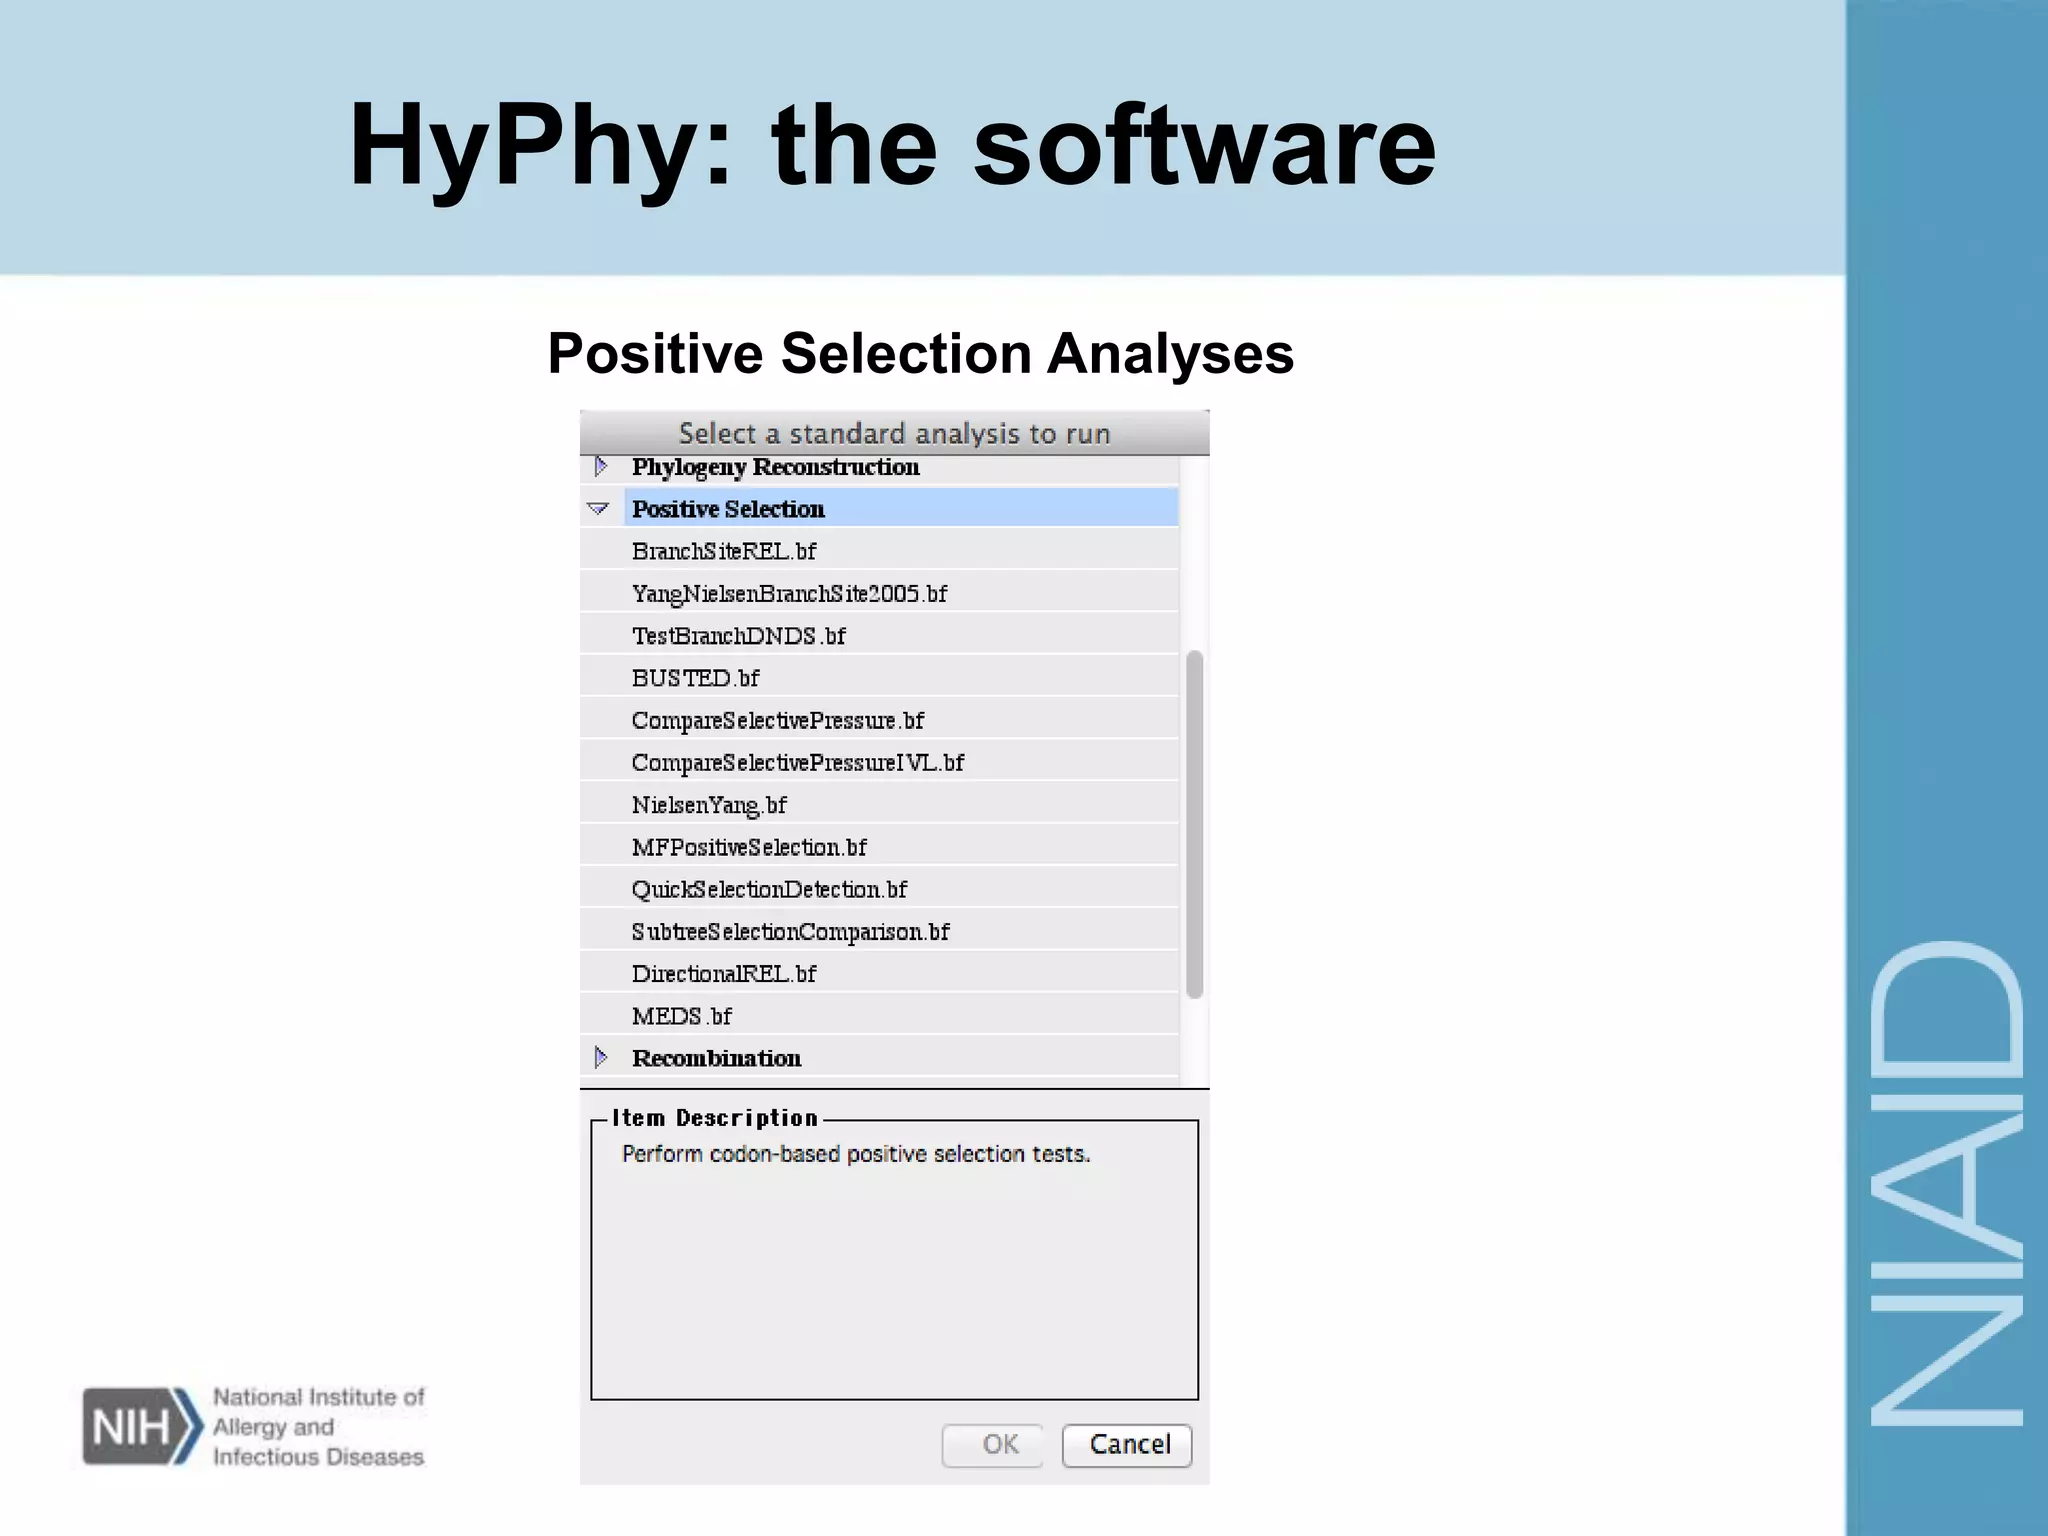
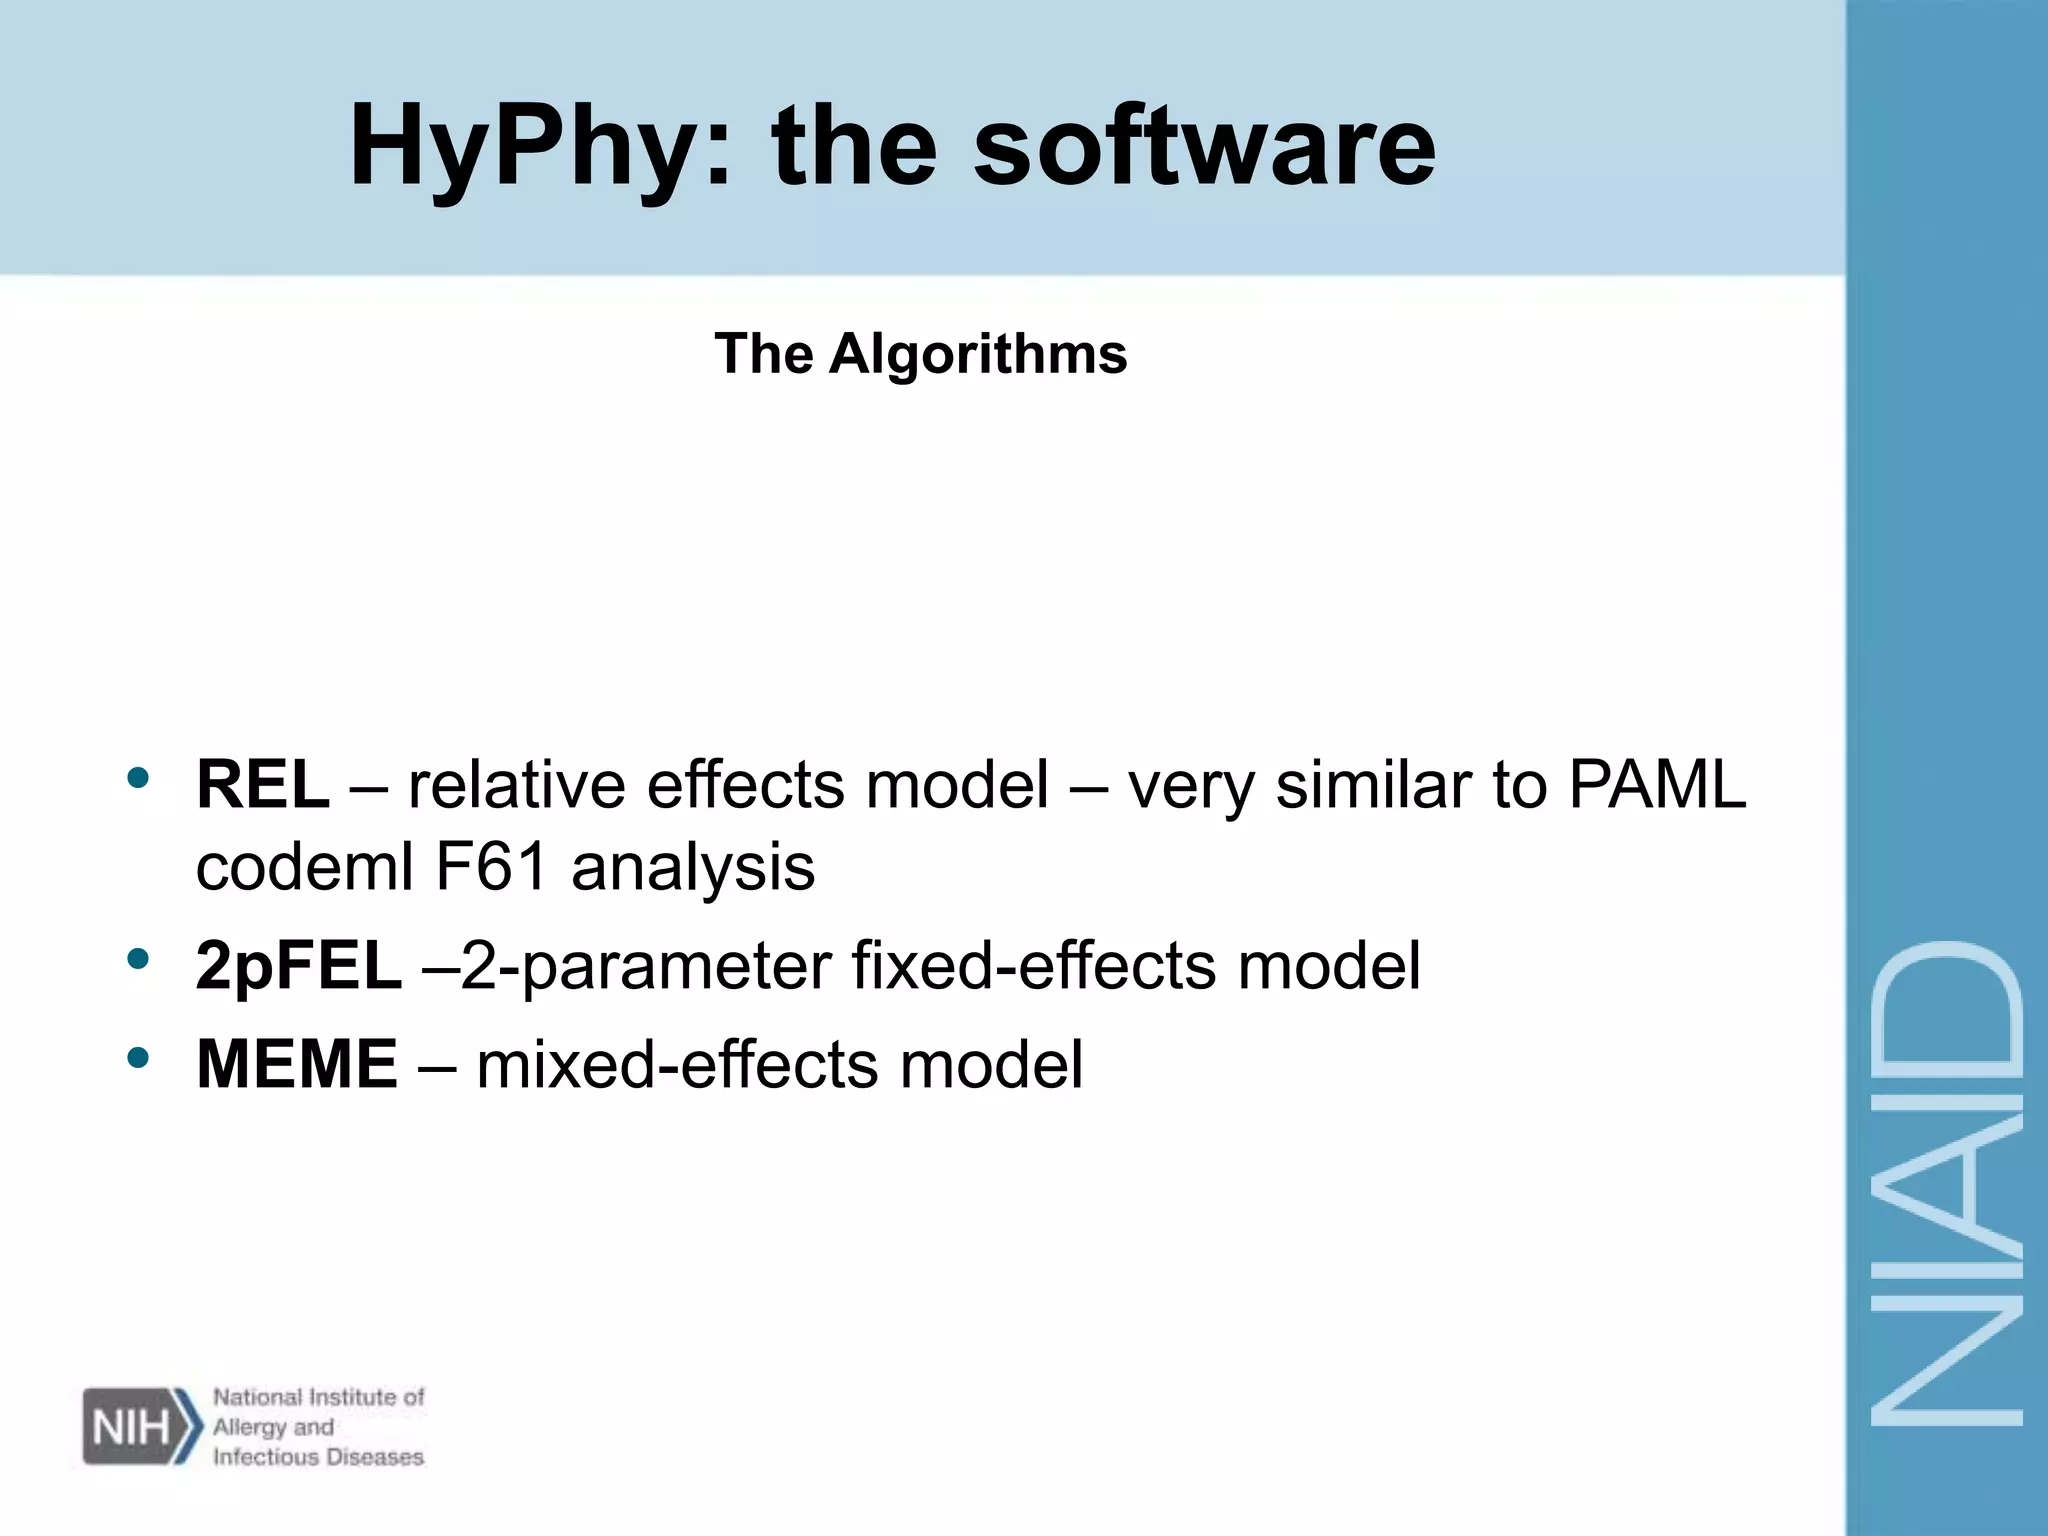
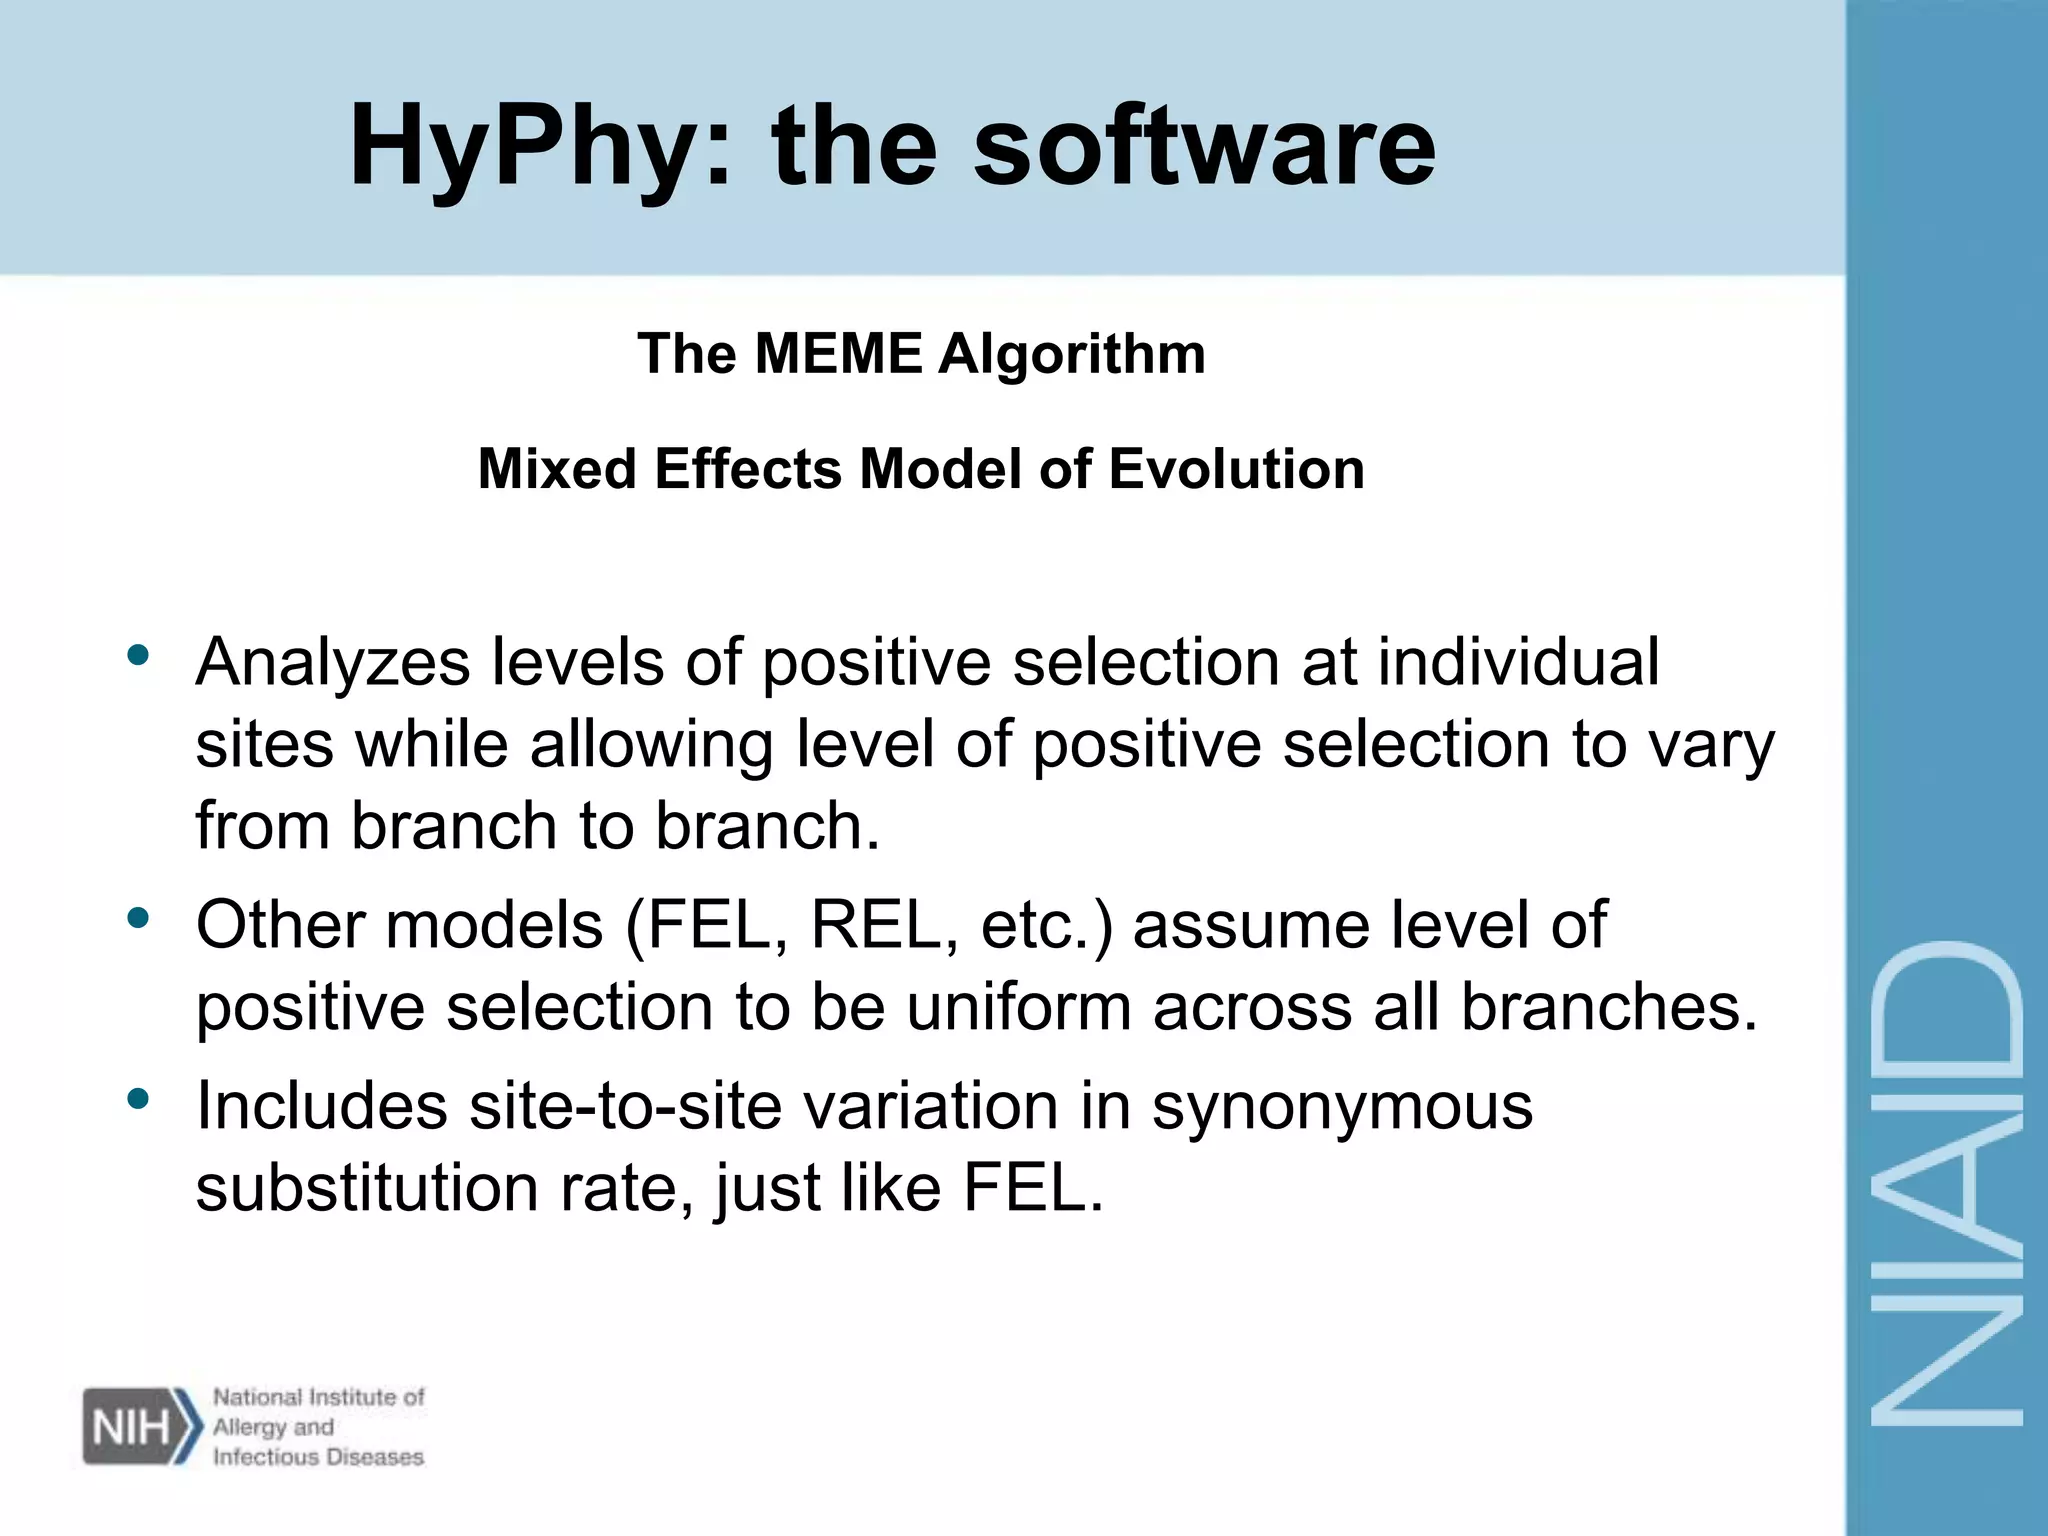
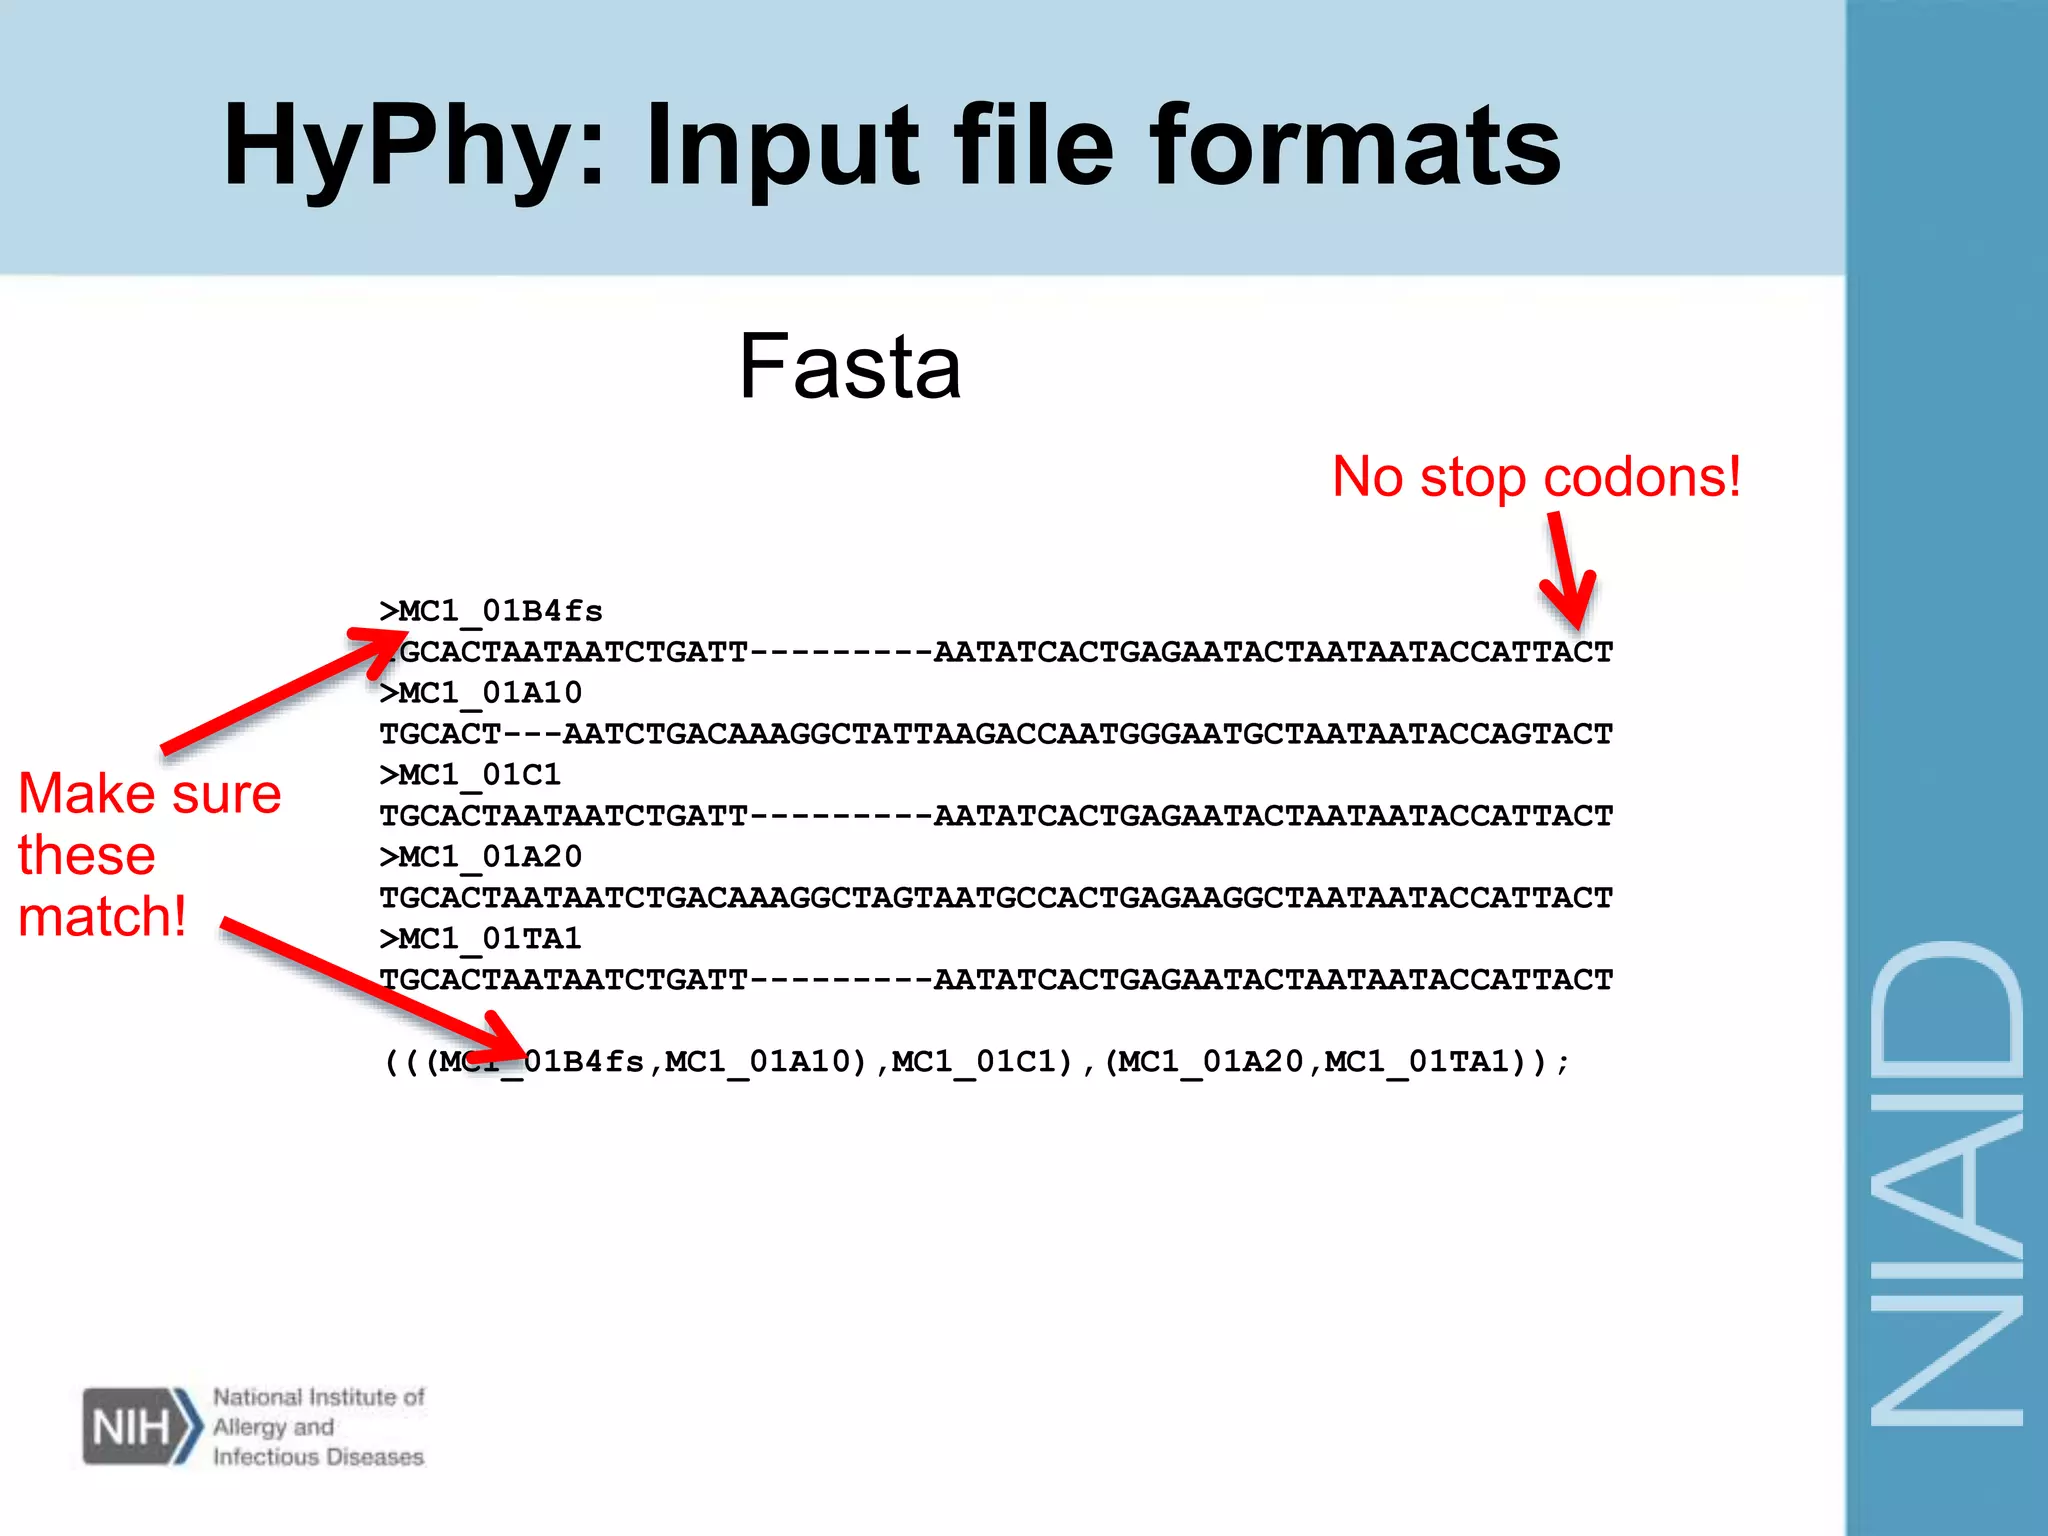
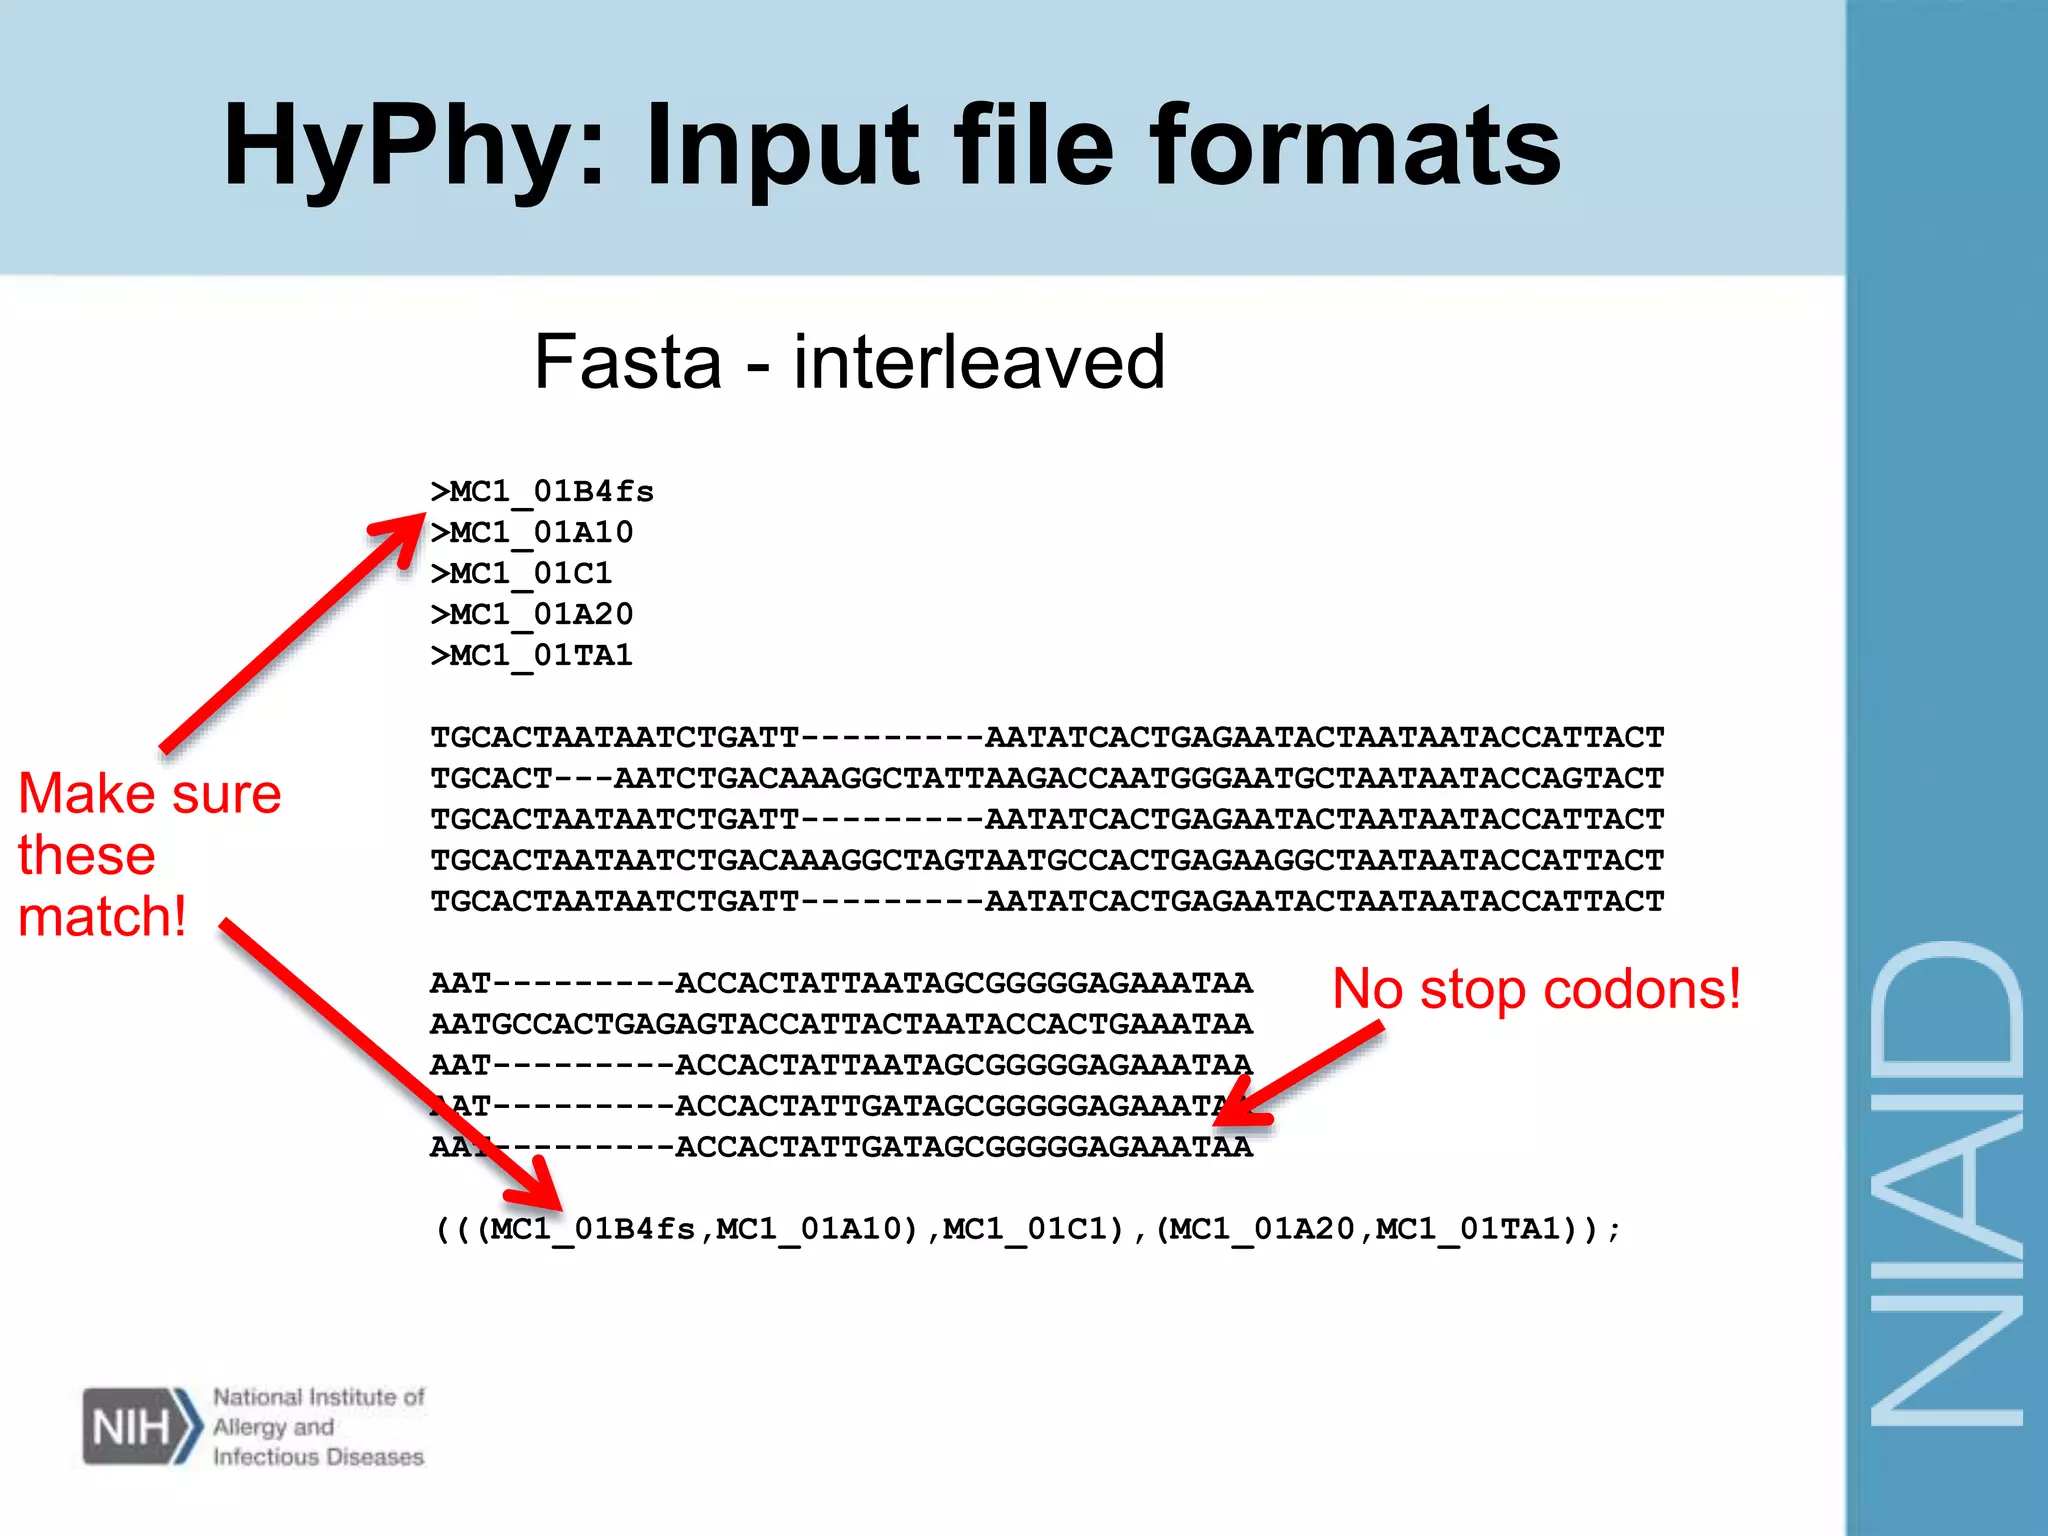
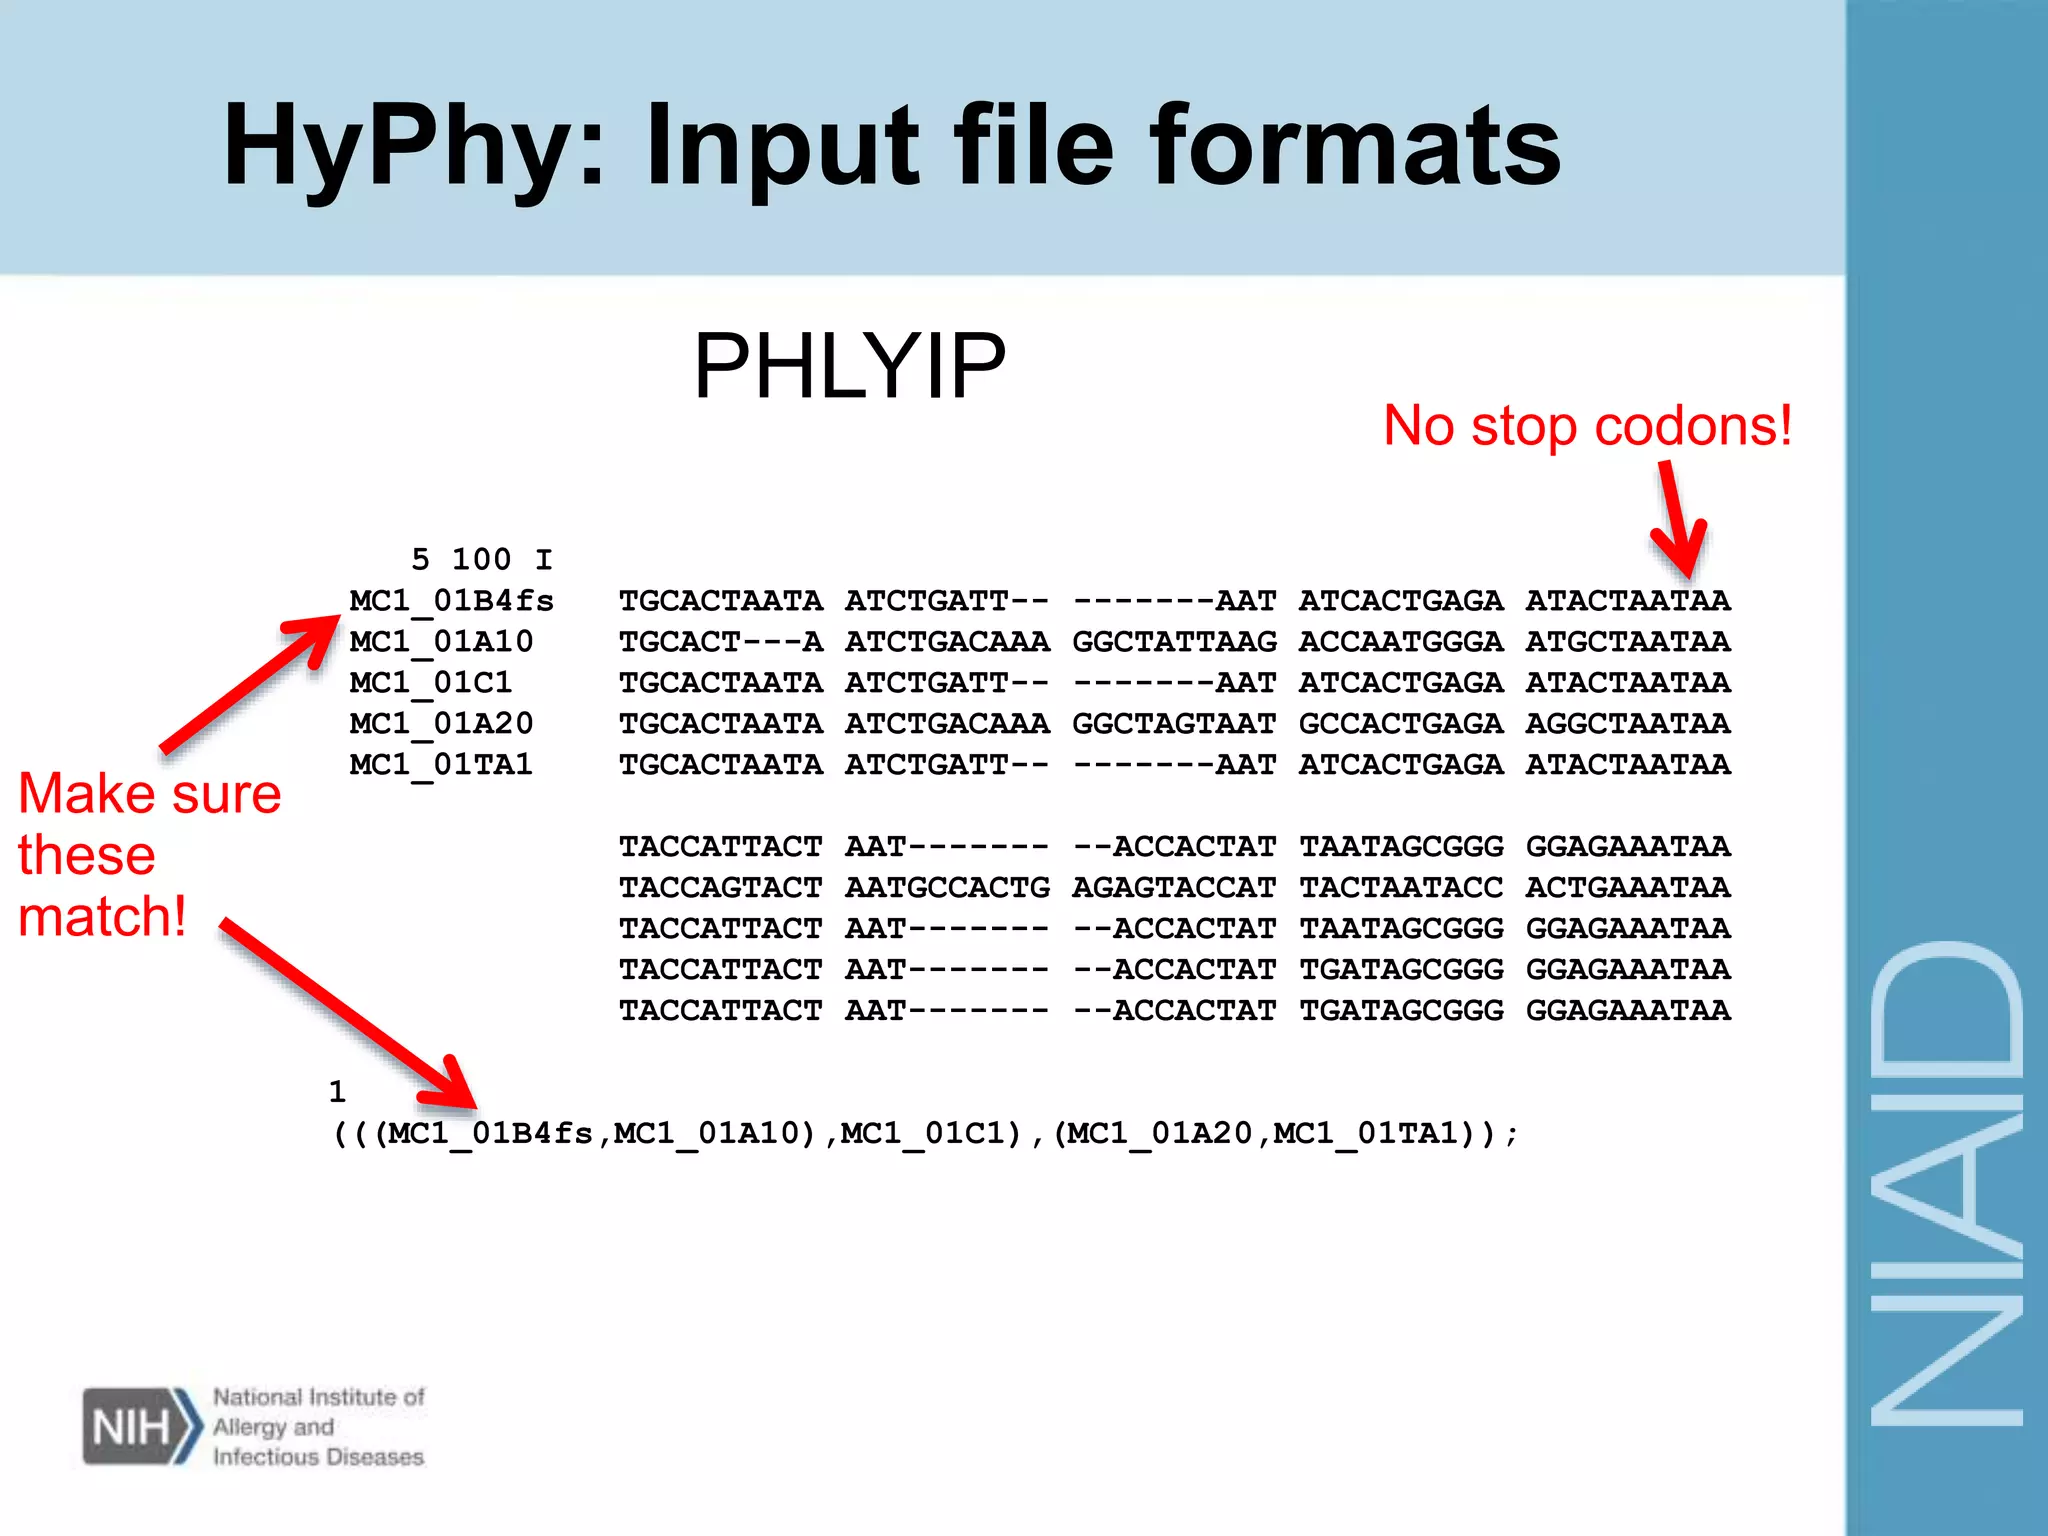
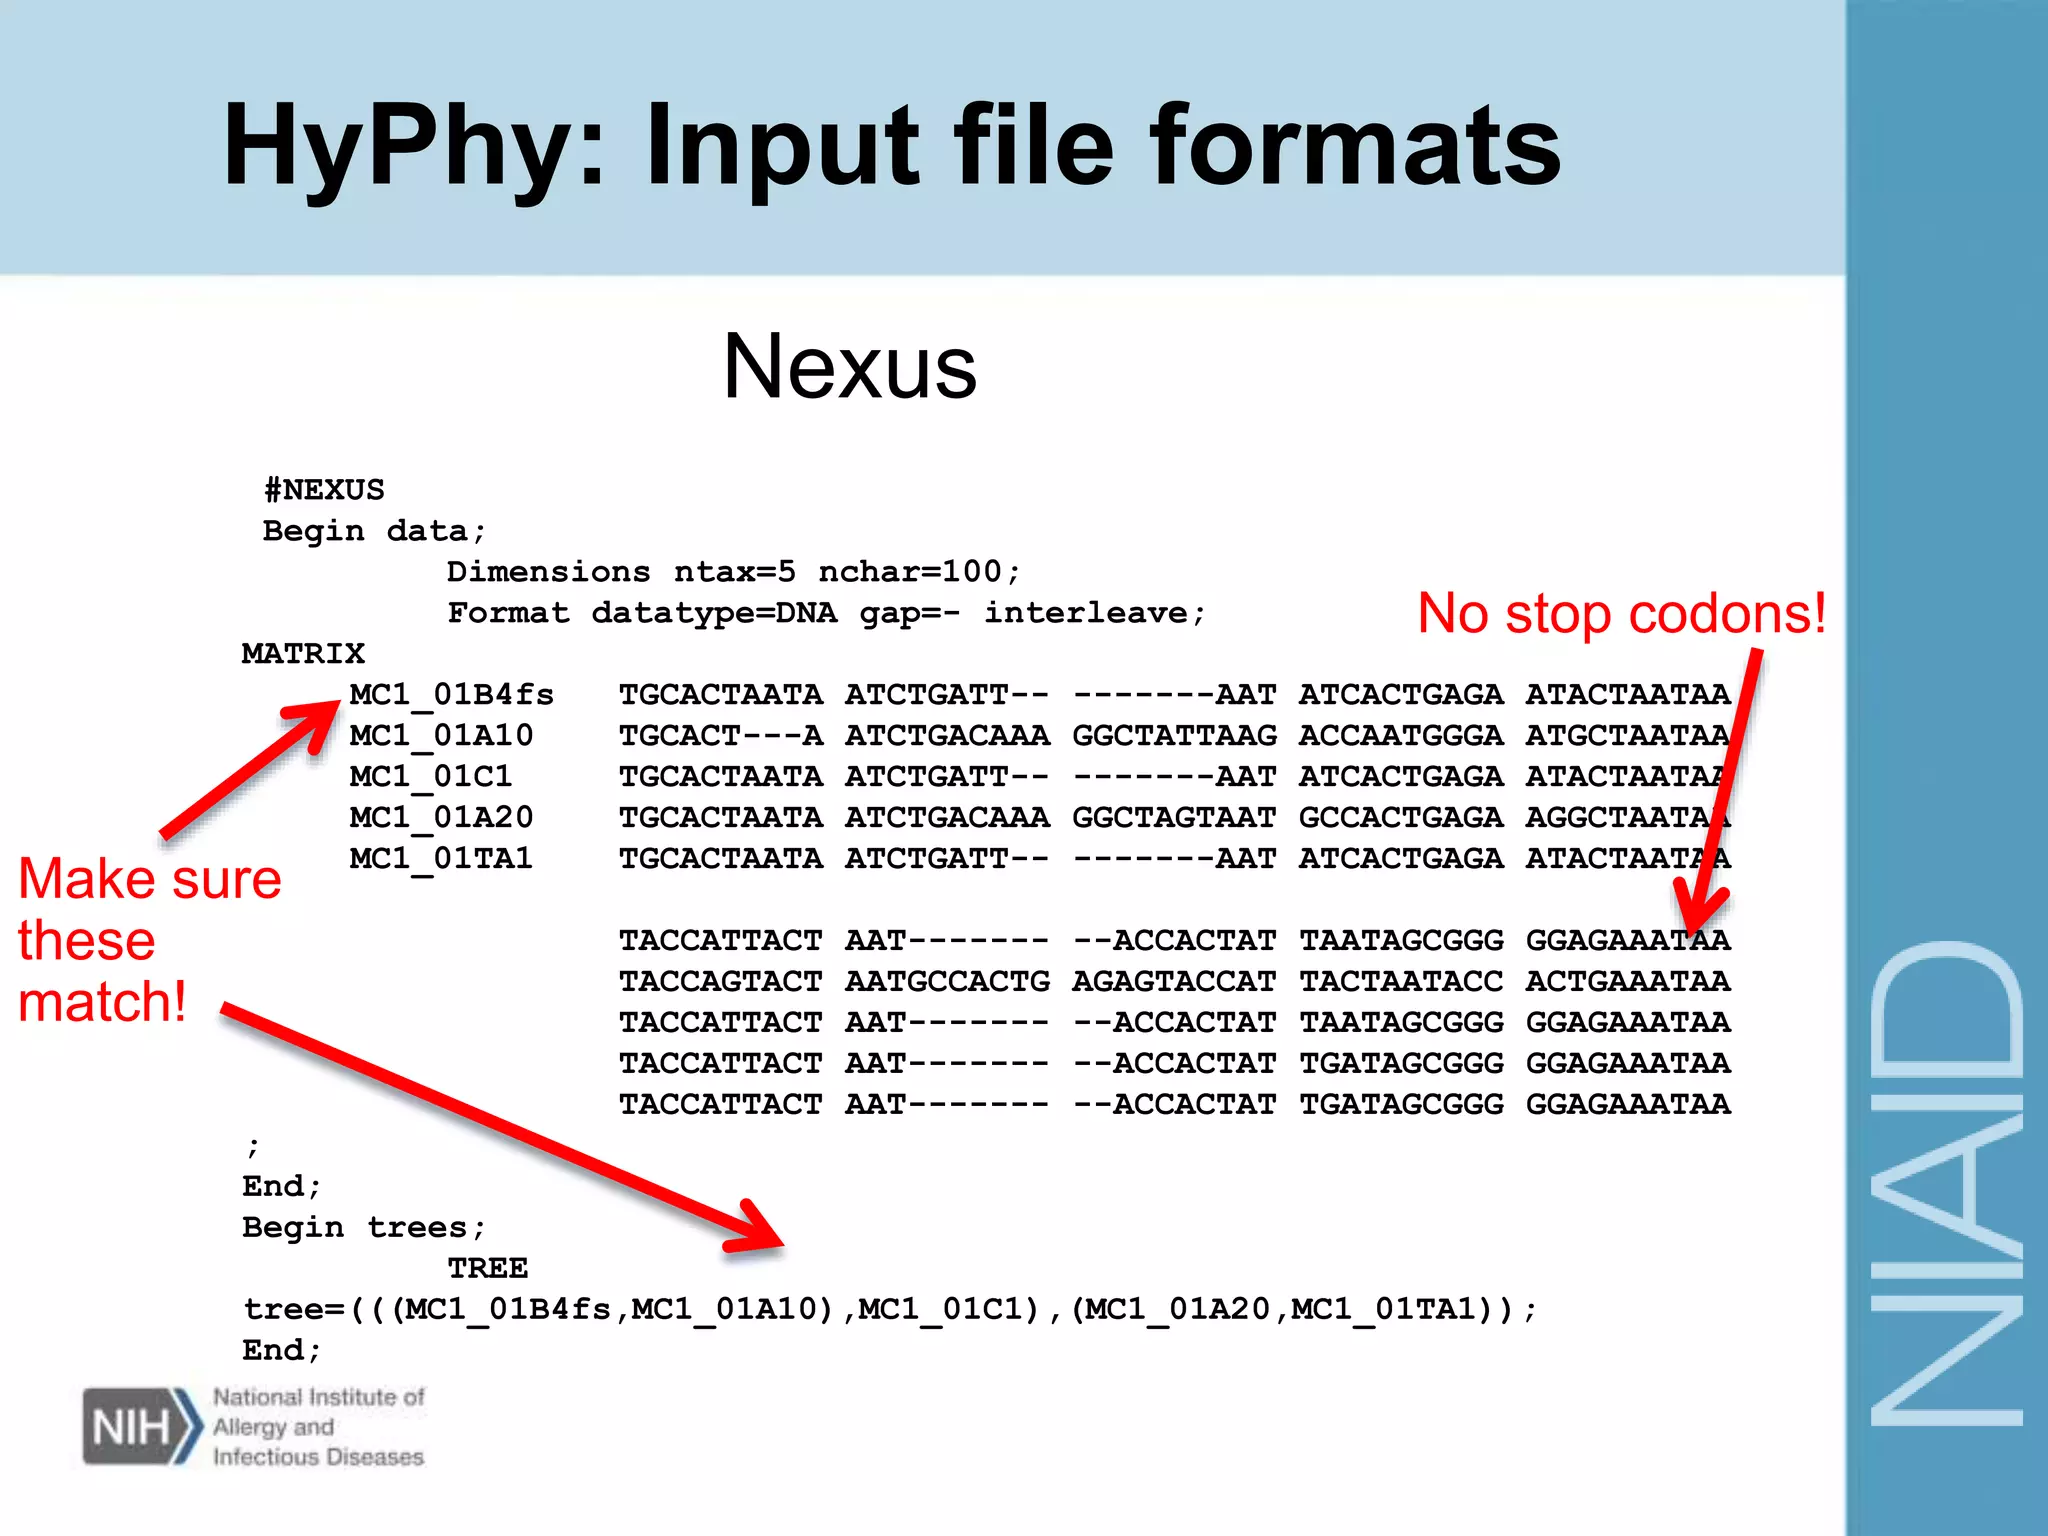
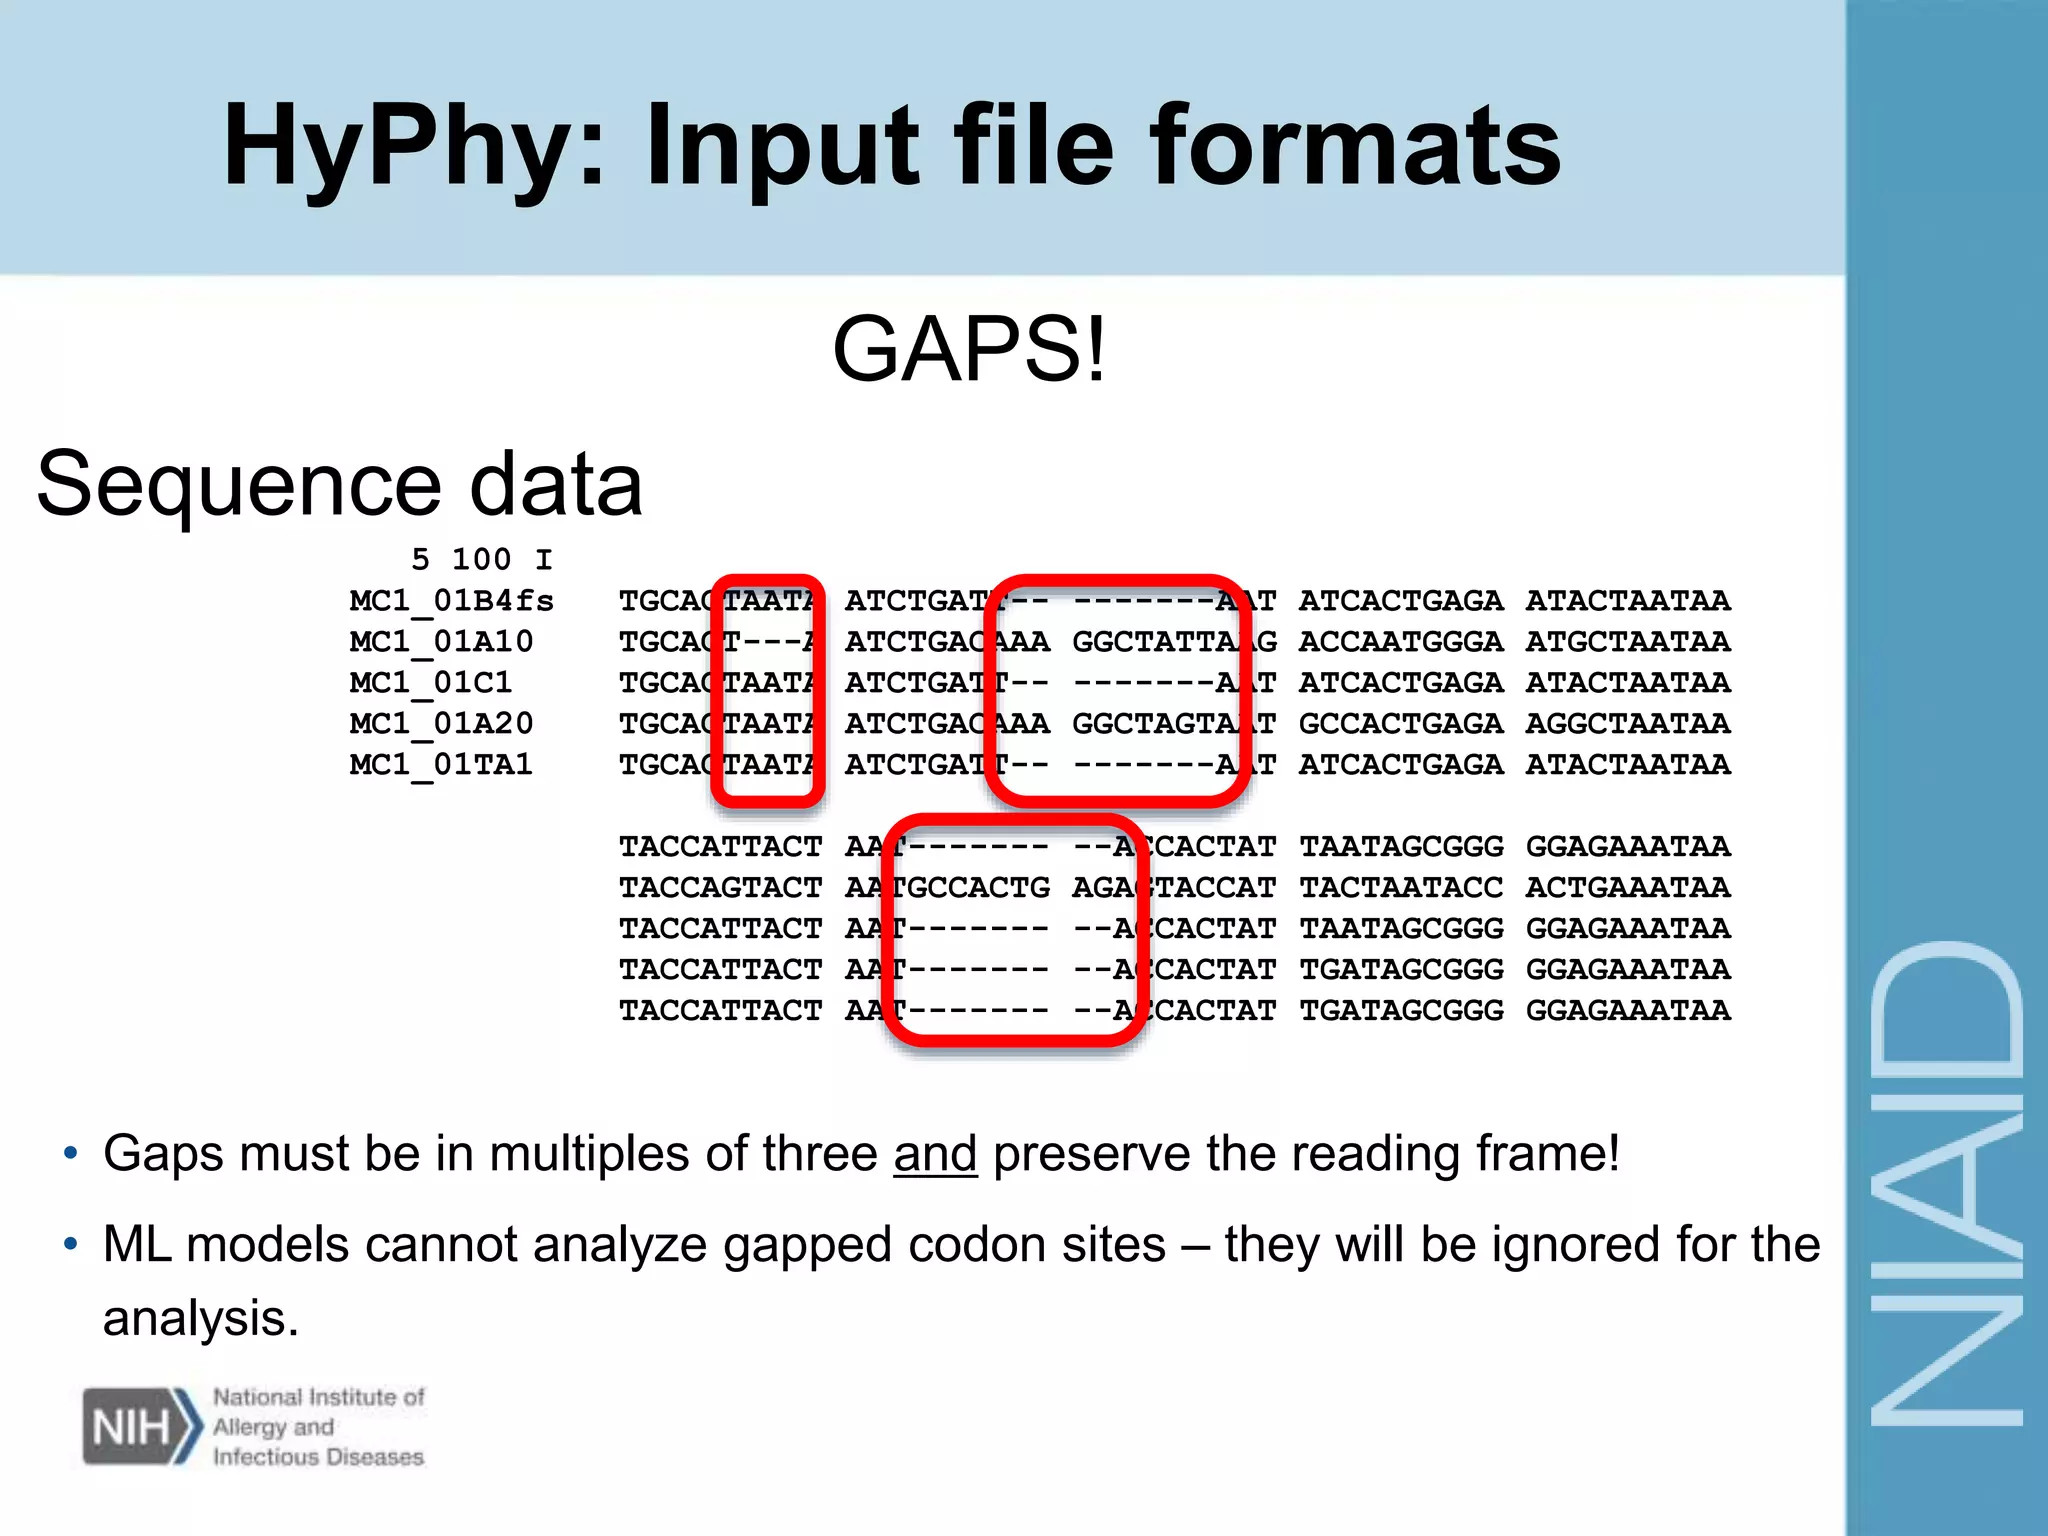
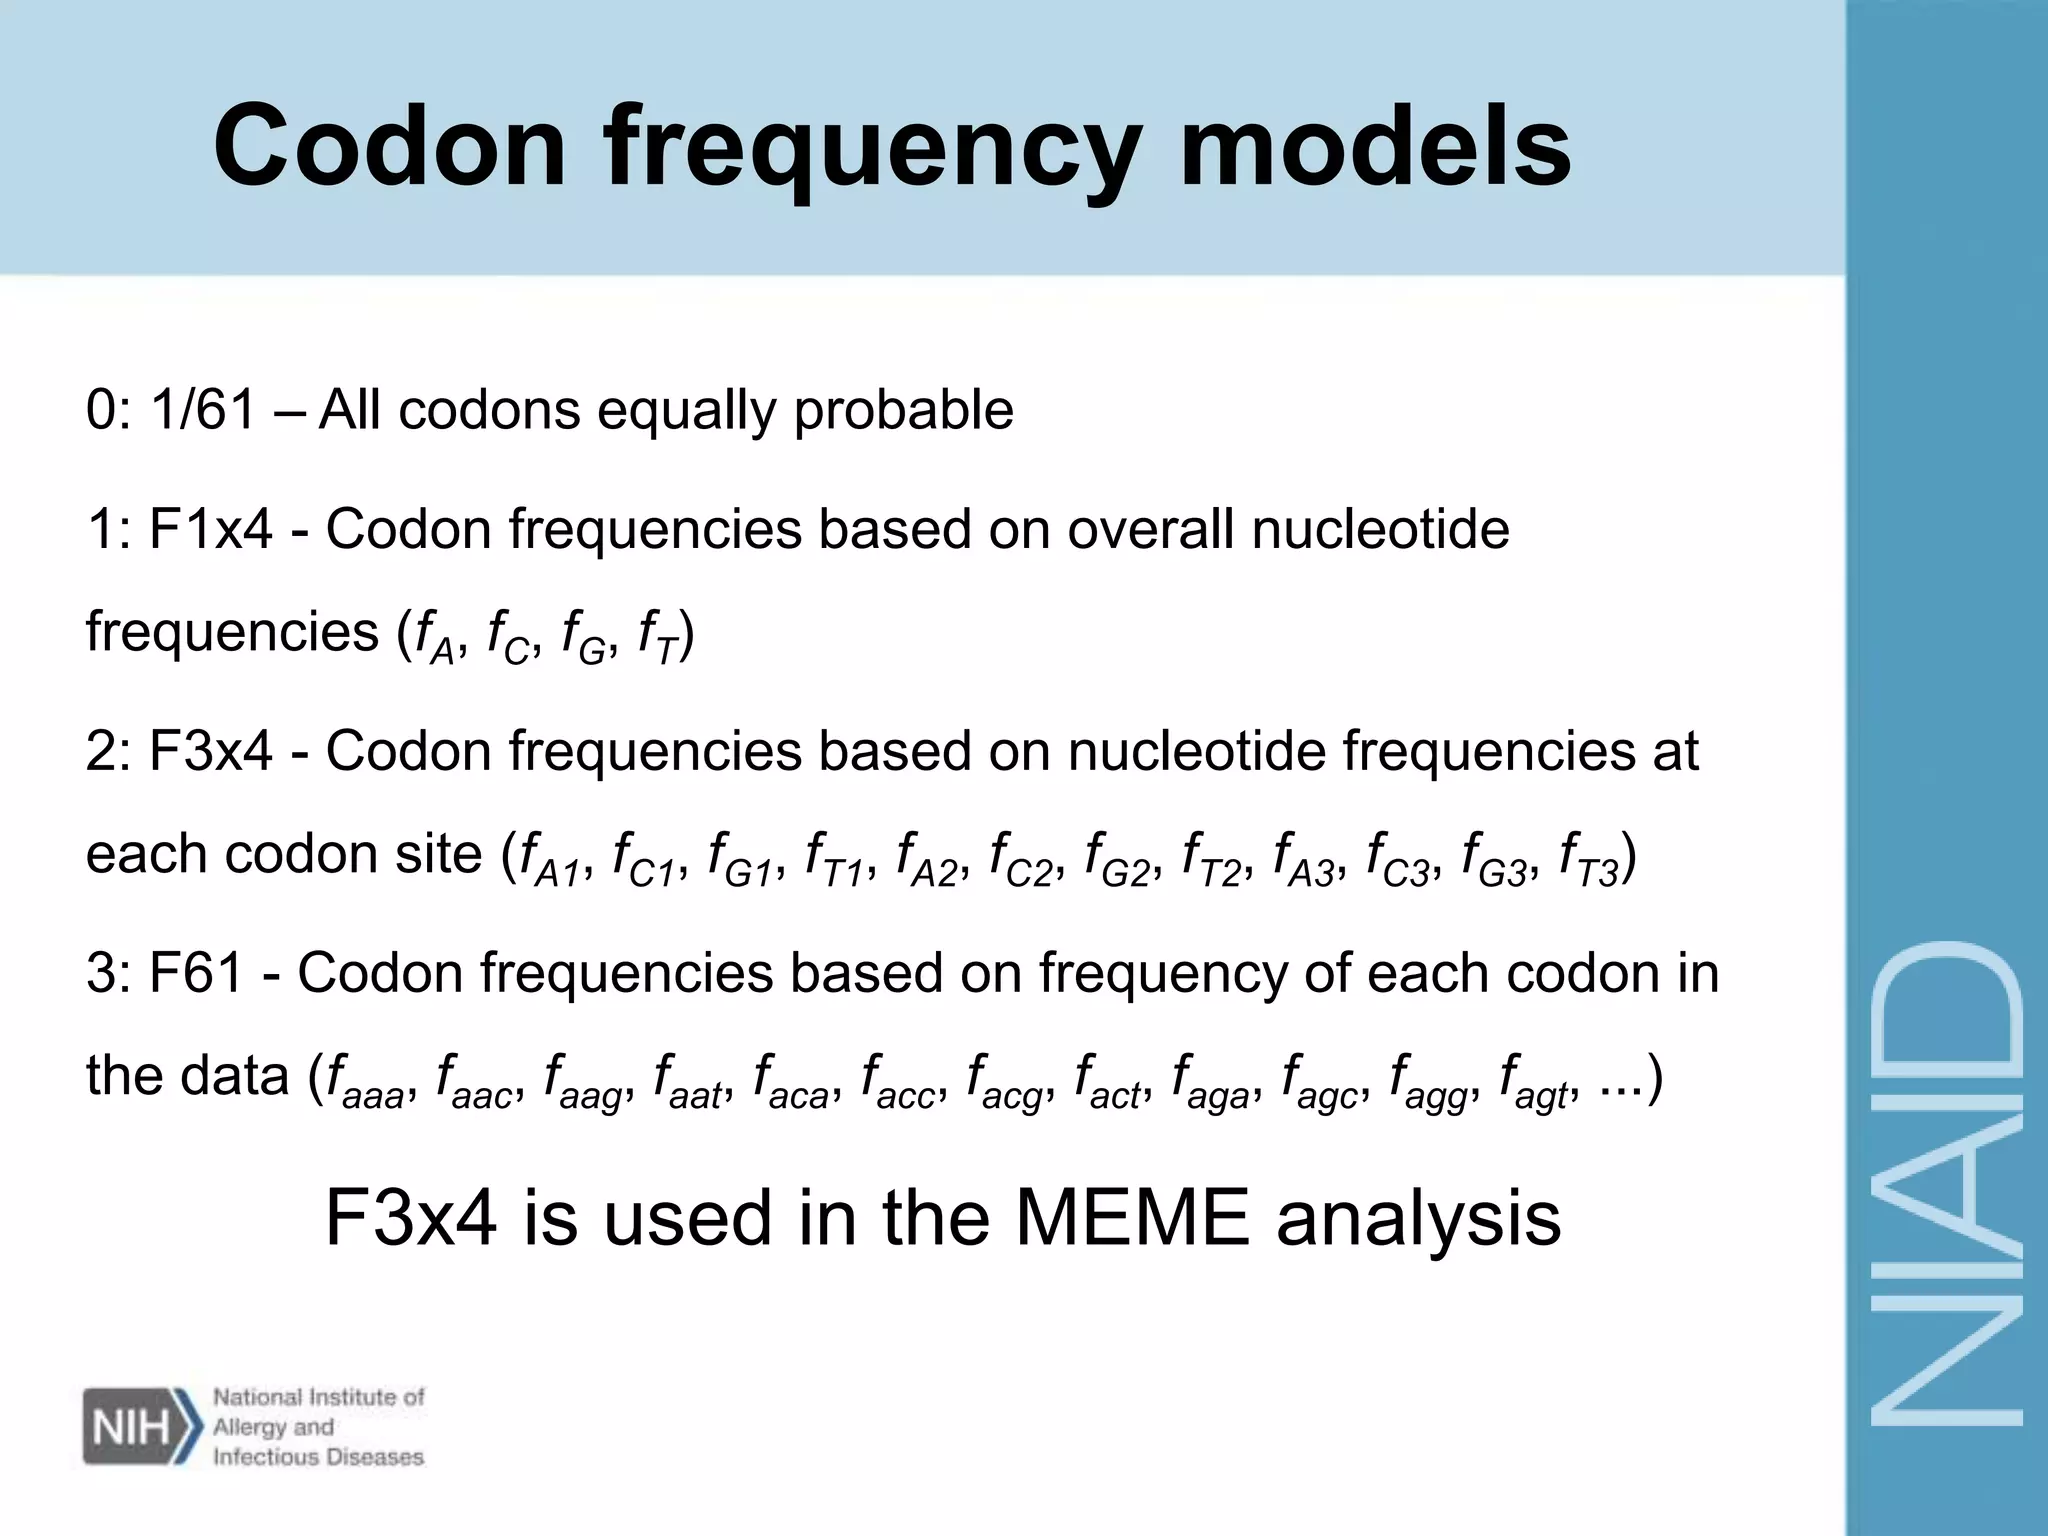
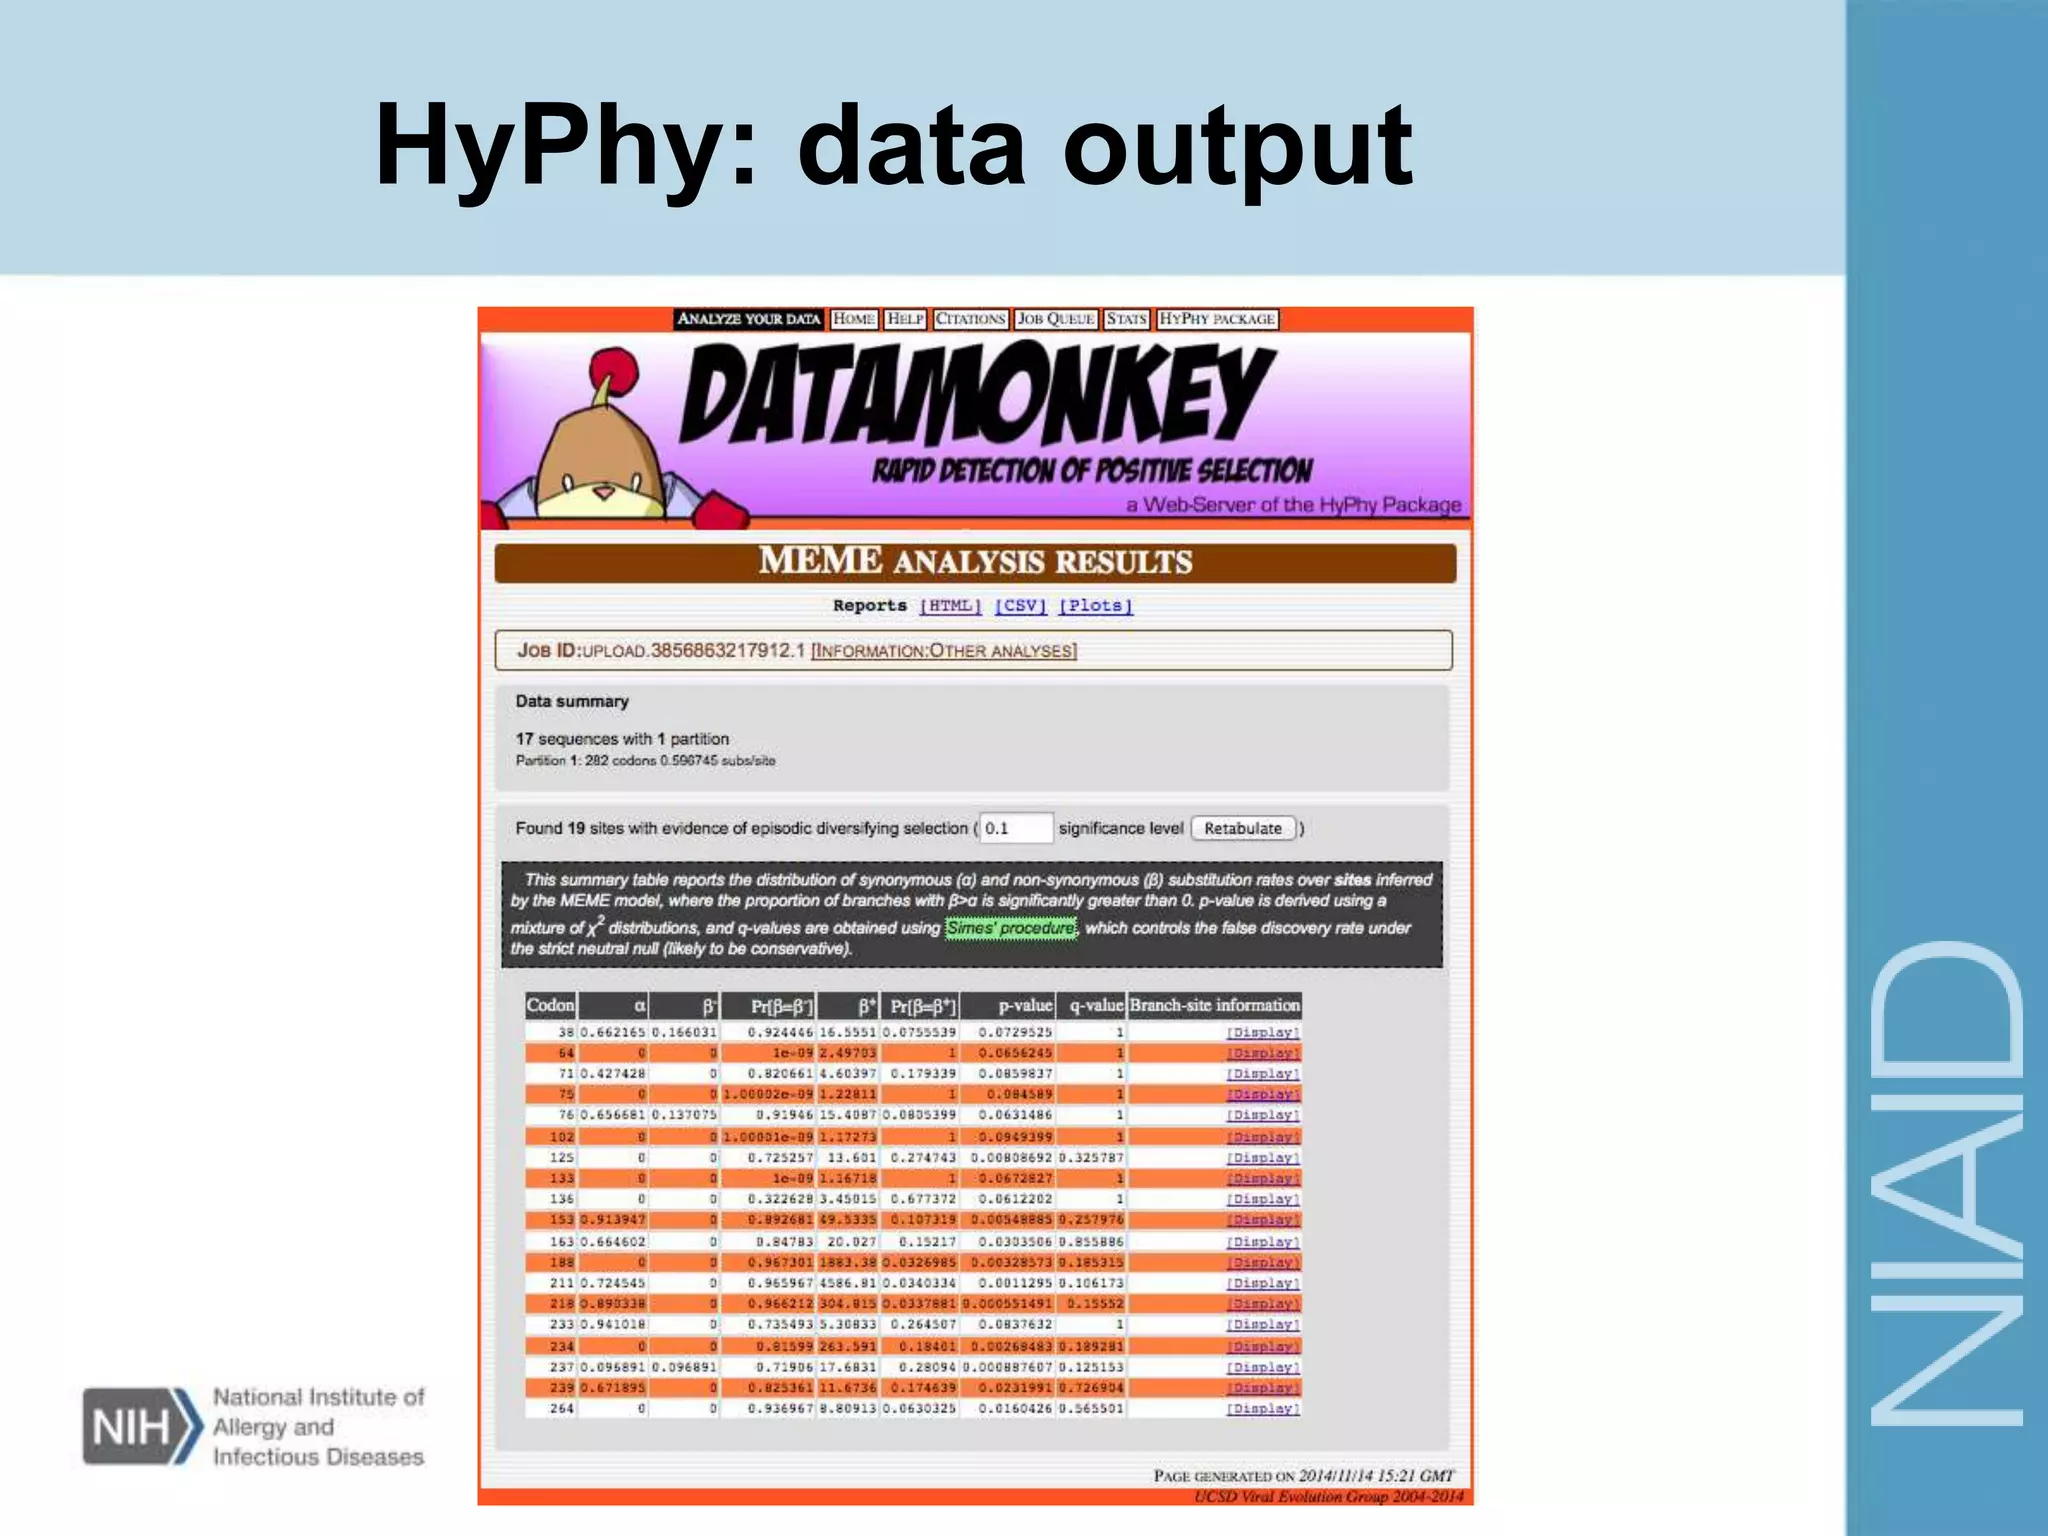
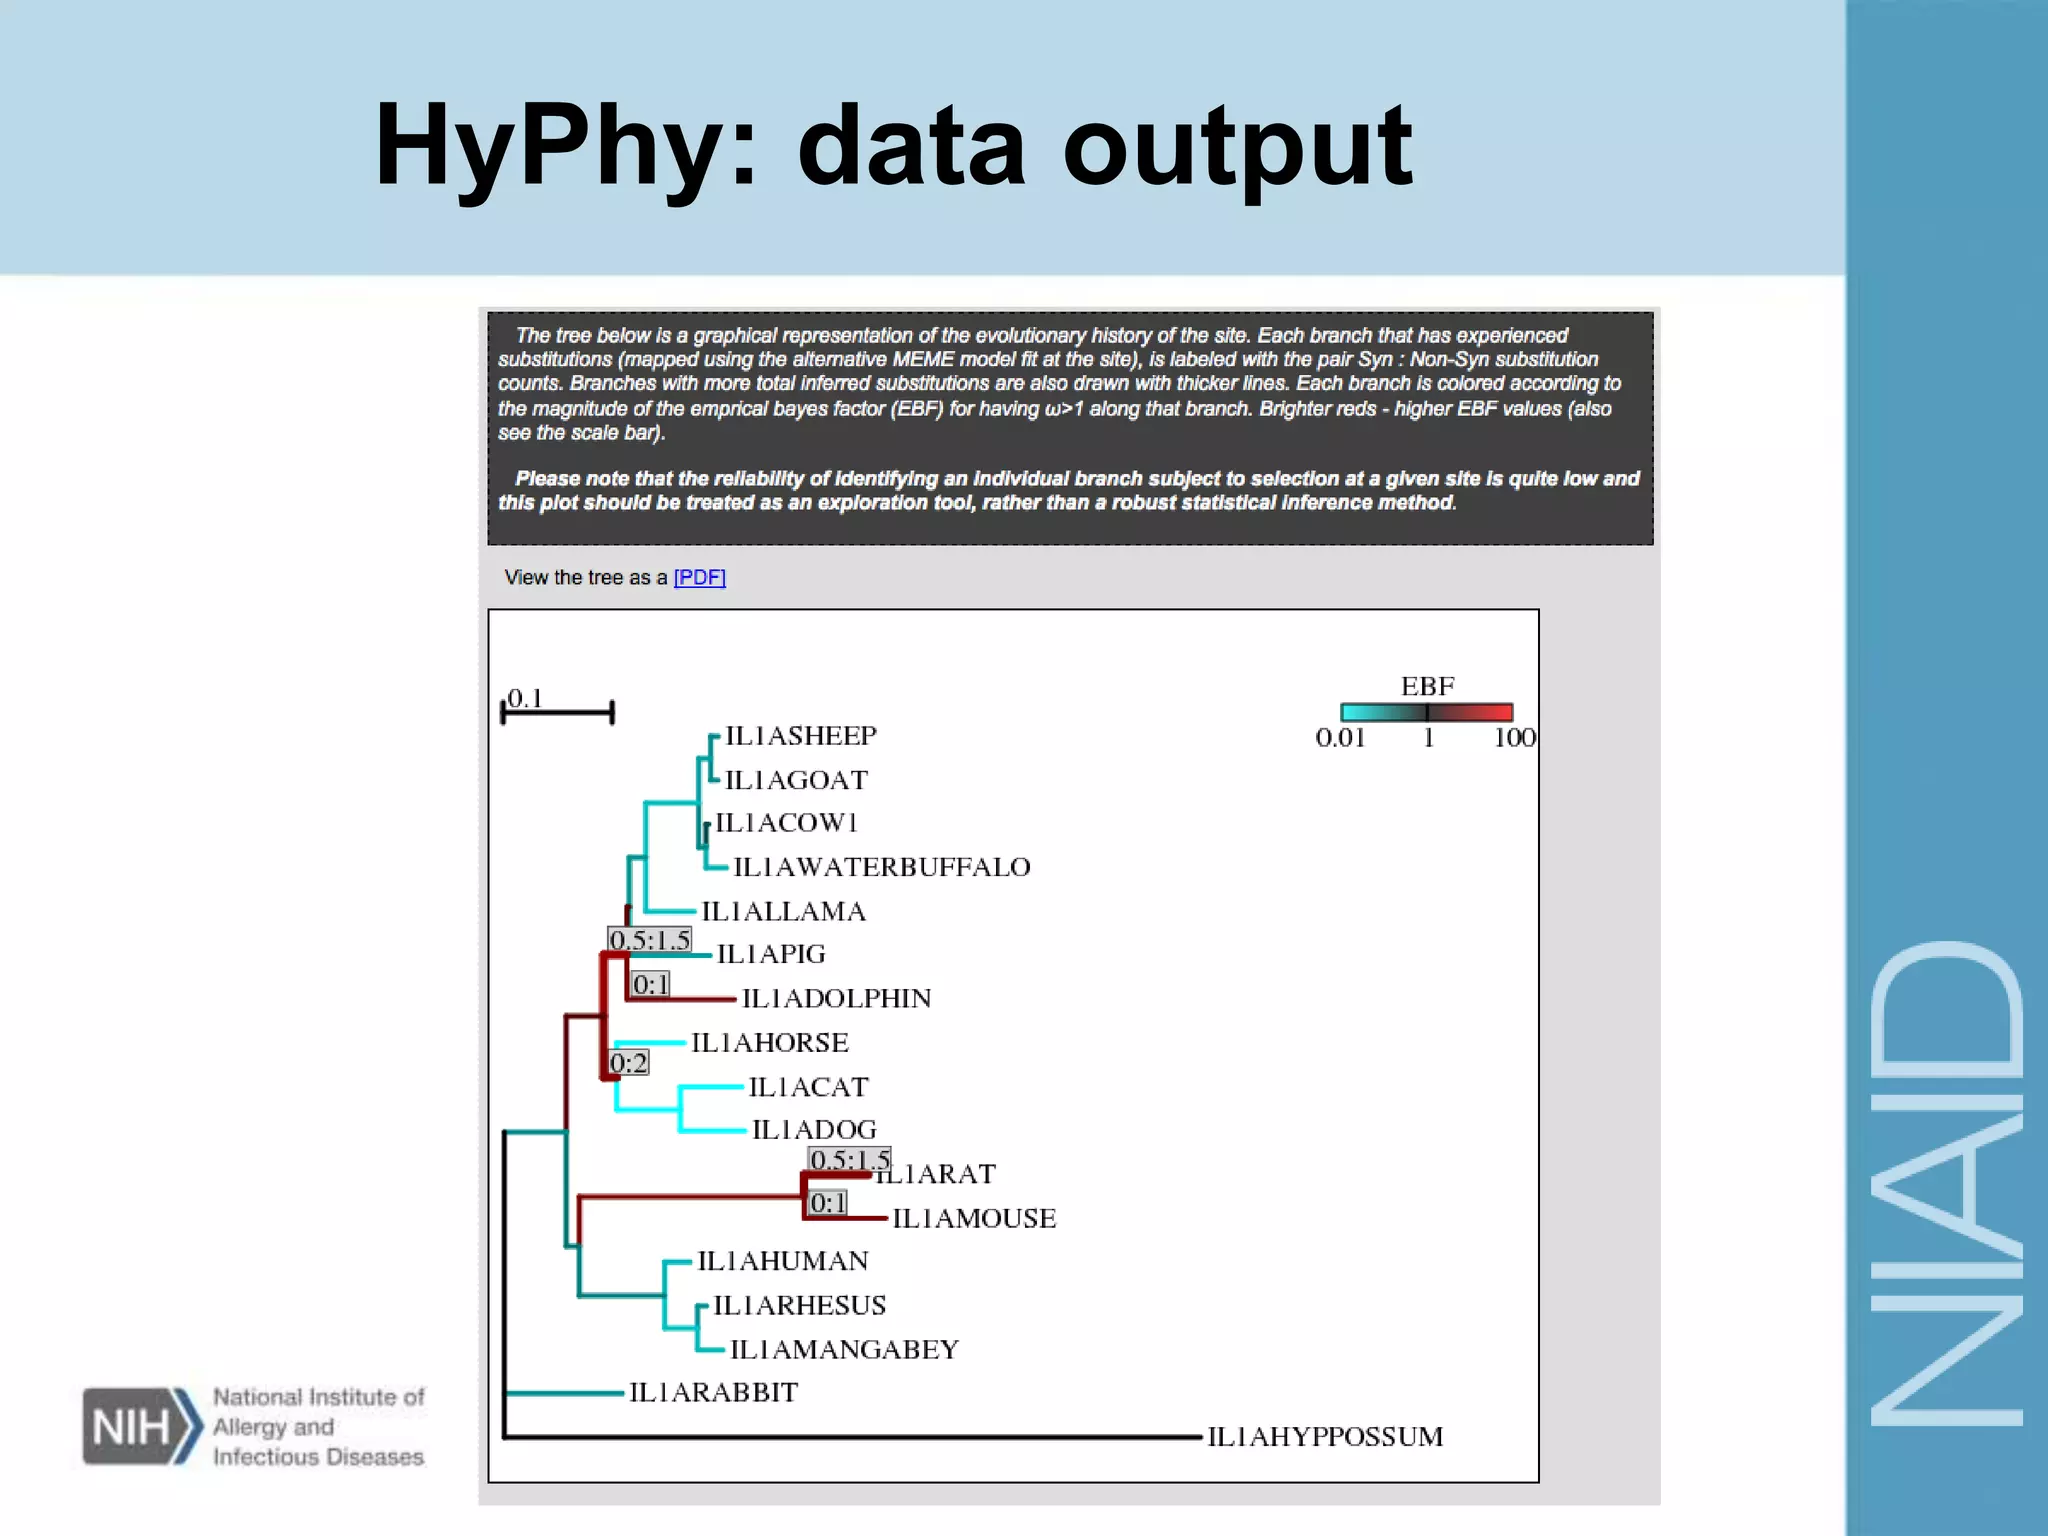
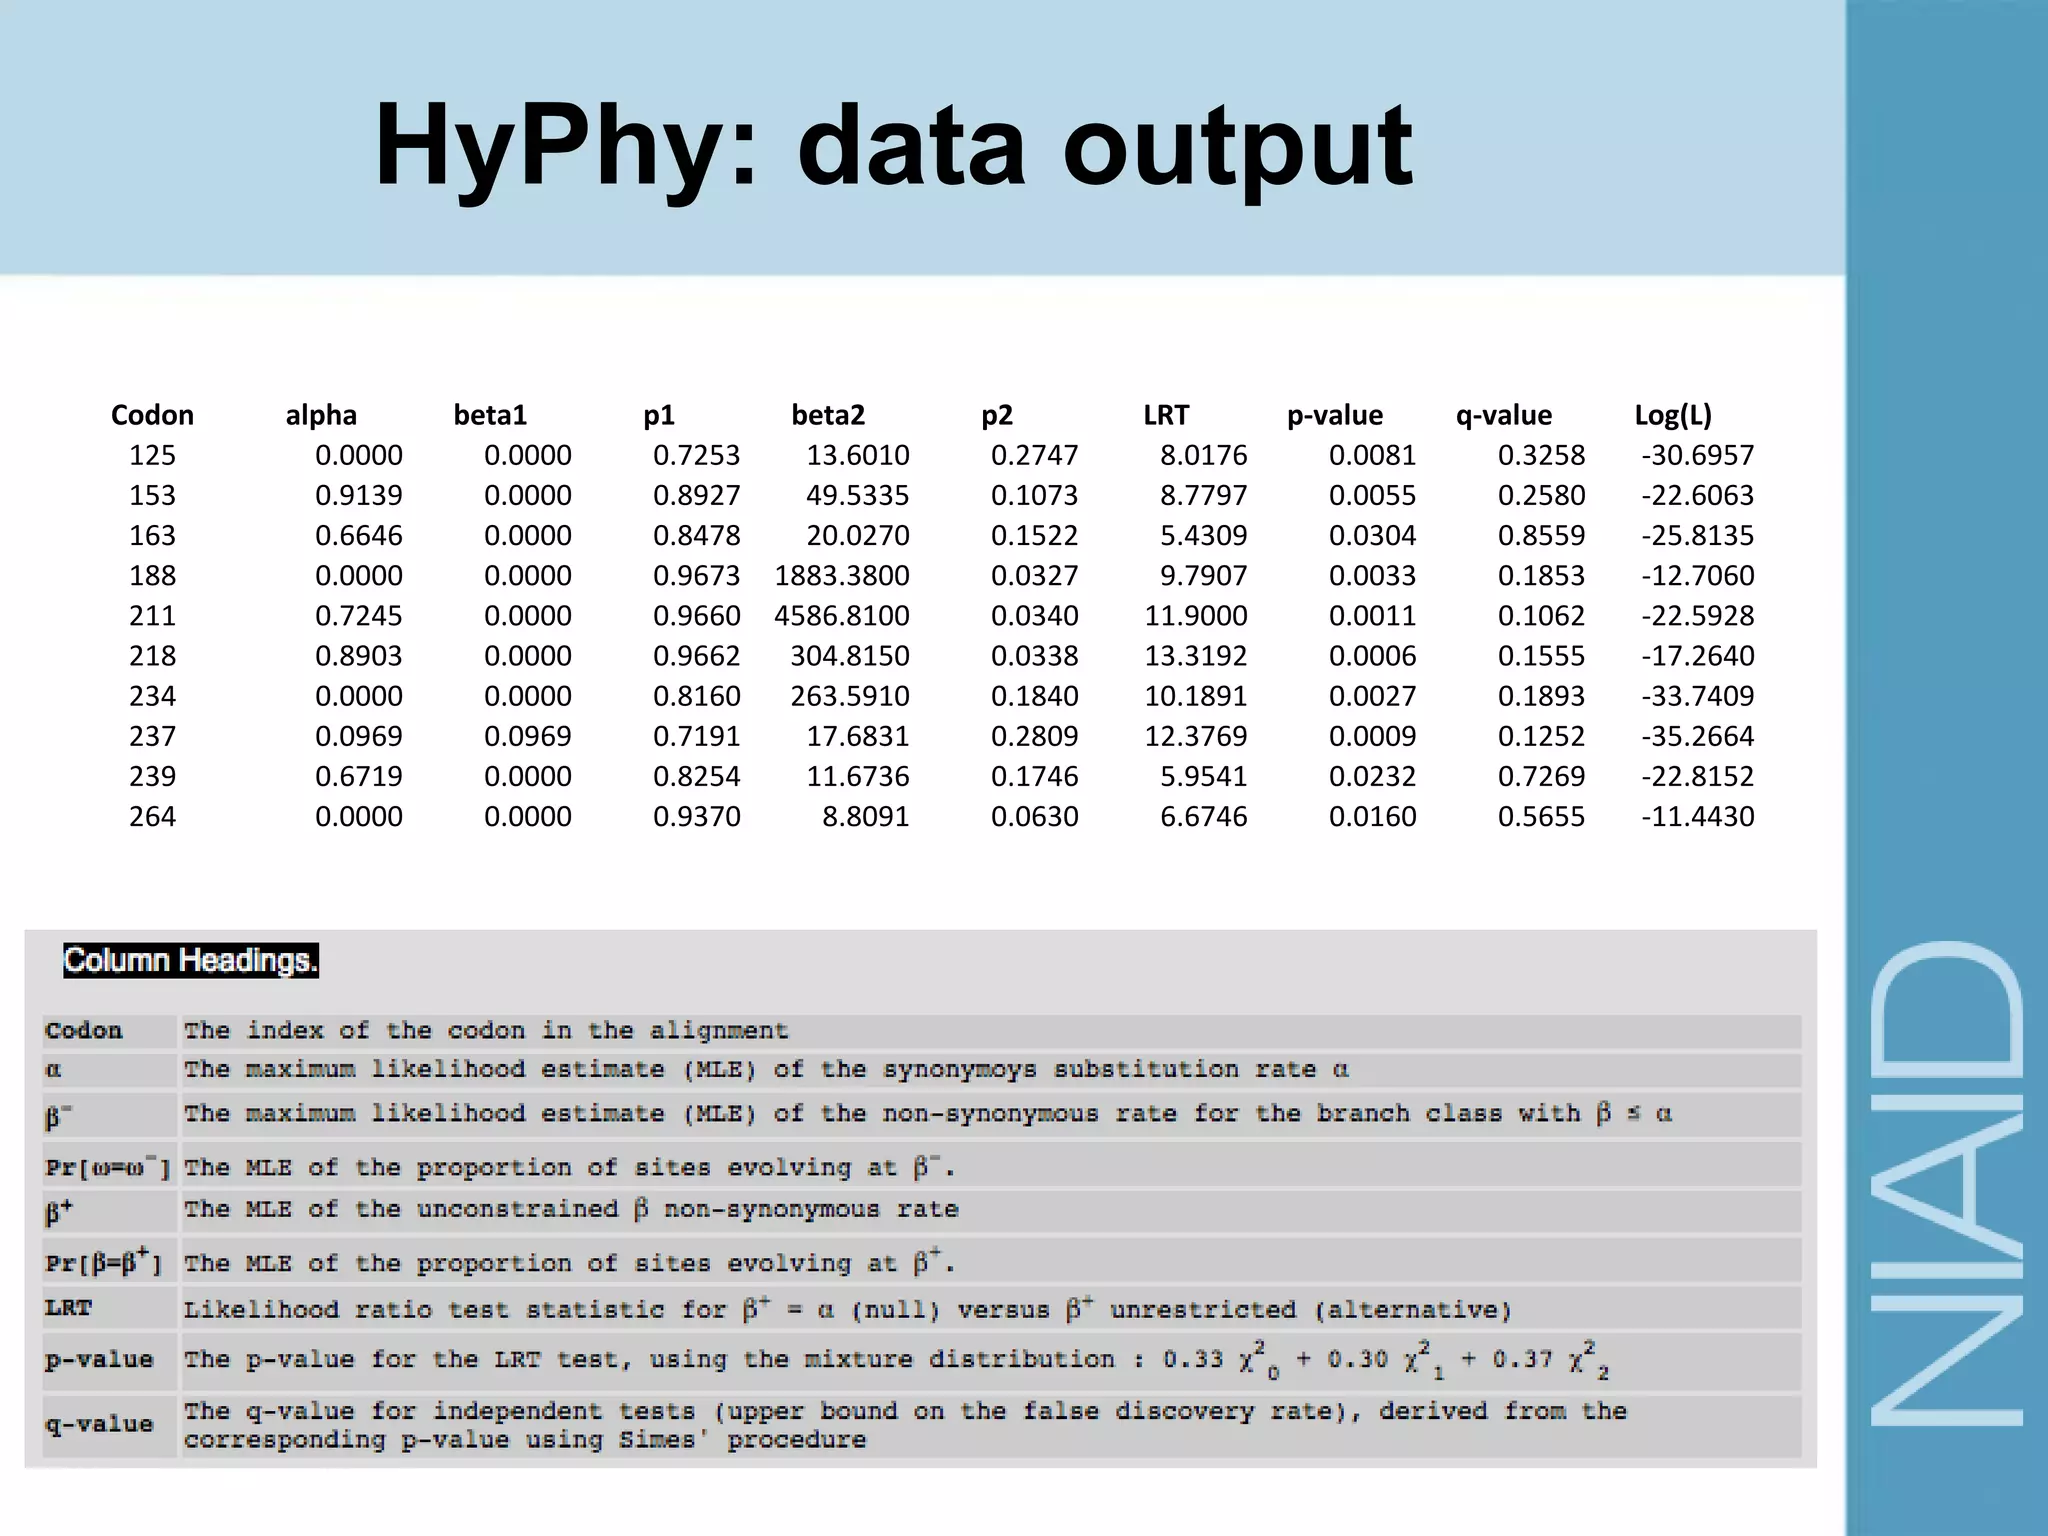
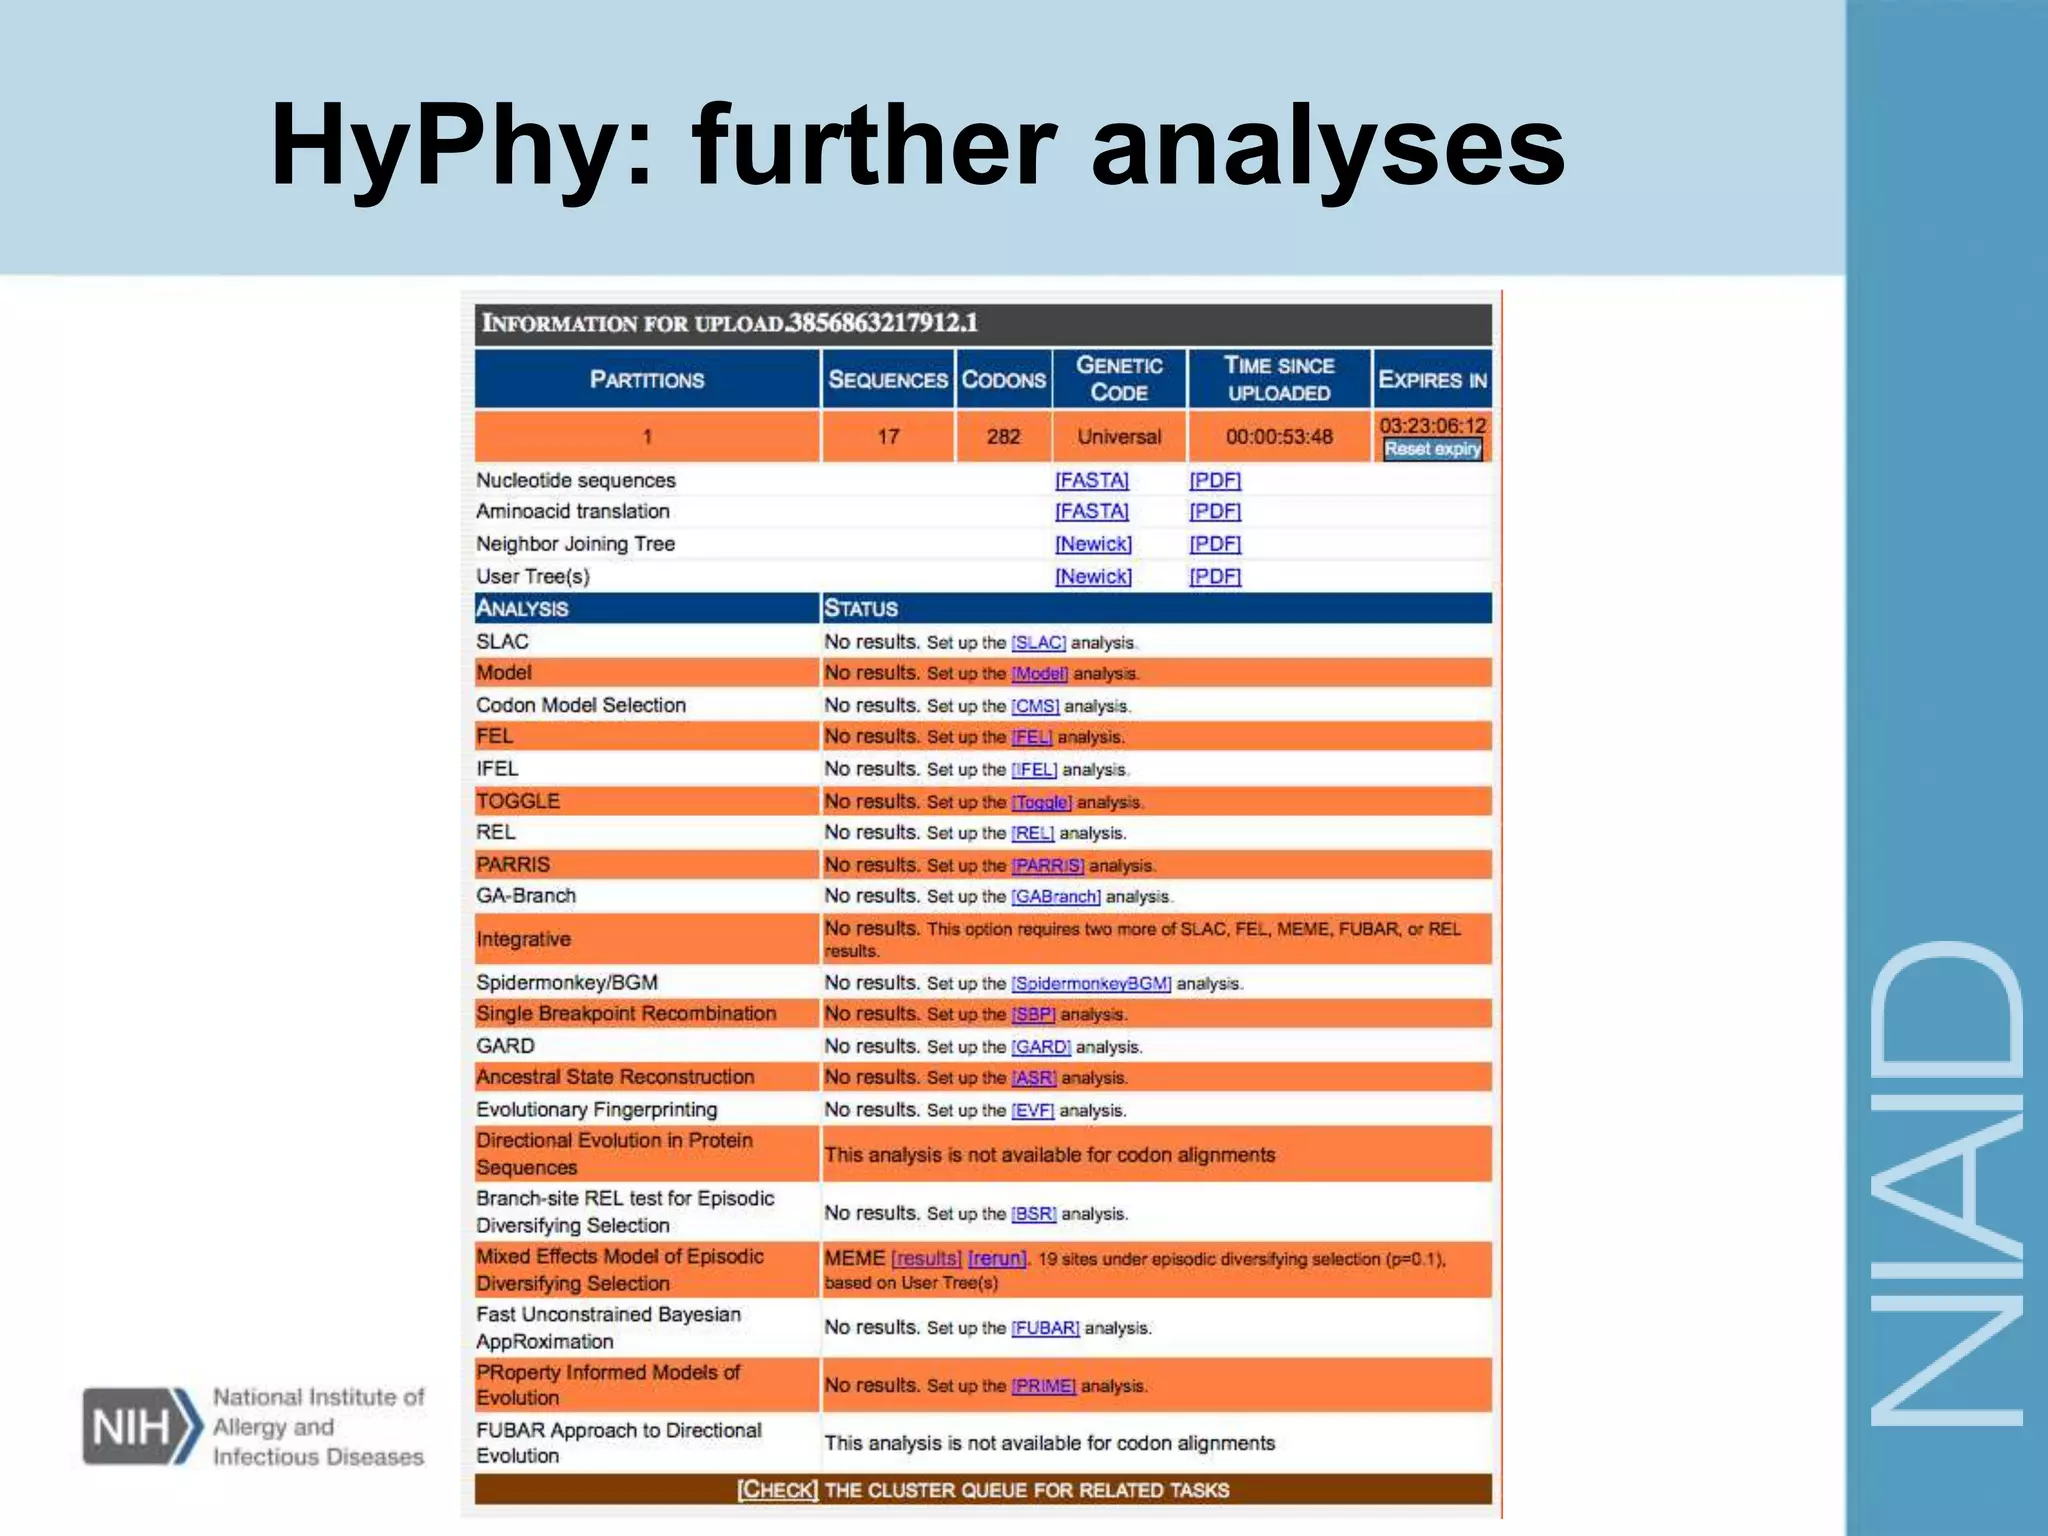
Fall 2015
Kurt Wollenberg, PhD
Phylogenetics Specialist
Bioinformatics and Computational Biology Branch (BCBB)
Phylogenetics and Sequence Analysis
Lecture 6: Selection Analysis Using
HyPhy
10 ω ∞
Course Organization
• Building a clean sequence
• Collecting homologs
• Aligning your sequences
• Building trees
• Further Analysis
Lecture Organization
• What is selection?
• What does selection look like?
• HyPhy: using maximum likelihood to
quantify selection
• HyPhy input
• Interpreting your output
What is selection?
• Mutation – the source of all variation
• Substitution – changing one nucleotide to
another
• Synonymous substitution
• Non-synonymous substitution
• Conservative substitution
Synonymous/non-synonymous
Conservative/non-conservative
Adapted from Miller and Levine
Substitution
...GGG TGT TGT...
Time
...GGC AGT TGG...
Translation Translation
...G-S-W... ...G-C-C...
conservative
What is selection?
• Differential survival of genotypes
• Positive selection - diversifying
• Maintain variation
• Variation can also be maintained by
genetic drift
• Negative selection – purifying
• Remove variation
Why is selection important?
• Pathogens
 Surviving the immune system
• Patients
 Surviving infection
• Identification of the molecular basis for
survival
What is selection analysis?
• Determining the dN/dS ratio
 Inference of ancestral states
 Determination of the effect of inferred
nucleotide changes on amino acids
• Is dN/dS significantly different from 1?
What is selection analysis?
• Positive (Diversifying) Selection
dN/dS > 1
• Negative (Purifying) Selection
dN/dS < 1
Two types of selection analysis
• Selection at sites
→ Are there significant levels of non-synonymous
substitution at specific codons?
→ Averaged across lineages.
• Selection along lineages
→ Are there significant levels of non-synonymous
substitution in specific groups?
→ Averaged across sequences.
Two types of selection analysis
5 100 I
MC1_01B4fs TGCACTAATA ATCTGATT-- -------AAT ATCACTGAGA ATACTAATAA
MC1_01A10 TGCACT---A ATCTGACAAA GGCTATTAAG ACCAATGGGA ATGCTAATAA
MC1_01C1 TGCACTAATA ATCTGATT-- -------AAT ATCACTGAGA ATACTAATAA
MC1_01A20 TGCACTAATA ATCTGACAAA GGCTAGTAAT GCCACTGAGA AGGCTAATAA
MC1_01TA1 TGCACTAATA ATCTGATT-- -------AAT ATCACTGAGA ATACTAATAA
TACCATTACT AAT------- --ACCACTAT TAATAGCGGG GGAGAAATAA
TACCAGTACT AATGCCACTG AGAGTACCAT TACTAATACC ACTGAAATAA
TACCATTACT AAT------- --ACCACTAT TAATAGCGGG GGAGAAATAA
TACCATTACT AAT------- --ACCACTAT TGATAGCGGG GGAGAAATAA
Selection at sites (codons)
Selection
along
lineages
MC1_01B4fs
MC1_01A10
MC1_01C1
MC1_01A20
MC1_01TA1
Calculating dN/dS
• Estimate transition/transversion rate ratio
→ Transition: A G C T
→ Transversion: purine purimidine
→ Based on four-fold degenerate sites at third codon positions and
nondegenerate sites.
• Count synonymous and nonsynonymous substitutions
for each codon site or along each lineage.
→ Use ML estimates of ancestral codon states.
• Correct counts for multiple hits.
• Fitting the data to a distribution of dN/dS ratios.
→ Calculate the probability of dN/dS falling into a particular class.
A G
C T
purines
pyrimidines
HyPhy: the software
• Input data format
→ Sequences must be aligned.
→ Fasta, PHYLIP, or Nexus format.
→ Include the tree after the alignment.
• Program options
→ Analysis scripts.
http://datamonkey.org
Standard Analyses
HyPhy: the software
Positive Selection Analyses
HyPhy: the software
• REL – relative effects model – very similar to PAML
codeml F61 analysis
• 2pFEL –2-parameter fixed-effects model
• MEME – mixed-effects model
The Algorithms
HyPhy: the software
• Analyzes levels of positive selection at individual
sites while allowing level of positive selection to vary
from branch to branch.
• Other models (FEL, REL, etc.) assume level of
positive selection to be uniform across all branches.
• Includes site-to-site variation in synonymous
substitution rate, just like FEL.
The MEME Algorithm
HyPhy: the software
Mixed Effects Model of Evolution
HyPhy: Input file formats
>MC1_01B4fs
TGCACTAATAATCTGATT---------AATATCACTGAGAATACTAATAATACCATTACT
>MC1_01A10
TGCACT---AATCTGACAAAGGCTATTAAGACCAATGGGAATGCTAATAATACCAGTACT
>MC1_01C1
TGCACTAATAATCTGATT---------AATATCACTGAGAATACTAATAATACCATTACT
>MC1_01A20
TGCACTAATAATCTGACAAAGGCTAGTAATGCCACTGAGAAGGCTAATAATACCATTACT
>MC1_01TA1
TGCACTAATAATCTGATT---------AATATCACTGAGAATACTAATAATACCATTACT
(((MC1_01B4fs,MC1_01A10),MC1_01C1),(MC1_01A20,MC1_01TA1));
Fasta
Make sure
these
match!
No stop codons!
HyPhy: Input file formats
>MC1_01B4fs
>MC1_01A10
>MC1_01C1
>MC1_01A20
>MC1_01TA1
TGCACTAATAATCTGATT---------AATATCACTGAGAATACTAATAATACCATTACT
TGCACT---AATCTGACAAAGGCTATTAAGACCAATGGGAATGCTAATAATACCAGTACT
TGCACTAATAATCTGATT---------AATATCACTGAGAATACTAATAATACCATTACT
TGCACTAATAATCTGACAAAGGCTAGTAATGCCACTGAGAAGGCTAATAATACCATTACT
TGCACTAATAATCTGATT---------AATATCACTGAGAATACTAATAATACCATTACT
AAT---------ACCACTATTAATAGCGGGGGAGAAATAA
AATGCCACTGAGAGTACCATTACTAATACCACTGAAATAA
AAT---------ACCACTATTAATAGCGGGGGAGAAATAA
AAT---------ACCACTATTGATAGCGGGGGAGAAATAA
(((MC1_01B4fs,MC1_01A10),MC1_01C1),(MC1_01A20,MC1_01TA1));
Fasta - interleaved
Make sure
these
match!
No stop codons!
HyPhy: Input file formats
5 100 I
MC1_01B4fs TGCACTAATA ATCTGATT-- -------AAT ATCACTGAGA ATACTAATAA
MC1_01A10 TGCACT---A ATCTGACAAA GGCTATTAAG ACCAATGGGA ATGCTAATAA
MC1_01C1 TGCACTAATA ATCTGATT-- -------AAT ATCACTGAGA ATACTAATAA
MC1_01A20 TGCACTAATA ATCTGACAAA GGCTAGTAAT GCCACTGAGA AGGCTAATAA
MC1_01TA1 TGCACTAATA ATCTGATT-- -------AAT ATCACTGAGA ATACTAATAA
TACCATTACT AAT------- --ACCACTAT TAATAGCGGG GGAGAAATAA
TACCAGTACT AATGCCACTG AGAGTACCAT TACTAATACC ACTGAAATAA
TACCATTACT AAT------- --ACCACTAT TAATAGCGGG GGAGAAATAA
TACCATTACT AAT------- --ACCACTAT TGATAGCGGG GGAGAAATAA
1
(((MC1_01B4fs,MC1_01A10),MC1_01C1),(MC1_01A20,MC1_01TA1));
PHLYIP
Make sure
these
match!
No stop codons!
HyPhy: Input file formats
#NEXUS
Begin data;
Dimensions ntax=5 nchar=100;
Format datatype=DNA gap=- interleave;
MATRIX
MC1_01B4fs TGCACTAATA ATCTGATT-- -------AAT ATCACTGAGA ATACTAATAA
MC1_01A10 TGCACT---A ATCTGACAAA GGCTATTAAG ACCAATGGGA ATGCTAATAA
MC1_01C1 TGCACTAATA ATCTGATT-- -------AAT ATCACTGAGA ATACTAATAA
MC1_01A20 TGCACTAATA ATCTGACAAA GGCTAGTAAT GCCACTGAGA AGGCTAATAA
MC1_01TA1 TGCACTAATA ATCTGATT-- -------AAT ATCACTGAGA ATACTAATAA
TACCATTACT AAT------- --ACCACTAT TAATAGCGGG GGAGAAATAA
TACCAGTACT AATGCCACTG AGAGTACCAT TACTAATACC ACTGAAATAA
TACCATTACT AAT------- --ACCACTAT TAATAGCGGG GGAGAAATAA
TACCATTACT AAT------- --ACCACTAT TGATAGCGGG GGAGAAATAA
;
End;
Begin trees;
TREE
tree=(((MC1_01B4fs,MC1_01A10),MC1_01C1),(MC1_01A20,MC1_01TA1));
End;
Nexus
Make sure
these
match!
No stop codons!
HyPhy: Input file formats
5 100 I
MC1_01B4fs TGCACTAATA ATCTGATT-- -------AAT ATCACTGAGA ATACTAATAA
MC1_01A10 TGCACT---A ATCTGACAAA GGCTATTAAG ACCAATGGGA ATGCTAATAA
MC1_01C1 TGCACTAATA ATCTGATT-- -------AAT ATCACTGAGA ATACTAATAA
MC1_01A20 TGCACTAATA ATCTGACAAA GGCTAGTAAT GCCACTGAGA AGGCTAATAA
MC1_01TA1 TGCACTAATA ATCTGATT-- -------AAT ATCACTGAGA ATACTAATAA
TACCATTACT AAT------- --ACCACTAT TAATAGCGGG GGAGAAATAA
TACCAGTACT AATGCCACTG AGAGTACCAT TACTAATACC ACTGAAATAA
TACCATTACT AAT------- --ACCACTAT TAATAGCGGG GGAGAAATAA
TACCATTACT AAT------- --ACCACTAT TGATAGCGGG GGAGAAATAA
Sequence data
GAPS!
• Gaps must be in multiples of three and preserve the reading frame!
• ML models cannot analyze gapped codon sites – they will be ignored for the
analysis.
HyPhy: data input
Codon frequency models
0: 1/61 – All codons equally probable
1: F1x4 - Codon frequencies based on overall nucleotide
frequencies (fA, fC, fG, fT)
2: F3x4 - Codon frequencies based on nucleotide frequencies at
each codon site (fA1, fC1, fG1, fT1, fA2, fC2, fG2, fT2, fA3, fC3, fG3, fT3)
3: F61 - Codon frequencies based on frequency of each codon in
the data (faaa, faac, faag, faat, faca, facc, facg, fact, faga, fagc, fagg, fagt, ...)
F3x4 is used in the MEME analysis
HyPhy: data output
HyPhy: data output
HyPhy: data output
Codon alpha beta1 p1 beta2 p2 LRT p-value q-value Log(L)
125 0.0000 0.0000 0.7253 13.6010 0.2747 8.0176 0.0081 0.3258 -30.6957
153 0.9139 0.0000 0.8927 49.5335 0.1073 8.7797 0.0055 0.2580 -22.6063
163 0.6646 0.0000 0.8478 20.0270 0.1522 5.4309 0.0304 0.8559 -25.8135
188 0.0000 0.0000 0.9673 1883.3800 0.0327 9.7907 0.0033 0.1853 -12.7060
211 0.7245 0.0000 0.9660 4586.8100 0.0340 11.9000 0.0011 0.1062 -22.5928
218 0.8903 0.0000 0.9662 304.8150 0.0338 13.3192 0.0006 0.1555 -17.2640
234 0.0000 0.0000 0.8160 263.5910 0.1840 10.1891 0.0027 0.1893 -33.7409
237 0.0969 0.0969 0.7191 17.6831 0.2809 12.3769 0.0009 0.1252 -35.2664
239 0.6719 0.0000 0.8254 11.6736 0.1746 5.9541 0.0232 0.7269 -22.8152
264 0.0000 0.0000 0.9370 8.8091 0.0630 6.6746 0.0160 0.5655 -11.4430
HyPhy: further analyses
Selection Analysis
Site vs. Lineage Selection
Generally, if significant positive (or
negative) selection occurs at only a few
sites, averaging over the length of the
sequences will result in no significant
positive (or negative) selection being
detected.
Significance of Results
Selection analysis only determines if there
is a significant excess or lack of non-
synonymous substitution. The relative level
of physiochemical similarity among the two
amino acids is beyond the capabilities of
selection analysis software.
Selection Analysis
References
Fundamentals of Molecular Evolution. 2nd edition. Grauer and Li.
2000
A good introduction to the major concepts in molecular evolution.
The Phylogenetics Handbook. P. Lemey, editor. 2005.
Chapter 14: Theory of and practice of diversifying selection
analysis.
MEME reference:
Murrell B, et al. (2012) Detecting individual sites subject to
episodic diversifying selection. PLoS Genetics, 8(7):e1002764.
Seminar Follow-Up Site
 For access to past recordings, handouts, slides visit this site from the
NIH network:
http://collab.niaid.nih.gov/sites/research/SIG/Bioinformatics/
34
1. Select a
Subject Matter
View:
• Seminar Details
• Handout and
Reference Docs
• Relevant Links
• Seminar
Recording Links
2. Select a
Topic
Recommended Browsers:
• IE for Windows,
• Safari for Mac (Firefox on a
Mac is incompatible with
NIH Authentication
technology)
Login
• If prompted to log in use
“NIH” in front of your
username
35
Retrieving Slides/Handouts
This lecture
series
36
Retrieving Slides/Handouts
This lecture
These slides
37
Questions?
38
Next
Molecular Evolutionary Analysis of
Pathogens Using BEAST
Thursday, 10 December at 1300

Selection analysis using HyPhy

  • 1.
    Fall 2015 Kurt Wollenberg,PhD Phylogenetics Specialist Bioinformatics and Computational Biology Branch (BCBB) Phylogenetics and Sequence Analysis Lecture 6: Selection Analysis Using HyPhy
  • 2.
  • 3.
    Course Organization • Buildinga clean sequence • Collecting homologs • Aligning your sequences • Building trees • Further Analysis
  • 4.
    Lecture Organization • Whatis selection? • What does selection look like? • HyPhy: using maximum likelihood to quantify selection • HyPhy input • Interpreting your output
  • 5.
    What is selection? •Mutation – the source of all variation • Substitution – changing one nucleotide to another • Synonymous substitution • Non-synonymous substitution • Conservative substitution
  • 6.
  • 7.
    Substitution ...GGG TGT TGT... Time ...GGCAGT TGG... Translation Translation ...G-S-W... ...G-C-C... conservative
  • 8.
    What is selection? •Differential survival of genotypes • Positive selection - diversifying • Maintain variation • Variation can also be maintained by genetic drift • Negative selection – purifying • Remove variation
  • 9.
    Why is selectionimportant? • Pathogens  Surviving the immune system • Patients  Surviving infection • Identification of the molecular basis for survival
  • 10.
    What is selectionanalysis? • Determining the dN/dS ratio  Inference of ancestral states  Determination of the effect of inferred nucleotide changes on amino acids • Is dN/dS significantly different from 1?
  • 11.
    What is selectionanalysis? • Positive (Diversifying) Selection dN/dS > 1 • Negative (Purifying) Selection dN/dS < 1
  • 12.
    Two types ofselection analysis • Selection at sites → Are there significant levels of non-synonymous substitution at specific codons? → Averaged across lineages. • Selection along lineages → Are there significant levels of non-synonymous substitution in specific groups? → Averaged across sequences.
  • 13.
    Two types ofselection analysis 5 100 I MC1_01B4fs TGCACTAATA ATCTGATT-- -------AAT ATCACTGAGA ATACTAATAA MC1_01A10 TGCACT---A ATCTGACAAA GGCTATTAAG ACCAATGGGA ATGCTAATAA MC1_01C1 TGCACTAATA ATCTGATT-- -------AAT ATCACTGAGA ATACTAATAA MC1_01A20 TGCACTAATA ATCTGACAAA GGCTAGTAAT GCCACTGAGA AGGCTAATAA MC1_01TA1 TGCACTAATA ATCTGATT-- -------AAT ATCACTGAGA ATACTAATAA TACCATTACT AAT------- --ACCACTAT TAATAGCGGG GGAGAAATAA TACCAGTACT AATGCCACTG AGAGTACCAT TACTAATACC ACTGAAATAA TACCATTACT AAT------- --ACCACTAT TAATAGCGGG GGAGAAATAA TACCATTACT AAT------- --ACCACTAT TGATAGCGGG GGAGAAATAA TACCATTACT AAT------- --ACCACTAT TGATAGCGGG GGAGAAATAA Selection at sites (codons) Selection along lineages MC1_01B4fs MC1_01A10 MC1_01C1 MC1_01A20 MC1_01TA1
  • 14.
    Calculating dN/dS • Estimatetransition/transversion rate ratio → Transition: A G C T → Transversion: purine purimidine → Based on four-fold degenerate sites at third codon positions and nondegenerate sites. • Count synonymous and nonsynonymous substitutions for each codon site or along each lineage. → Use ML estimates of ancestral codon states. • Correct counts for multiple hits. • Fitting the data to a distribution of dN/dS ratios. → Calculate the probability of dN/dS falling into a particular class. A G C T purines pyrimidines
  • 15.
    HyPhy: the software •Input data format → Sequences must be aligned. → Fasta, PHYLIP, or Nexus format. → Include the tree after the alignment. • Program options → Analysis scripts. http://datamonkey.org
  • 16.
  • 17.
  • 18.
    • REL –relative effects model – very similar to PAML codeml F61 analysis • 2pFEL –2-parameter fixed-effects model • MEME – mixed-effects model The Algorithms HyPhy: the software
  • 19.
    • Analyzes levelsof positive selection at individual sites while allowing level of positive selection to vary from branch to branch. • Other models (FEL, REL, etc.) assume level of positive selection to be uniform across all branches. • Includes site-to-site variation in synonymous substitution rate, just like FEL. The MEME Algorithm HyPhy: the software Mixed Effects Model of Evolution
  • 20.
    HyPhy: Input fileformats >MC1_01B4fs TGCACTAATAATCTGATT---------AATATCACTGAGAATACTAATAATACCATTACT >MC1_01A10 TGCACT---AATCTGACAAAGGCTATTAAGACCAATGGGAATGCTAATAATACCAGTACT >MC1_01C1 TGCACTAATAATCTGATT---------AATATCACTGAGAATACTAATAATACCATTACT >MC1_01A20 TGCACTAATAATCTGACAAAGGCTAGTAATGCCACTGAGAAGGCTAATAATACCATTACT >MC1_01TA1 TGCACTAATAATCTGATT---------AATATCACTGAGAATACTAATAATACCATTACT (((MC1_01B4fs,MC1_01A10),MC1_01C1),(MC1_01A20,MC1_01TA1)); Fasta Make sure these match! No stop codons!
  • 21.
    HyPhy: Input fileformats >MC1_01B4fs >MC1_01A10 >MC1_01C1 >MC1_01A20 >MC1_01TA1 TGCACTAATAATCTGATT---------AATATCACTGAGAATACTAATAATACCATTACT TGCACT---AATCTGACAAAGGCTATTAAGACCAATGGGAATGCTAATAATACCAGTACT TGCACTAATAATCTGATT---------AATATCACTGAGAATACTAATAATACCATTACT TGCACTAATAATCTGACAAAGGCTAGTAATGCCACTGAGAAGGCTAATAATACCATTACT TGCACTAATAATCTGATT---------AATATCACTGAGAATACTAATAATACCATTACT AAT---------ACCACTATTAATAGCGGGGGAGAAATAA AATGCCACTGAGAGTACCATTACTAATACCACTGAAATAA AAT---------ACCACTATTAATAGCGGGGGAGAAATAA AAT---------ACCACTATTGATAGCGGGGGAGAAATAA AAT---------ACCACTATTGATAGCGGGGGAGAAATAA (((MC1_01B4fs,MC1_01A10),MC1_01C1),(MC1_01A20,MC1_01TA1)); Fasta - interleaved Make sure these match! No stop codons!
  • 22.
    HyPhy: Input fileformats 5 100 I MC1_01B4fs TGCACTAATA ATCTGATT-- -------AAT ATCACTGAGA ATACTAATAA MC1_01A10 TGCACT---A ATCTGACAAA GGCTATTAAG ACCAATGGGA ATGCTAATAA MC1_01C1 TGCACTAATA ATCTGATT-- -------AAT ATCACTGAGA ATACTAATAA MC1_01A20 TGCACTAATA ATCTGACAAA GGCTAGTAAT GCCACTGAGA AGGCTAATAA MC1_01TA1 TGCACTAATA ATCTGATT-- -------AAT ATCACTGAGA ATACTAATAA TACCATTACT AAT------- --ACCACTAT TAATAGCGGG GGAGAAATAA TACCAGTACT AATGCCACTG AGAGTACCAT TACTAATACC ACTGAAATAA TACCATTACT AAT------- --ACCACTAT TAATAGCGGG GGAGAAATAA TACCATTACT AAT------- --ACCACTAT TGATAGCGGG GGAGAAATAA TACCATTACT AAT------- --ACCACTAT TGATAGCGGG GGAGAAATAA 1 (((MC1_01B4fs,MC1_01A10),MC1_01C1),(MC1_01A20,MC1_01TA1)); PHLYIP Make sure these match! No stop codons!
  • 23.
    HyPhy: Input fileformats #NEXUS Begin data; Dimensions ntax=5 nchar=100; Format datatype=DNA gap=- interleave; MATRIX MC1_01B4fs TGCACTAATA ATCTGATT-- -------AAT ATCACTGAGA ATACTAATAA MC1_01A10 TGCACT---A ATCTGACAAA GGCTATTAAG ACCAATGGGA ATGCTAATAA MC1_01C1 TGCACTAATA ATCTGATT-- -------AAT ATCACTGAGA ATACTAATAA MC1_01A20 TGCACTAATA ATCTGACAAA GGCTAGTAAT GCCACTGAGA AGGCTAATAA MC1_01TA1 TGCACTAATA ATCTGATT-- -------AAT ATCACTGAGA ATACTAATAA TACCATTACT AAT------- --ACCACTAT TAATAGCGGG GGAGAAATAA TACCAGTACT AATGCCACTG AGAGTACCAT TACTAATACC ACTGAAATAA TACCATTACT AAT------- --ACCACTAT TAATAGCGGG GGAGAAATAA TACCATTACT AAT------- --ACCACTAT TGATAGCGGG GGAGAAATAA TACCATTACT AAT------- --ACCACTAT TGATAGCGGG GGAGAAATAA ; End; Begin trees; TREE tree=(((MC1_01B4fs,MC1_01A10),MC1_01C1),(MC1_01A20,MC1_01TA1)); End; Nexus Make sure these match! No stop codons!
  • 24.
    HyPhy: Input fileformats 5 100 I MC1_01B4fs TGCACTAATA ATCTGATT-- -------AAT ATCACTGAGA ATACTAATAA MC1_01A10 TGCACT---A ATCTGACAAA GGCTATTAAG ACCAATGGGA ATGCTAATAA MC1_01C1 TGCACTAATA ATCTGATT-- -------AAT ATCACTGAGA ATACTAATAA MC1_01A20 TGCACTAATA ATCTGACAAA GGCTAGTAAT GCCACTGAGA AGGCTAATAA MC1_01TA1 TGCACTAATA ATCTGATT-- -------AAT ATCACTGAGA ATACTAATAA TACCATTACT AAT------- --ACCACTAT TAATAGCGGG GGAGAAATAA TACCAGTACT AATGCCACTG AGAGTACCAT TACTAATACC ACTGAAATAA TACCATTACT AAT------- --ACCACTAT TAATAGCGGG GGAGAAATAA TACCATTACT AAT------- --ACCACTAT TGATAGCGGG GGAGAAATAA TACCATTACT AAT------- --ACCACTAT TGATAGCGGG GGAGAAATAA Sequence data GAPS! • Gaps must be in multiples of three and preserve the reading frame! • ML models cannot analyze gapped codon sites – they will be ignored for the analysis.
  • 25.
  • 26.
    Codon frequency models 0:1/61 – All codons equally probable 1: F1x4 - Codon frequencies based on overall nucleotide frequencies (fA, fC, fG, fT) 2: F3x4 - Codon frequencies based on nucleotide frequencies at each codon site (fA1, fC1, fG1, fT1, fA2, fC2, fG2, fT2, fA3, fC3, fG3, fT3) 3: F61 - Codon frequencies based on frequency of each codon in the data (faaa, faac, faag, faat, faca, facc, facg, fact, faga, fagc, fagg, fagt, ...) F3x4 is used in the MEME analysis
  • 27.
  • 28.
  • 29.
    HyPhy: data output Codonalpha beta1 p1 beta2 p2 LRT p-value q-value Log(L) 125 0.0000 0.0000 0.7253 13.6010 0.2747 8.0176 0.0081 0.3258 -30.6957 153 0.9139 0.0000 0.8927 49.5335 0.1073 8.7797 0.0055 0.2580 -22.6063 163 0.6646 0.0000 0.8478 20.0270 0.1522 5.4309 0.0304 0.8559 -25.8135 188 0.0000 0.0000 0.9673 1883.3800 0.0327 9.7907 0.0033 0.1853 -12.7060 211 0.7245 0.0000 0.9660 4586.8100 0.0340 11.9000 0.0011 0.1062 -22.5928 218 0.8903 0.0000 0.9662 304.8150 0.0338 13.3192 0.0006 0.1555 -17.2640 234 0.0000 0.0000 0.8160 263.5910 0.1840 10.1891 0.0027 0.1893 -33.7409 237 0.0969 0.0969 0.7191 17.6831 0.2809 12.3769 0.0009 0.1252 -35.2664 239 0.6719 0.0000 0.8254 11.6736 0.1746 5.9541 0.0232 0.7269 -22.8152 264 0.0000 0.0000 0.9370 8.8091 0.0630 6.6746 0.0160 0.5655 -11.4430
  • 30.
  • 31.
    Selection Analysis Site vs.Lineage Selection Generally, if significant positive (or negative) selection occurs at only a few sites, averaging over the length of the sequences will result in no significant positive (or negative) selection being detected.
  • 32.
    Significance of Results Selectionanalysis only determines if there is a significant excess or lack of non- synonymous substitution. The relative level of physiochemical similarity among the two amino acids is beyond the capabilities of selection analysis software. Selection Analysis
  • 33.
    References Fundamentals of MolecularEvolution. 2nd edition. Grauer and Li. 2000 A good introduction to the major concepts in molecular evolution. The Phylogenetics Handbook. P. Lemey, editor. 2005. Chapter 14: Theory of and practice of diversifying selection analysis. MEME reference: Murrell B, et al. (2012) Detecting individual sites subject to episodic diversifying selection. PLoS Genetics, 8(7):e1002764.
  • 34.
    Seminar Follow-Up Site For access to past recordings, handouts, slides visit this site from the NIH network: http://collab.niaid.nih.gov/sites/research/SIG/Bioinformatics/ 34 1. Select a Subject Matter View: • Seminar Details • Handout and Reference Docs • Relevant Links • Seminar Recording Links 2. Select a Topic Recommended Browsers: • IE for Windows, • Safari for Mac (Firefox on a Mac is incompatible with NIH Authentication technology) Login • If prompted to log in use “NIH” in front of your username
  • 35.
  • 36.
  • 37.
  • 38.
    38 Next Molecular Evolutionary Analysisof Pathogens Using BEAST Thursday, 10 December at 1300