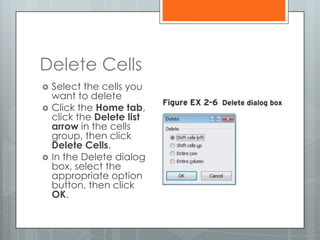
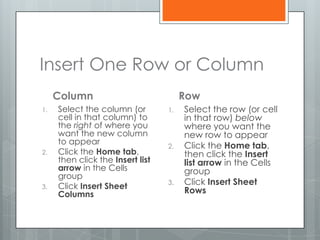
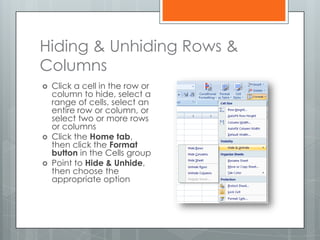
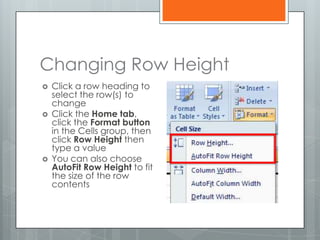
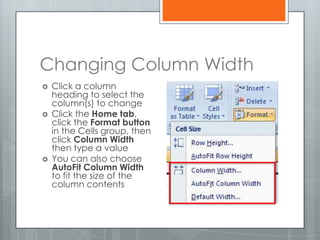
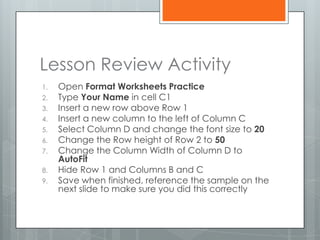
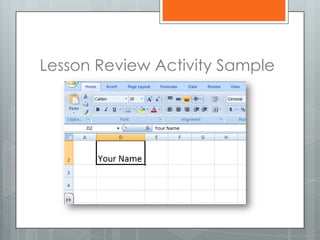
This document discusses formatting options in Microsoft Excel 2007, including inserting and modifying rows and columns, formatting cells and cell content, and formatting data as a table. Specifically, it covers how to insert and delete cells and rows/columns, apply formats to rows and columns, hide and unhide rows and columns, and change row heights and column widths. The final section provides a review activity to practice these skills.
Learn to anchor cells, move around Excel without a mouse, functions to summarize data, PivotTables, filters, sorting, charts, and macros in this course to take your Excel skills to the next level. Include information on functions: countif, sumif, vlookup, index, match, left, right, mid, len, trim, find, now, date, int
Excel – is the world’s most widely used spreadsheet calculating program
It is used in many places like hospitals, hotels, school and companies etc.
A program that allows you to use data to forecast, manage, predict, and present information
Lets Just Go For It! Wish you an Awesome Leaning Experience.
Subscribe to our YouTube channel: https://www.youtube.com/c/TimesRide?sub_confirmation=1
Our Official Website: http://timesride.com
Follow us:
Facebook: https://www.facebook.com/rs.agrawal.9026
Instagram: https://www.instagram.com/timesridenetwork/
Twitter: https://twitter.com/TimesRide
Pinterest: https://in.pinterest.com/ride0472/
Thank You
#AwesomeLearningExperience
#SmartQuickTips&Tricks #LeaningVideos #TimesRide #Keep Learning to Keep Winning!
This is a quick tutorial on how to use tables in Microsoft Word. Tables can be very useful in legal documents, not only for organizing data but also for formatting captions.
Handout used by the Westerville Public Library for the Introduction to Excel 2007 class. Provides basic information about creating a spreadsheet using Microsoft Excel 2007.
Excel 2007 Training 2012 Module 1 (Self Study Materials)Amann Group
This presentation is designed for the Beginners in Excel 2007. I also published the outline of my next Two Modules. My two modules for Intermediate & Advance Learners will be coming soon. For some excel based application, I would suggest you to visit my LinkedIn Profiles\' Box Application.
In this PowerPoint presentation, we will explore creating tables in Microsoft Word. Whether you are a student working on a research paper, a professional creating reports, or simply want to improve your document formatting skills, tables are an essential tool to master.
Connector Corner: Automate dynamic content and events by pushing a buttonDianaGray10
Here is something new! In our next Connector Corner webinar, we will demonstrate how you can use a single workflow to:
Create a campaign using Mailchimp with merge tags/fields
Send an interactive Slack channel message (using buttons)
Have the message received by managers and peers along with a test email for review
But there’s more:
In a second workflow supporting the same use case, you’ll see:
Your campaign sent to target colleagues for approval
If the “Approve” button is clicked, a Jira/Zendesk ticket is created for the marketing design team
But—if the “Reject” button is pushed, colleagues will be alerted via Slack message
Join us to learn more about this new, human-in-the-loop capability, brought to you by Integration Service connectors.
And...
Speakers:
Akshay Agnihotri, Product Manager
Charlie Greenberg, Host
Encryption in Microsoft 365 - ExpertsLive Netherlands 2024Albert Hoitingh
In this session I delve into the encryption technology used in Microsoft 365 and Microsoft Purview. Including the concepts of Customer Key and Double Key Encryption.
UiPath Test Automation using UiPath Test Suite series, part 4DianaGray10
Welcome to UiPath Test Automation using UiPath Test Suite series part 4. In this session, we will cover Test Manager overview along with SAP heatmap.
The UiPath Test Manager overview with SAP heatmap webinar offers a concise yet comprehensive exploration of the role of a Test Manager within SAP environments, coupled with the utilization of heatmaps for effective testing strategies.
Participants will gain insights into the responsibilities, challenges, and best practices associated with test management in SAP projects. Additionally, the webinar delves into the significance of heatmaps as a visual aid for identifying testing priorities, areas of risk, and resource allocation within SAP landscapes. Through this session, attendees can expect to enhance their understanding of test management principles while learning practical approaches to optimize testing processes in SAP environments using heatmap visualization techniques
What will you get from this session?
1. Insights into SAP testing best practices
2. Heatmap utilization for testing
3. Optimization of testing processes
4. Demo
Topics covered:
Execution from the test manager
Orchestrator execution result
Defect reporting
SAP heatmap example with demo
Speaker:
Deepak Rai, Automation Practice Lead, Boundaryless Group and UiPath MVP
Key Trends Shaping the Future of Infrastructure.pdfCheryl Hung
Keynote at DIGIT West Expo, Glasgow on 29 May 2024.
Cheryl Hung, ochery.com
Sr Director, Infrastructure Ecosystem, Arm.
The key trends across hardware, cloud and open-source; exploring how these areas are likely to mature and develop over the short and long-term, and then considering how organisations can position themselves to adapt and thrive.
State of ICS and IoT Cyber Threat Landscape Report 2024 previewPrayukth K V
The IoT and OT threat landscape report has been prepared by the Threat Research Team at Sectrio using data from Sectrio, cyber threat intelligence farming facilities spread across over 85 cities around the world. In addition, Sectrio also runs AI-based advanced threat and payload engagement facilities that serve as sinks to attract and engage sophisticated threat actors, and newer malware including new variants and latent threats that are at an earlier stage of development.
The latest edition of the OT/ICS and IoT security Threat Landscape Report 2024 also covers:
State of global ICS asset and network exposure
Sectoral targets and attacks as well as the cost of ransom
Global APT activity, AI usage, actor and tactic profiles, and implications
Rise in volumes of AI-powered cyberattacks
Major cyber events in 2024
Malware and malicious payload trends
Cyberattack types and targets
Vulnerability exploit attempts on CVEs
Attacks on counties – USA
Expansion of bot farms – how, where, and why
In-depth analysis of the cyber threat landscape across North America, South America, Europe, APAC, and the Middle East
Why are attacks on smart factories rising?
Cyber risk predictions
Axis of attacks – Europe
Systemic attacks in the Middle East
Download the full report from here:
https://sectrio.com/resources/ot-threat-landscape-reports/sectrio-releases-ot-ics-and-iot-security-threat-landscape-report-2024/
Smart TV Buyer Insights Survey 2024 by 91mobiles.pdf91mobiles
91mobiles recently conducted a Smart TV Buyer Insights Survey in which we asked over 3,000 respondents about the TV they own, aspects they look at on a new TV, and their TV buying preferences.
Dev Dives: Train smarter, not harder – active learning and UiPath LLMs for do...UiPathCommunity
💥 Speed, accuracy, and scaling – discover the superpowers of GenAI in action with UiPath Document Understanding and Communications Mining™:
See how to accelerate model training and optimize model performance with active learning
Learn about the latest enhancements to out-of-the-box document processing – with little to no training required
Get an exclusive demo of the new family of UiPath LLMs – GenAI models specialized for processing different types of documents and messages
This is a hands-on session specifically designed for automation developers and AI enthusiasts seeking to enhance their knowledge in leveraging the latest intelligent document processing capabilities offered by UiPath.
Speakers:
👨🏫 Andras Palfi, Senior Product Manager, UiPath
👩🏫 Lenka Dulovicova, Product Program Manager, UiPath
Epistemic Interaction - tuning interfaces to provide information for AI supportAlan Dix
Paper presented at SYNERGY workshop at AVI 2024, Genoa, Italy. 3rd June 2024
https://alandix.com/academic/papers/synergy2024-epistemic/
As machine learning integrates deeper into human-computer interactions, the concept of epistemic interaction emerges, aiming to refine these interactions to enhance system adaptability. This approach encourages minor, intentional adjustments in user behaviour to enrich the data available for system learning. This paper introduces epistemic interaction within the context of human-system communication, illustrating how deliberate interaction design can improve system understanding and adaptation. Through concrete examples, we demonstrate the potential of epistemic interaction to significantly advance human-computer interaction by leveraging intuitive human communication strategies to inform system design and functionality, offering a novel pathway for enriching user-system engagements.
Neuro-symbolic is not enough, we need neuro-*semantic*Frank van Harmelen
Neuro-symbolic (NeSy) AI is on the rise. However, simply machine learning on just any symbolic structure is not sufficient to really harvest the gains of NeSy. These will only be gained when the symbolic structures have an actual semantics. I give an operational definition of semantics as “predictable inference”.
All of this illustrated with link prediction over knowledge graphs, but the argument is general.
JMeter webinar - integration with InfluxDB and GrafanaRTTS
Watch this recorded webinar about real-time monitoring of application performance. See how to integrate Apache JMeter, the open-source leader in performance testing, with InfluxDB, the open-source time-series database, and Grafana, the open-source analytics and visualization application.
In this webinar, we will review the benefits of leveraging InfluxDB and Grafana when executing load tests and demonstrate how these tools are used to visualize performance metrics.
Length: 30 minutes
Session Overview
-------------------------------------------
During this webinar, we will cover the following topics while demonstrating the integrations of JMeter, InfluxDB and Grafana:
- What out-of-the-box solutions are available for real-time monitoring JMeter tests?
- What are the benefits of integrating InfluxDB and Grafana into the load testing stack?
- Which features are provided by Grafana?
- Demonstration of InfluxDB and Grafana using a practice web application
To view the webinar recording, go to:
https://www.rttsweb.com/jmeter-integration-webinar
2. In this Objective you will learn
to:
Format Worksheets
Insert and Modify Rows and Columns
Format Cells and Cell Content, and
Format Data as a Table
3. Insert and Modify Rows
and Columns
Insert & Delete Cells, Inserting Columns or Rows,
Applying Formats to Columns & Rows, Hiding &
Redisplaying Rows and Columns, Changing Row
Heights and Column Widths
4. Insert Cells
Click where you want to insert cells
Click the Home tab
Click the Insert list arrow in the Cells
group, then click Insert Cells
In the Insert dialog box select the
appropriate option button, then click OK
5. Delete Cells
Select the cells you
want to delete
Click the Home tab,
click the Delete list
arrow in the cells
group, then click
Delete Cells.
In the Delete dialog
box, select the
appropriate option
button, then click
OK.
6. Insert One Row or Column
Column Row
1. Select the column (or 1. Select the row (or cell
cell in that column) to in that row) below
the right of where you where you want the
want the new column new row to appear
to appear 2. Click the Home tab,
2. Click the Home tab, then click the Insert
then click the Insert list list arrow in the Cells
arrow in the Cells group
group
3. Click Insert Sheet 3. Click Insert Sheet
Columns Rows
7. Insert Multiple Columns or
Rows at Once
Same as inserting one row or column
except you elect two or more rows or
columns
It will insert the same number of columns
or rows that you selected
8. Apply Formats to Rows &
Columns
Select the entire row(s) or column(s) you
wish to apply the formatting to by click
the row or column heading
Click the Home tab, then click the
appropriate formatting commands
9. Hiding & Unhiding Rows &
Columns
Click a cell in the row or
column to hide, select a
range of cells, select an
entire row or column, or
select two or more rows
or columns
Click the Home tab,
then click the Format
button in the Cells group
Point to Hide & Unhide,
then choose the
appropriate option
10. Changing Row Height
Click a row heading to
select the row(s) to
change
Click the Home tab,
click the Format button
in the Cells group, then
click Row Height then
type a value
You can also choose
AutoFit Row Height to fit
the size of the row
contents
11. Changing Column Width
Click a column
heading to select the
column(s) to change
Click the Home tab,
click the Format button
in the Cells group, then
click Column Width
then type a value
You can also choose
AutoFit Column Width
to fit the size of the
column contents
12. Lesson Review Activity
1. Open Format Worksheets Practice
2. Type Your Name in cell C1
3. Insert a new row above Row 1
4. Insert a new column to the left of Column C
5. Select Column D and change the font size to 20
6. Change the Row height of Row 2 to 50
7. Change the Column Width of Column D to
AutoFit
8. Hide Row 1 and Columns B and C
9. Save when finished, reference the sample on the
next slide to make sure you did this correctly