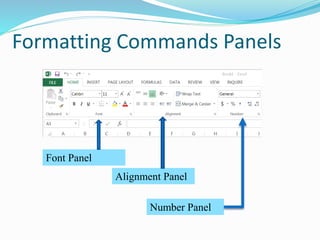
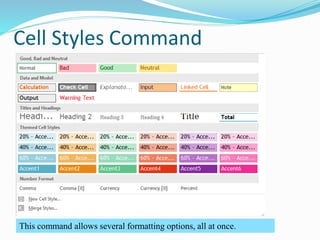
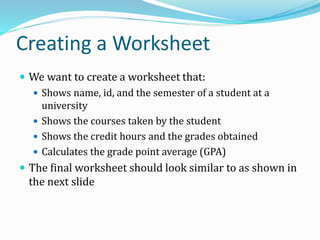
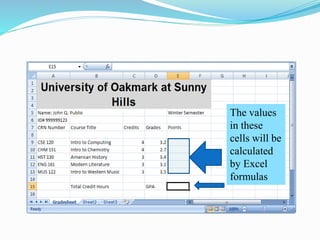
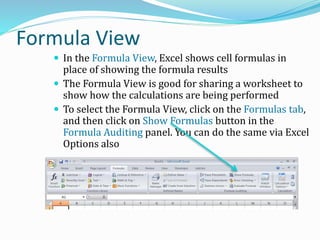
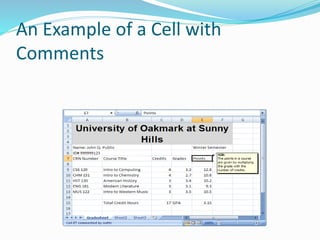
Excel – is the world’s most widely used spreadsheet calculating program
It is used in many places like hospitals, hotels, school and companies etc.
A program that allows you to use data to forecast, manage, predict, and present information
Lets Just Go For It! Wish you an Awesome Leaning Experience.
Subscribe to our YouTube channel: https://www.youtube.com/c/TimesRide?sub_confirmation=1
Our Official Website: http://timesride.com
Follow us:
Facebook: https://www.facebook.com/rs.agrawal.9026
Instagram: https://www.instagram.com/timesridenetwork/
Twitter: https://twitter.com/TimesRide
Pinterest: https://in.pinterest.com/ride0472/
Thank You
#AwesomeLearningExperience
#SmartQuickTips&Tricks #LeaningVideos #TimesRide #Keep Learning to Keep Winning!
Introduction to Microsoft Excel basics | Excel Intro | Excel | Excel for star...Corp-sKool
Introduction to Microsoft excel. Document to explain basic working fundamental of excel i.e grids (rows and columns)Document specifies basic editing, formatting and validating the data entered in excel.
Introduction to Microsoft Excel basics | Excel Intro | Excel | Excel for star...Corp-sKool
Introduction to Microsoft excel. Document to explain basic working fundamental of excel i.e grids (rows and columns)Document specifies basic editing, formatting and validating the data entered in excel.
Excel 2007 Training 2012 Module 1 (Self Study Materials)Amann Group
This presentation is designed for the Beginners in Excel 2007. I also published the outline of my next Two Modules. My two modules for Intermediate & Advance Learners will be coming soon. For some excel based application, I would suggest you to visit my LinkedIn Profiles\' Box Application.
Machine Learning 2 deep Learning: An IntroSi Krishan
Provides a brief introduction to machine learning, reasons for its popularity, a simple walk through example and then a need for deep learning and some of its characteristics. This is an updated version of an earlier presentation.
Continues with Excel basics giving information on cell addressing styles and worksheet functions and their nesting. Also gives an example of precision setting
Search and Society: Reimagining Information Access for Radical FuturesBhaskar Mitra
The field of Information retrieval (IR) is currently undergoing a transformative shift, at least partly due to the emerging applications of generative AI to information access. In this talk, we will deliberate on the sociotechnical implications of generative AI for information access. We will argue that there is both a critical necessity and an exciting opportunity for the IR community to re-center our research agendas on societal needs while dismantling the artificial separation between the work on fairness, accountability, transparency, and ethics in IR and the rest of IR research. Instead of adopting a reactionary strategy of trying to mitigate potential social harms from emerging technologies, the community should aim to proactively set the research agenda for the kinds of systems we should build inspired by diverse explicitly stated sociotechnical imaginaries. The sociotechnical imaginaries that underpin the design and development of information access technologies needs to be explicitly articulated, and we need to develop theories of change in context of these diverse perspectives. Our guiding future imaginaries must be informed by other academic fields, such as democratic theory and critical theory, and should be co-developed with social science scholars, legal scholars, civil rights and social justice activists, and artists, among others.
Connector Corner: Automate dynamic content and events by pushing a buttonDianaGray10
Here is something new! In our next Connector Corner webinar, we will demonstrate how you can use a single workflow to:
Create a campaign using Mailchimp with merge tags/fields
Send an interactive Slack channel message (using buttons)
Have the message received by managers and peers along with a test email for review
But there’s more:
In a second workflow supporting the same use case, you’ll see:
Your campaign sent to target colleagues for approval
If the “Approve” button is clicked, a Jira/Zendesk ticket is created for the marketing design team
But—if the “Reject” button is pushed, colleagues will be alerted via Slack message
Join us to learn more about this new, human-in-the-loop capability, brought to you by Integration Service connectors.
And...
Speakers:
Akshay Agnihotri, Product Manager
Charlie Greenberg, Host
Software Delivery At the Speed of AI: Inflectra Invests In AI-Powered QualityInflectra
In this insightful webinar, Inflectra explores how artificial intelligence (AI) is transforming software development and testing. Discover how AI-powered tools are revolutionizing every stage of the software development lifecycle (SDLC), from design and prototyping to testing, deployment, and monitoring.
Learn about:
• The Future of Testing: How AI is shifting testing towards verification, analysis, and higher-level skills, while reducing repetitive tasks.
• Test Automation: How AI-powered test case generation, optimization, and self-healing tests are making testing more efficient and effective.
• Visual Testing: Explore the emerging capabilities of AI in visual testing and how it's set to revolutionize UI verification.
• Inflectra's AI Solutions: See demonstrations of Inflectra's cutting-edge AI tools like the ChatGPT plugin and Azure Open AI platform, designed to streamline your testing process.
Whether you're a developer, tester, or QA professional, this webinar will give you valuable insights into how AI is shaping the future of software delivery.
Kubernetes & AI - Beauty and the Beast !?! @KCD Istanbul 2024Tobias Schneck
As AI technology is pushing into IT I was wondering myself, as an “infrastructure container kubernetes guy”, how get this fancy AI technology get managed from an infrastructure operational view? Is it possible to apply our lovely cloud native principals as well? What benefit’s both technologies could bring to each other?
Let me take this questions and provide you a short journey through existing deployment models and use cases for AI software. On practical examples, we discuss what cloud/on-premise strategy we may need for applying it to our own infrastructure to get it to work from an enterprise perspective. I want to give an overview about infrastructure requirements and technologies, what could be beneficial or limiting your AI use cases in an enterprise environment. An interactive Demo will give you some insides, what approaches I got already working for real.
LF Energy Webinar: Electrical Grid Modelling and Simulation Through PowSyBl -...DanBrown980551
Do you want to learn how to model and simulate an electrical network from scratch in under an hour?
Then welcome to this PowSyBl workshop, hosted by Rte, the French Transmission System Operator (TSO)!
During the webinar, you will discover the PowSyBl ecosystem as well as handle and study an electrical network through an interactive Python notebook.
PowSyBl is an open source project hosted by LF Energy, which offers a comprehensive set of features for electrical grid modelling and simulation. Among other advanced features, PowSyBl provides:
- A fully editable and extendable library for grid component modelling;
- Visualization tools to display your network;
- Grid simulation tools, such as power flows, security analyses (with or without remedial actions) and sensitivity analyses;
The framework is mostly written in Java, with a Python binding so that Python developers can access PowSyBl functionalities as well.
What you will learn during the webinar:
- For beginners: discover PowSyBl's functionalities through a quick general presentation and the notebook, without needing any expert coding skills;
- For advanced developers: master the skills to efficiently apply PowSyBl functionalities to your real-world scenarios.
Key Trends Shaping the Future of Infrastructure.pdfCheryl Hung
Keynote at DIGIT West Expo, Glasgow on 29 May 2024.
Cheryl Hung, ochery.com
Sr Director, Infrastructure Ecosystem, Arm.
The key trends across hardware, cloud and open-source; exploring how these areas are likely to mature and develop over the short and long-term, and then considering how organisations can position themselves to adapt and thrive.
GDG Cloud Southlake #33: Boule & Rebala: Effective AppSec in SDLC using Deplo...James Anderson
Effective Application Security in Software Delivery lifecycle using Deployment Firewall and DBOM
The modern software delivery process (or the CI/CD process) includes many tools, distributed teams, open-source code, and cloud platforms. Constant focus on speed to release software to market, along with the traditional slow and manual security checks has caused gaps in continuous security as an important piece in the software supply chain. Today organizations feel more susceptible to external and internal cyber threats due to the vast attack surface in their applications supply chain and the lack of end-to-end governance and risk management.
The software team must secure its software delivery process to avoid vulnerability and security breaches. This needs to be achieved with existing tool chains and without extensive rework of the delivery processes. This talk will present strategies and techniques for providing visibility into the true risk of the existing vulnerabilities, preventing the introduction of security issues in the software, resolving vulnerabilities in production environments quickly, and capturing the deployment bill of materials (DBOM).
Speakers:
Bob Boule
Robert Boule is a technology enthusiast with PASSION for technology and making things work along with a knack for helping others understand how things work. He comes with around 20 years of solution engineering experience in application security, software continuous delivery, and SaaS platforms. He is known for his dynamic presentations in CI/CD and application security integrated in software delivery lifecycle.
Gopinath Rebala
Gopinath Rebala is the CTO of OpsMx, where he has overall responsibility for the machine learning and data processing architectures for Secure Software Delivery. Gopi also has a strong connection with our customers, leading design and architecture for strategic implementations. Gopi is a frequent speaker and well-known leader in continuous delivery and integrating security into software delivery.
PHP Frameworks: I want to break free (IPC Berlin 2024)Ralf Eggert
In this presentation, we examine the challenges and limitations of relying too heavily on PHP frameworks in web development. We discuss the history of PHP and its frameworks to understand how this dependence has evolved. The focus will be on providing concrete tips and strategies to reduce reliance on these frameworks, based on real-world examples and practical considerations. The goal is to equip developers with the skills and knowledge to create more flexible and future-proof web applications. We'll explore the importance of maintaining autonomy in a rapidly changing tech landscape and how to make informed decisions in PHP development.
This talk is aimed at encouraging a more independent approach to using PHP frameworks, moving towards a more flexible and future-proof approach to PHP development.
Smart TV Buyer Insights Survey 2024 by 91mobiles.pdf91mobiles
91mobiles recently conducted a Smart TV Buyer Insights Survey in which we asked over 3,000 respondents about the TV they own, aspects they look at on a new TV, and their TV buying preferences.
Accelerate your Kubernetes clusters with Varnish CachingThijs Feryn
A presentation about the usage and availability of Varnish on Kubernetes. This talk explores the capabilities of Varnish caching and shows how to use the Varnish Helm chart to deploy it to Kubernetes.
This presentation was delivered at K8SUG Singapore. See https://feryn.eu/presentations/accelerate-your-kubernetes-clusters-with-varnish-caching-k8sug-singapore-28-2024 for more details.
Transcript: Selling digital books in 2024: Insights from industry leaders - T...BookNet Canada
The publishing industry has been selling digital audiobooks and ebooks for over a decade and has found its groove. What’s changed? What has stayed the same? Where do we go from here? Join a group of leading sales peers from across the industry for a conversation about the lessons learned since the popularization of digital books, best practices, digital book supply chain management, and more.
Link to video recording: https://bnctechforum.ca/sessions/selling-digital-books-in-2024-insights-from-industry-leaders/
Presented by BookNet Canada on May 28, 2024, with support from the Department of Canadian Heritage.
2. What is Excel?
Excel is a spreadsheet application software from Microsoft
Some spreadsheet programs are also available free of
charge. For example, Google Docs application suite
Beginning with Excel 2 for Windows, many versions of
Excel have appeared so far. Excel 2013 is the latest version
for Windows. [The latest Mac version of Excel is Excel
2011]
3. Spreadsheet Origin
Dan Bricklin and Bob
Frankston
Invented in 1979
VisiCalc for Apple II
Took 20 hours of work
per week from some
people and made it into
15 minutes of work
Sold and developed into
Lotus 1-2-3
4. Excel 2007 & Beyond
Excel 2007 and versions thereafter
differ significantly from earlier versions
of Excel
These versions offer a totally different
look and feel of the user interface from
earlier versions
Expanded features and capabilities with
every new release
5. Getting Familiar with Excel
Start screen
Excel interface elements
Backstage view
Workbooks and worksheets
Moving around in a worksheet
Data in Excel
Excel Formulas
Formatting
6. Start Screen
You can save your files in
OneDrive, a built-in
cloud support in Office
2013
8. The Ribbon
Common across all applications in Microsoft Office for
consistent look and feel.
File button Tabs Only one tab is active at
any time. The active tab
is highlighted
9. Tabs
Only one tab can be active. The active tab is shown
highlighted. You can make a tab active by clicking on it.
The Ribbon shows a set of panels below the tabs row
The set of panels shown corresponds to the active tab.
If you make another tab active, the panel set changes
Each panel shows a group of related buttons or icons
Some tabs appear only based upon certain actions.
Such tabs are known as contextual tabs
21. Mini toolbar: gives quick
access to frequently used
formatting command
buttons
Shortcut menu appears
upon right clicking the
pointer. The actual list of
commands in the shortcut
menu varies based on
context
Mini Toolbar and Shortcut Menu Bar
Mini Toolbar & Shortcut Menu Bar
26. Workbooks and Worksheets
An Excel workbook is made
up of worksheets and chart
sheets. The chart sheets are
special sheets for storing
charts
The number of worksheets
that a workbook can hold is
limited only by the
computer memory. By
default, Excel 2013 opens a
new workbook with only
one worksheet with the
default name Sheet1.
(Previous versions had
three default worksheets)
28. Workbooks and Worksheets
Although many workbooks can be open at any time, only one
workbook is designated as the active workbook. Similarly only
one worksheet can be the active worksheet at any time
When you open a new Excel file, it is given the default name of
Book1. If you open another new file, it will open with name as
Book2.
29. Worksheet Specs
Every Excel worksheet has 16,384 columns and
1,048,576 rows
The intersection of a row and a column is called a cell
The columns are numbered from A to XFD, and rows
from 1 to 1,048,576
30. Mouse Pointer Appearance
Mouse pointer changes its appearance to
indicate what action can be performed
Arrow: select item from the Ribbon or scrolling or
other commands
I-beam: type text in formula bar
White plus sign: as the pointer moves over worksheet
surface
Small black arrow: when the pointer is over the
column or row indicators to select a column or a row
A cross with double arrow: when placed at the
boundary of a selected column or row to change
column width or row height
31. Cells
Cell reference
A cell is referred by the letter for the column in which the cell is located
followed by the number of the row holding the cell. Thus, B5 refers to
the cell in Column B located in the fifth row. AZ23 means a cell in
column AZ and row 23. Cell reference is also known as cell address.
32. Cells
A cell must be active if we wish to enter data into it. An
active cell has a thick dark boundary, called cell selector,
along it.
The bottom right corner of the cell selector is marked by a
small square, called the fill handle
36. Renaming, Inserting, and Deleting
Worksheets
The shortcut menu of commands upon right-clicking a
sheet tab
Excel permits worksheet names
limited to 31 characters. Blank
spaces are permitted in worksheet
names.
To rename a sheet, double-click the
sheet tab and enter the new name.
38. Selecting a Group of Cells
You can select a group of cells by selecting the top left cell of
the group and then dragging the pointer over the cells you
want to select
To select a full row, click on the row number. Do the same to
select a column
To select multiple rows, select the first row and then drag
the pointer over row numbers to the desired row. Similar
action for multiple columns
A group of selected cells. The first cell in the group in white is the
active cell.
39. Excel Data Types
Data types implies the types of cell
entries Excel recognizes
Three different types of entries
Text or label
Value
Formula
40. Text
Any combination of letters, numbers, and special
characters
Cannot be used for calculations
Left aligned in cell (default setting)
Examples:
Names of places/persons
Telephone number
Security number
Column headings, for example Monthly sales
42. Value Entries
Numbers, dates, times
Can be used for calculations
Right justified in cell (default setting)
Examples:
378 11/29/94 4:40:31 (9876)
Number Date Time Negative Number
3/15/08 is a recognized as a valid date and
hence a valid value entry
15/15/08 is treated as a text entry because
15/15/08 is not a valid date
43. Value Entries
Suppose you have an order number 10-16-70. Excel
will incorrectly treat it as a valid date (October 16,
1970). In such cases you should enter ‘10-16-70 to let
Excel know that it is not a date
44. Formulas
A cell entry beginning with an equal sign (=) is
treated as a formula in Excel
A formula is an expression telling Excel to perform
an operation
Excel allows many types of operations; however,
we shall consider only arithmetic operations for
now
Examples
=159*3.7
=A1+A2+A3
=(2*A1-B1)*C1
=A1/B1+C1^2.5
Operator
Operands
48. Parentheses Nesting
Nesting allows you to tell Excel how a formula should
be evaluated. For example in the following formula, the
expression within blue parentheses will be evaluated
first followed by green and red parentheses
=(B2*(D2^(C2−2)+A2/C2)+6.75)*B4
49. Worksheet Functions
Excel provides a large number of worksheet
functions or simply called functions. We will look
at them later.
Some examples of formulas with functions are:
=SQRT(A1)+5
=SUM(A1,B1,C1)
=SUM(A1,B1,C1)/(SQRT(A1)+5)
51. Formatting
Controls how information in cells is displayed
Two aspects of formatting
Stylistic formatting
Governs font type, size, color, cell background and border style
etc
Numeric formatting
Governs how a value appears in a cell. For example, the
number of digits after a decimal point
54. Creating a Worksheet
We want to create a worksheet that:
Shows name, id, and the semester of a student at a
university
Shows the courses taken by the student
Shows the credit hours and the grades obtained
Calculates the grade point average (GPA)
The final worksheet should look similar to as shown in
the next slide
56. Step 1: Starting Excel
Start Excel. You can start Excel by clicking on the Excel
icon on your desktop. Alternately, click on the Start
button at the bottom left of your Windows desktop,
and then point to All Programs to display the programs
your computer has. Next, point to Microsoft Office and
click on Excel to start it.
Excel will open a new workbook with the default name
Book1 and cell A1 as the active cell.
57. Step 2: Formatting Cells A1 to F4
Select cell A1, click the left button on the mouse
and drag it over cells in columns A-F and row 1-4.
Your worksheet will appear as shown below
58. Step 3: Merge Cells A1 to F4
We will be entering the university name in cells A1 to
F4. So we need to merge these cells to act as one large
cell
Click the Merge & Center button in the Alignment
panel
59. Step 4: Set Wrap Text & Alignment
Click the Wrap Text button to ensure that any text entered
in the merged cells will be wrapped around
Click the Center button in the Alignment panel to instruct
Excel that you want text horizontally centered
Click the Middle Align button to vertically center the text
as well
60. Step 5: Setting Font and Fill Color
Click on the Font Selection button in the Font panel
and select Arial font.
Set Font size to 24 via the Font Size button
Select Bold as the font style
Select a background of your liking by clicking the Fill
Color button
61. Step 6: Enter Information
Enter a name for the university in the merged cells
Enter the student name in cell A5. Enter the ID and
semester information in cells A6 and E5
Enter the headings in cells A7 to E7
Enter course numbers, titles, credits, and grades in
cells A9 to D13. You can makeup your own courses,
credits, and grades, if you desire. You might need to
increase the widths of columns A and B. You can do so
by dragging the right boundaries of columns A and B
62. Entering/Editing Cell Entries
Select cell
Click in formula bar or press function key F2
Enter/Edit cell content
Type in the desired information
Backspace key (removes character on left)
Delete key (removes character on right)
Highlight by dragging over characters to change, then
type correction (will replace what is highlighted)
Press Enter key
63. Step 7: Change the worksheet
Name
Right click on Sheet1 tab and select Rename
from the shortcut menu
Enter a new name, for example Gradesheet
64. Step 8: Writing Formulas
Points calculation for a course
Remember, the points are given by multiplying the credits with
the numerical grade in the course
Thus for cell E9 which is suppose to show points for the
course in cell A9, the formula will be =C9*D9. We select cell E9
and enter this formula in the formula bar and press Enter. Cell
E9 should now show the result
Write similar formulas for cells E10 to E13
65. Step 8: Writing Formulas (Contd.)
Formula for Total Credit Hours in cell C15
The total credit hours are given by adding credit hours
from different courses
Thus for cell C15, the formula is
=C9+C10+C11+C12+C13. You can also do the
summation by using the built-in Excel function SUM and
write the formula as =SUM(C9,C10,C11,C12,C13)
Important: Make sure you do not have a
space preceding the equal sign while
entering a formula
66. Step 8: Writing Formulas (Contd.)
Formula for GPA in cell E15
The GPA is calculated by dividing the total points by the total
credit hours
Thus for cell E15, the formula is
=(E9+E10+E11+E12+E13)/C15
Note, the use of parenthesis to instruct Excel to add points
first. Also note the use of already calculated total credit hours
in C15
You will see that Excel shows the result with many
places after the decimal. Use the Decrease Decimal
button to show only two places after the decimal
67. Step 9: Saving Your Worksheet
Click on the File tab and select Save As command
Select the Excel Workbook option
In the ensuing dialog box, enter an appropriate name for
your workbook and click Save
You will notice the name you have given to your
workbook now appears in the title bar at the top
replacing the default name Book1
68. Printing a Worksheet
Click the Office Button and select the Print command
Select the print settings through the Print dialog box
Use the Print Preview option to preview your sheet
before printing
69. Printing a Worksheet
You can also use the View tab for previewing and
printing
Click on the View tab to make it active
Click the Page Layout button in the Workbook Views panel
Click the line Click to add header and type the desired header
70. Worksheet Templates
A template is an Excel file that is already formatted, has
formulas, and cells marked for data entry. You fill in
your specific information and cell values to create a
working sheet from it
Excel comes with several templates. To open a
template, select New from the File menu and then
select the desired in the Backstage window
Microsoft Office Online also provides many templates
72. Excel 2013 File Formats
Several formats are available
Default format is .xlsx
Saving in .xls (Excel 2003) format is advised when you
are sharing your files with others
Excel templates have .xltx format
Workbooks with macros are saved with .xlsm
extension
73. Customizing Excel Settings
Click File > Option
Several categories of options are available for
customization
Some examples of options:
Turn on/off the Mini Toolbar
Customize Excel window
Change the default font setting
Calculation mode
76. Calculation Modes
Excel automatically updates the results of formulas
as you make changes in cells referenced in
formulas
You can also set Excel to manual calculation mode.
In this mode Excel updates the calculation results
only after you press the function key F9
You can do this in Excel Options window by
selecting the Formula category of options
78. Formula View
In the Formula View, Excel shows cell formulas in
place of showing the formula results
The Formula View is good for sharing a worksheet to
show how the calculations are being performed
To select the Formula View, click on the Formulas tab,
and then click on Show Formulas button in the
Formula Auditing panel. You can do the same via Excel
Options also
80. Seeking Help in Excel
The question mark
in the upper right
corner of the Ribbon
stands for Excel
Help. You can also
invoke Help by
pressing the function
key F1
Excel responds by
opening the Excel
Help window where
you can browse
through help topics
or do a search
81. Adding Comments to Cells
It is a good practice to add comments to cells with
formulas for better understanding and sharing of
worksheets
To add comments to a cell
Select the cell
Make the Review tab active
Click the New Comments button in the Comments panel
Enter the comments and click on any other cell