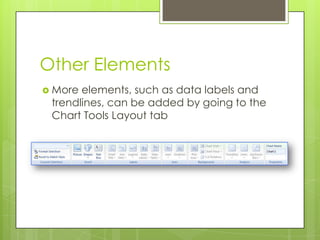
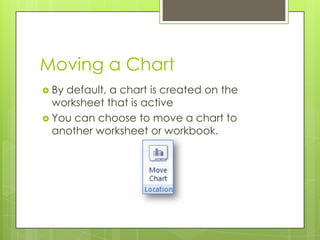
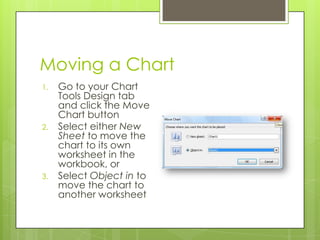
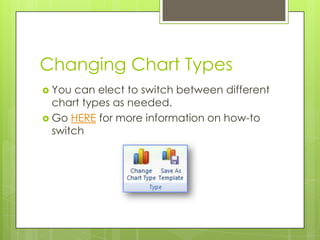
Excel 2007
Objective 4: Presenting
Data Visually
Lesson Skills
 By
   the end of the lesson you should be
 familiar with how-to:
    Insert and delete chart elements such as
     titles, legends, percentages, etc.
    Move a chart to a different location, and
    Change between chart types
Inserting and Deleting
Chart Elements
Chart Axis Title
Chart Title
Chart Legend
Titles
 Titles
       make a chart easier to understand
  by providing the viewer labels that define
  the data represented.
 Go here to access more information
  about chart titles
Legends
 Legends  are boxes that identify the
  patterns or colors that are assigned to the
  data series or categories in a chart.
 To read more about how-to insert
  legends, go HERE
Other Elements
 More elements, such as data labels and
 trendlines, can be added by going to the
 Chart Tools Layout tab
Moving a Chart
Moving a Chart
 Bydefault, a chart is created on the
  worksheet that is active
 You can choose to move a chart to
  another worksheet or workbook.
Moving a Chart
1.   Go to your Chart
     Tools Design tab
     and click the Move
     Chart button
2.   Select either New
     Sheet to move the
     chart to its own
     worksheet in the
     workbook, or
3.   Select Object in to
     move the chart to
     another worksheet
Changing Chart Types
 You  can elect to switch between different
  chart types as needed.
 Go HERE for more information on how-to
  switch
Practice Activity
 Open     your workbook from the first
  presentation
 Practice adding, removing and modifying
  titles, legends and other elements on the
  chart
 Practice moving the chart to different
  locations
 Practice changing chart types

Formatting Charts

  • 1.
    Excel 2007 Objective 4:Presenting Data Visually
  • 2.
    Lesson Skills  By the end of the lesson you should be familiar with how-to:  Insert and delete chart elements such as titles, legends, percentages, etc.  Move a chart to a different location, and  Change between chart types
  • 3.
    Inserting and Deleting ChartElements Chart Axis Title Chart Title Chart Legend
  • 4.
    Titles  Titles make a chart easier to understand by providing the viewer labels that define the data represented.  Go here to access more information about chart titles
  • 5.
    Legends  Legends are boxes that identify the patterns or colors that are assigned to the data series or categories in a chart.  To read more about how-to insert legends, go HERE
  • 6.
    Other Elements  Moreelements, such as data labels and trendlines, can be added by going to the Chart Tools Layout tab
  • 7.
  • 8.
    Moving a Chart Bydefault, a chart is created on the worksheet that is active  You can choose to move a chart to another worksheet or workbook.
  • 9.
    Moving a Chart 1. Go to your Chart Tools Design tab and click the Move Chart button 2. Select either New Sheet to move the chart to its own worksheet in the workbook, or 3. Select Object in to move the chart to another worksheet
  • 10.
    Changing Chart Types You can elect to switch between different chart types as needed.  Go HERE for more information on how-to switch
  • 11.
    Practice Activity  Open your workbook from the first presentation  Practice adding, removing and modifying titles, legends and other elements on the chart  Practice moving the chart to different locations  Practice changing chart types