This document provides an overview and instructions for creating and formatting pivot tables and pivot charts in Excel. It discusses how to:
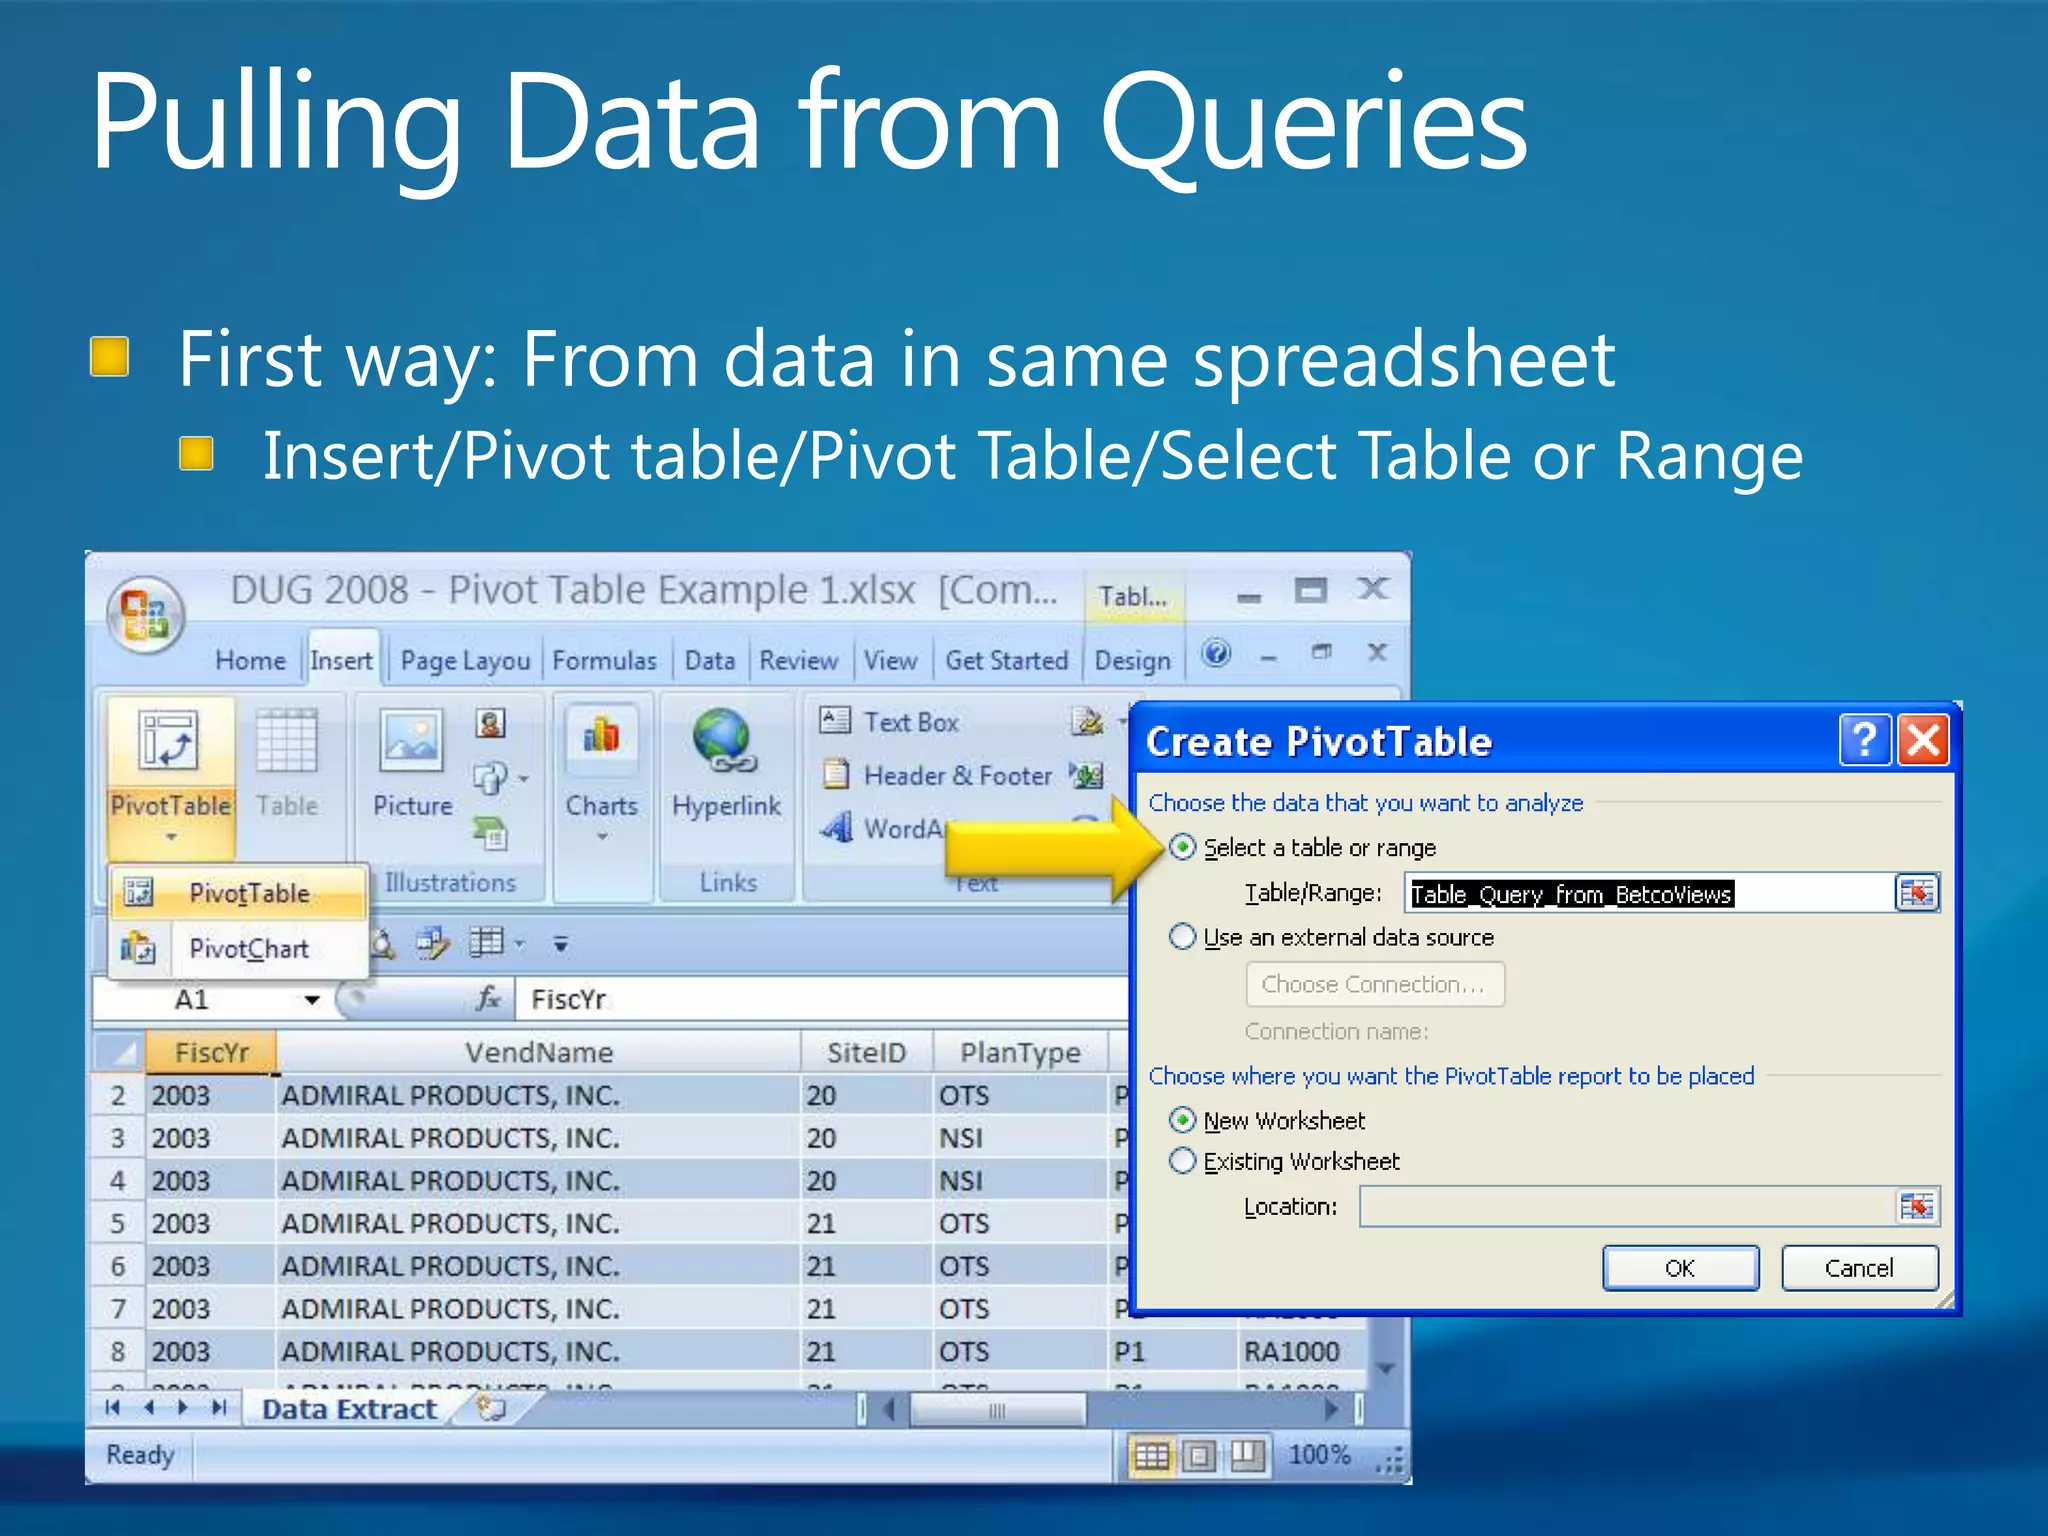
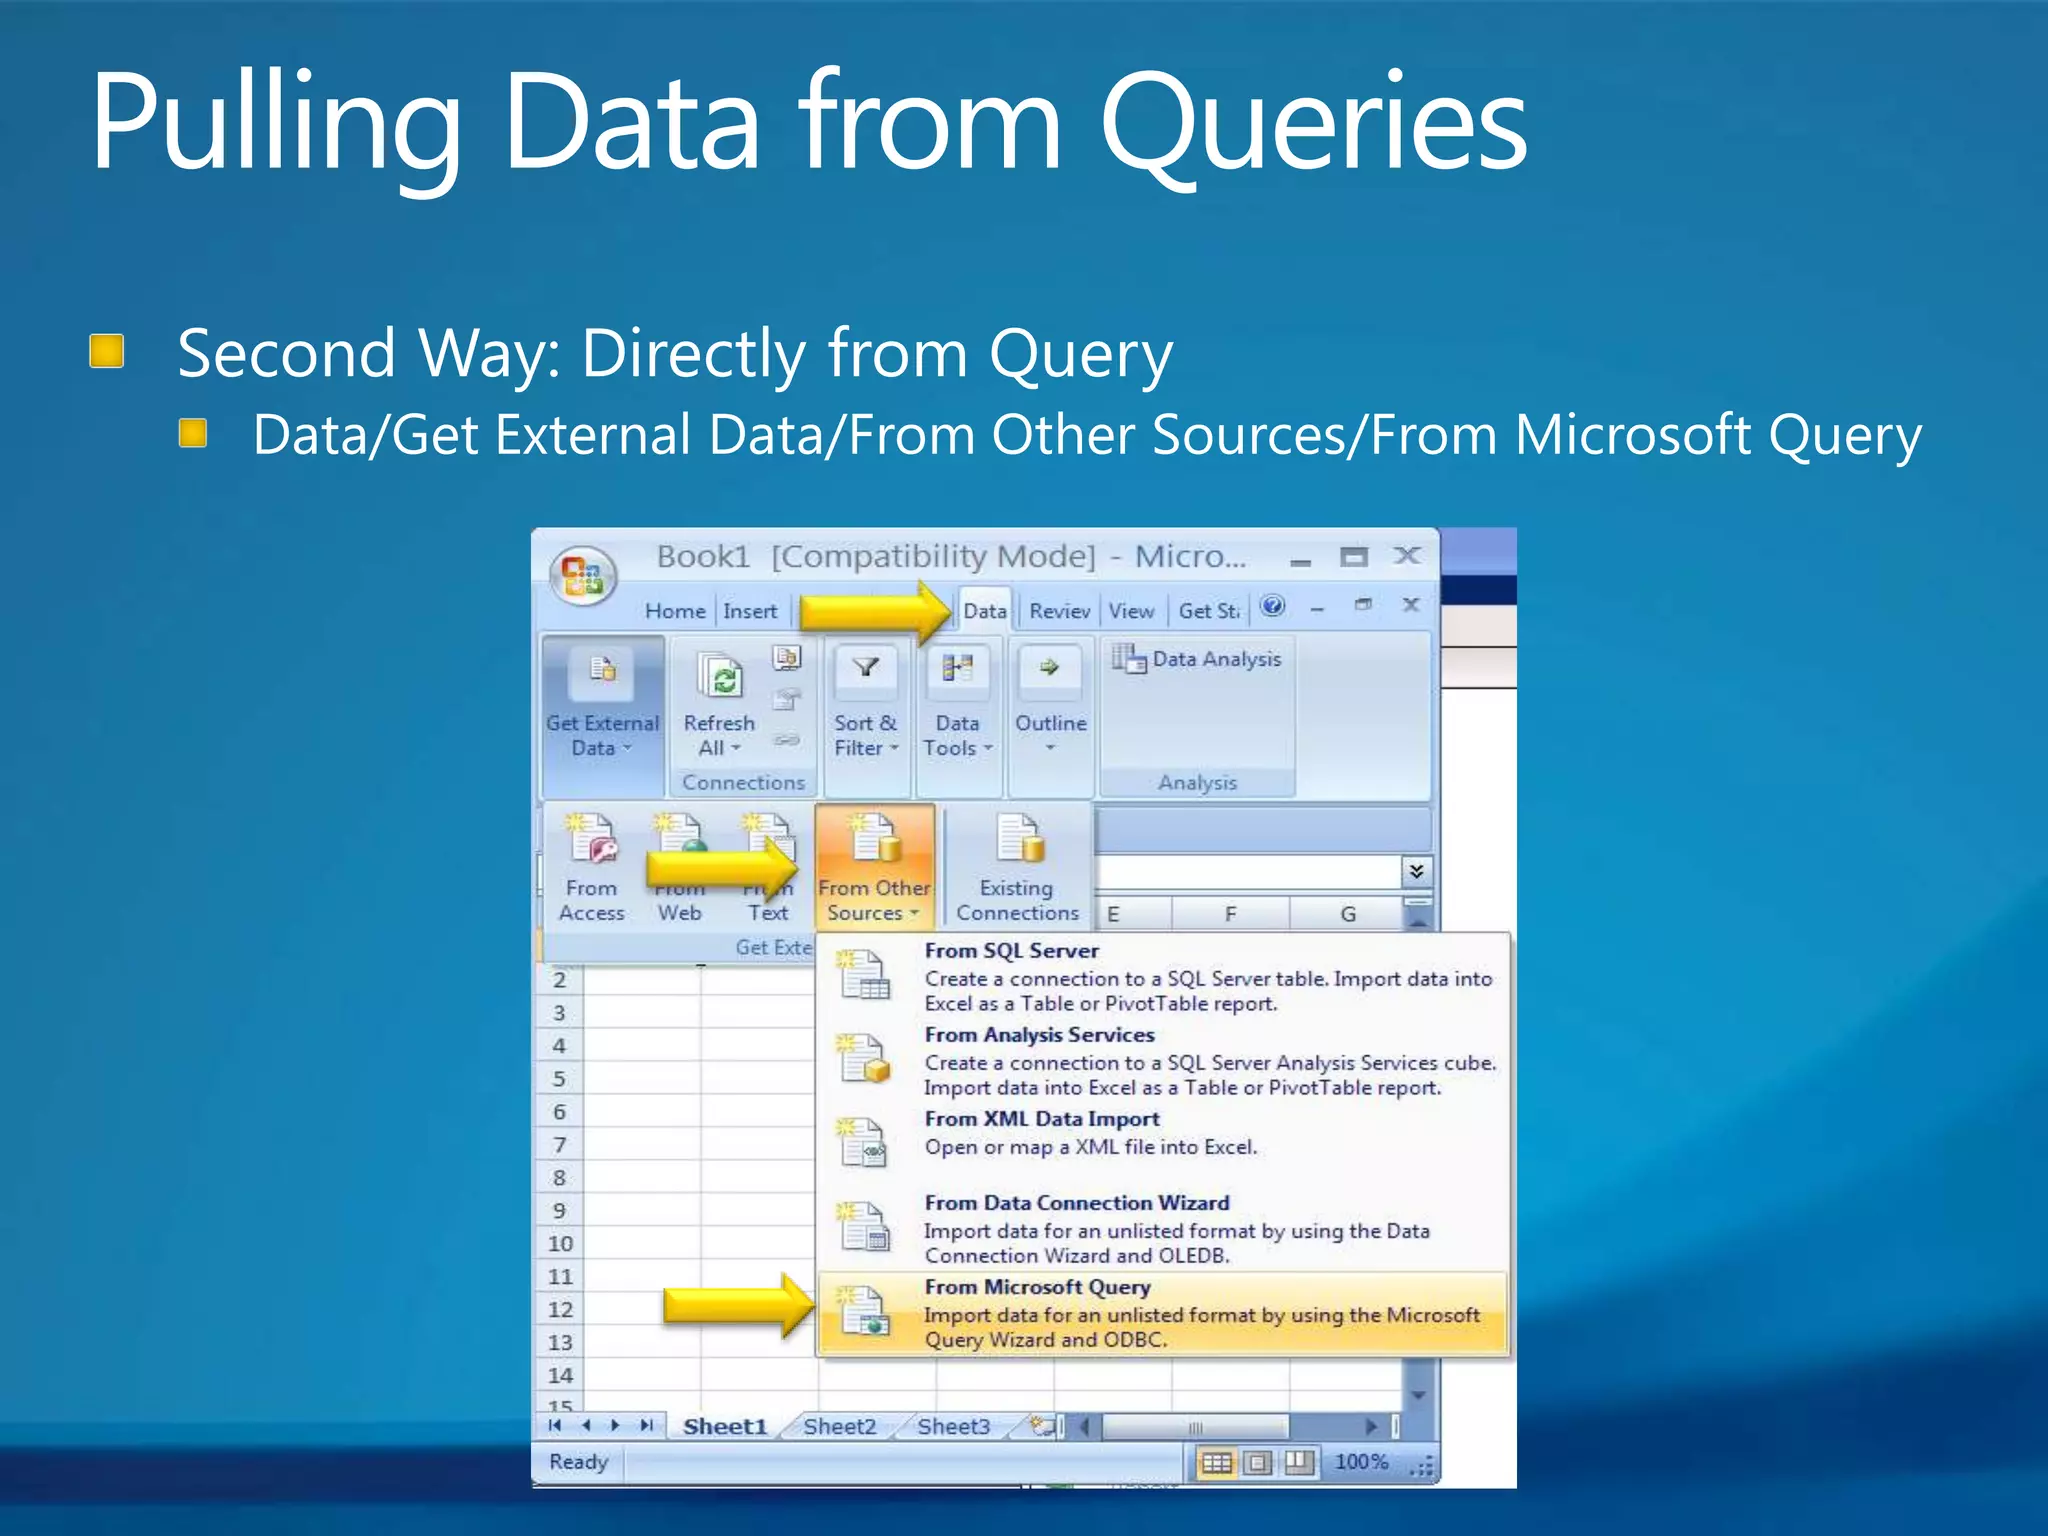
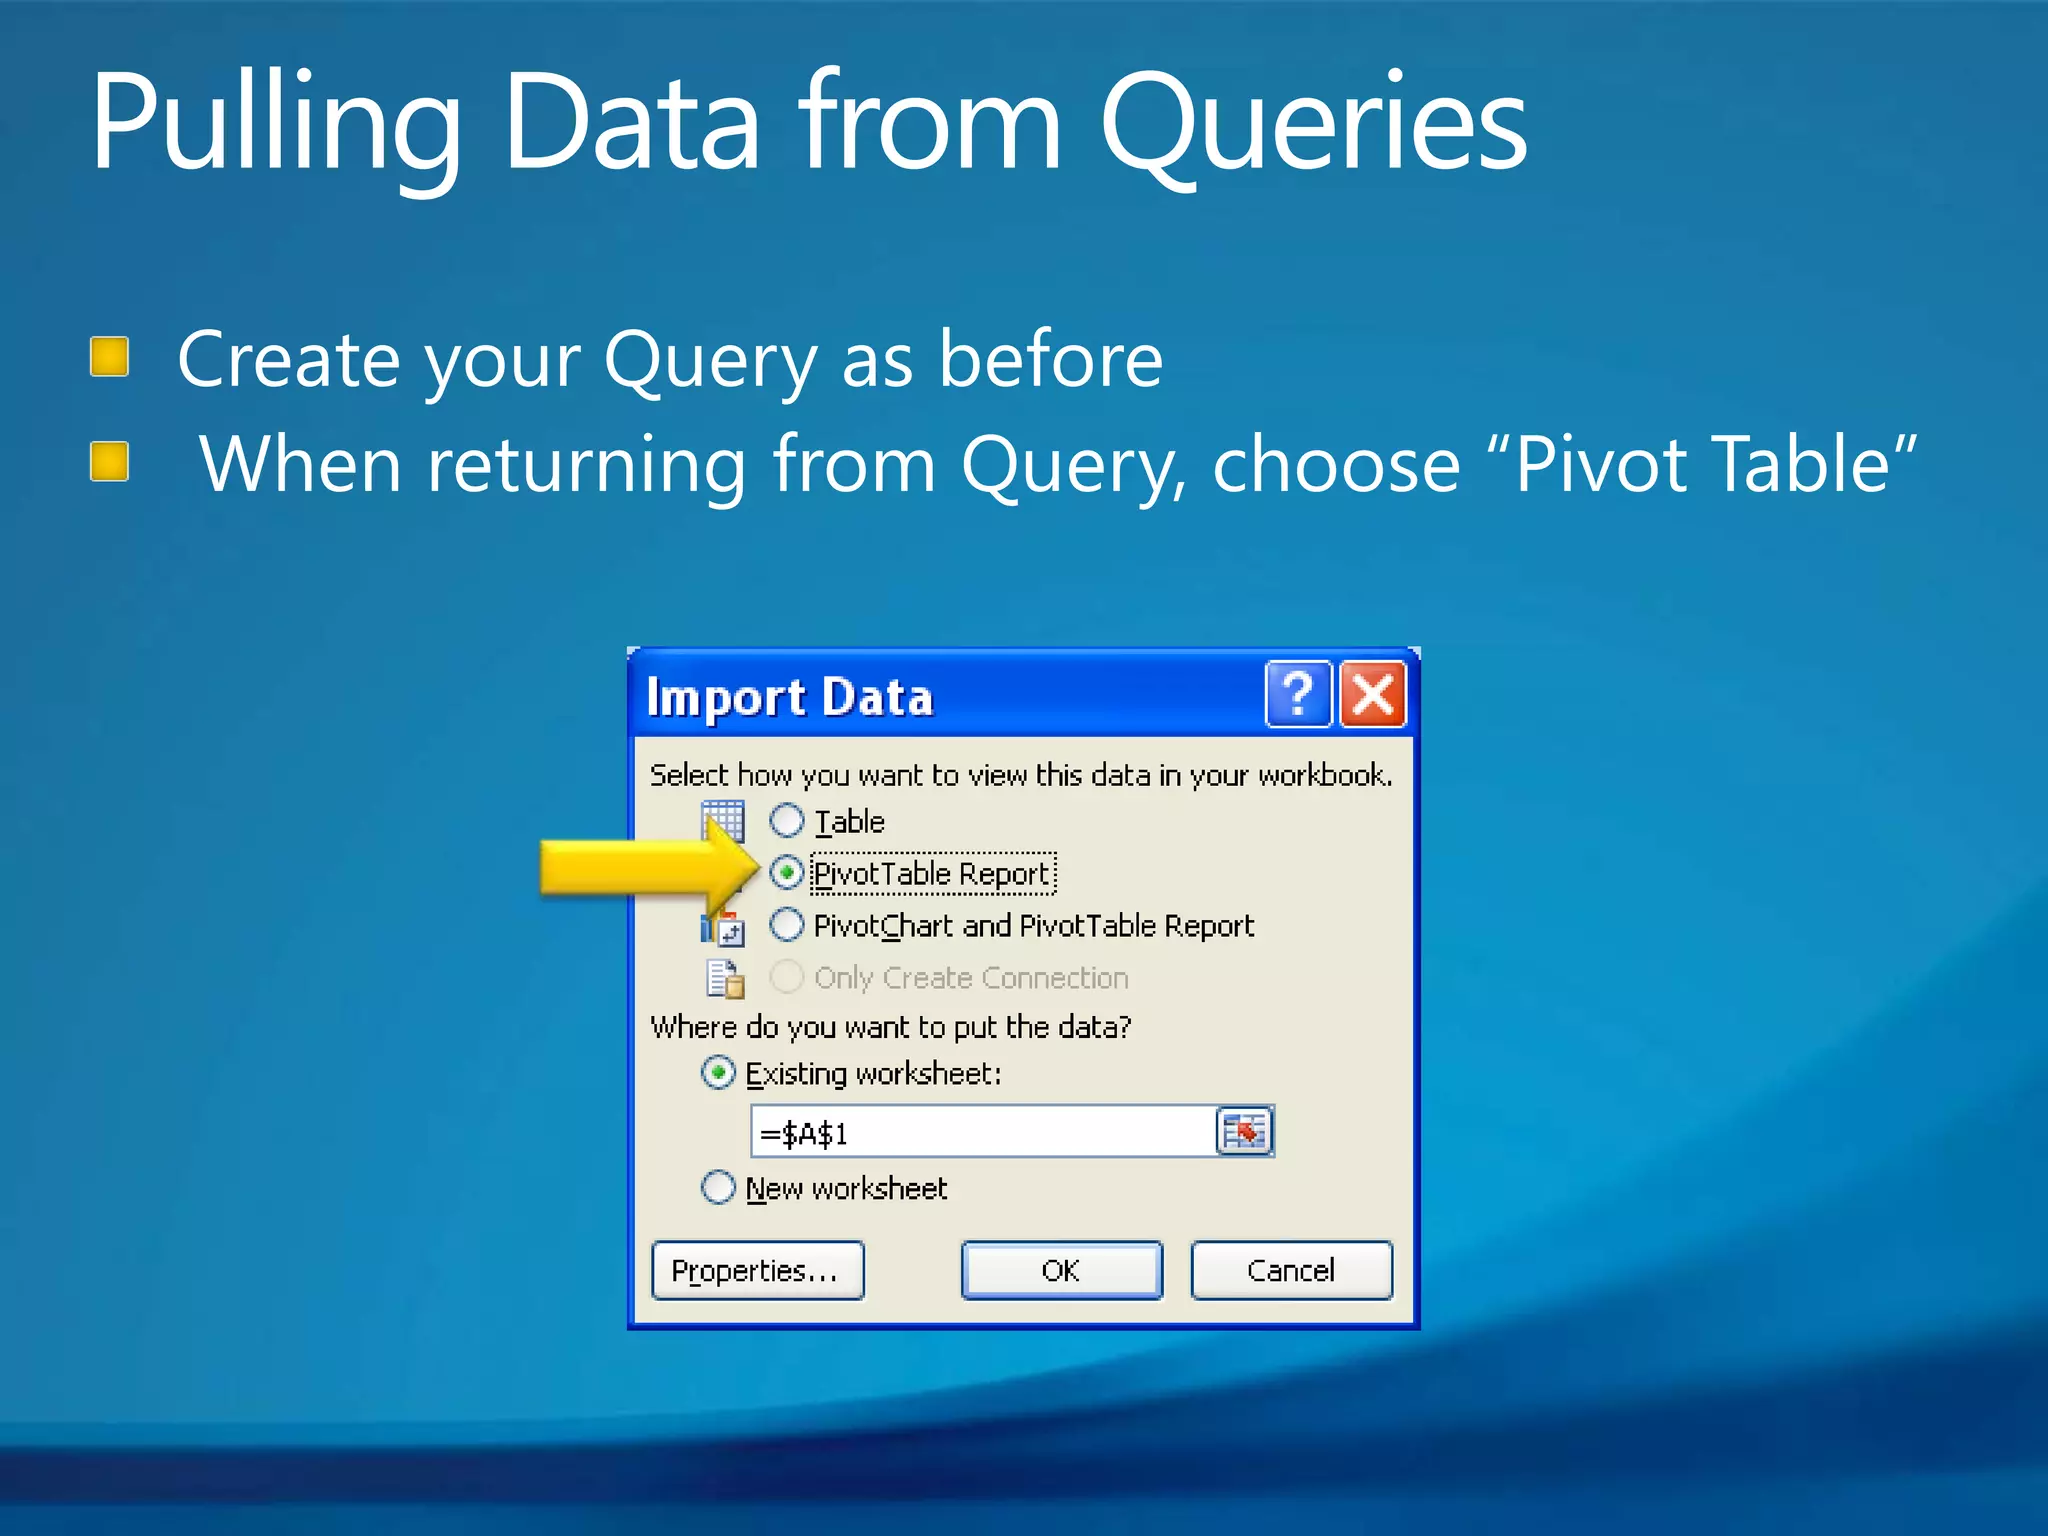
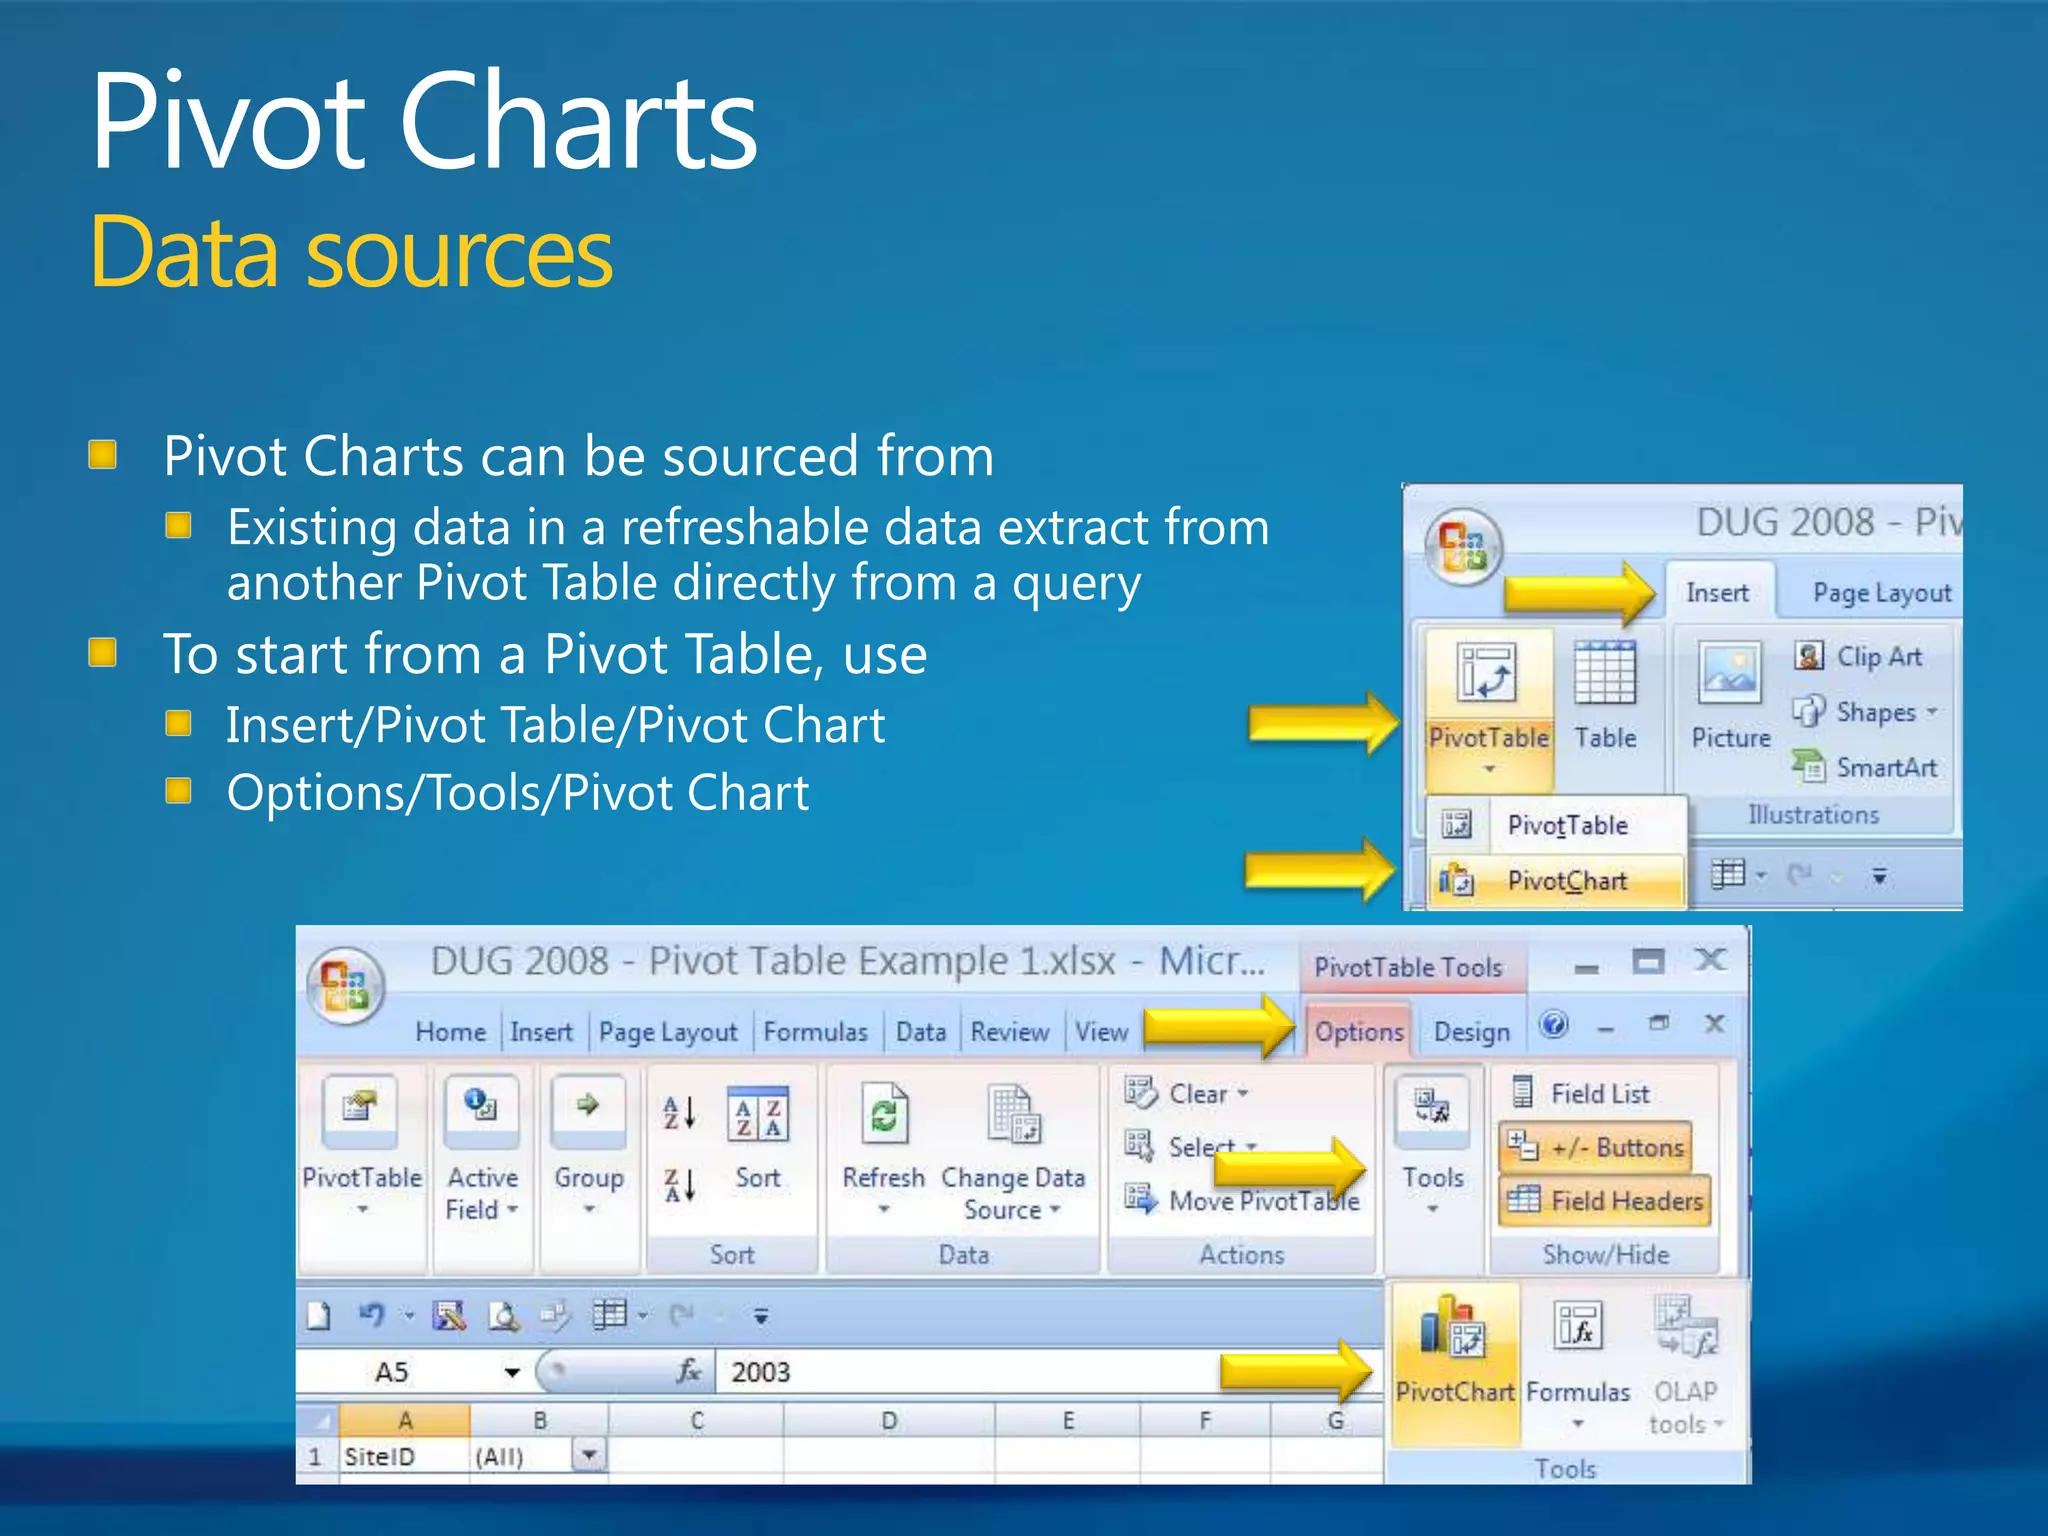
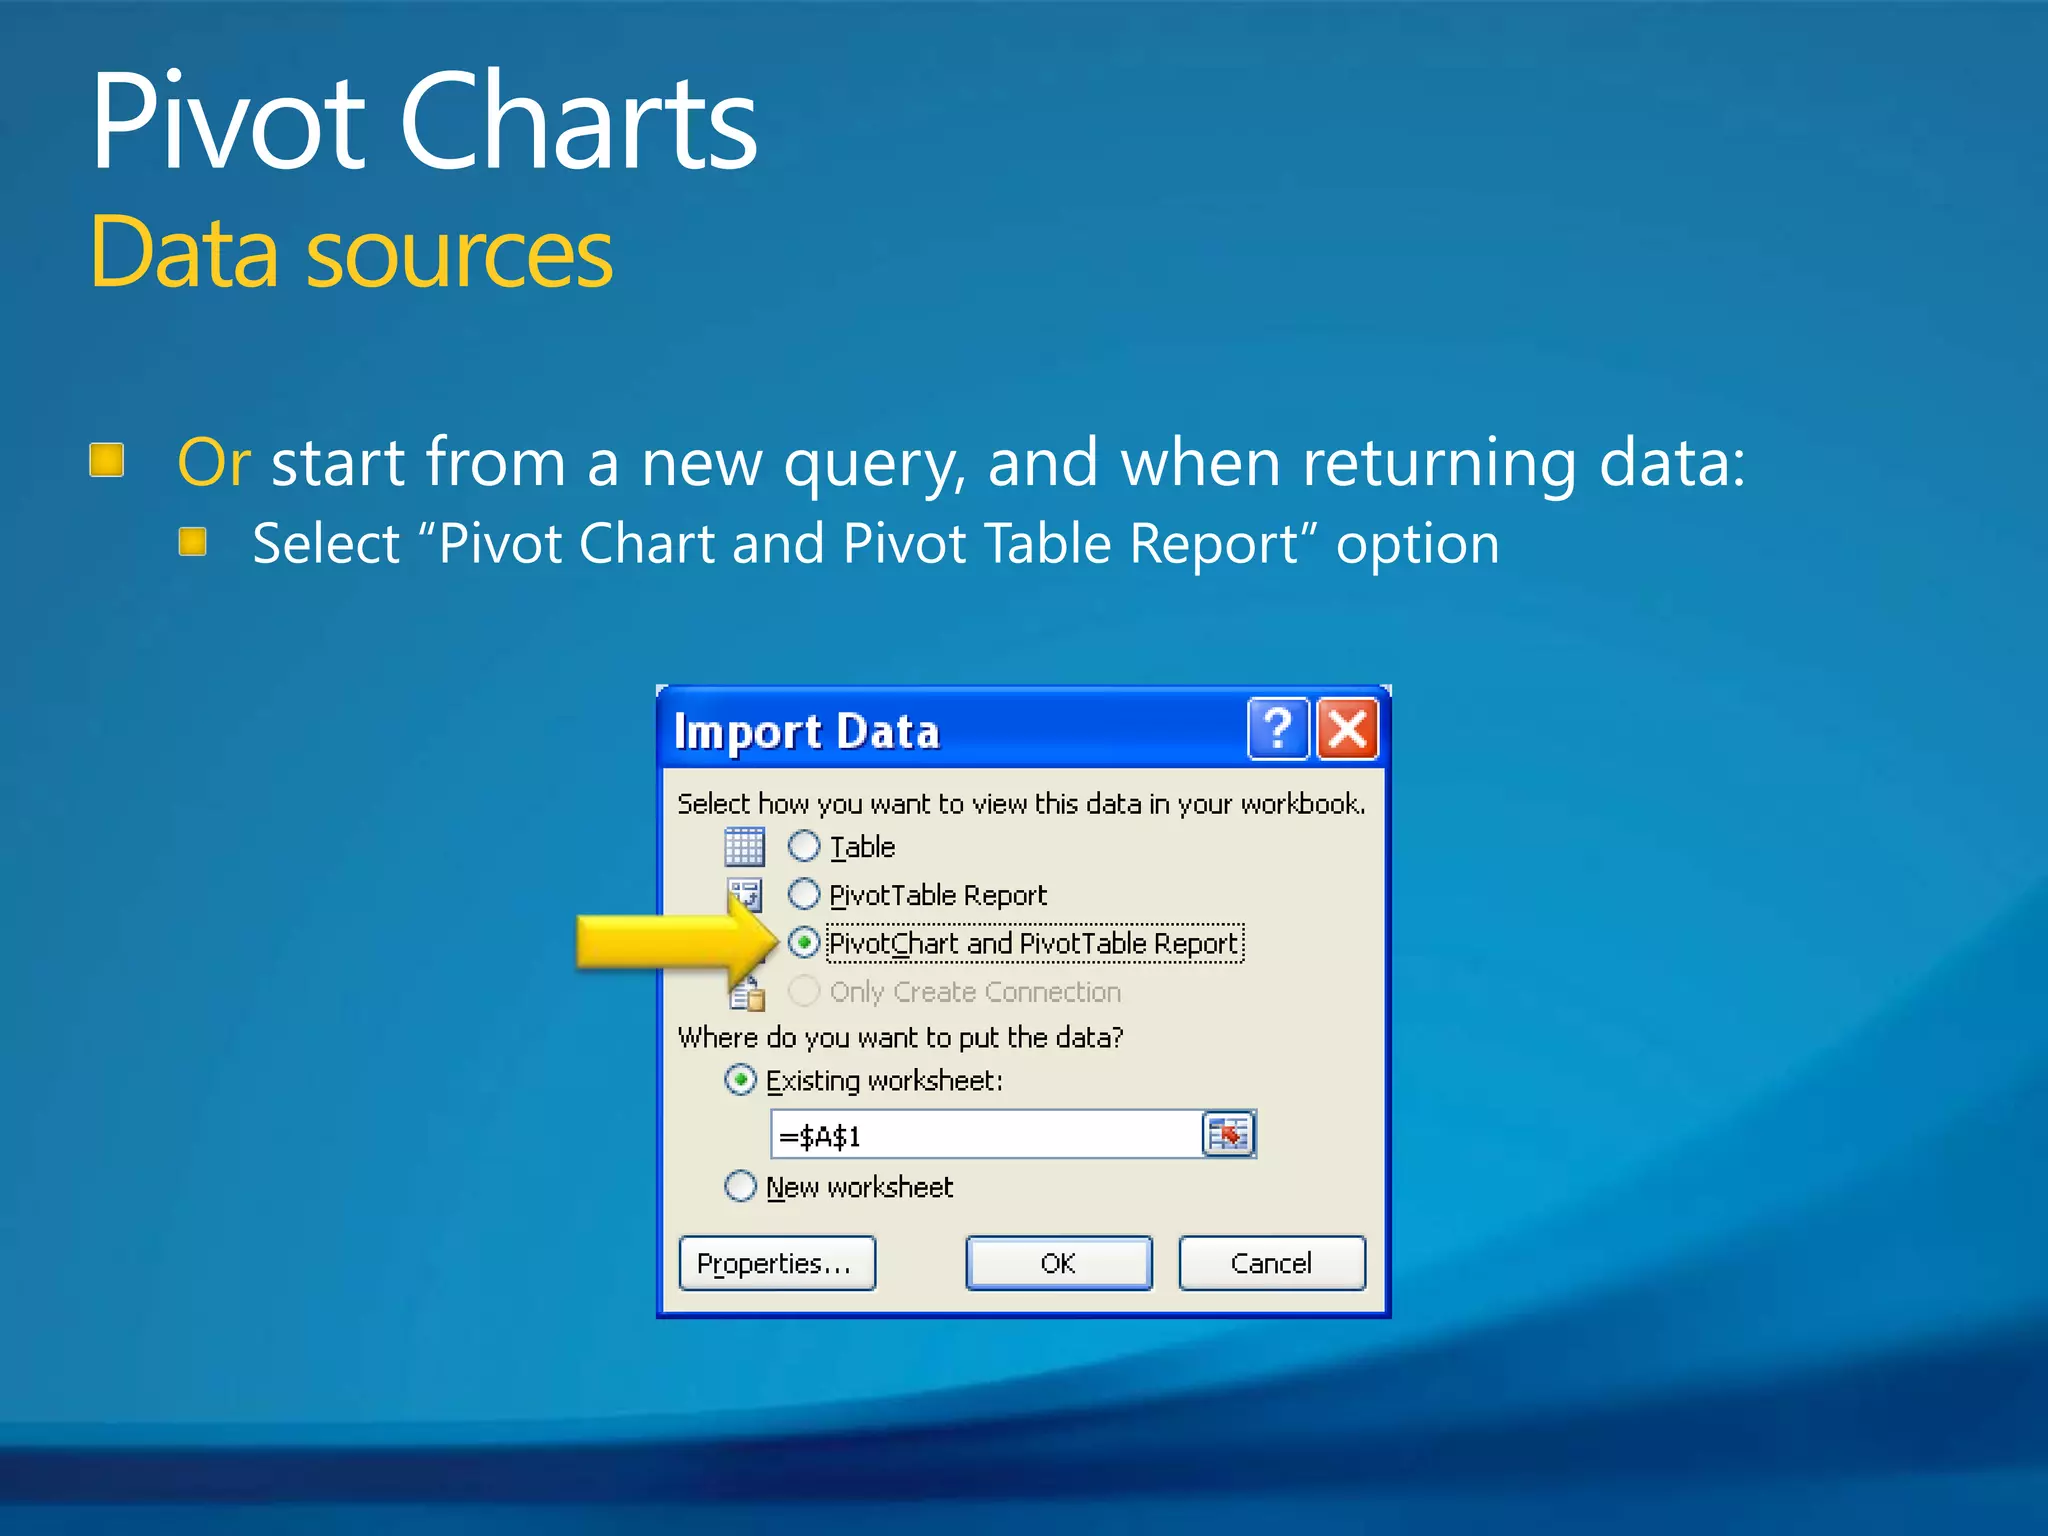
1. Pull data from Excel queries or directly from a Microsoft Query to build a pivot table or pivot chart.
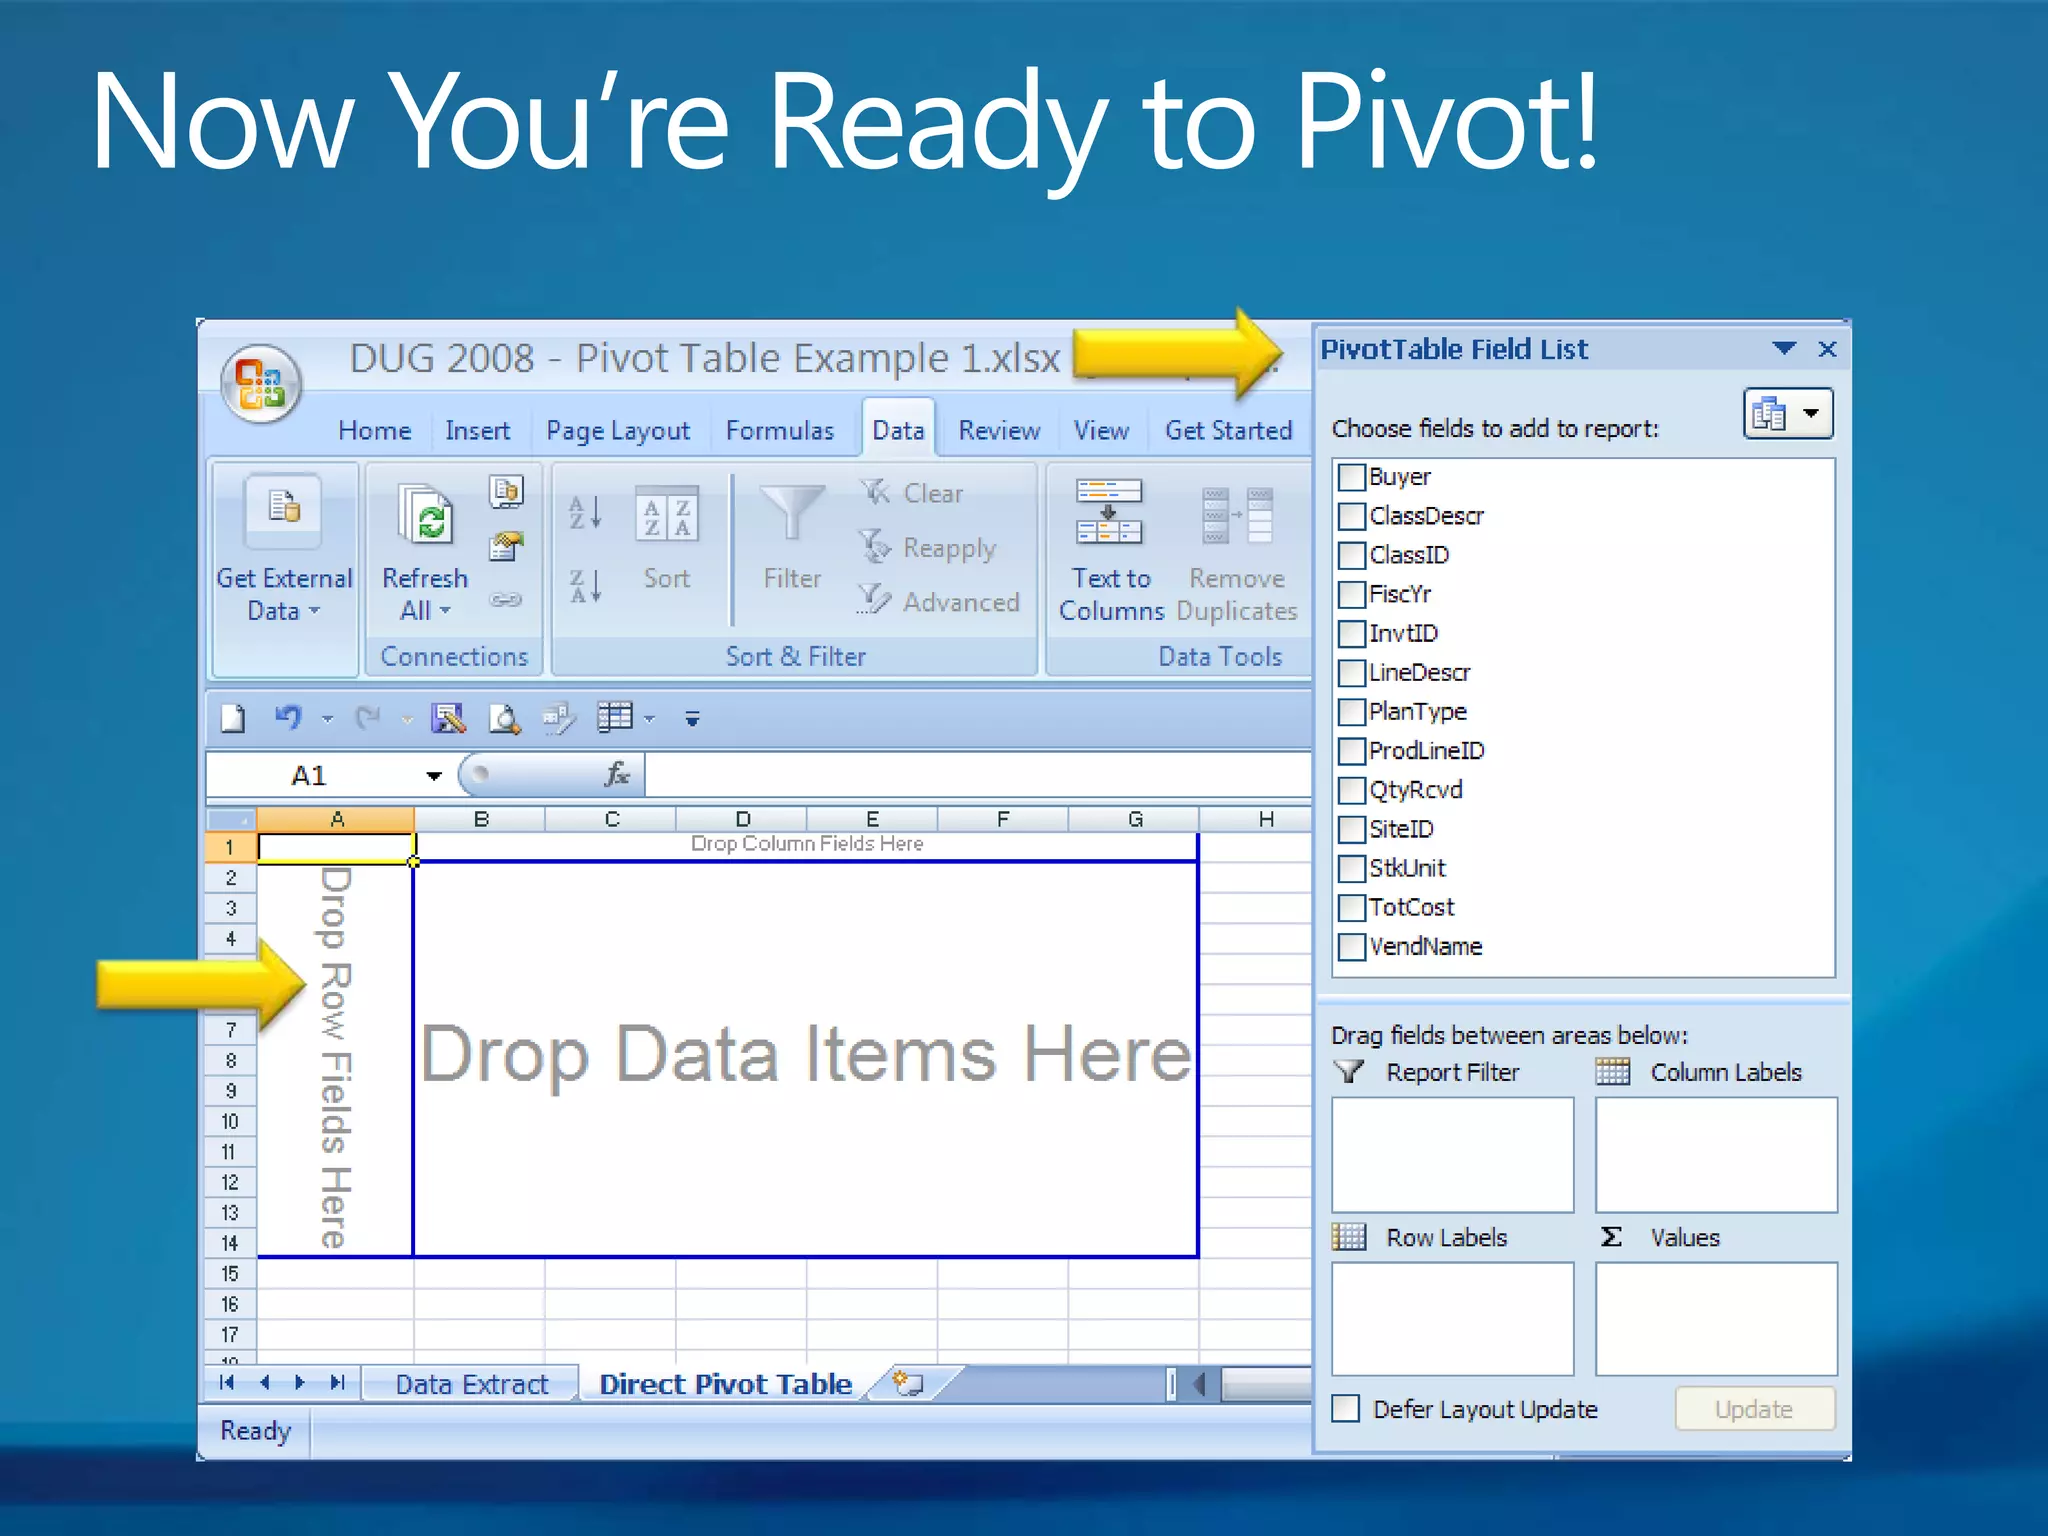
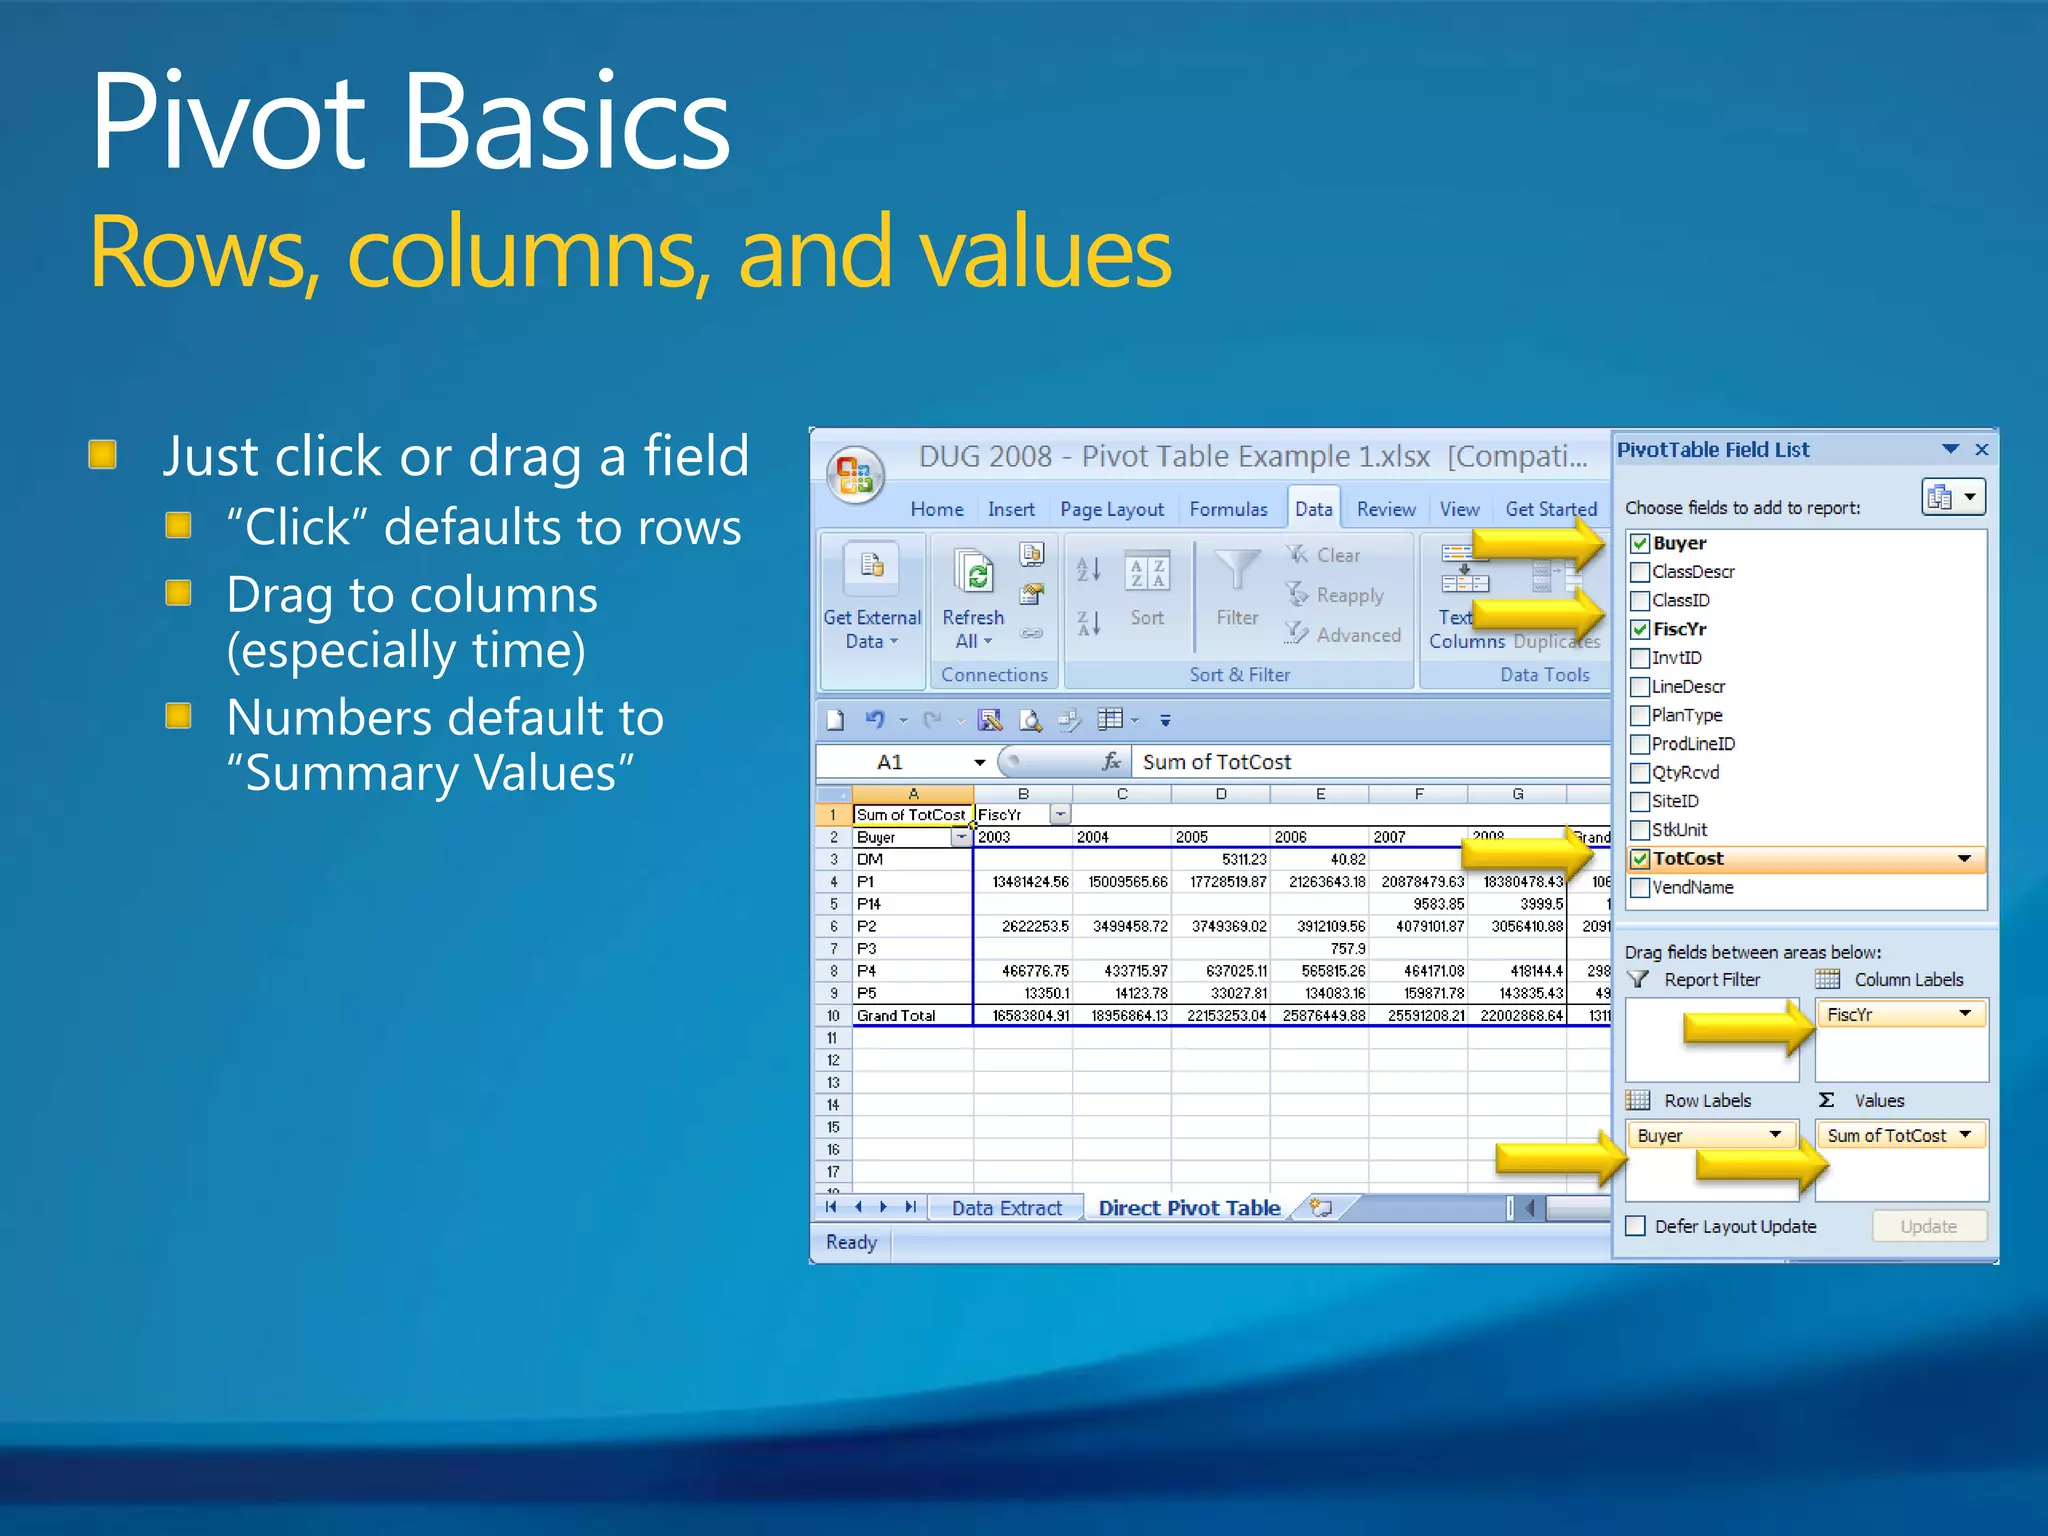
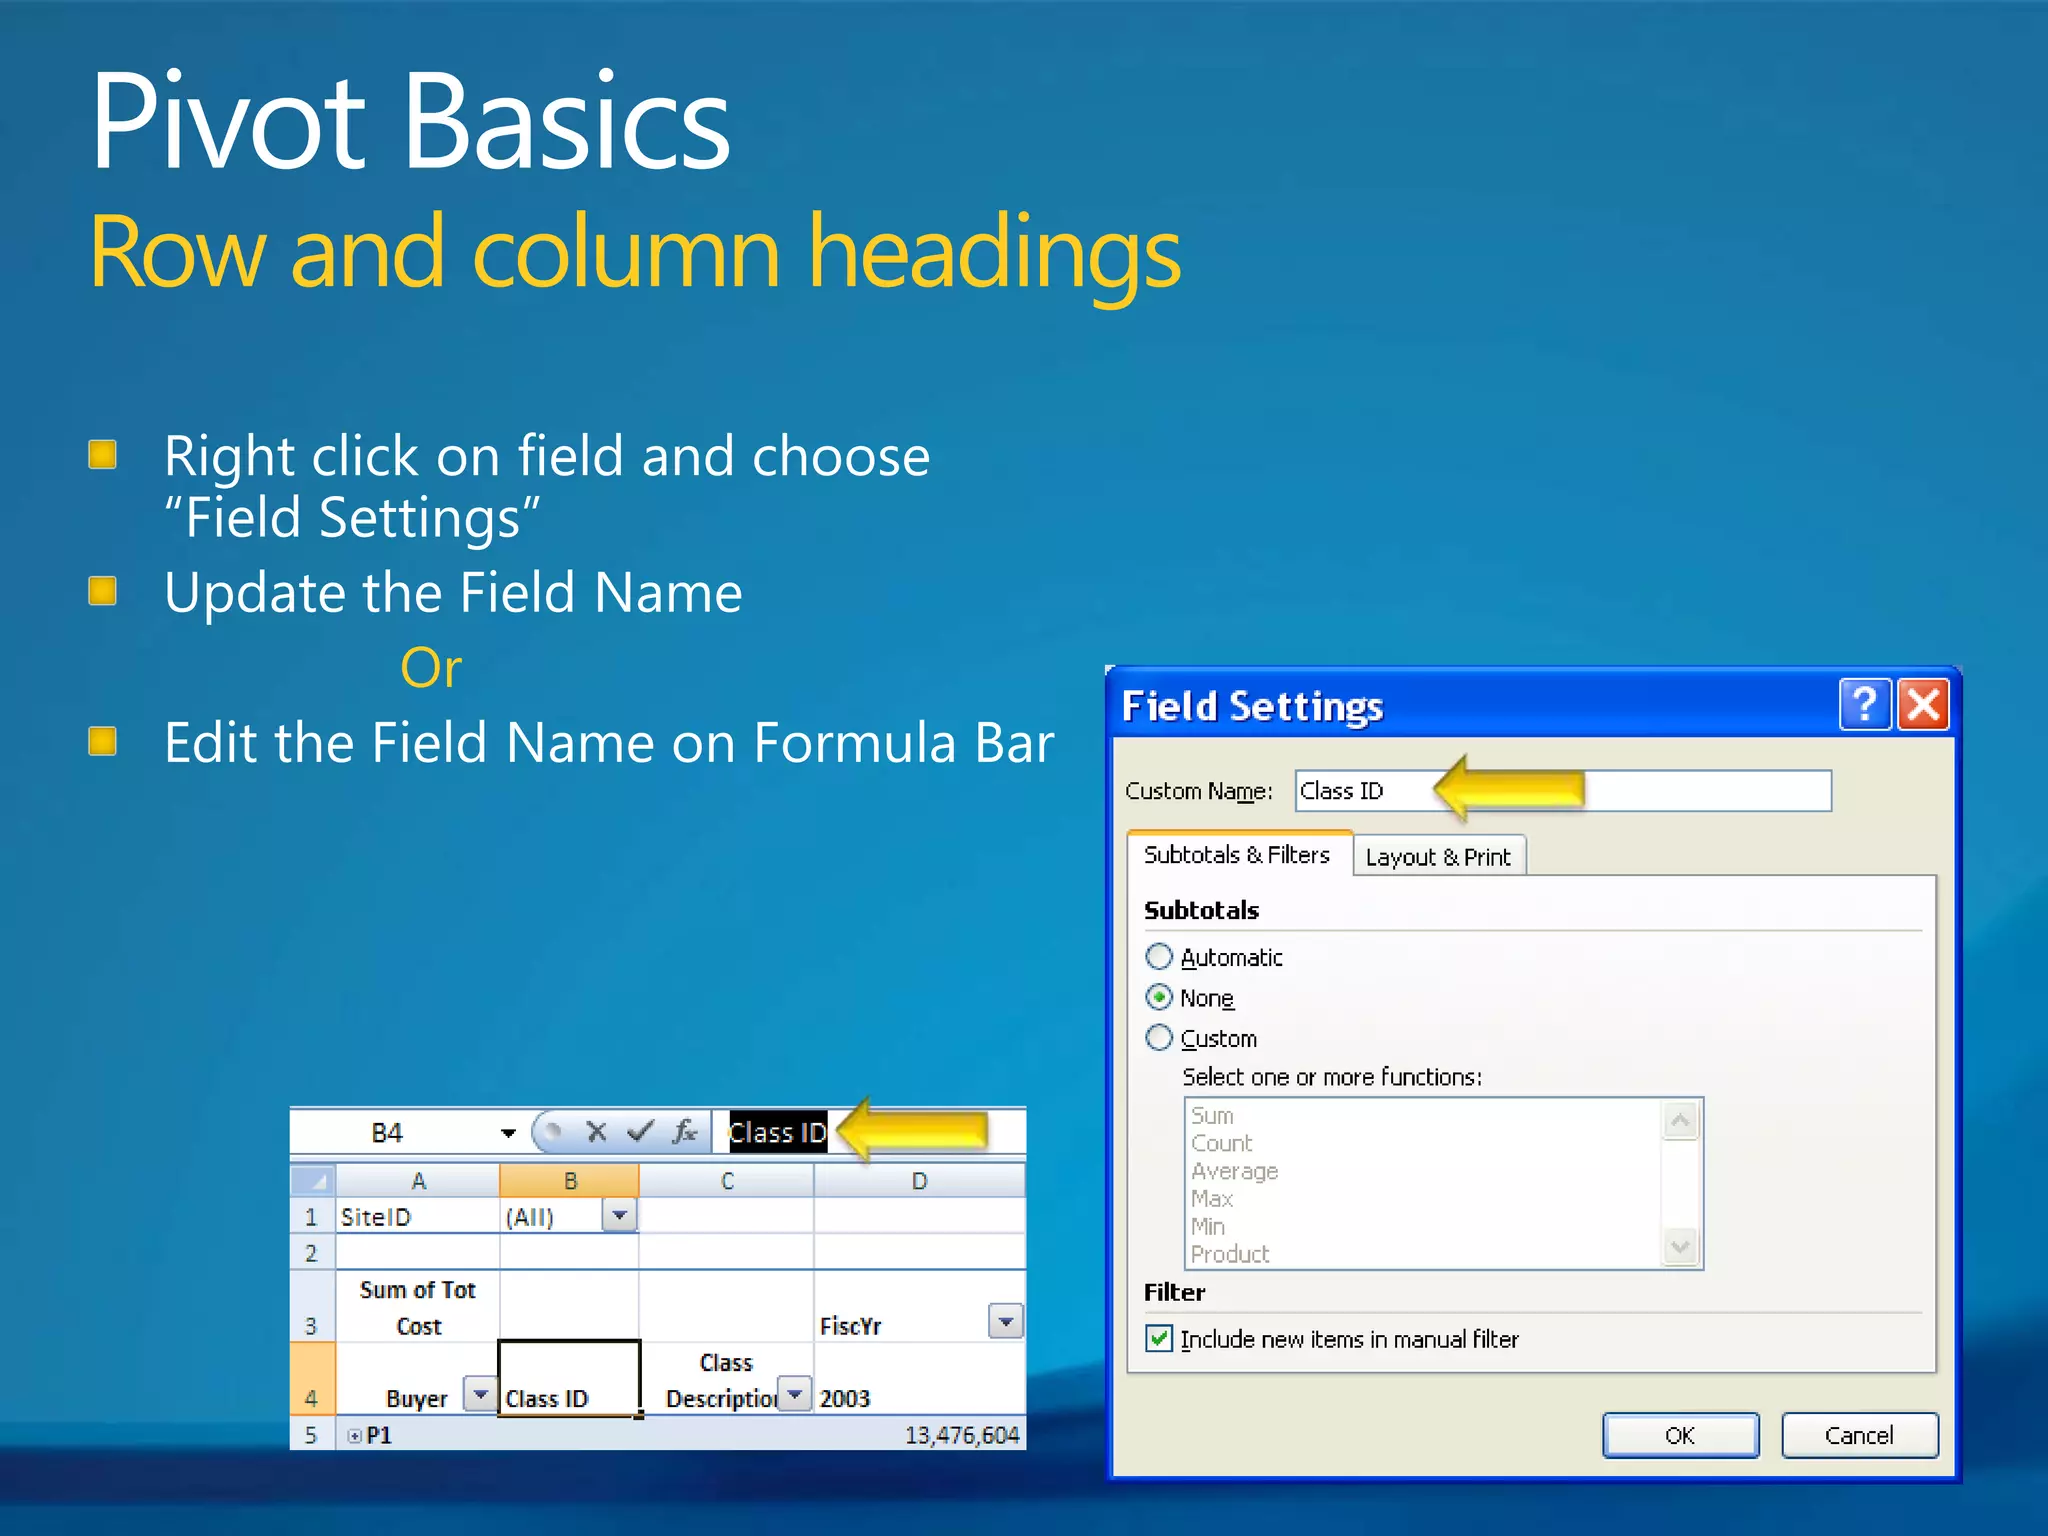
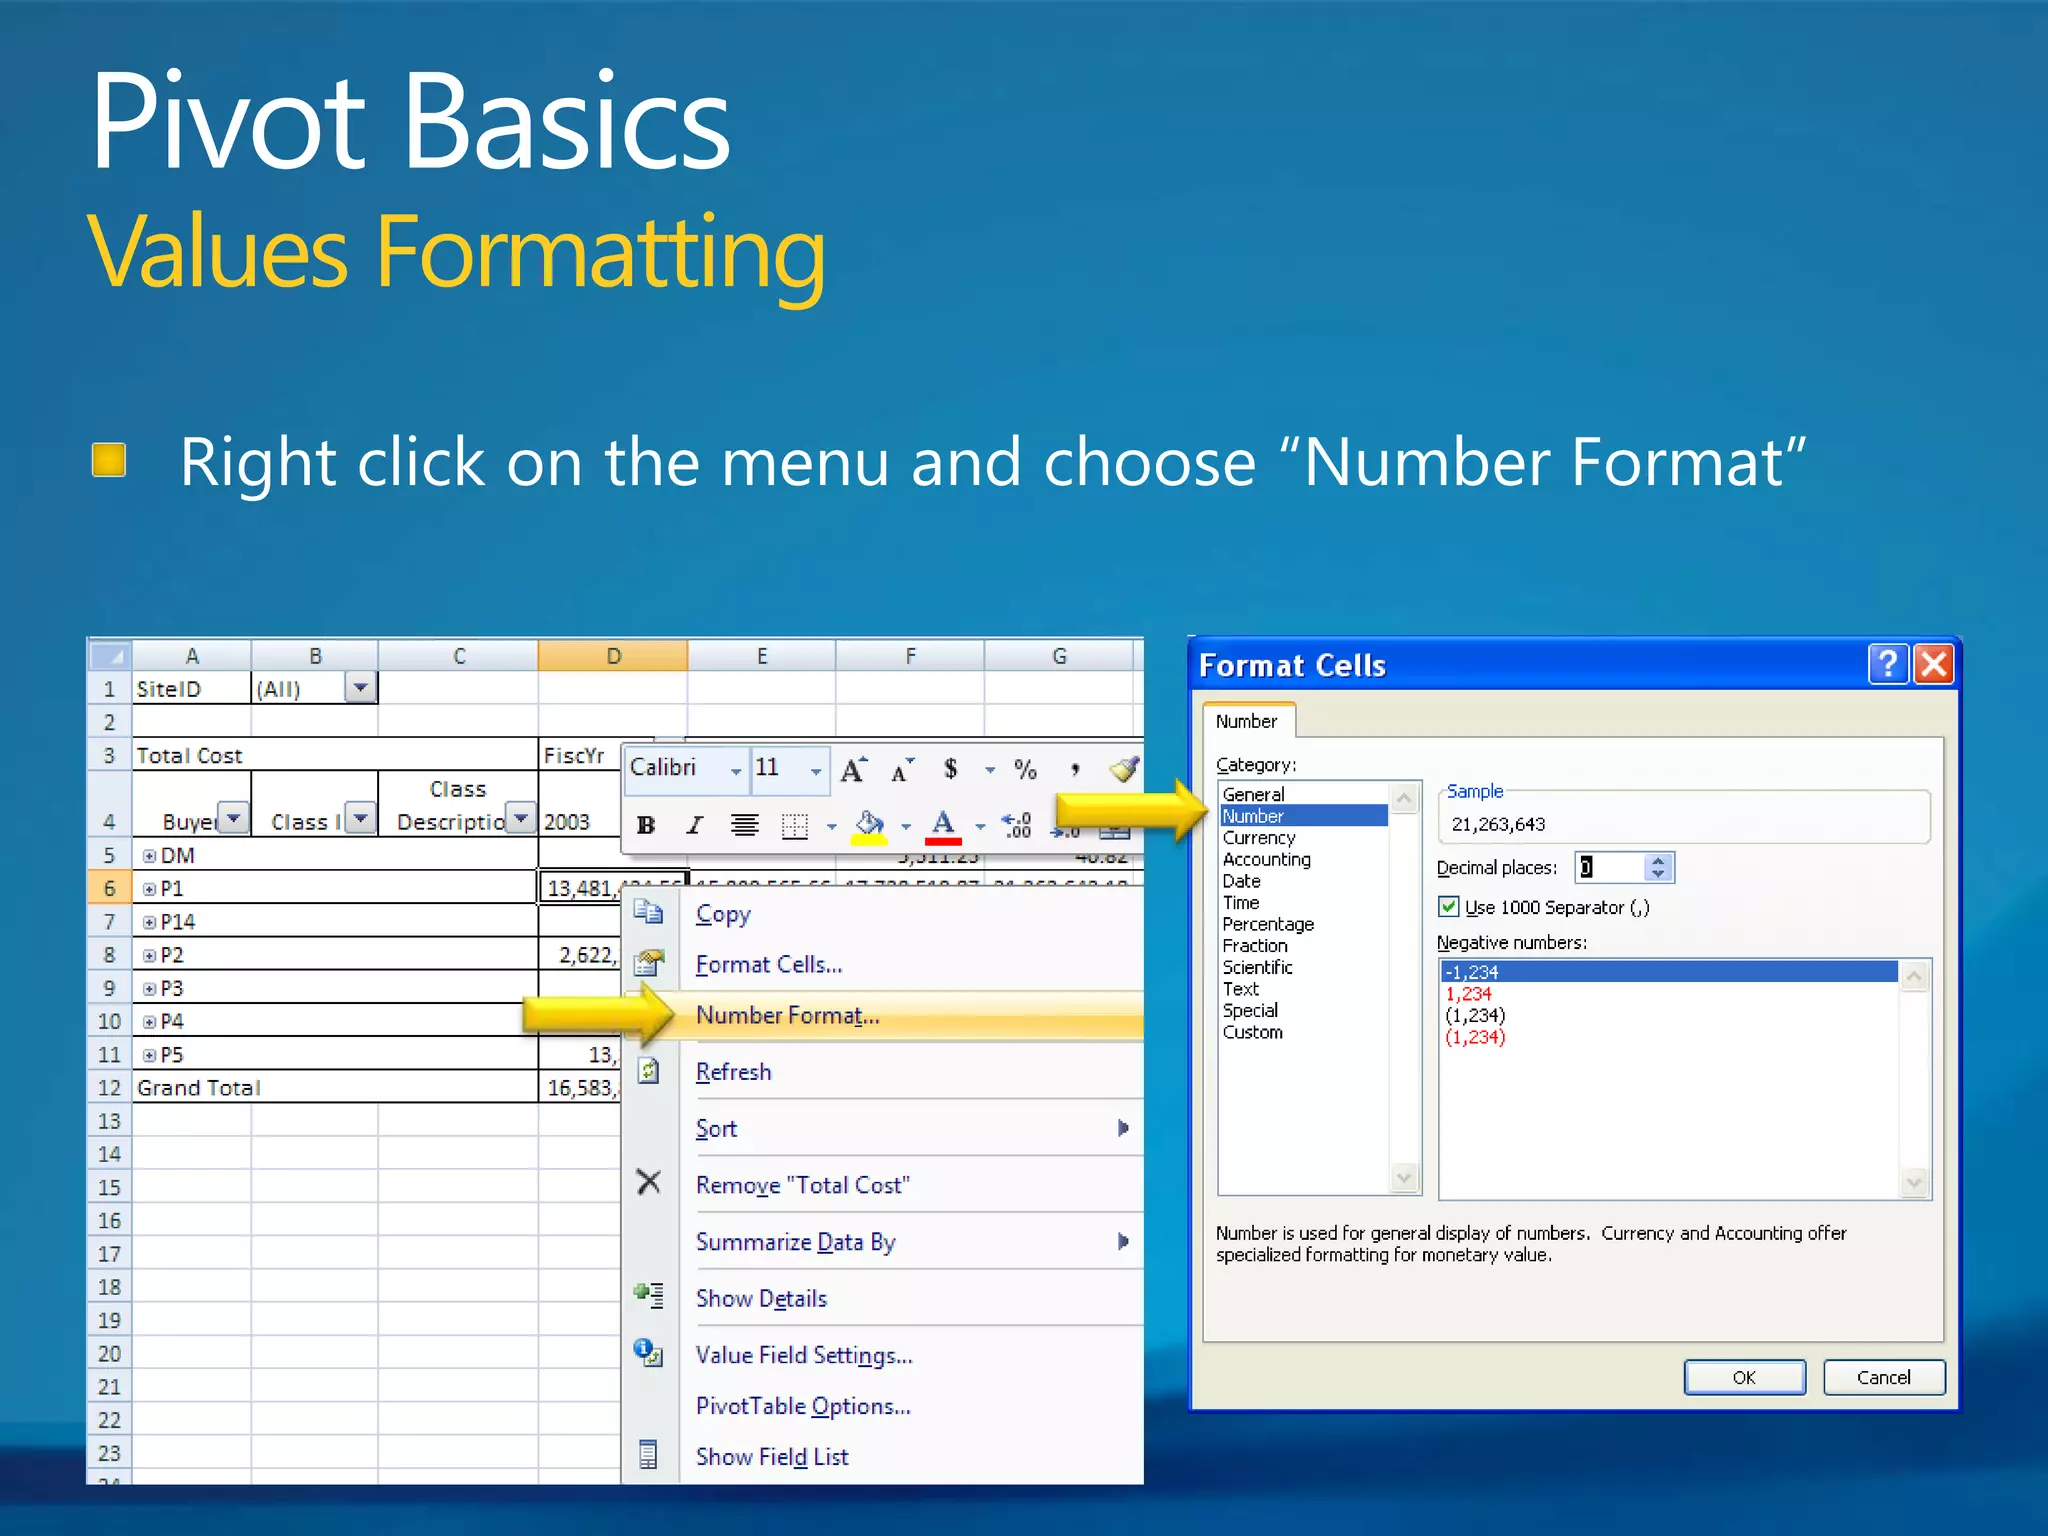
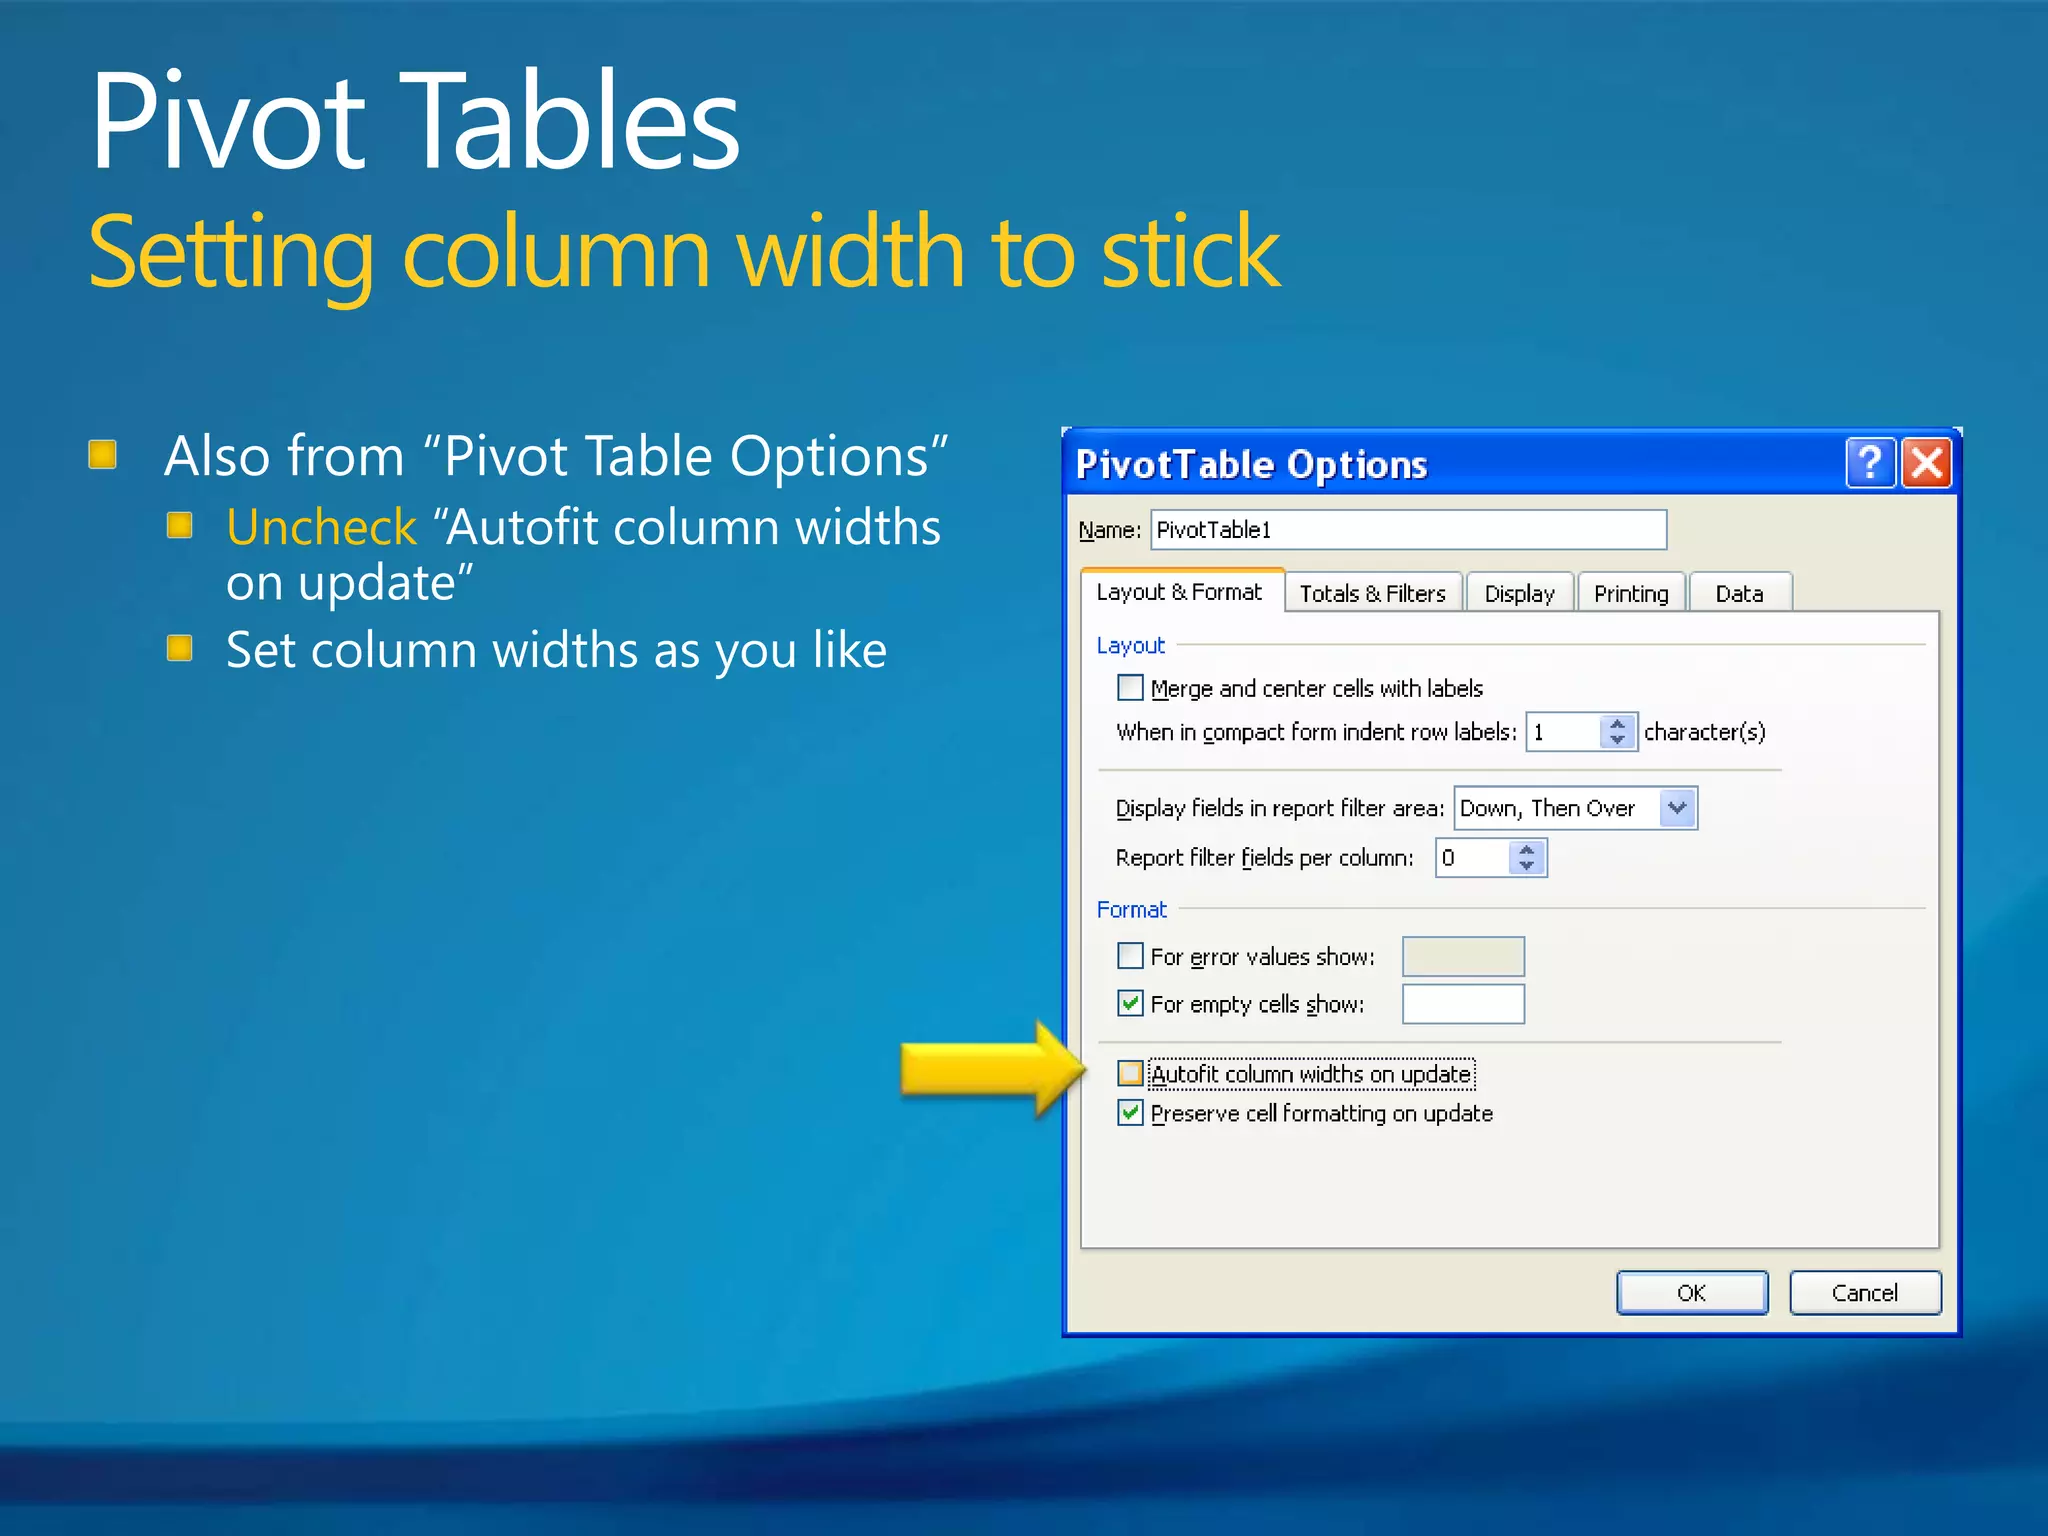
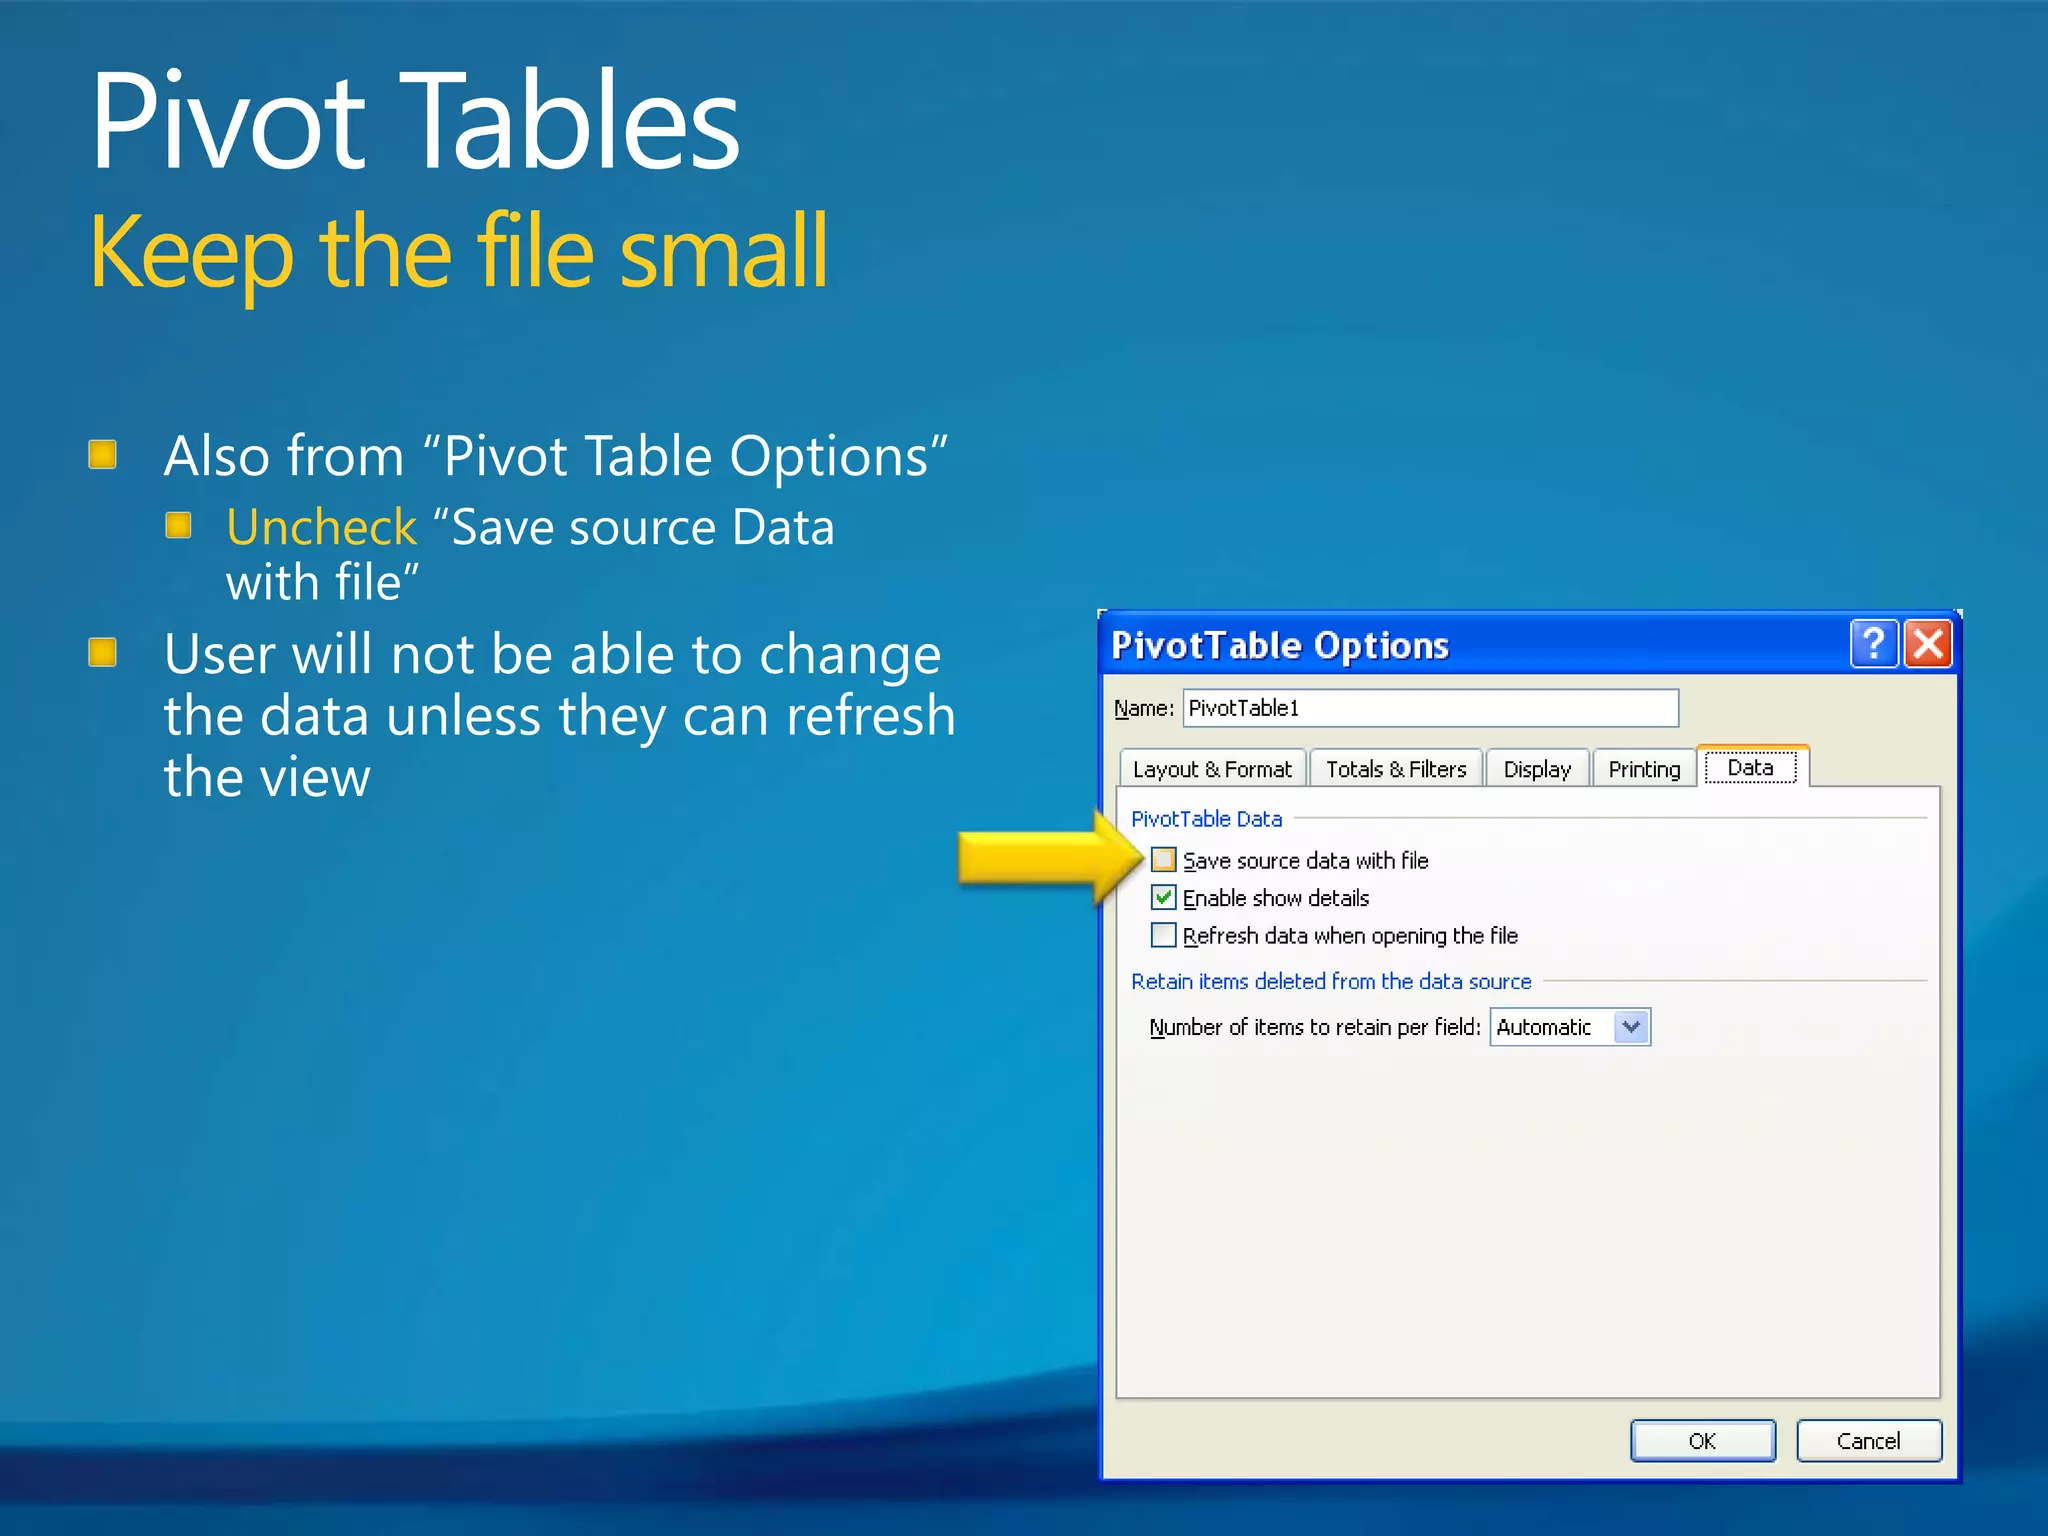
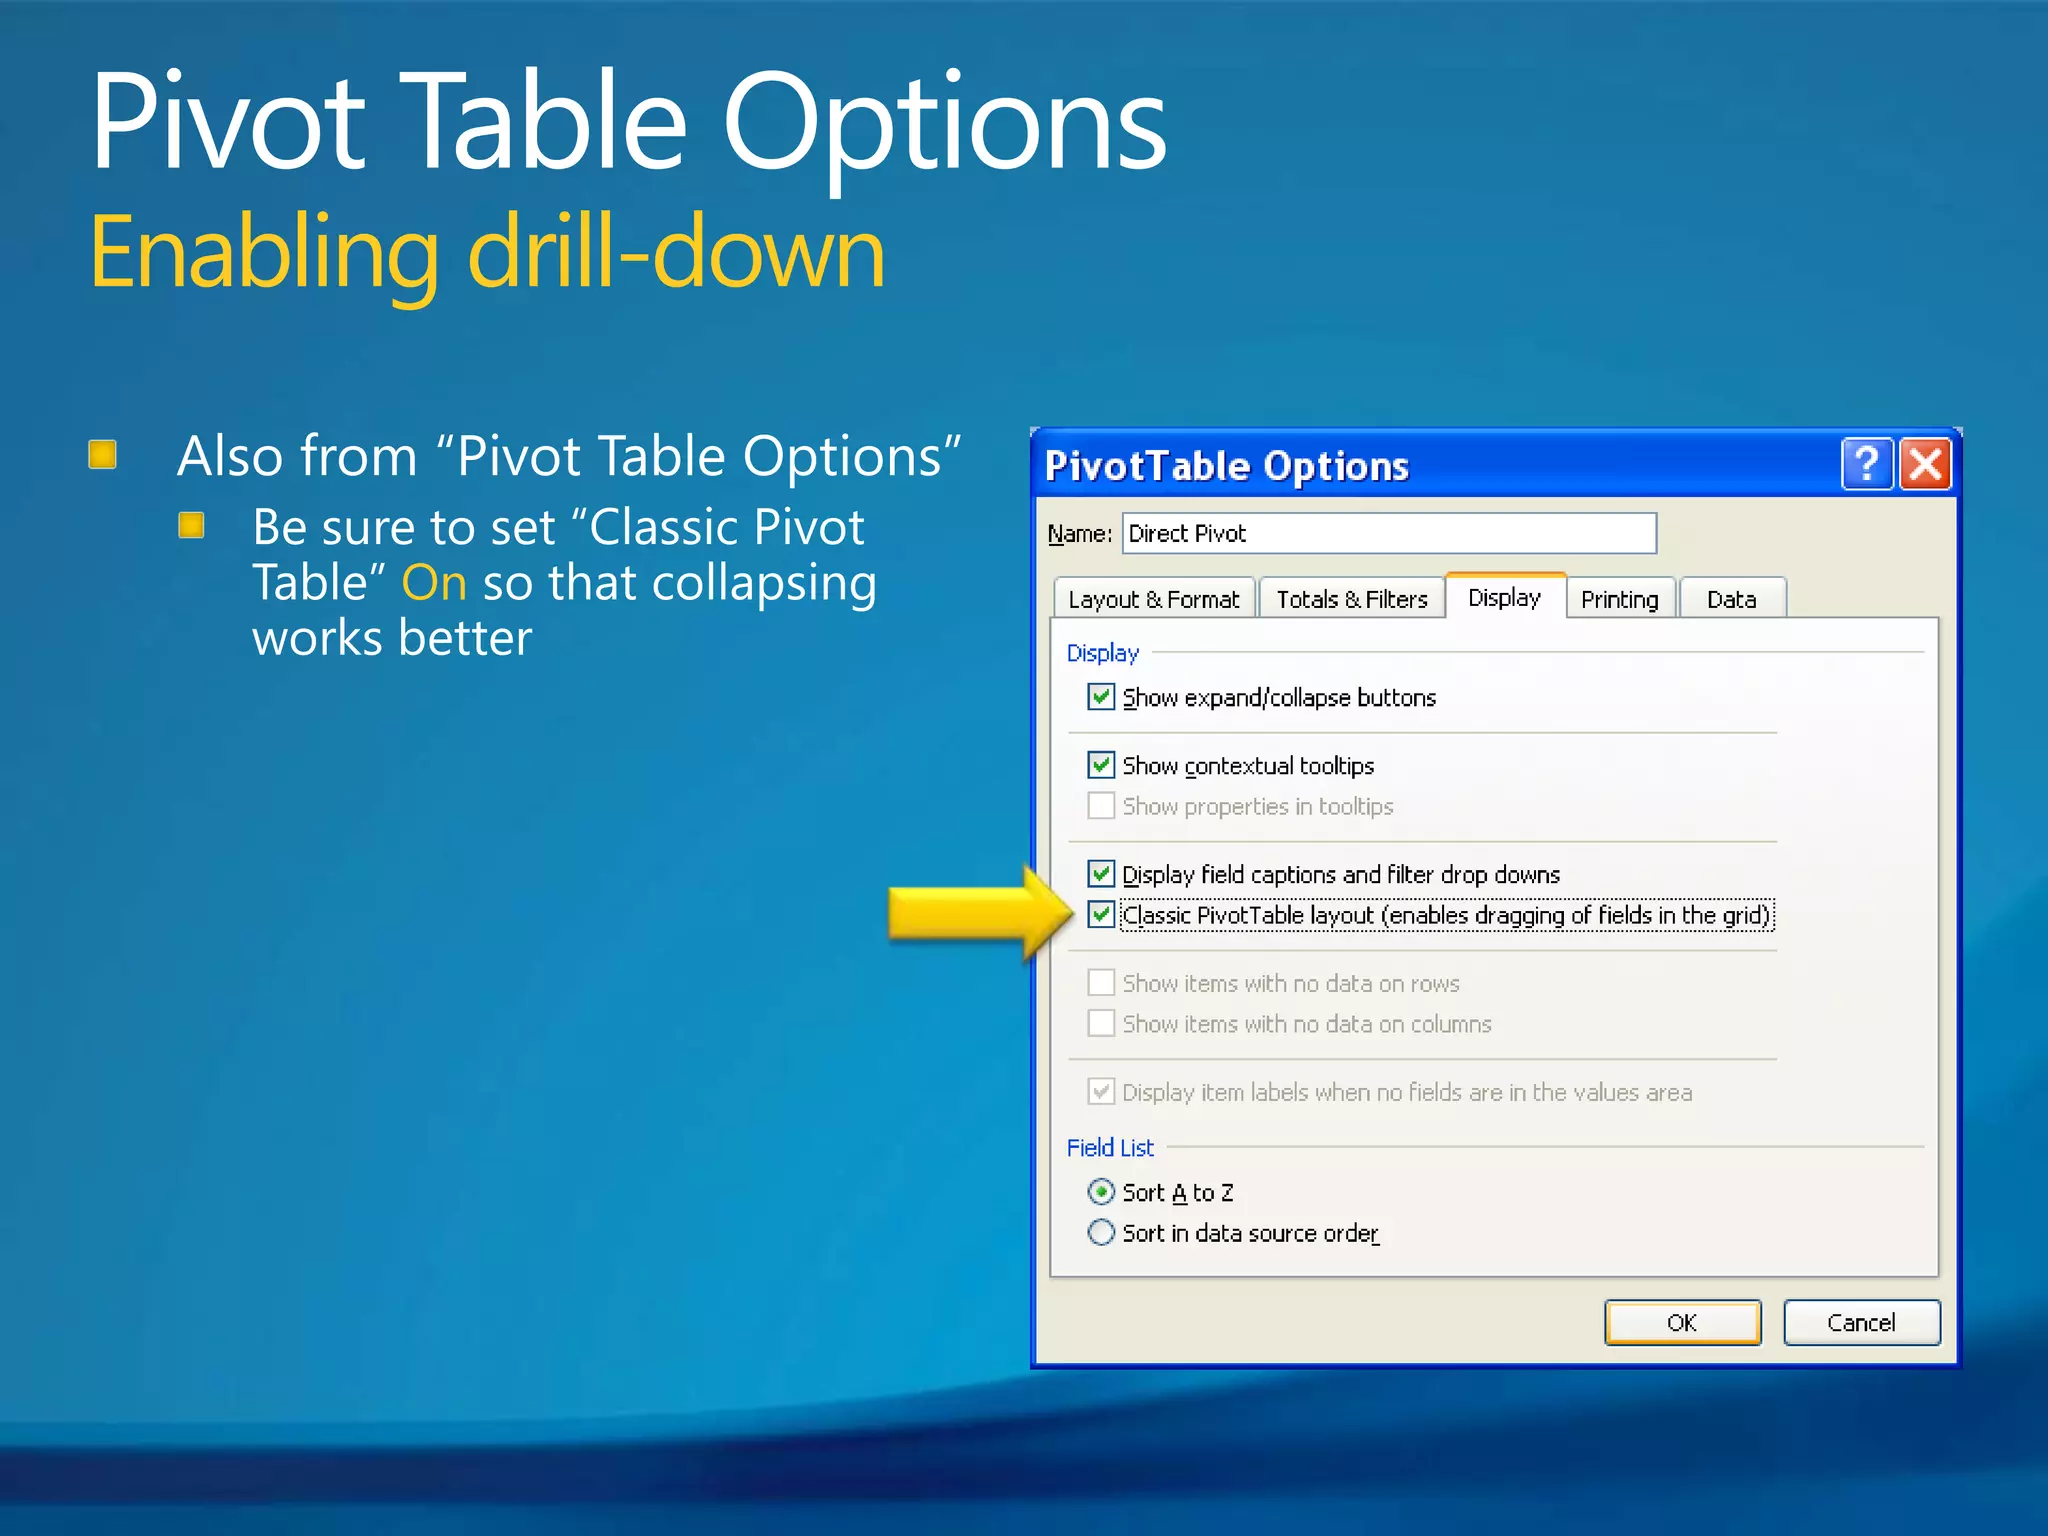
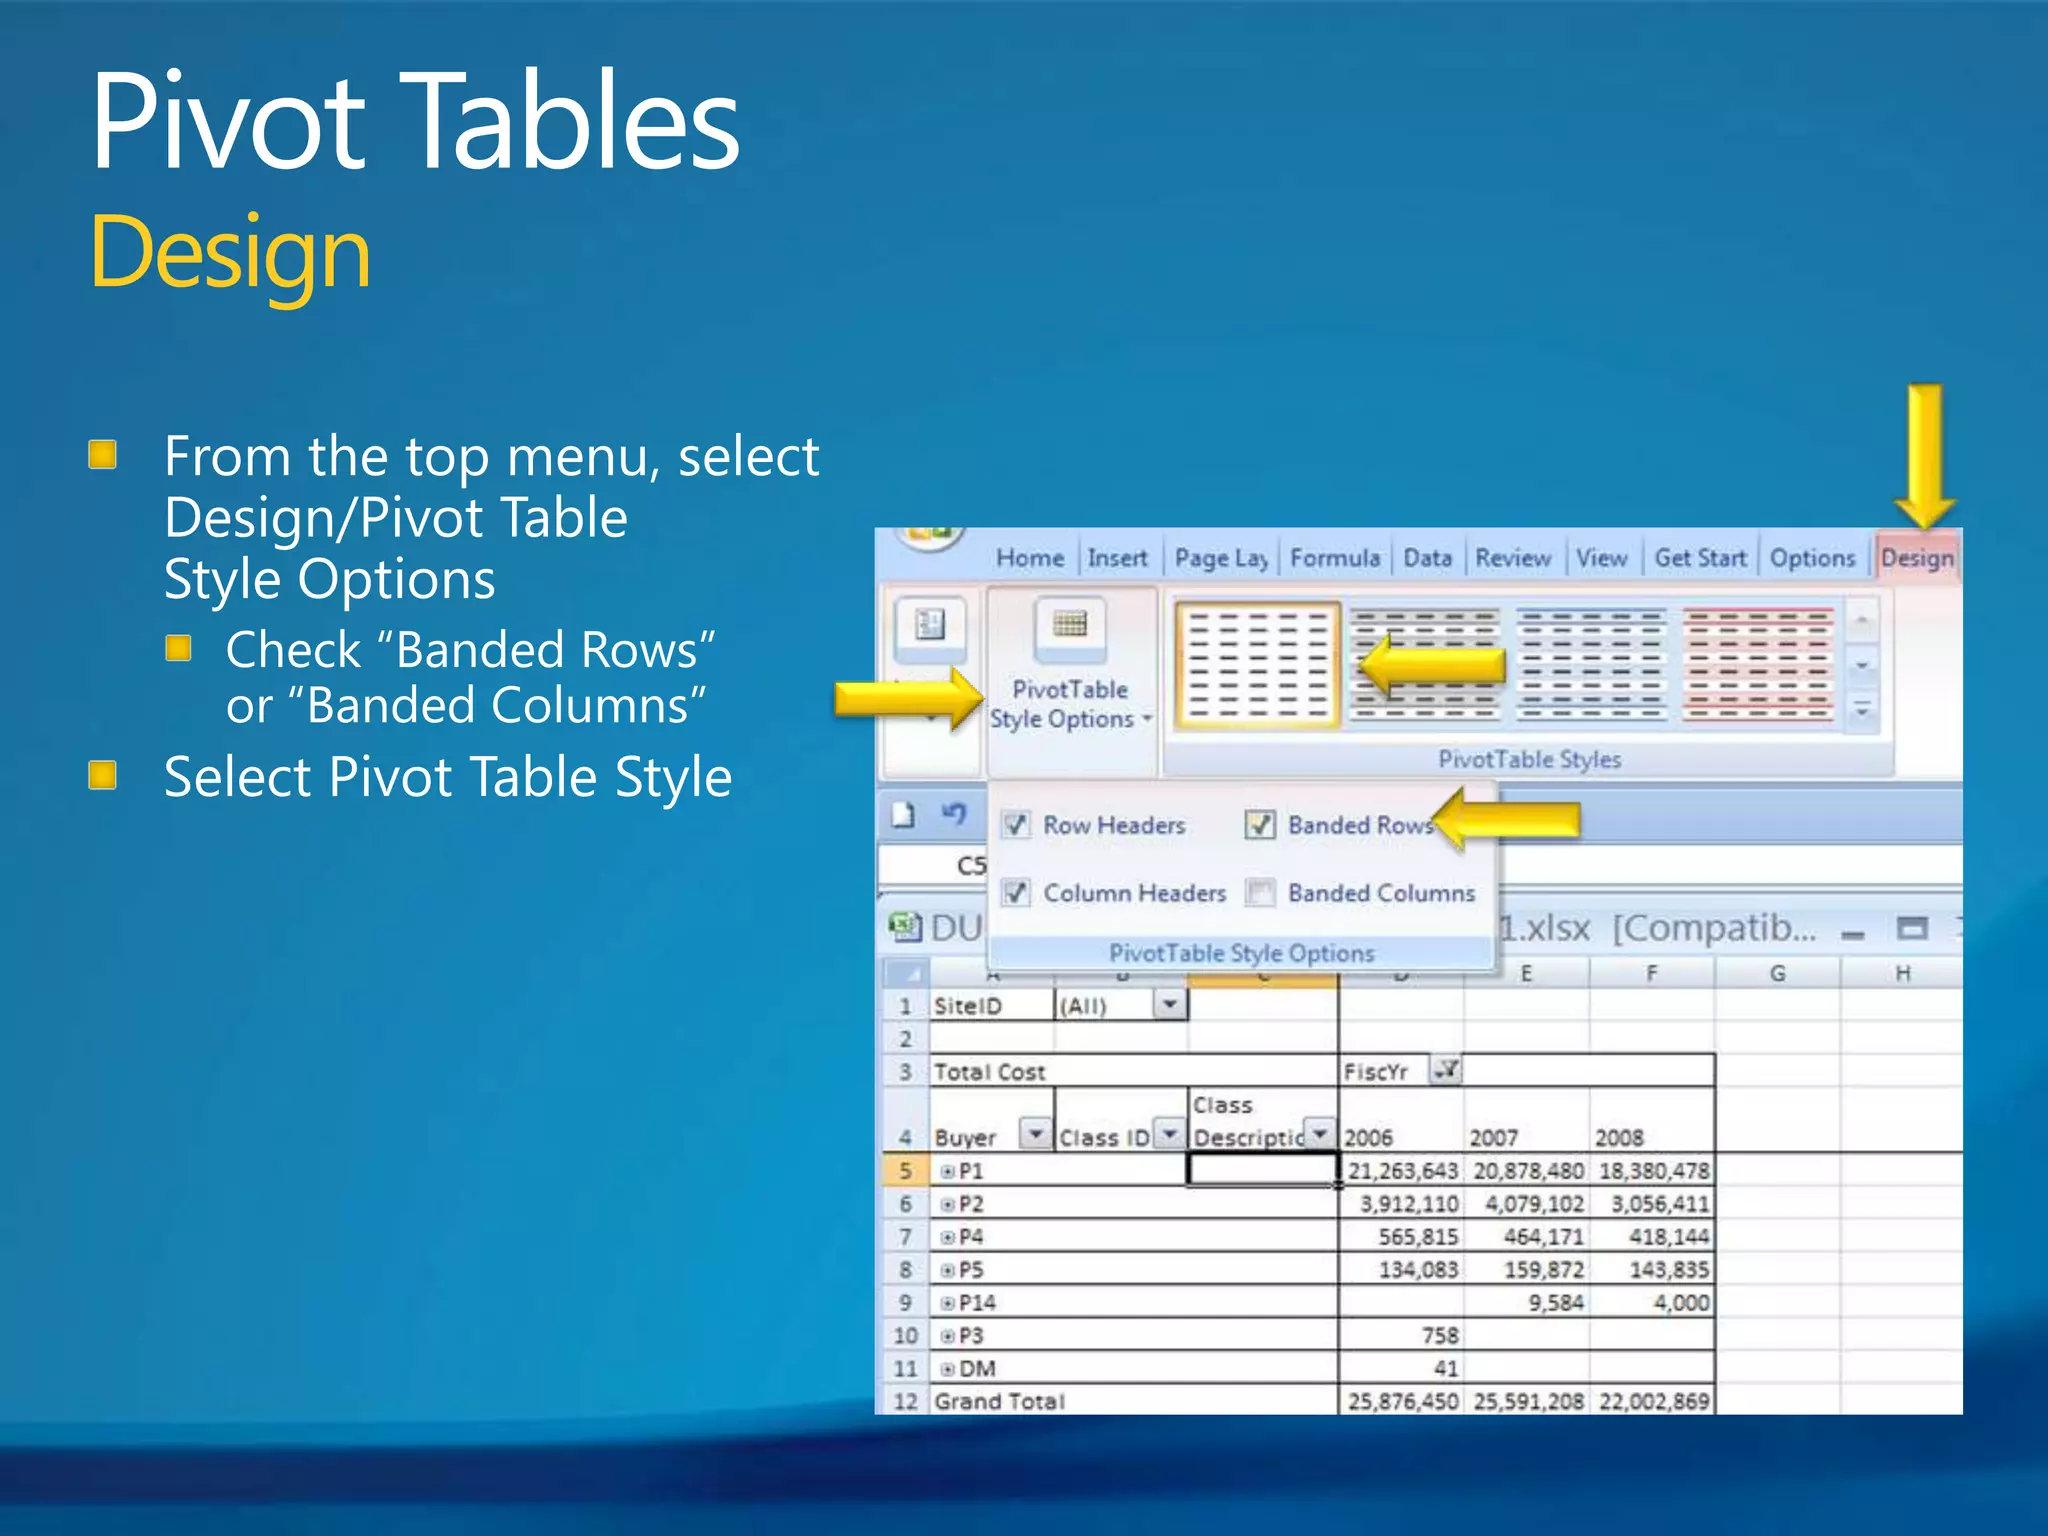
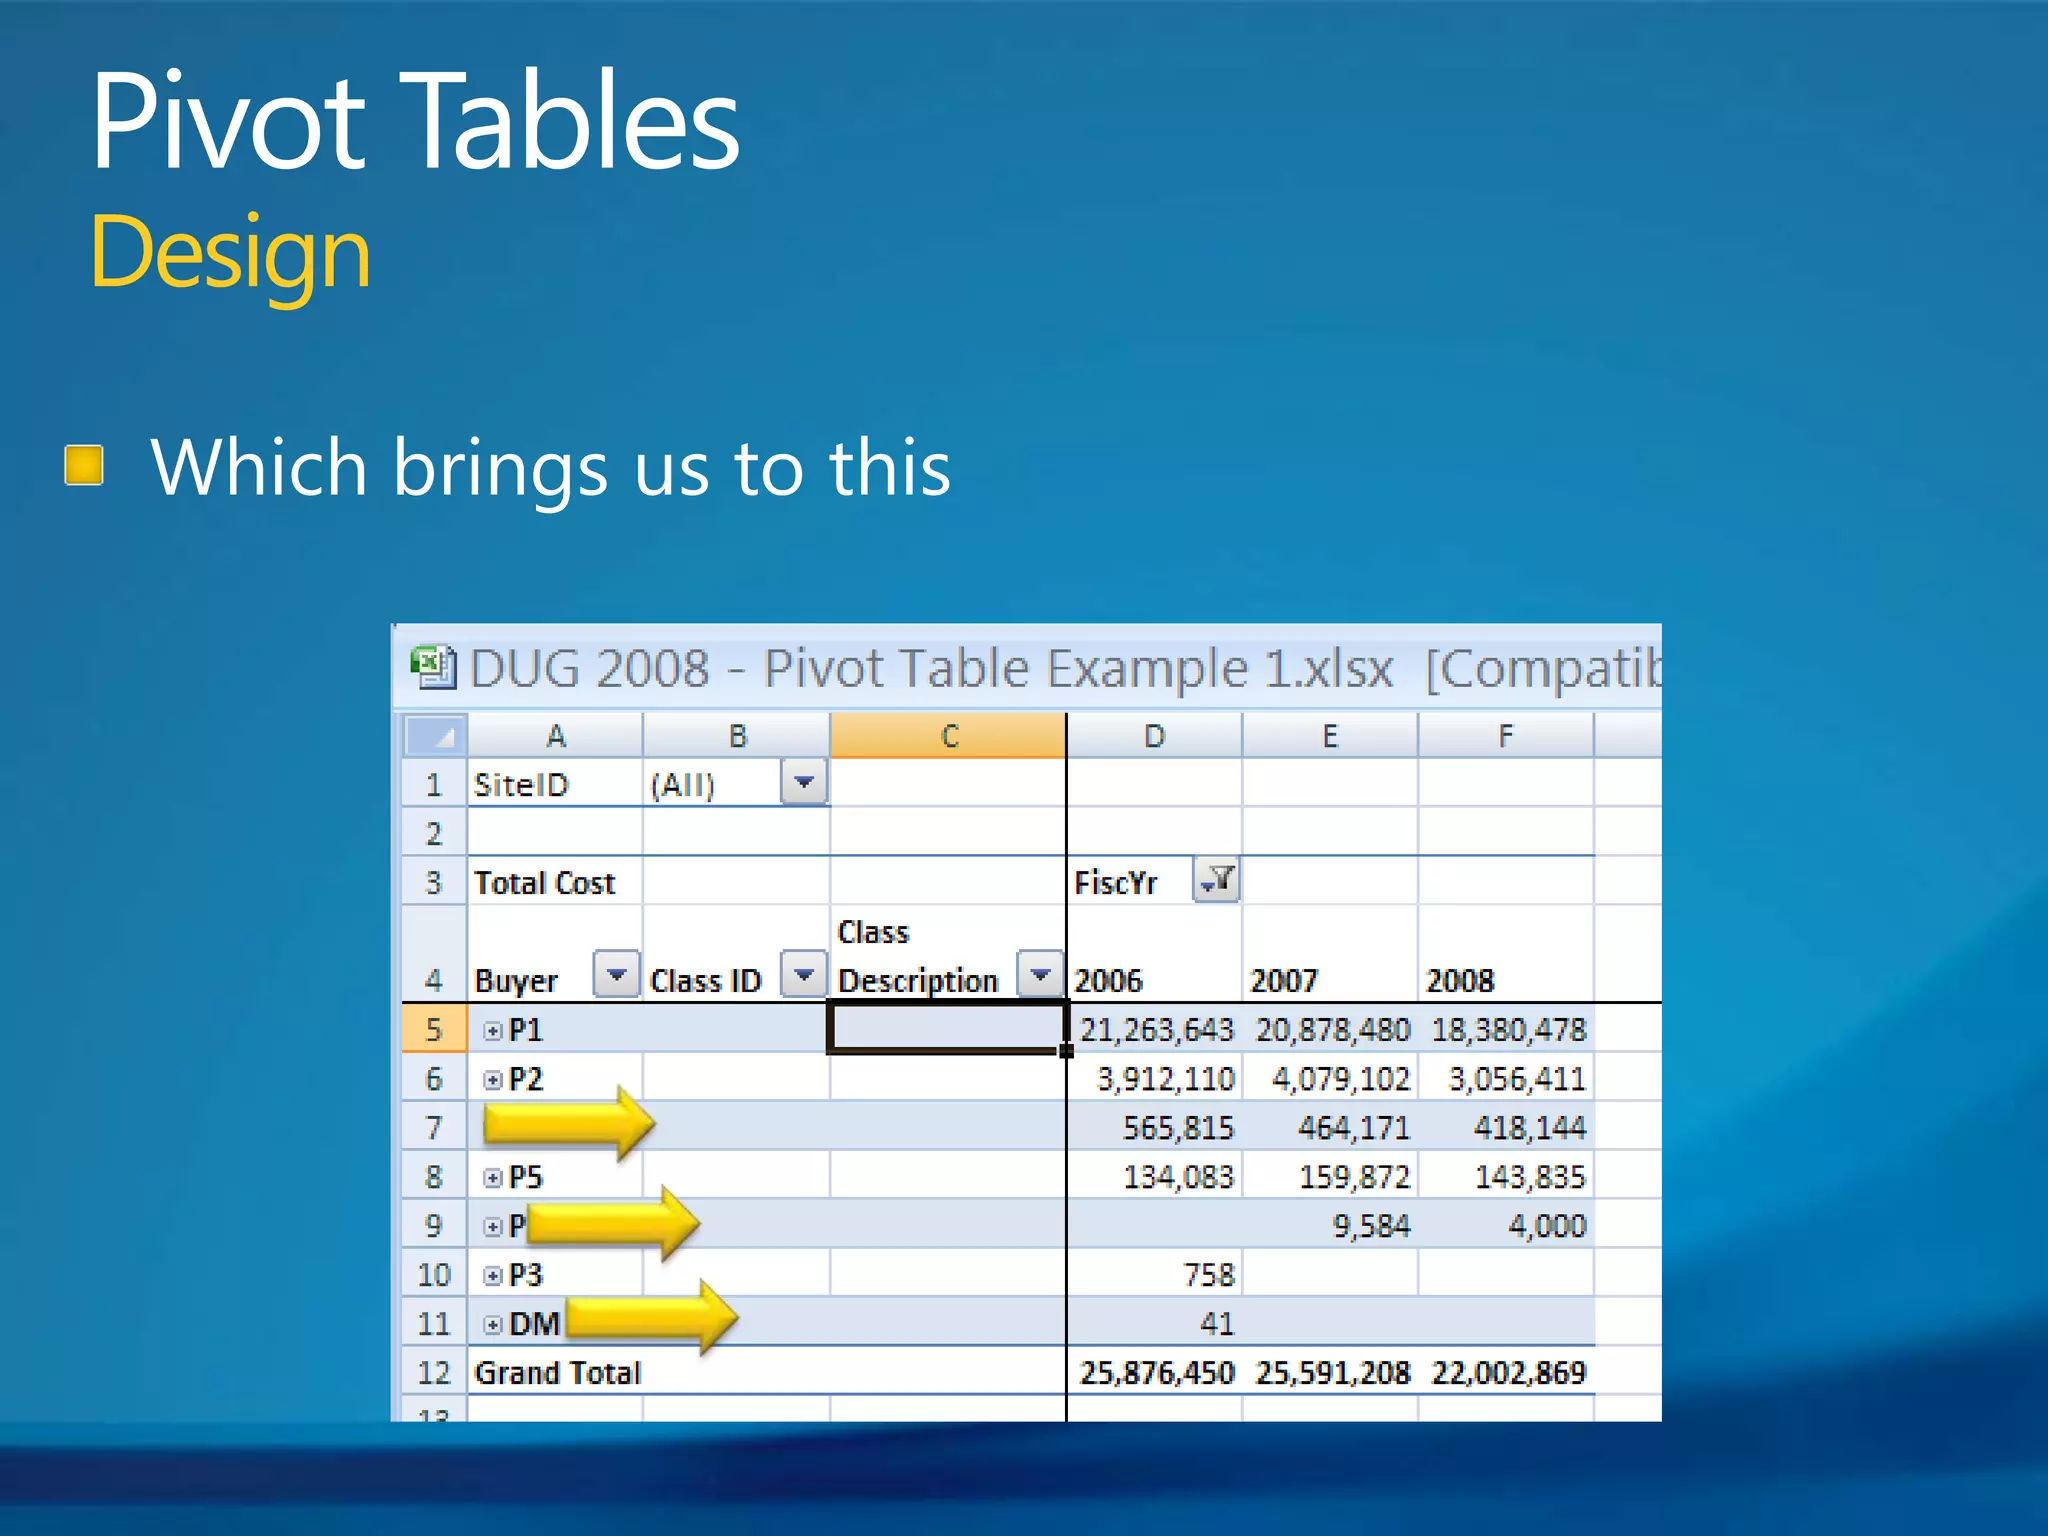
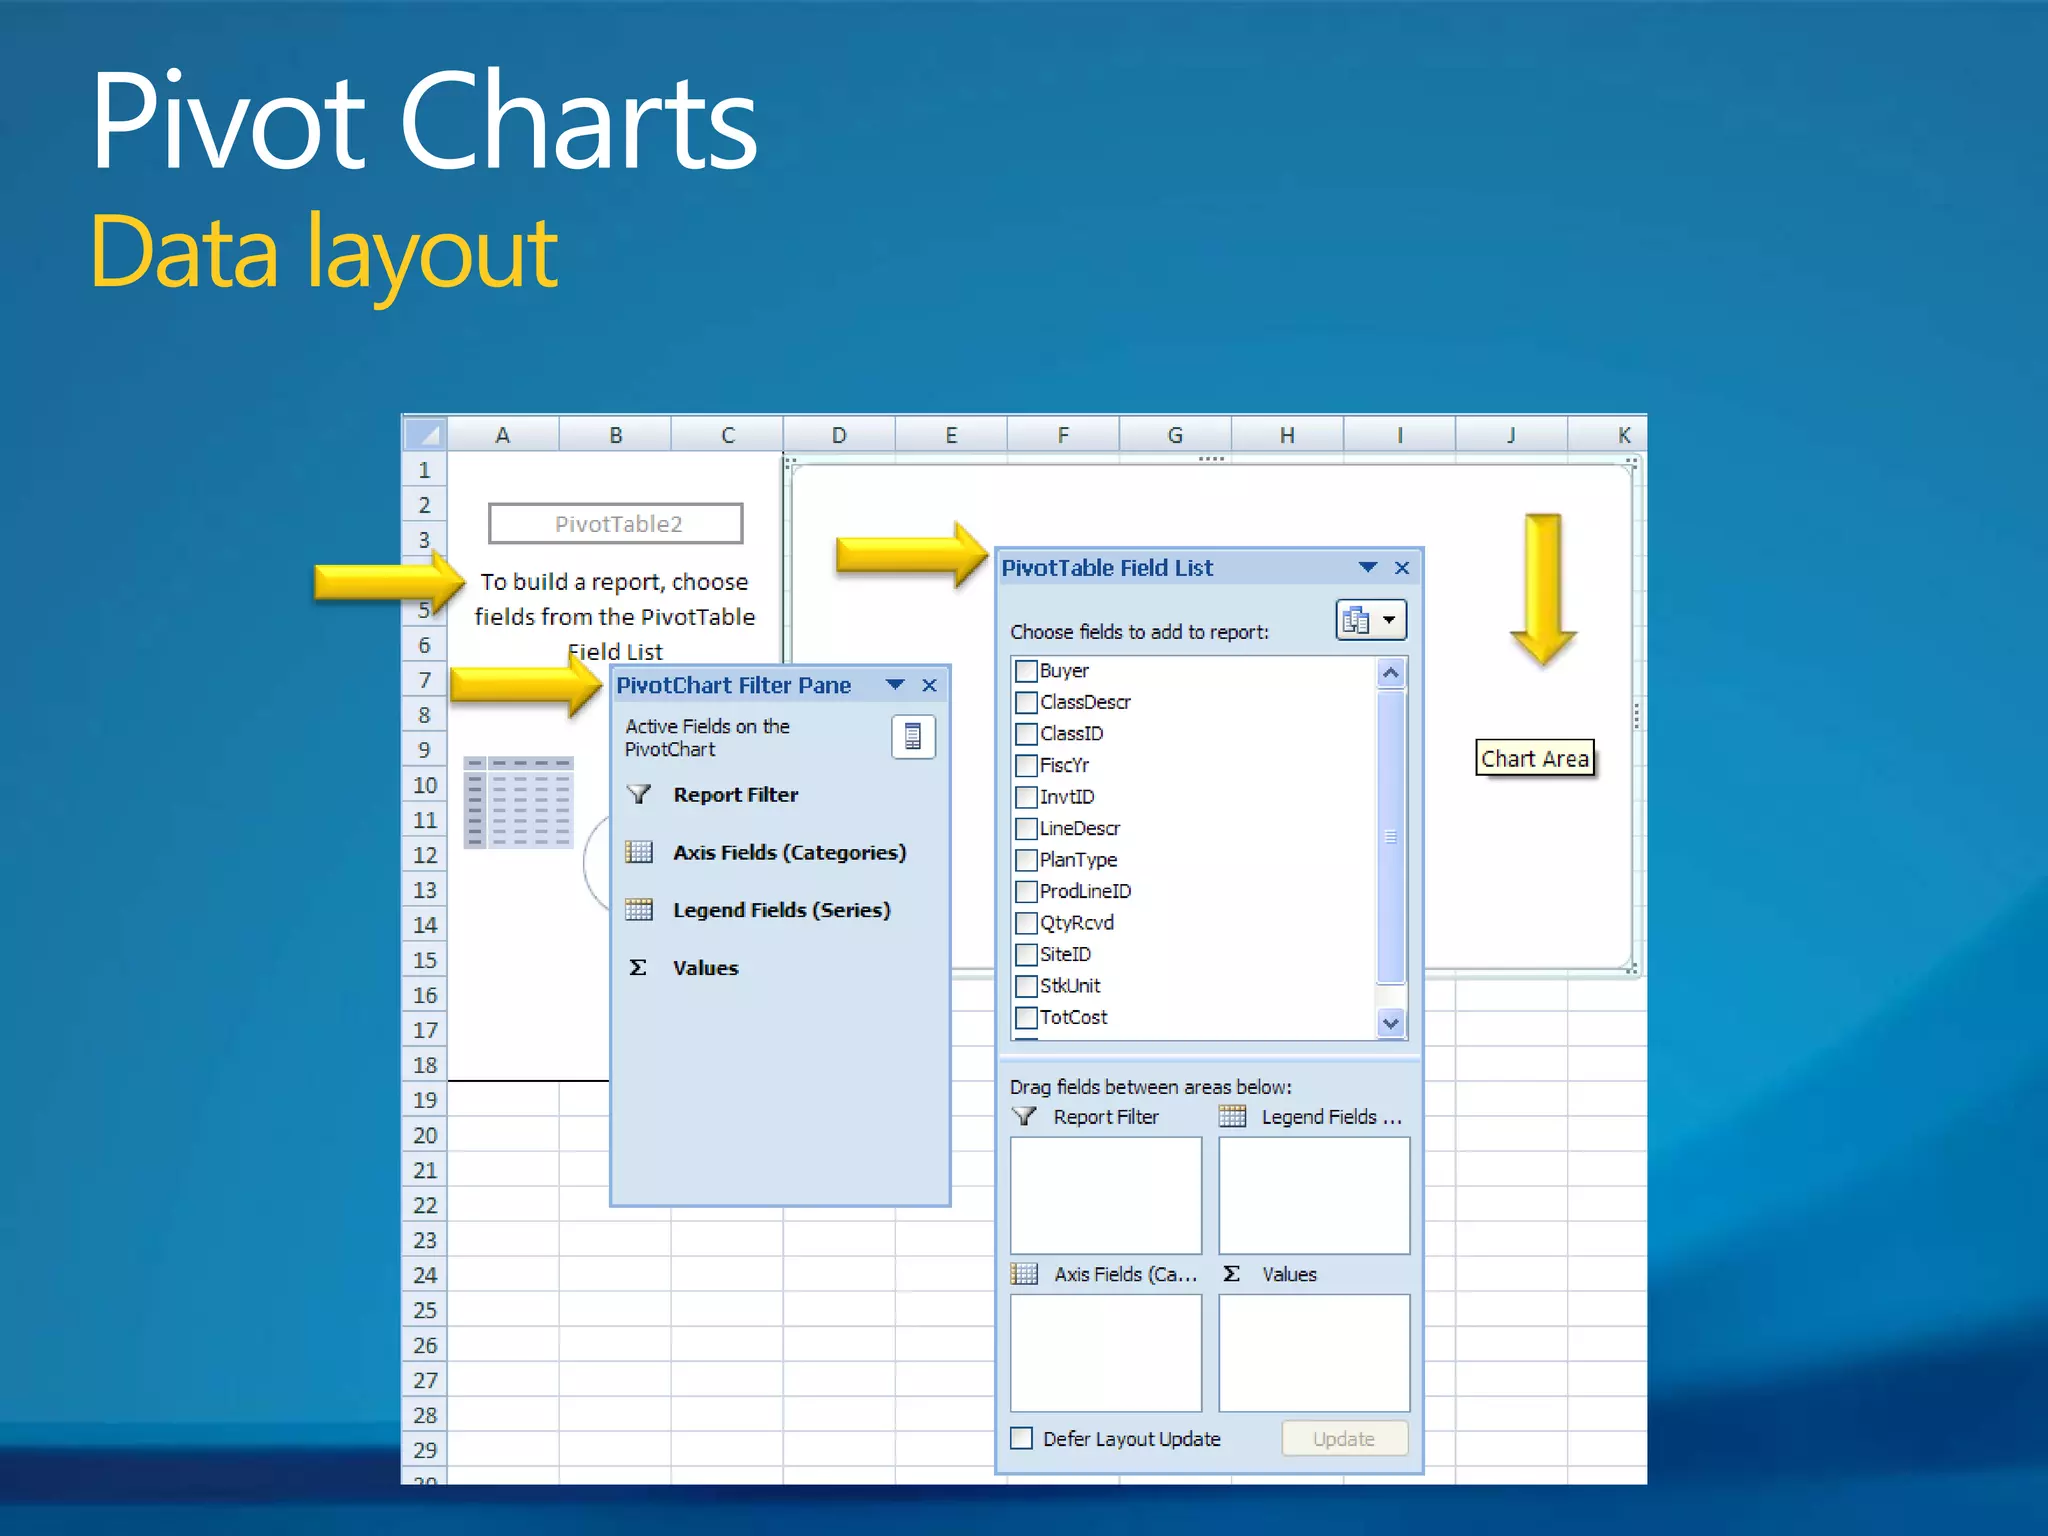
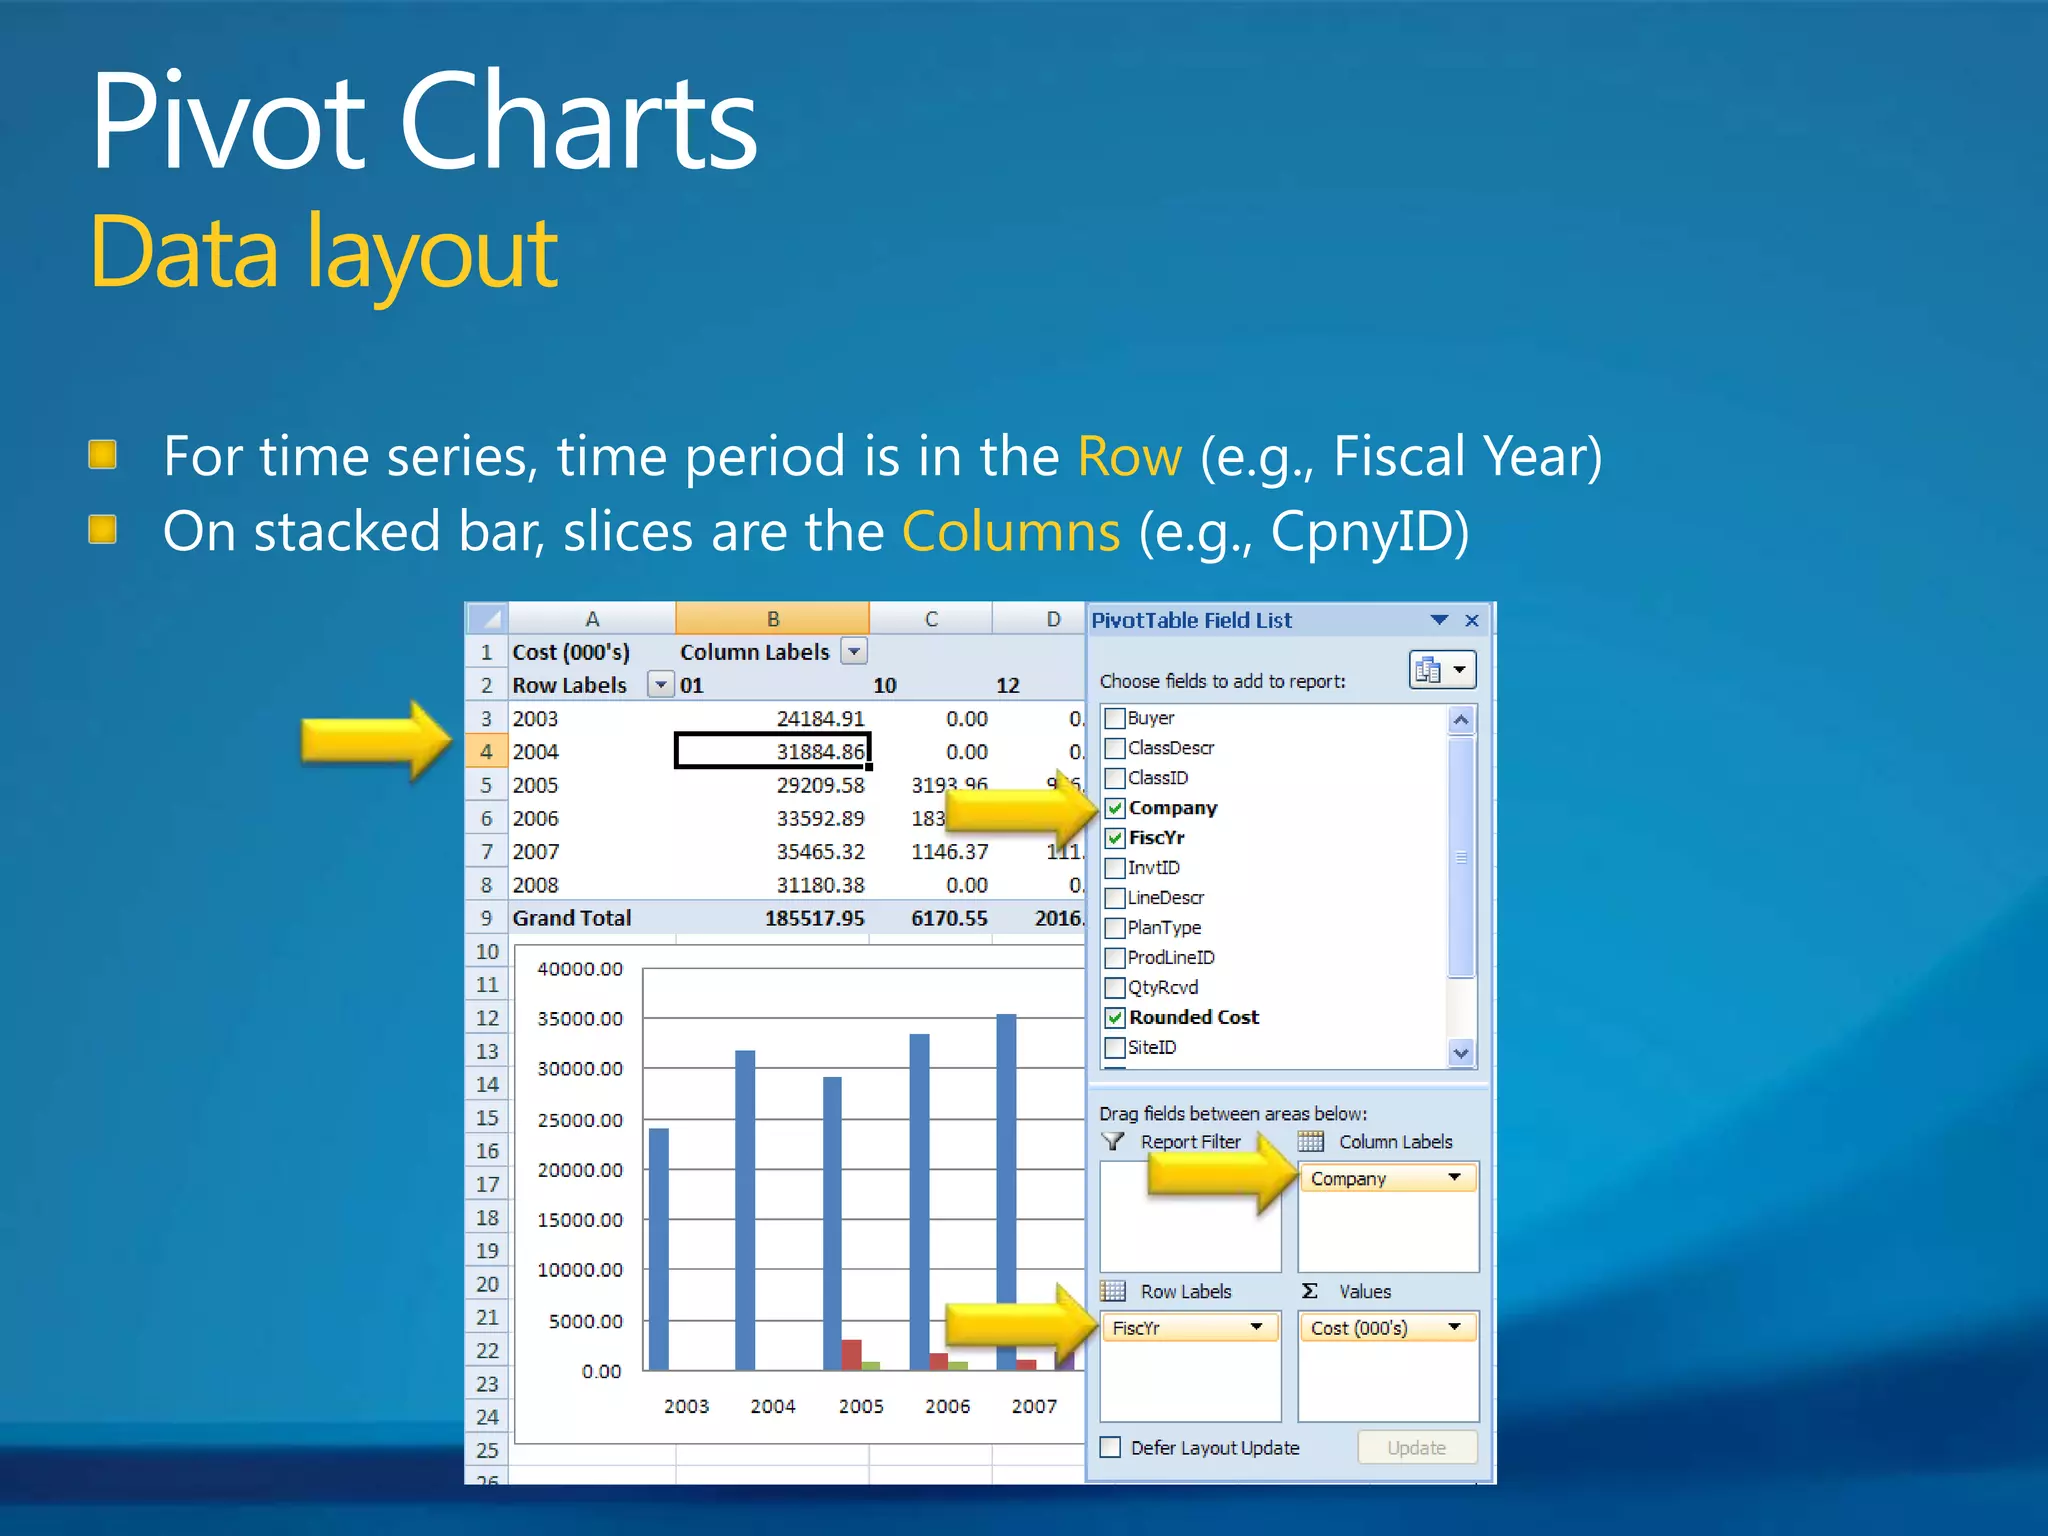
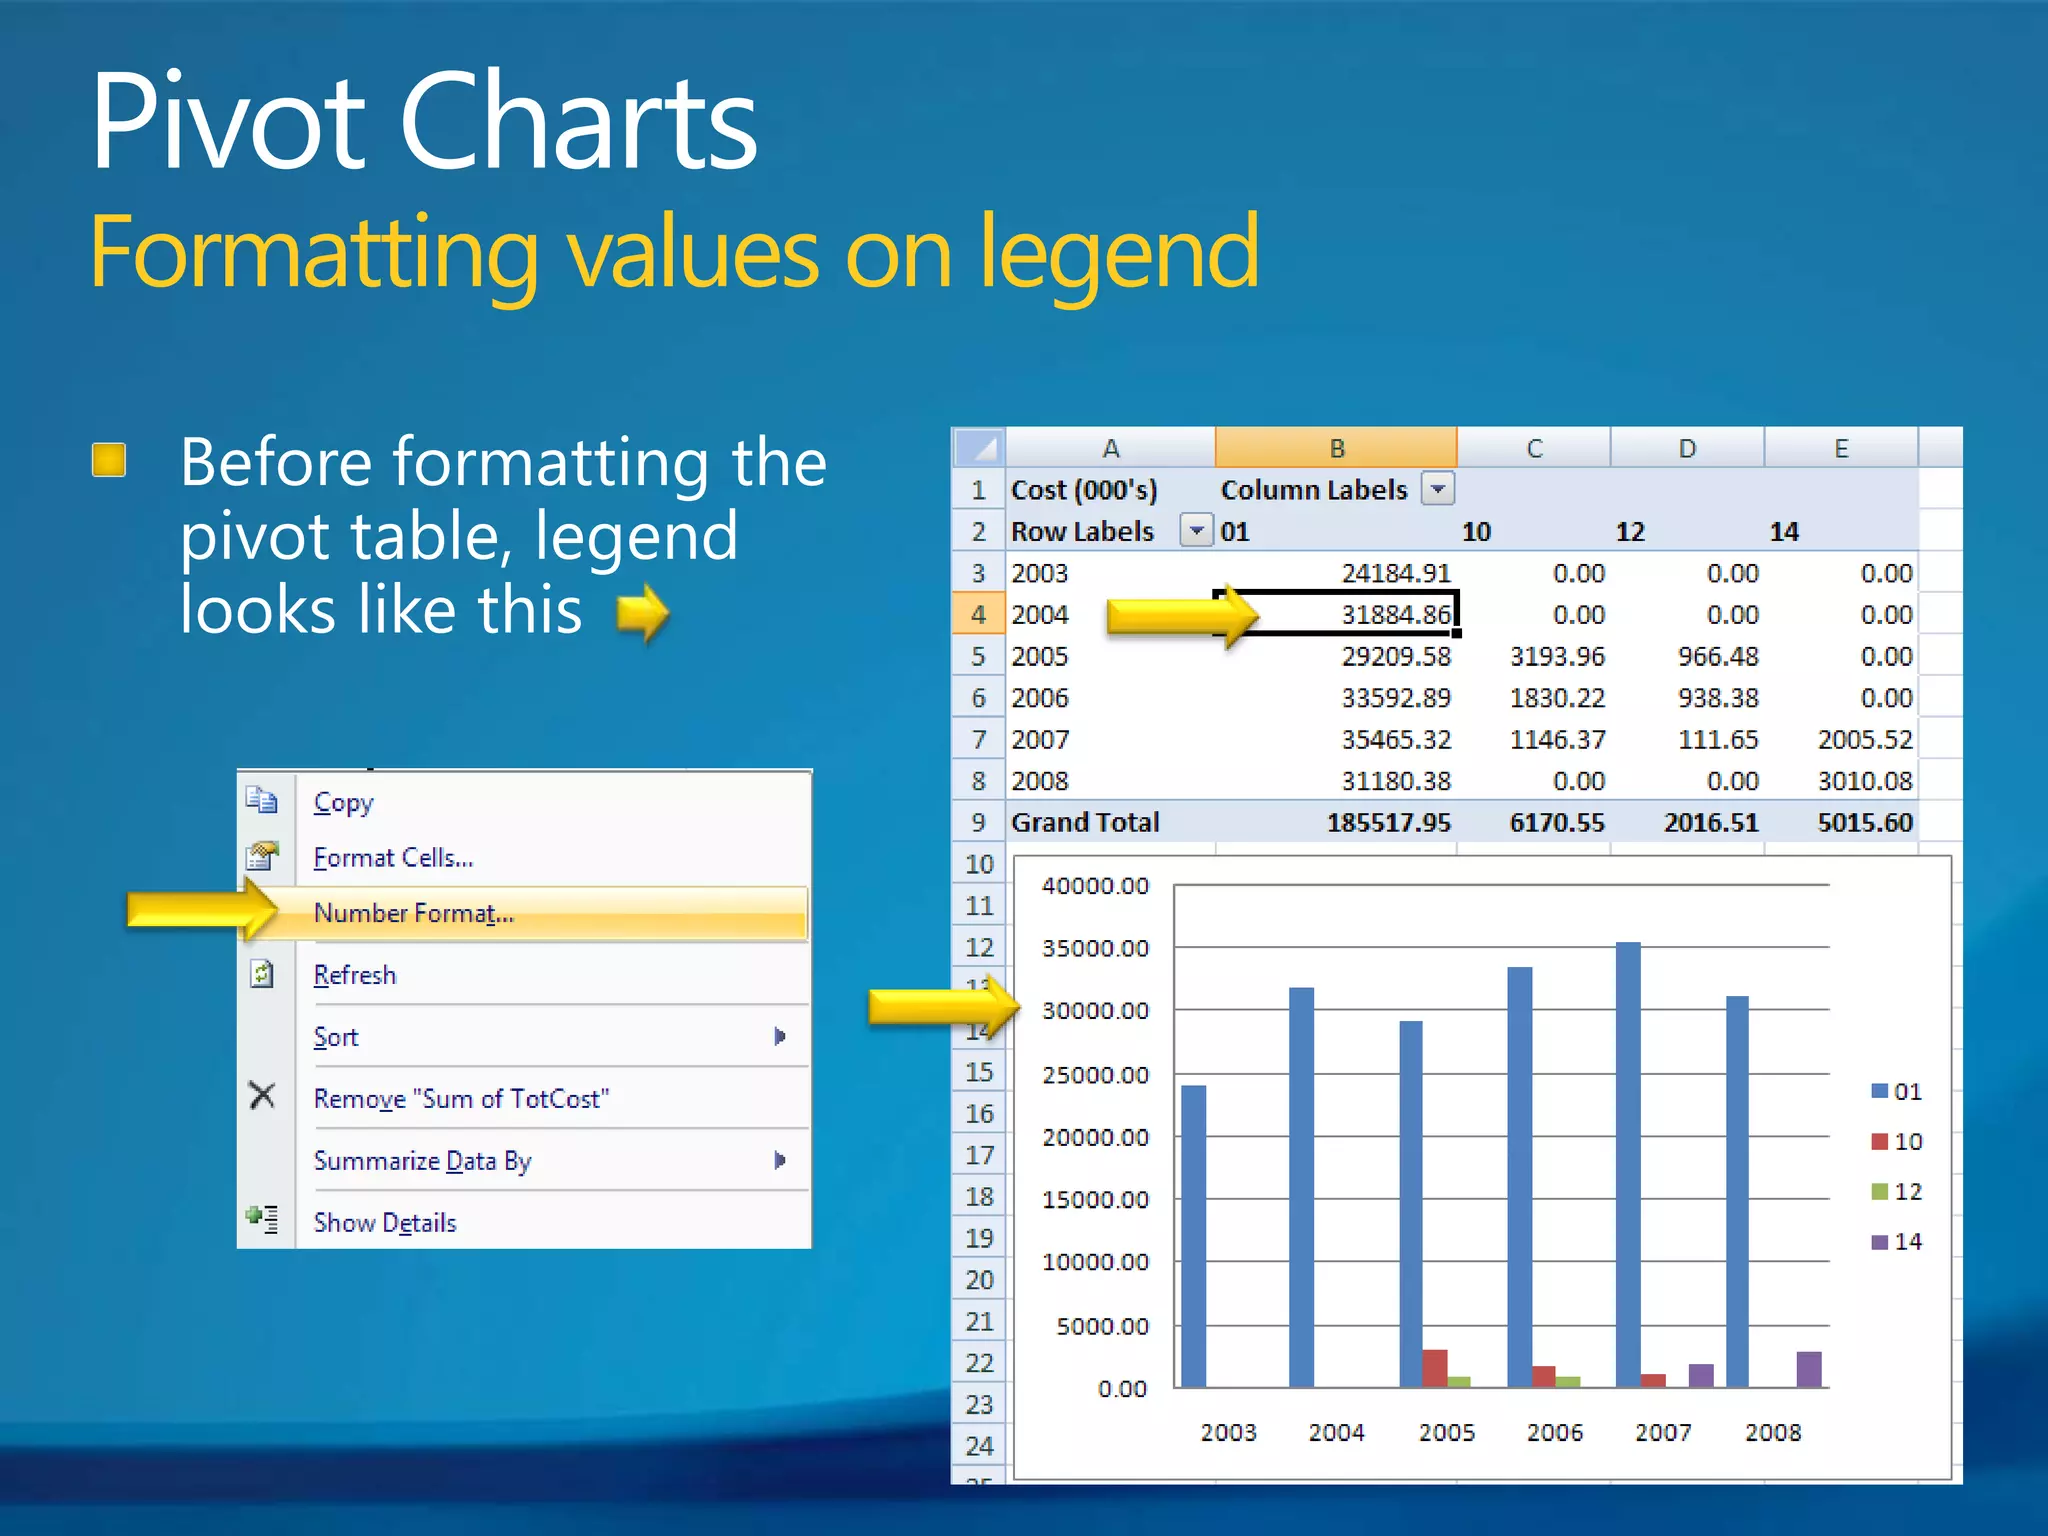
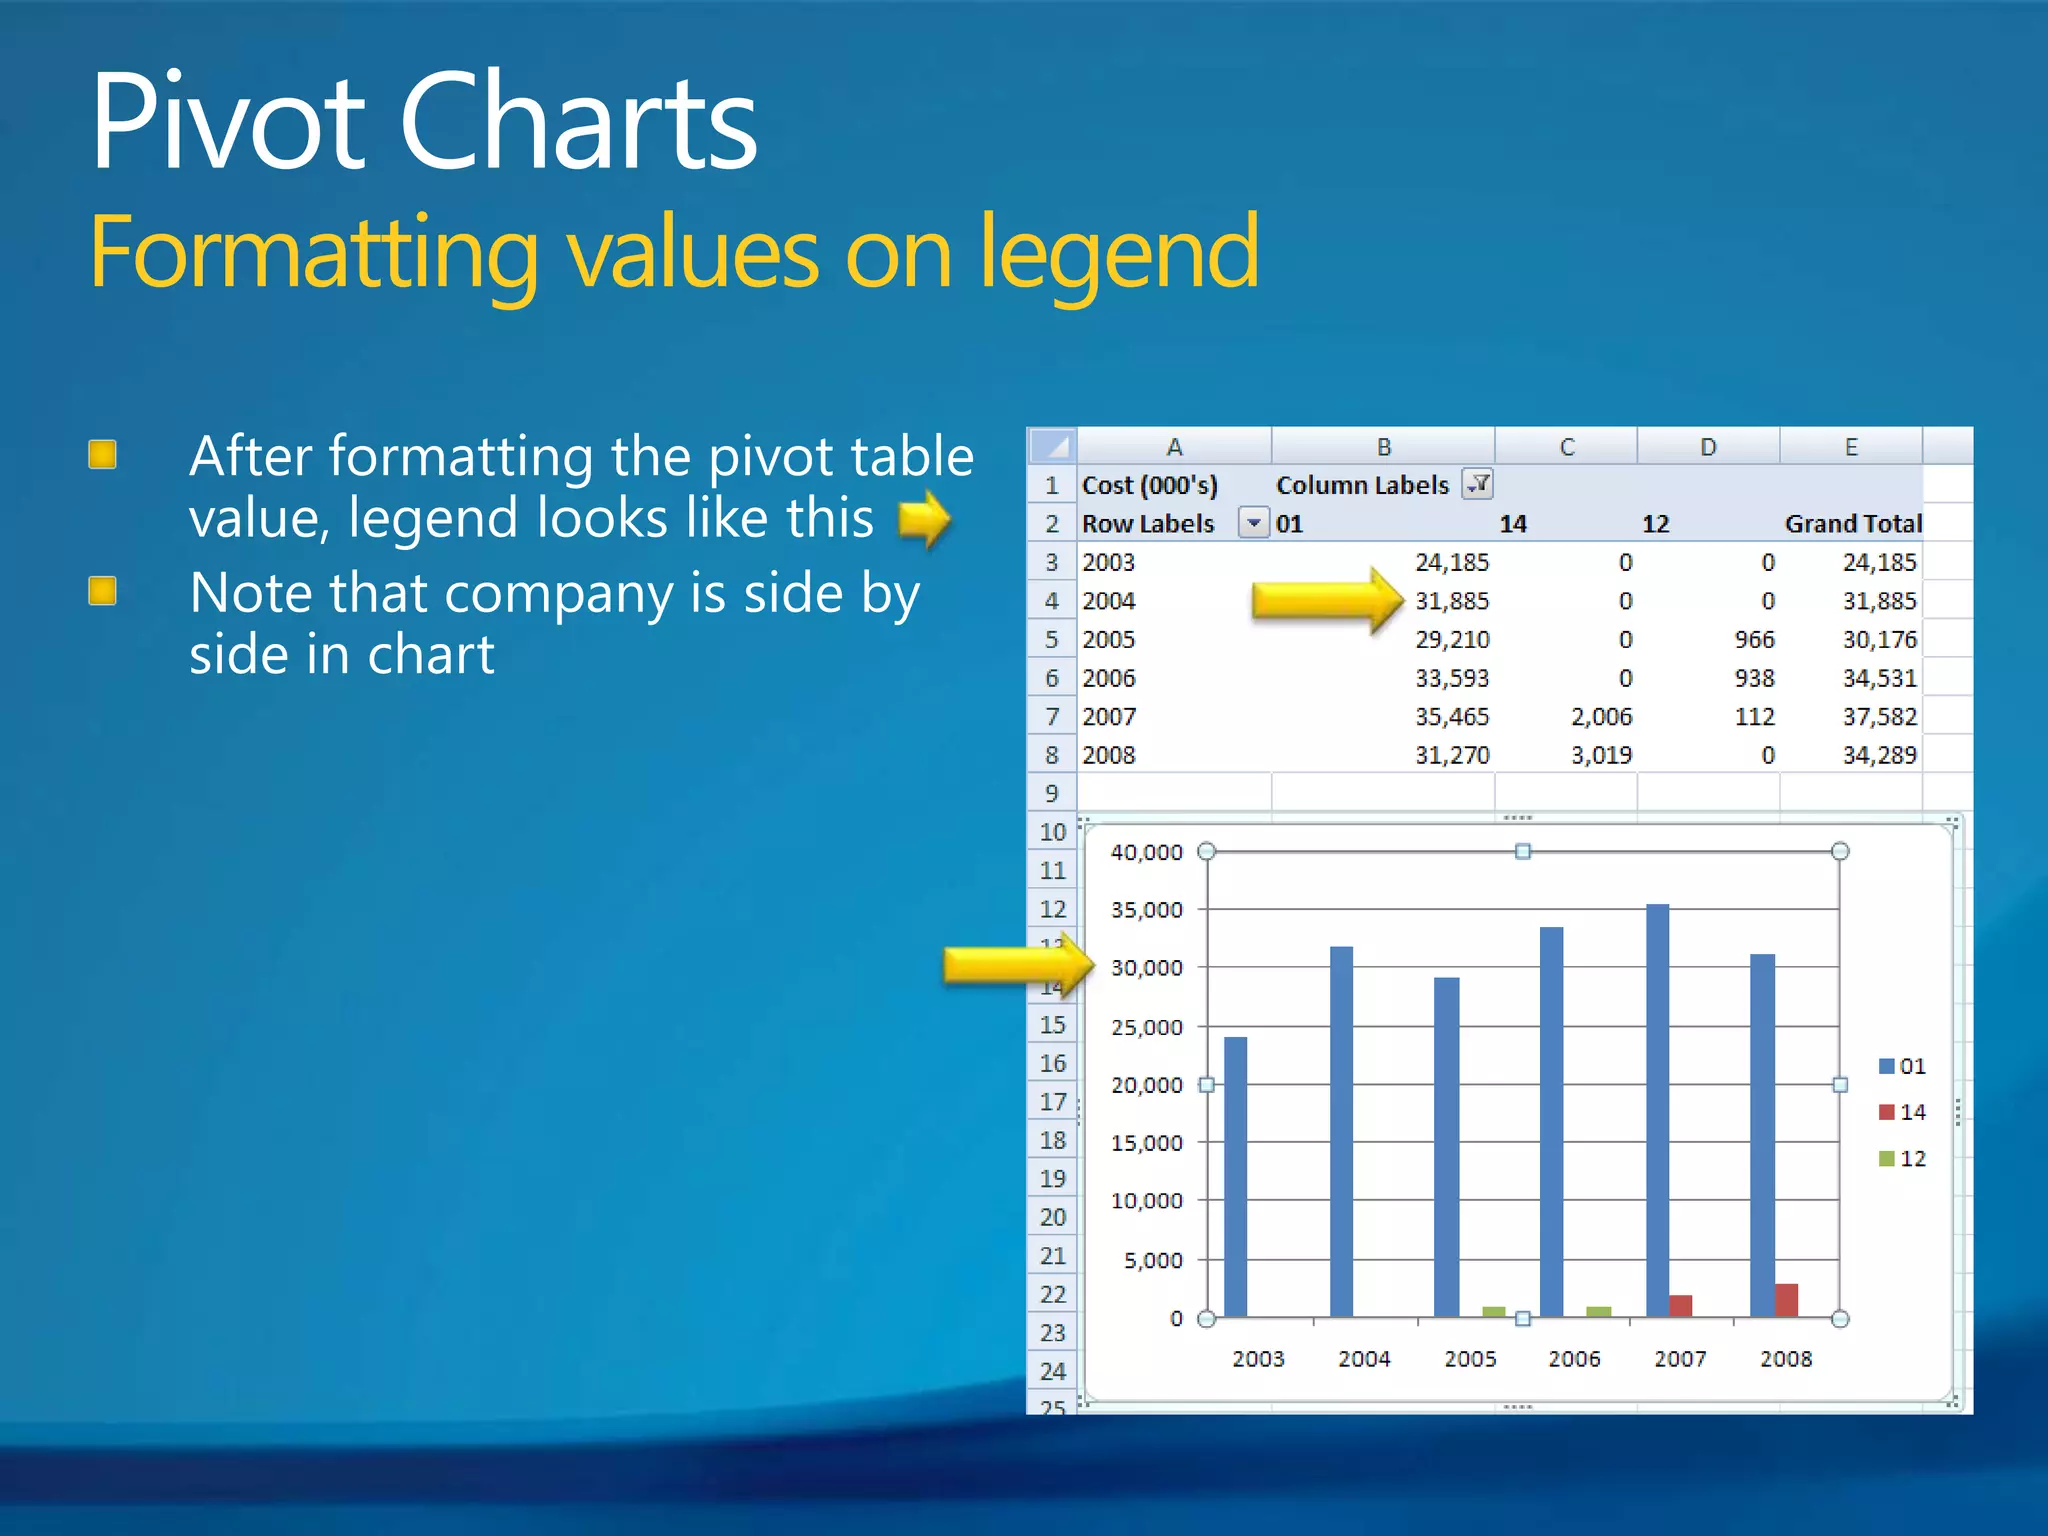
2. Lay out and format pivot tables by placing fields in rows, columns, and values areas and using formatting options.
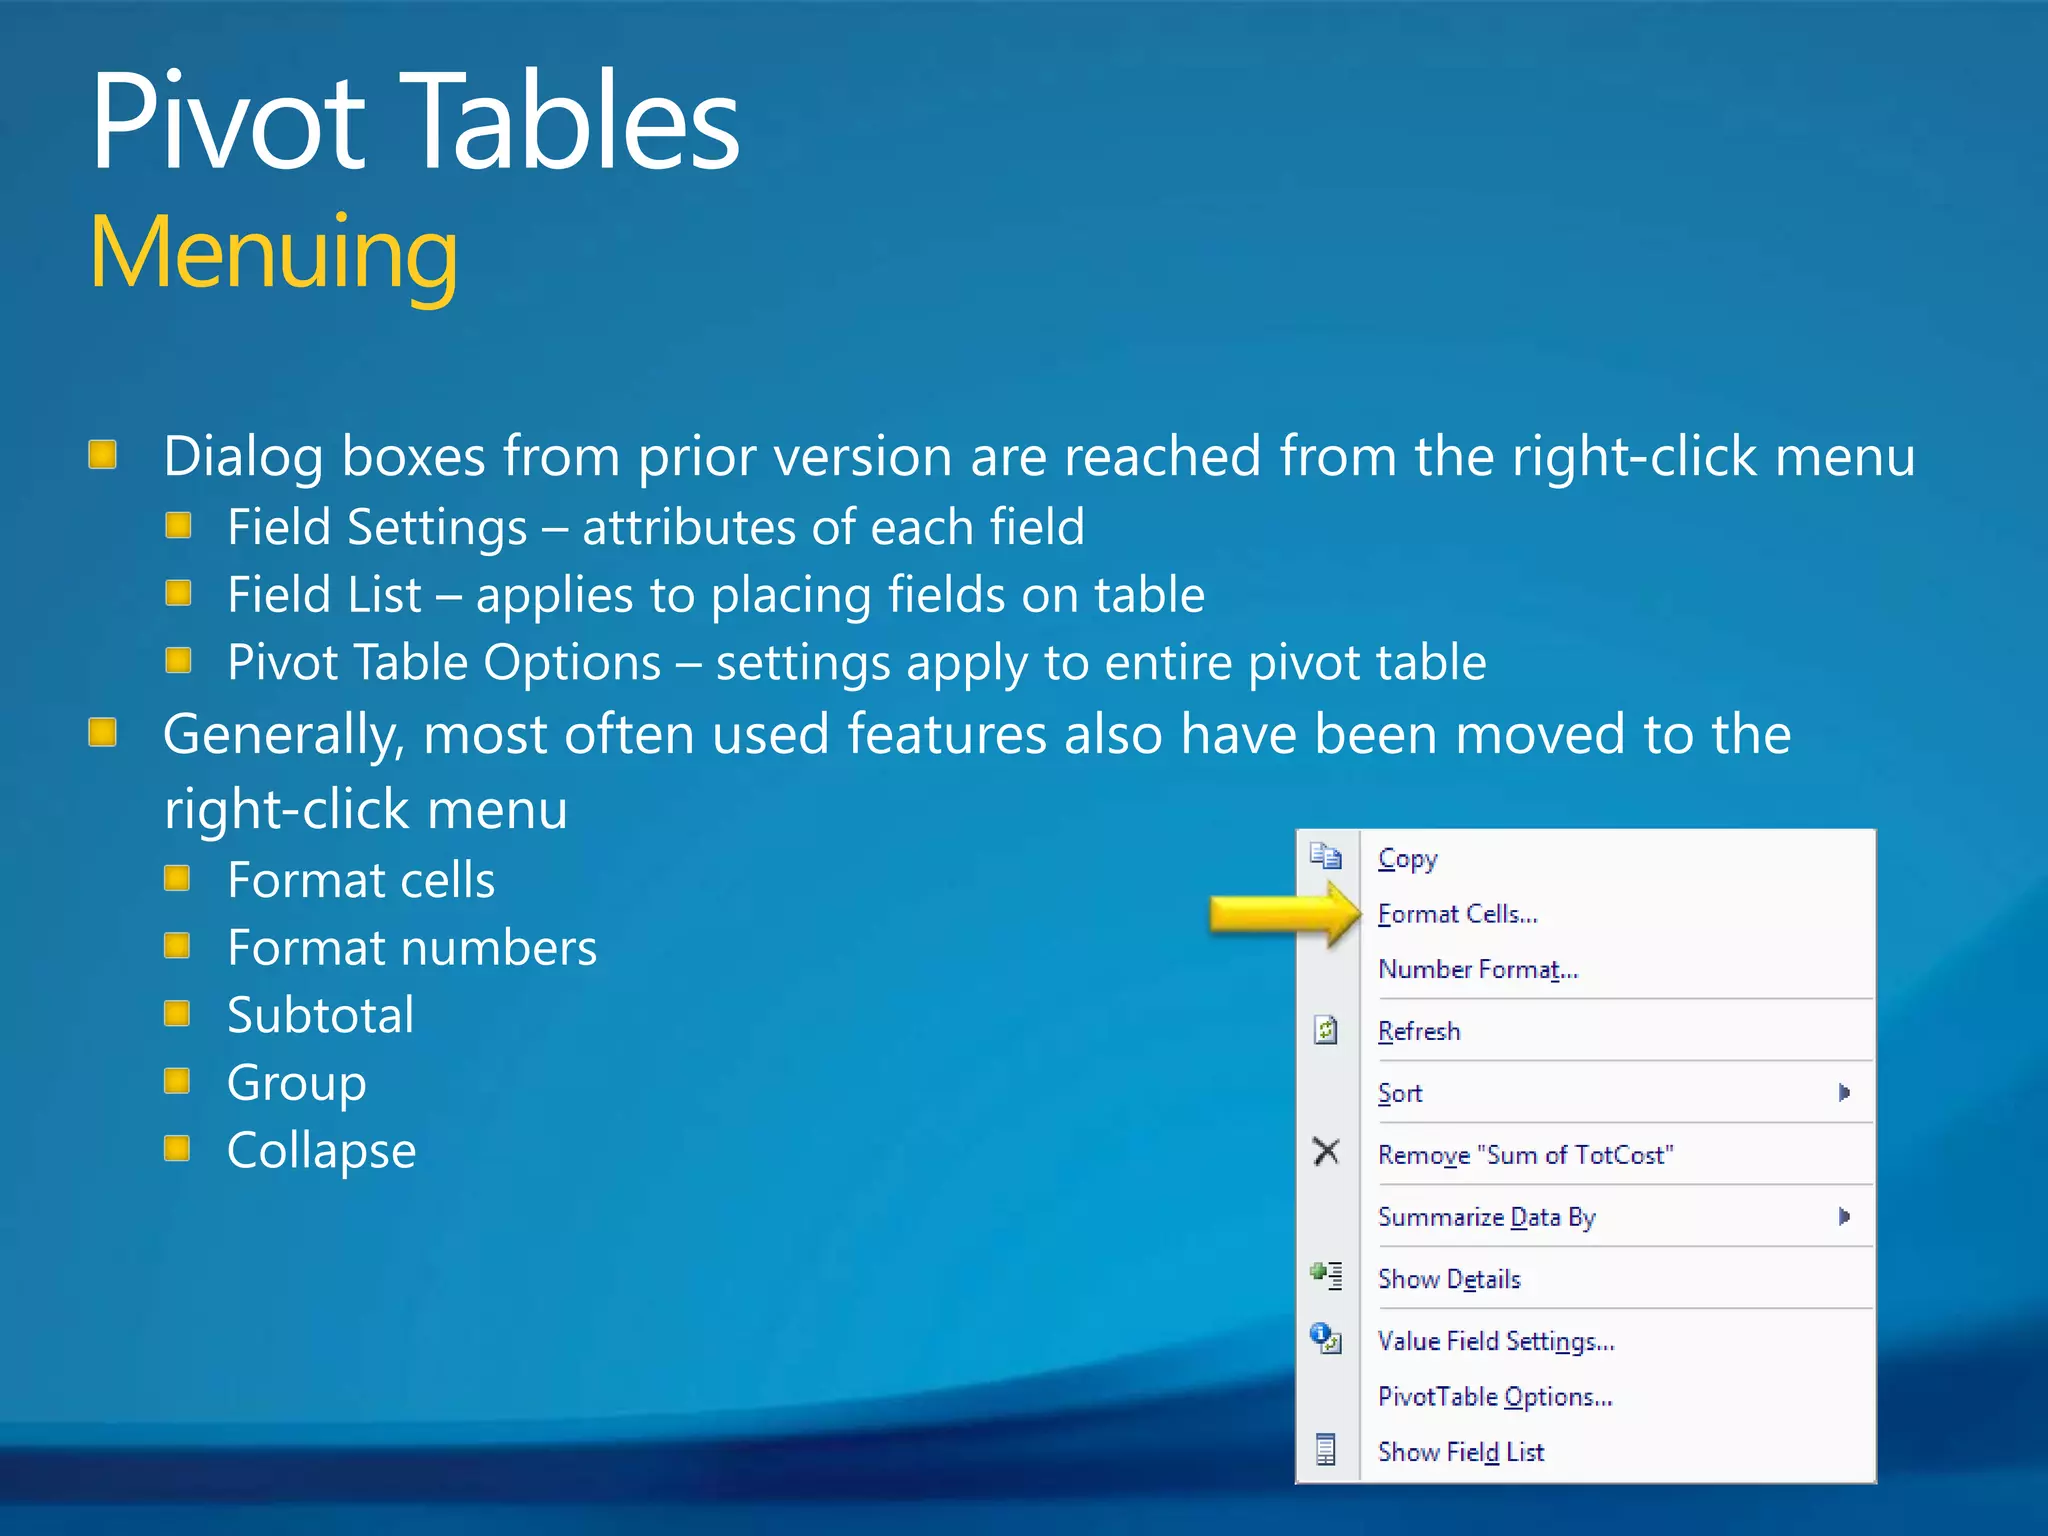
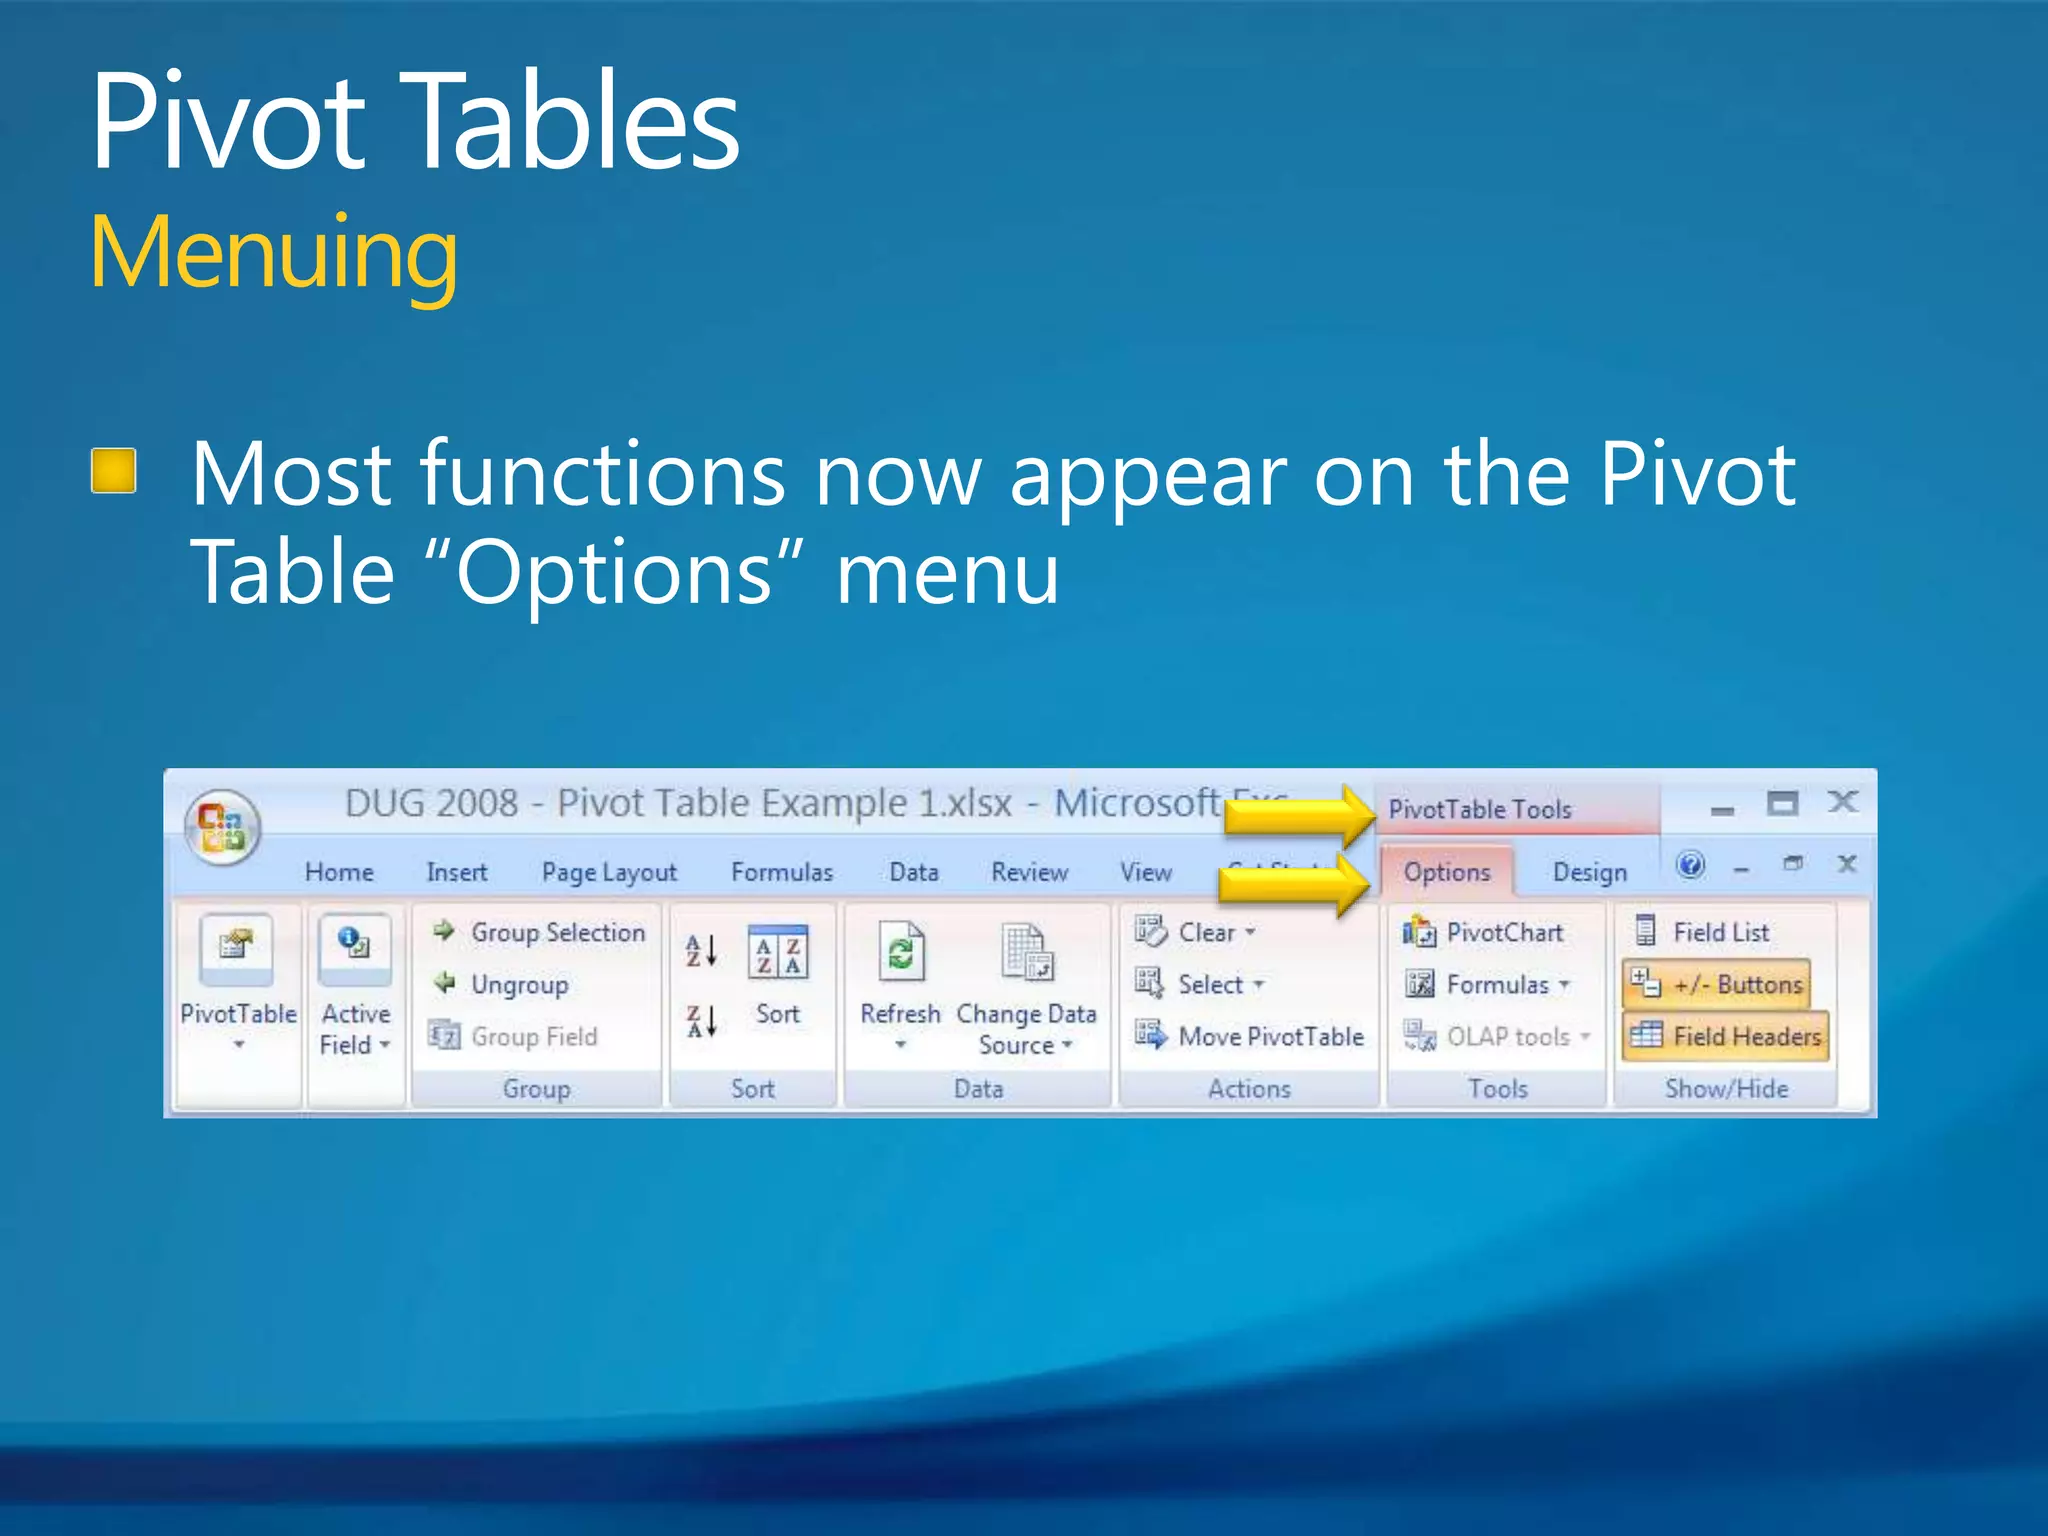
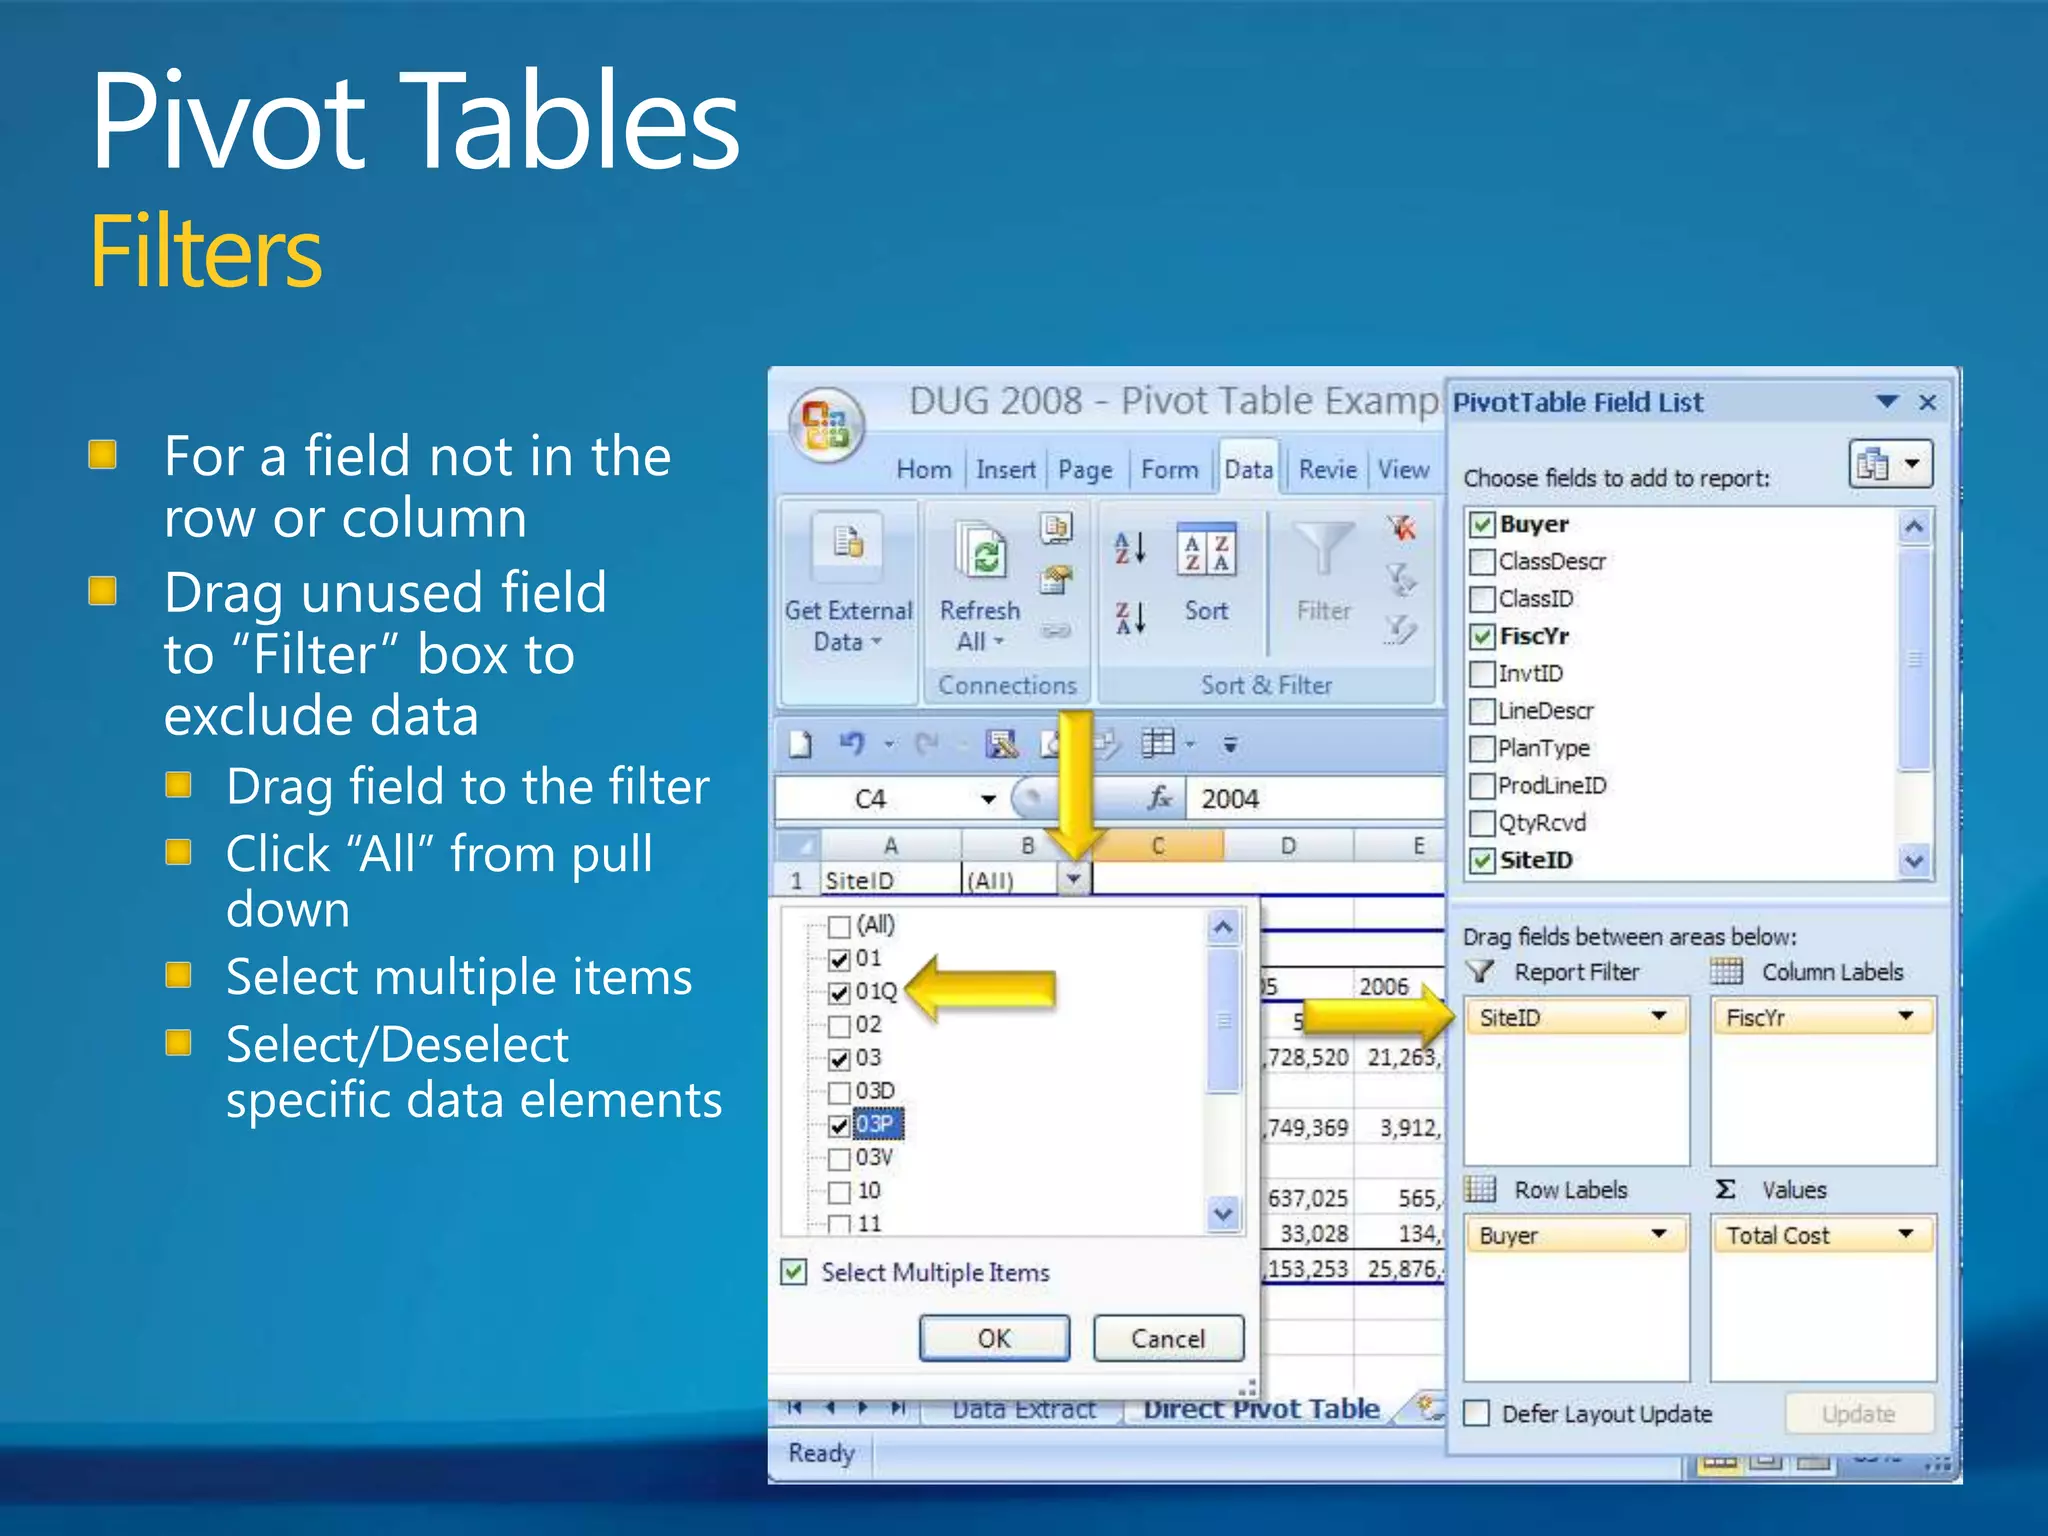
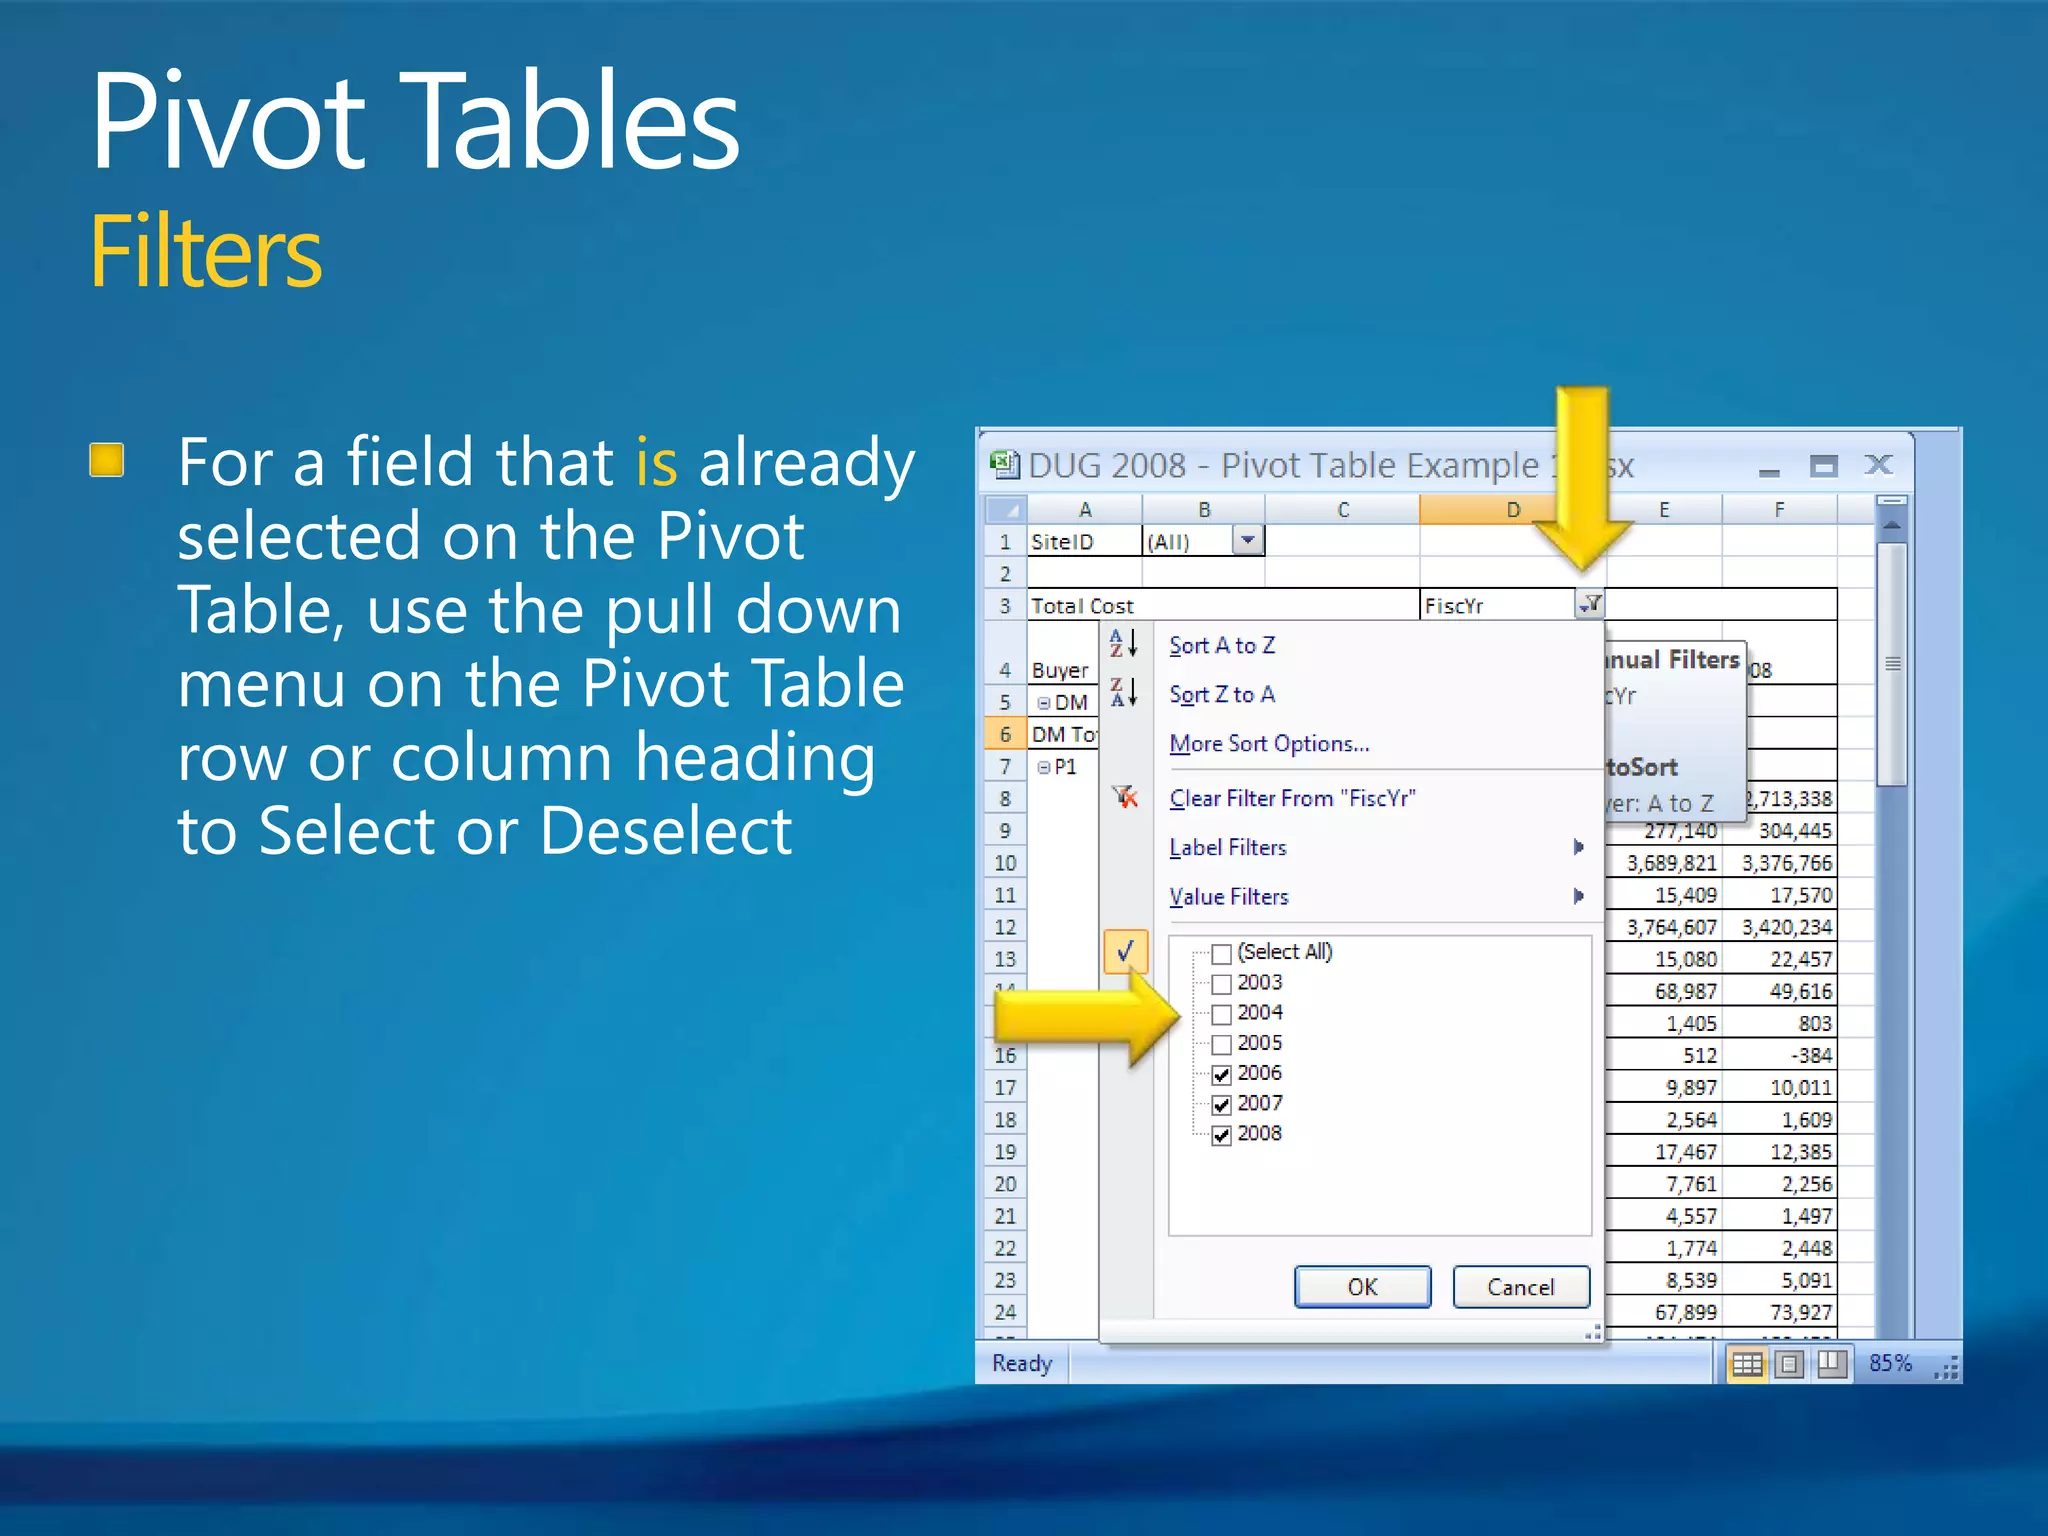
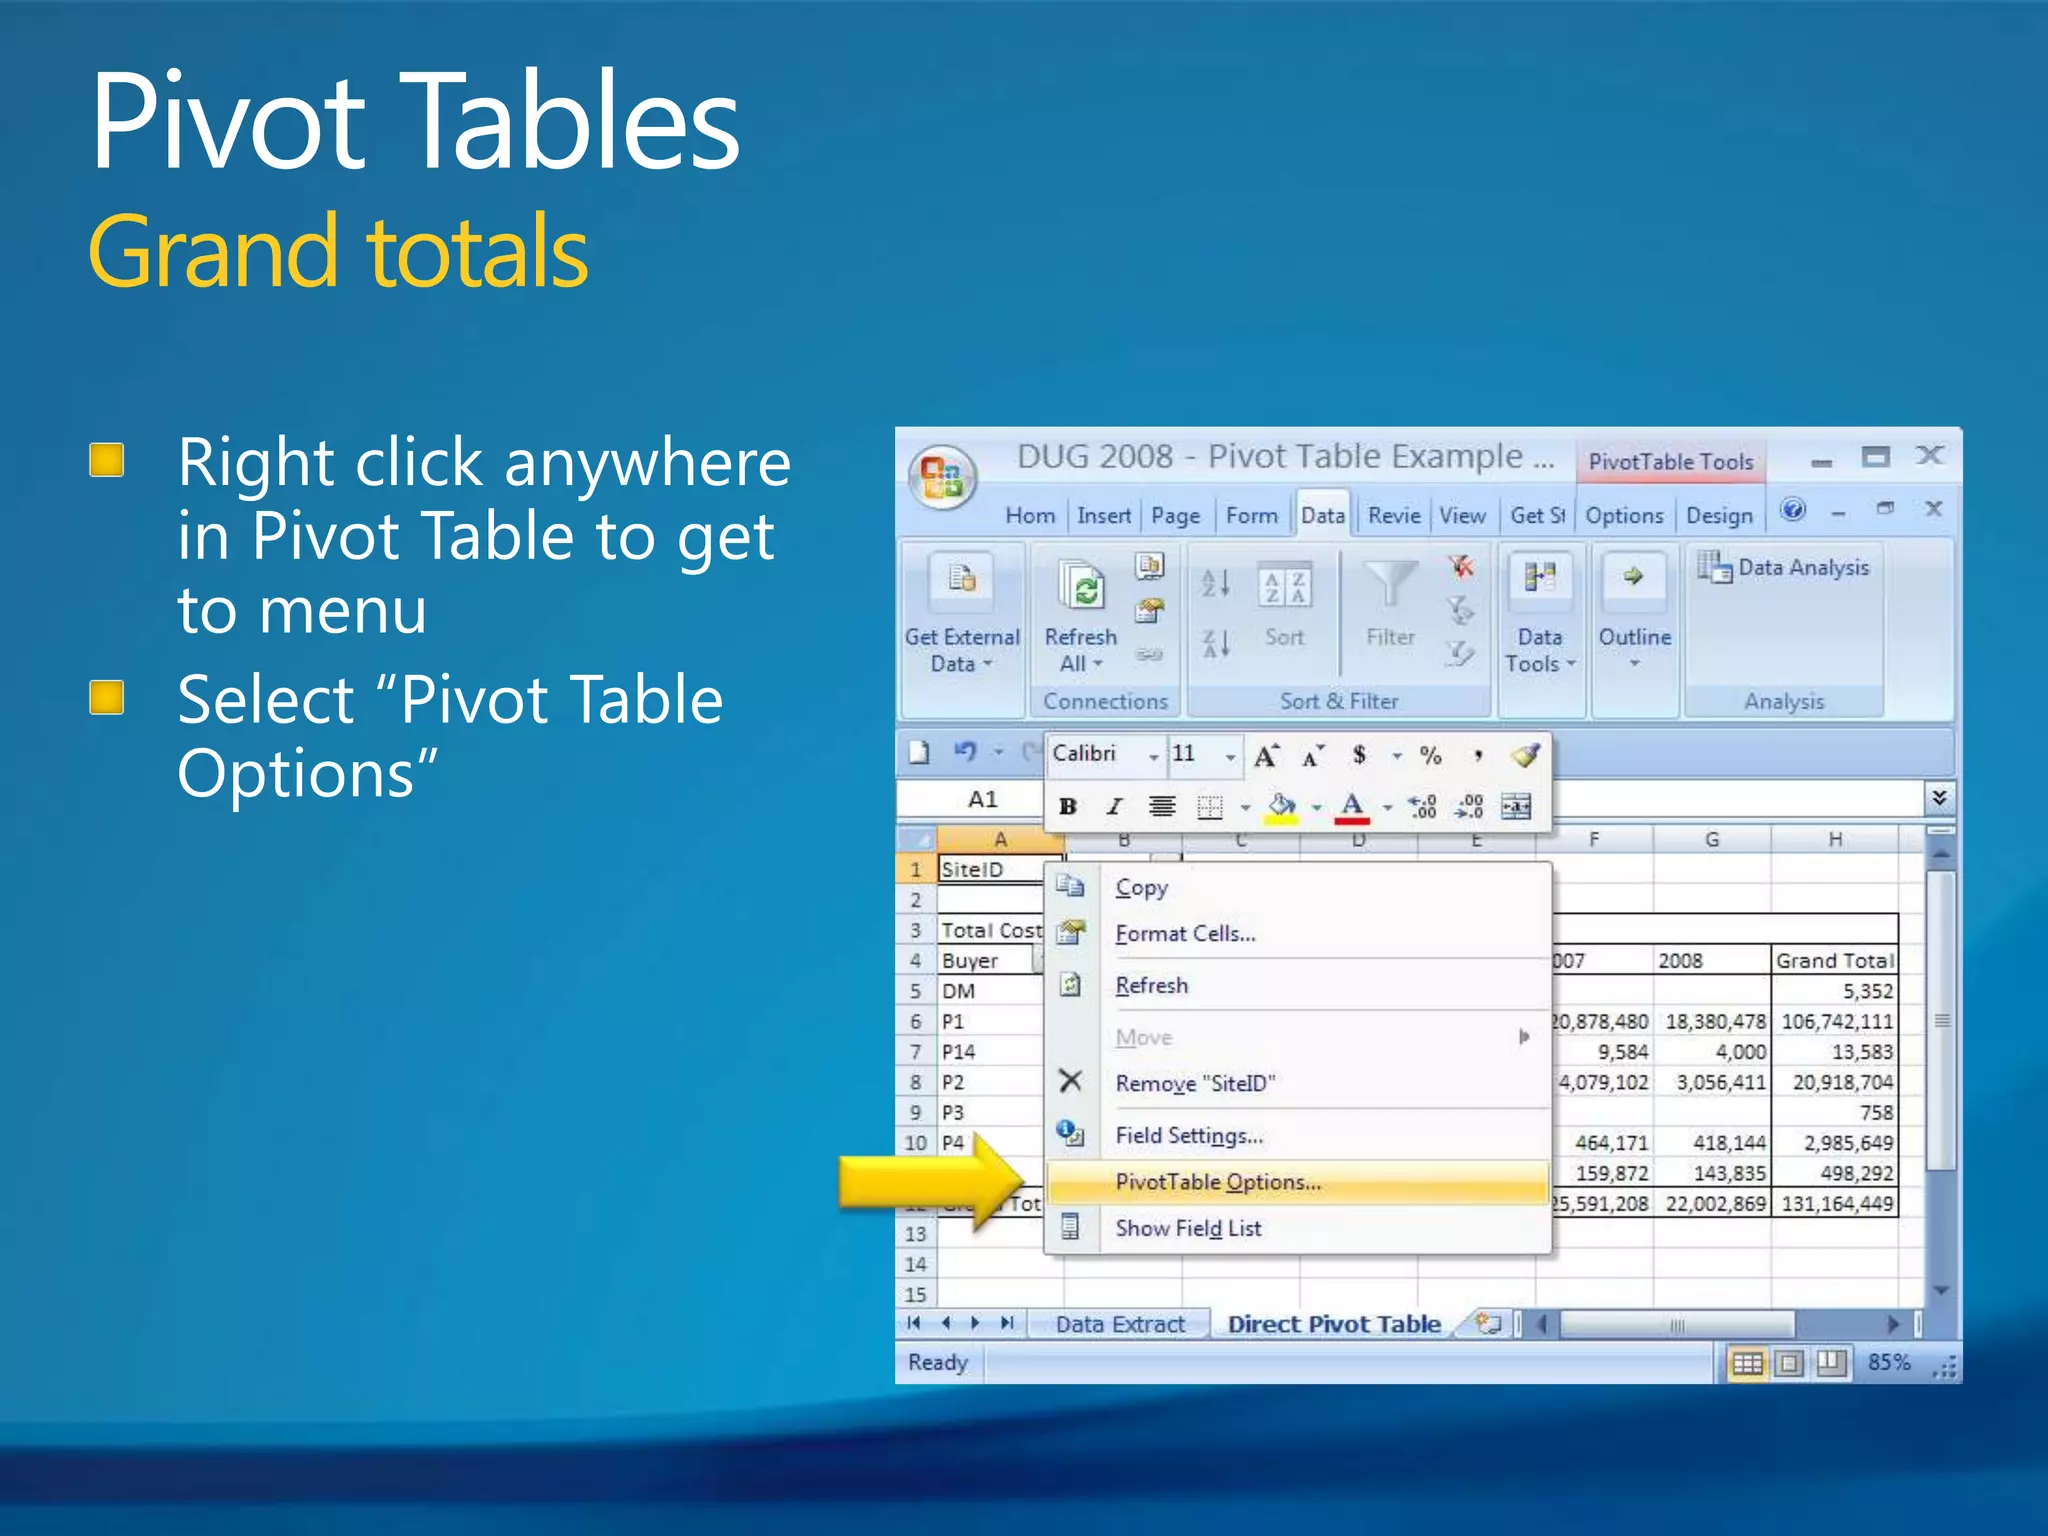
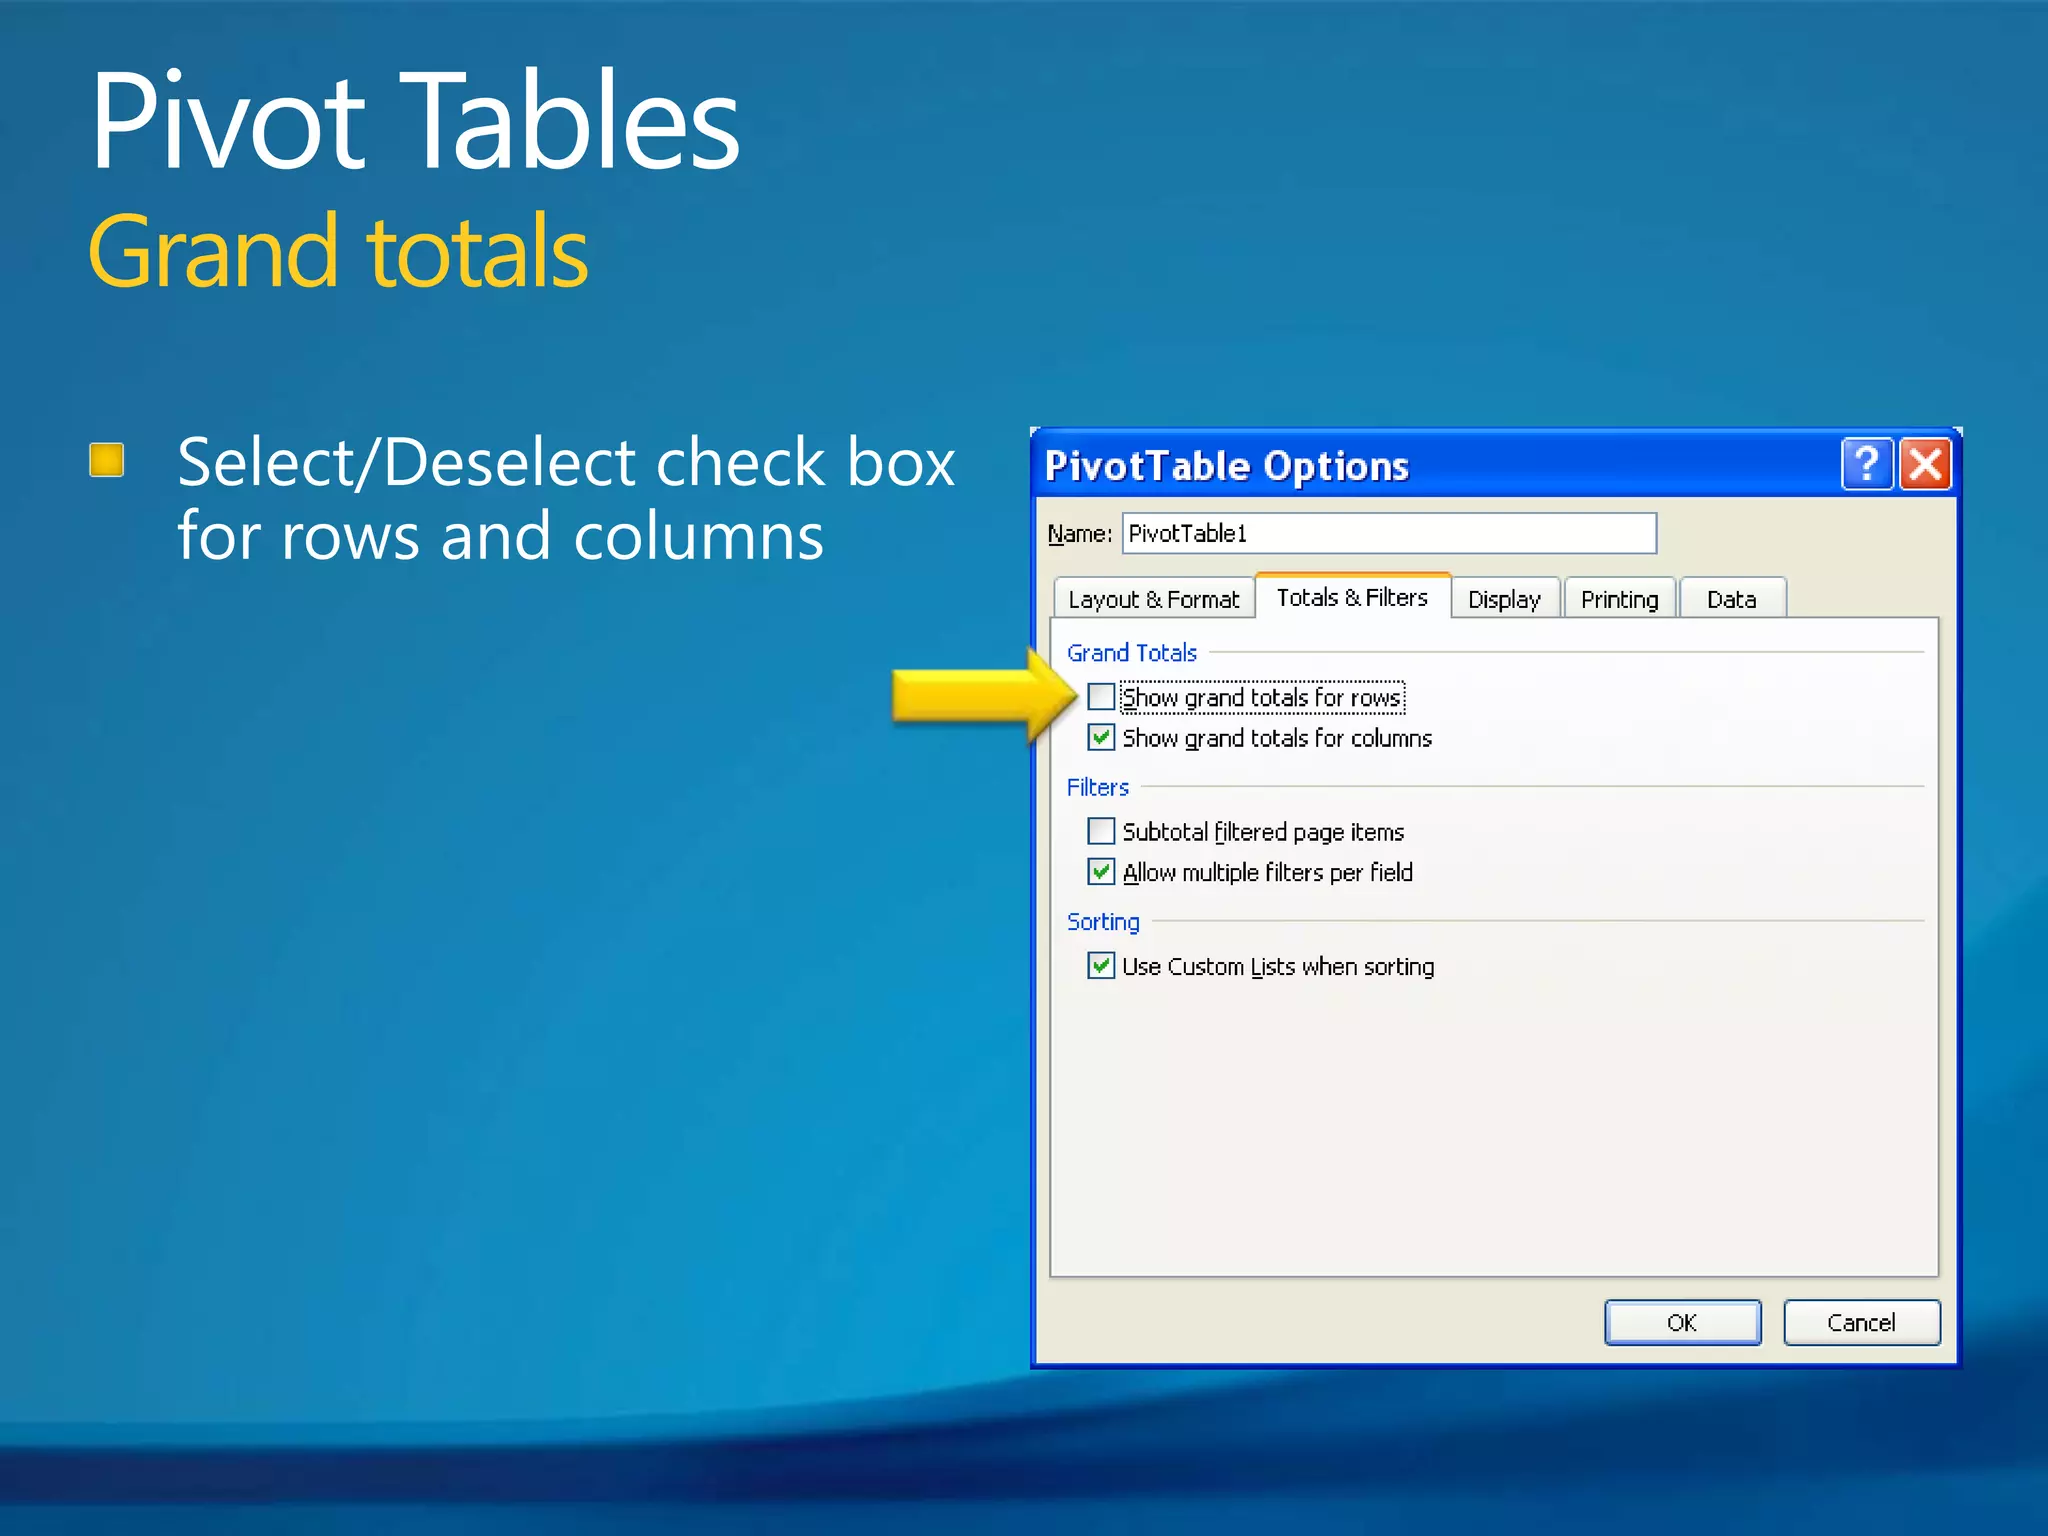
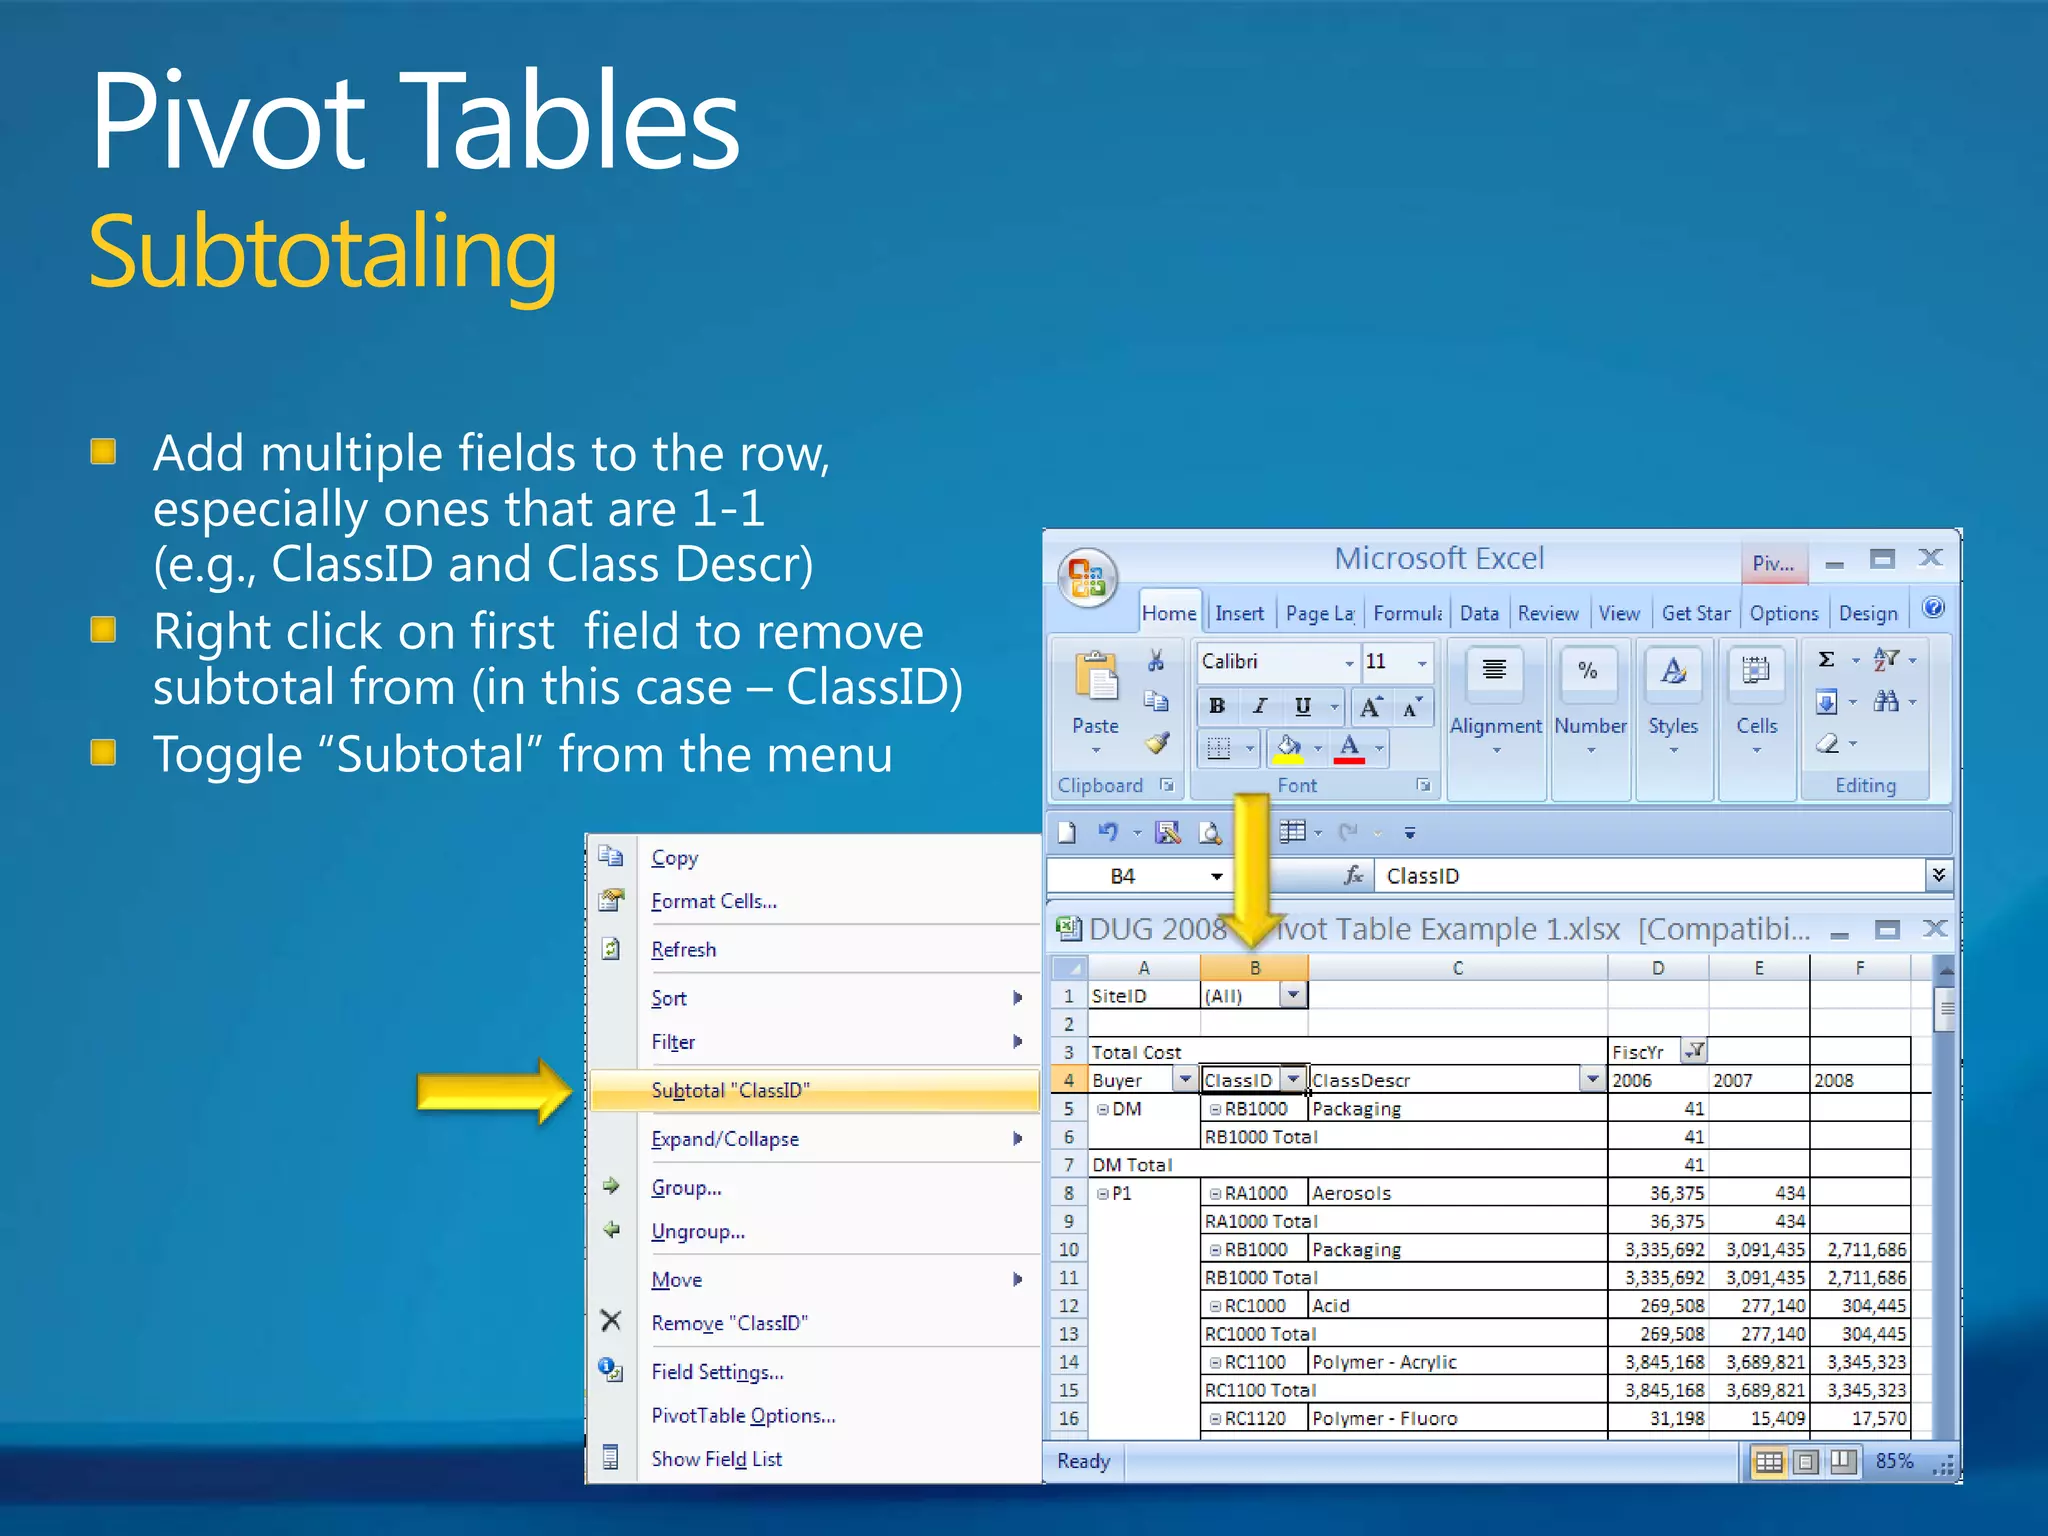
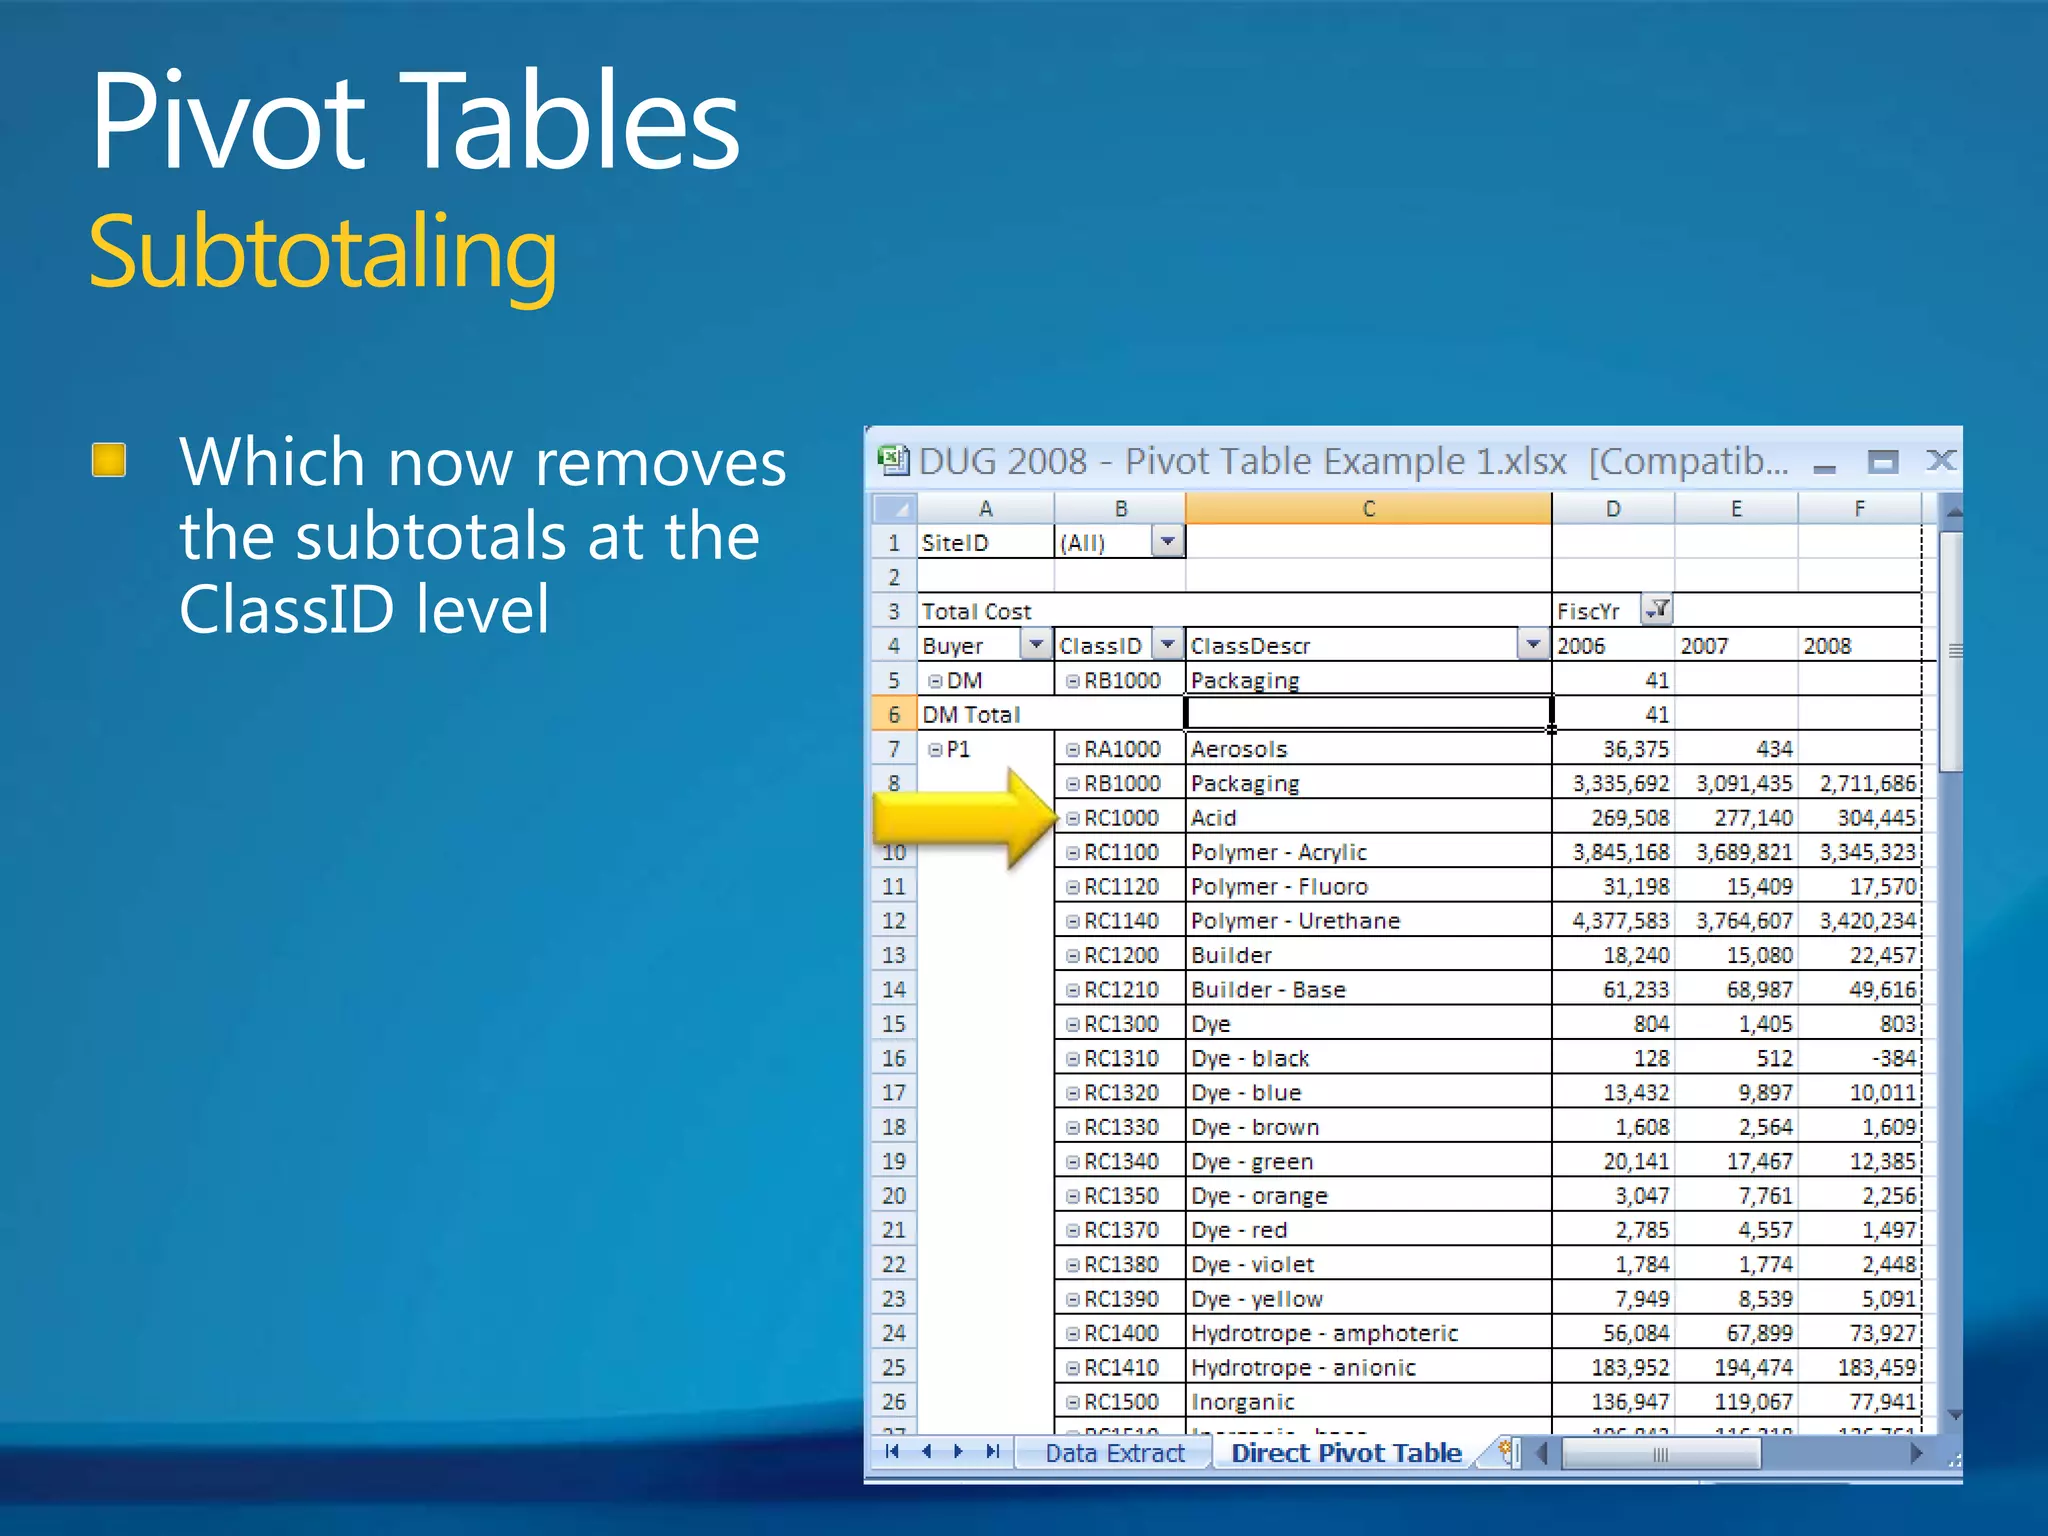
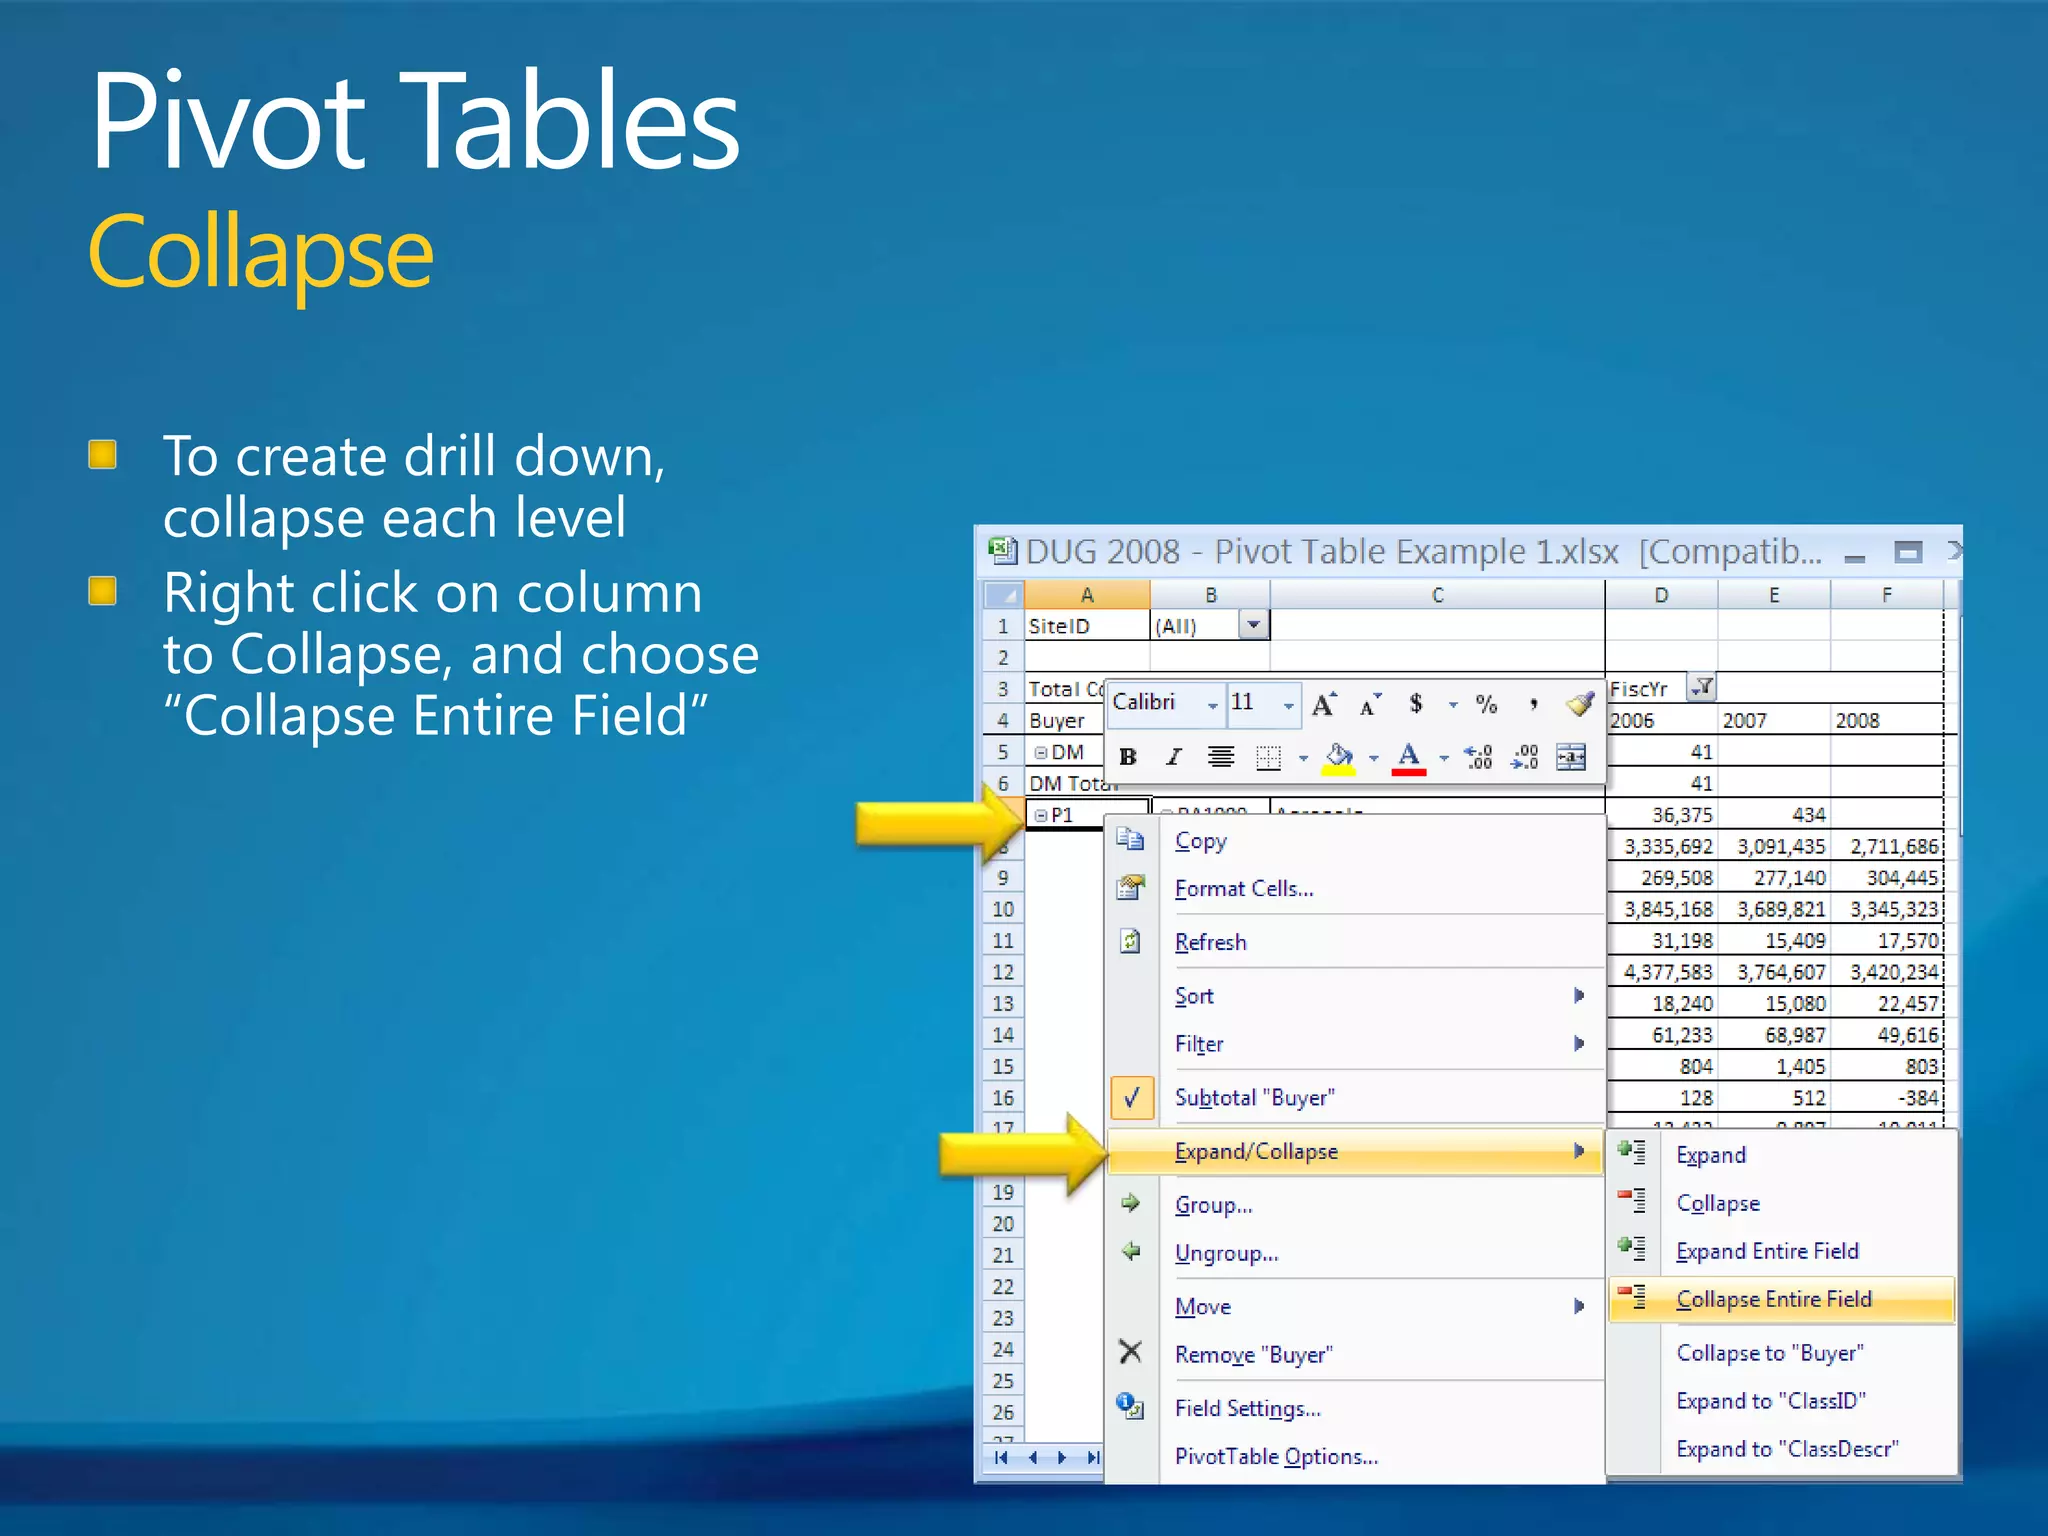
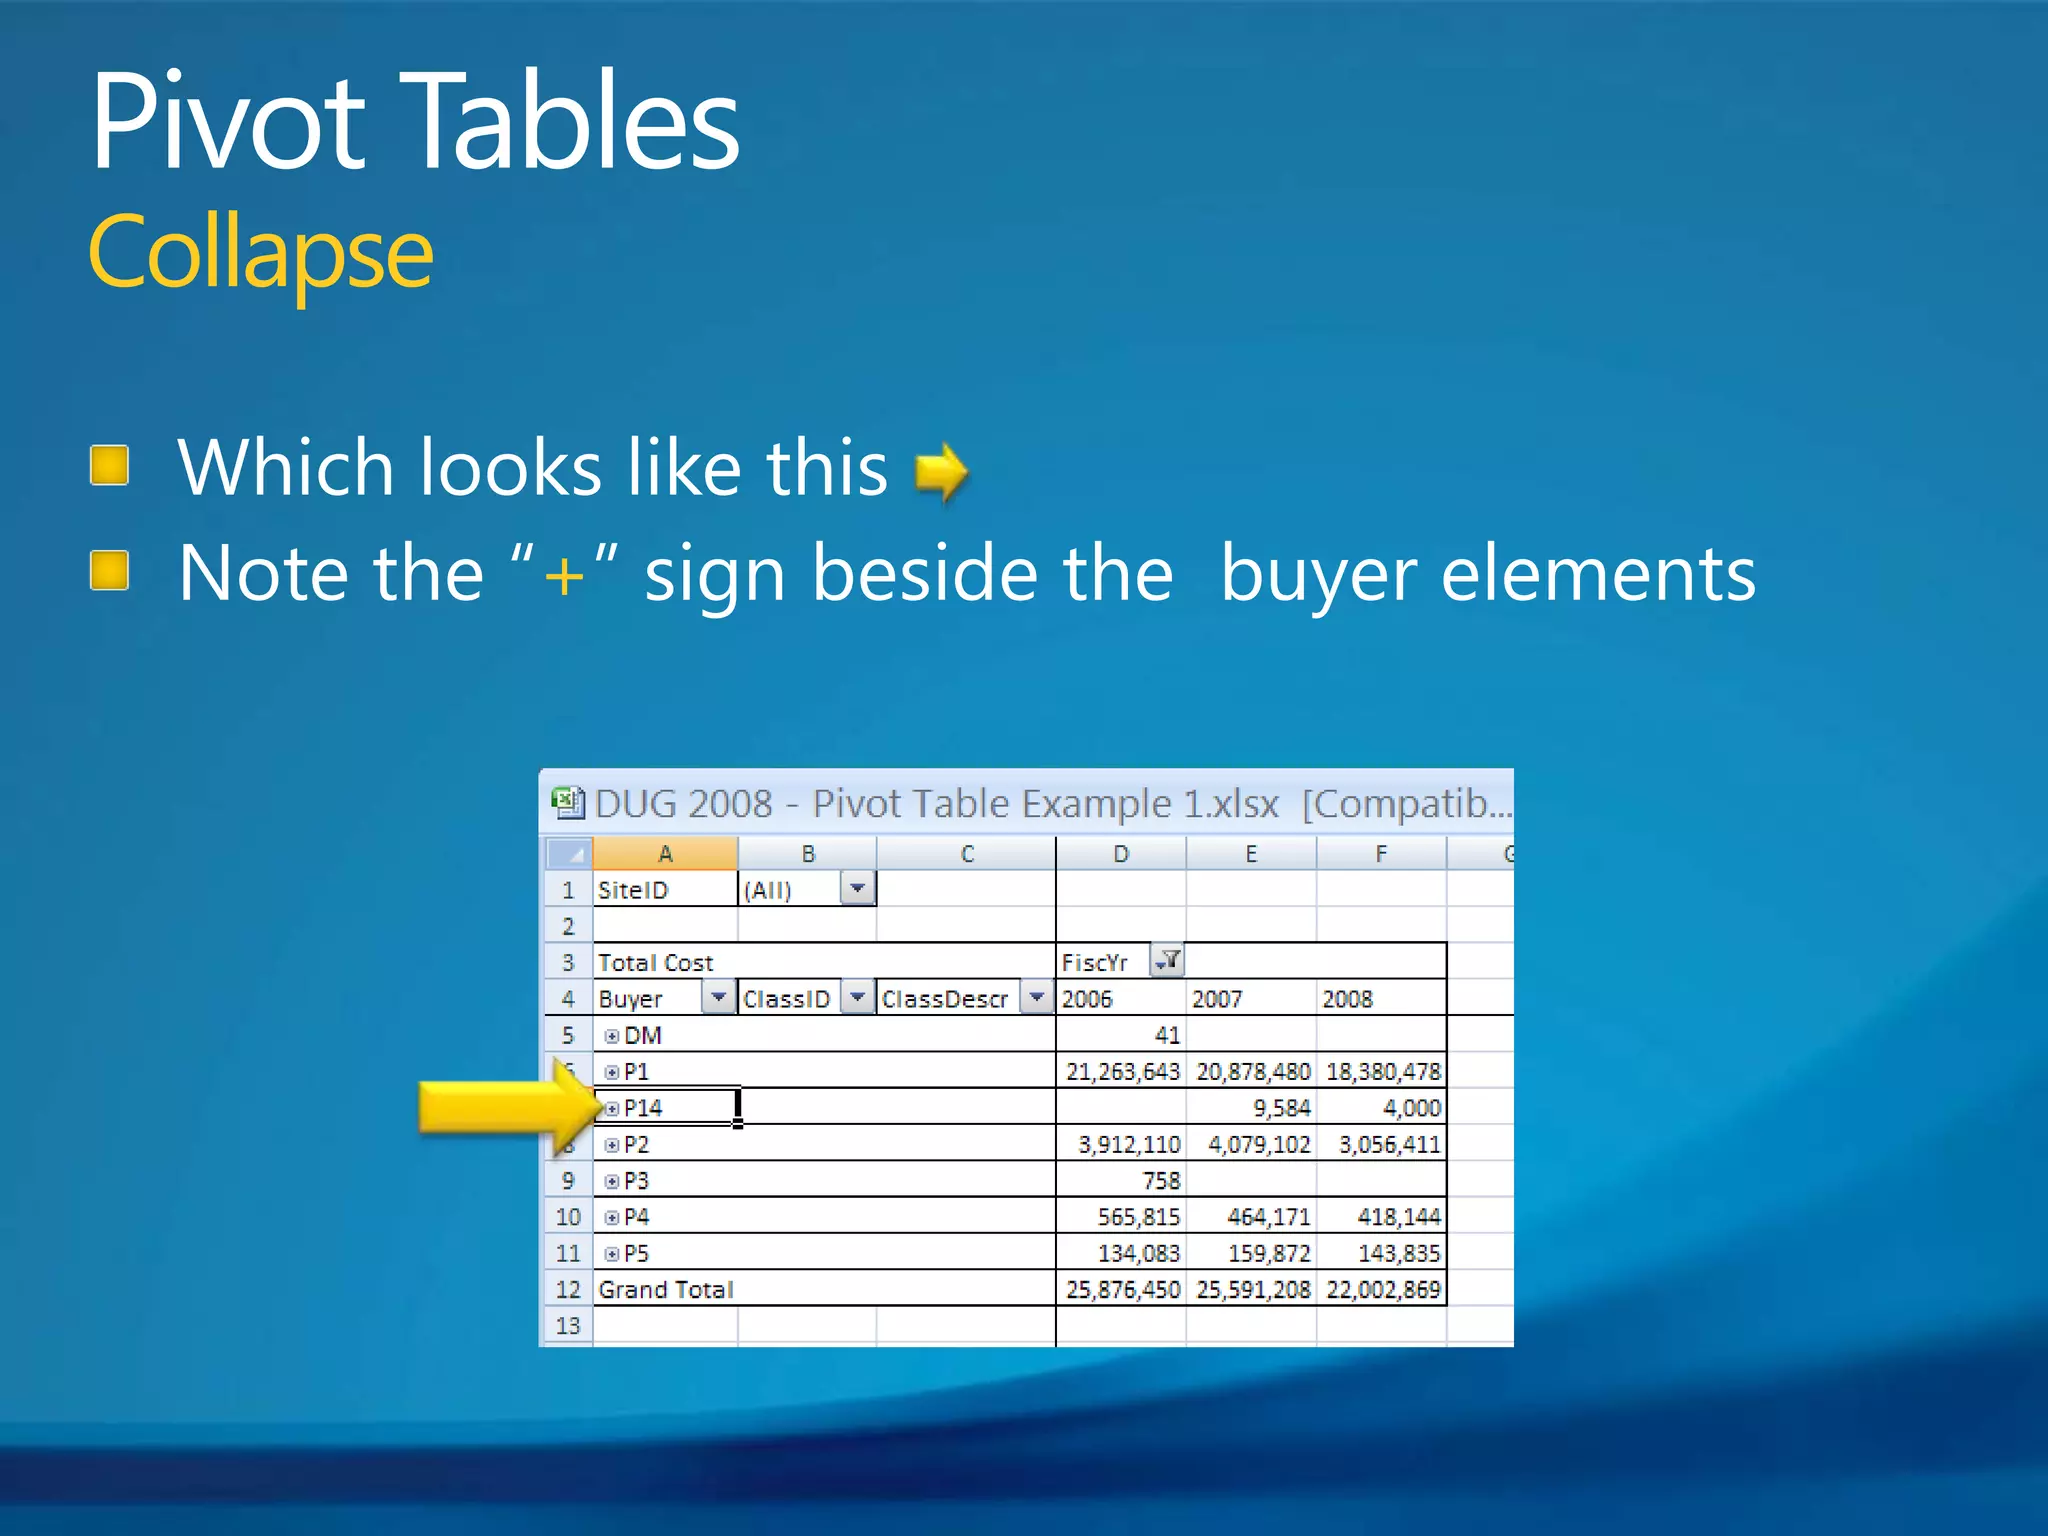
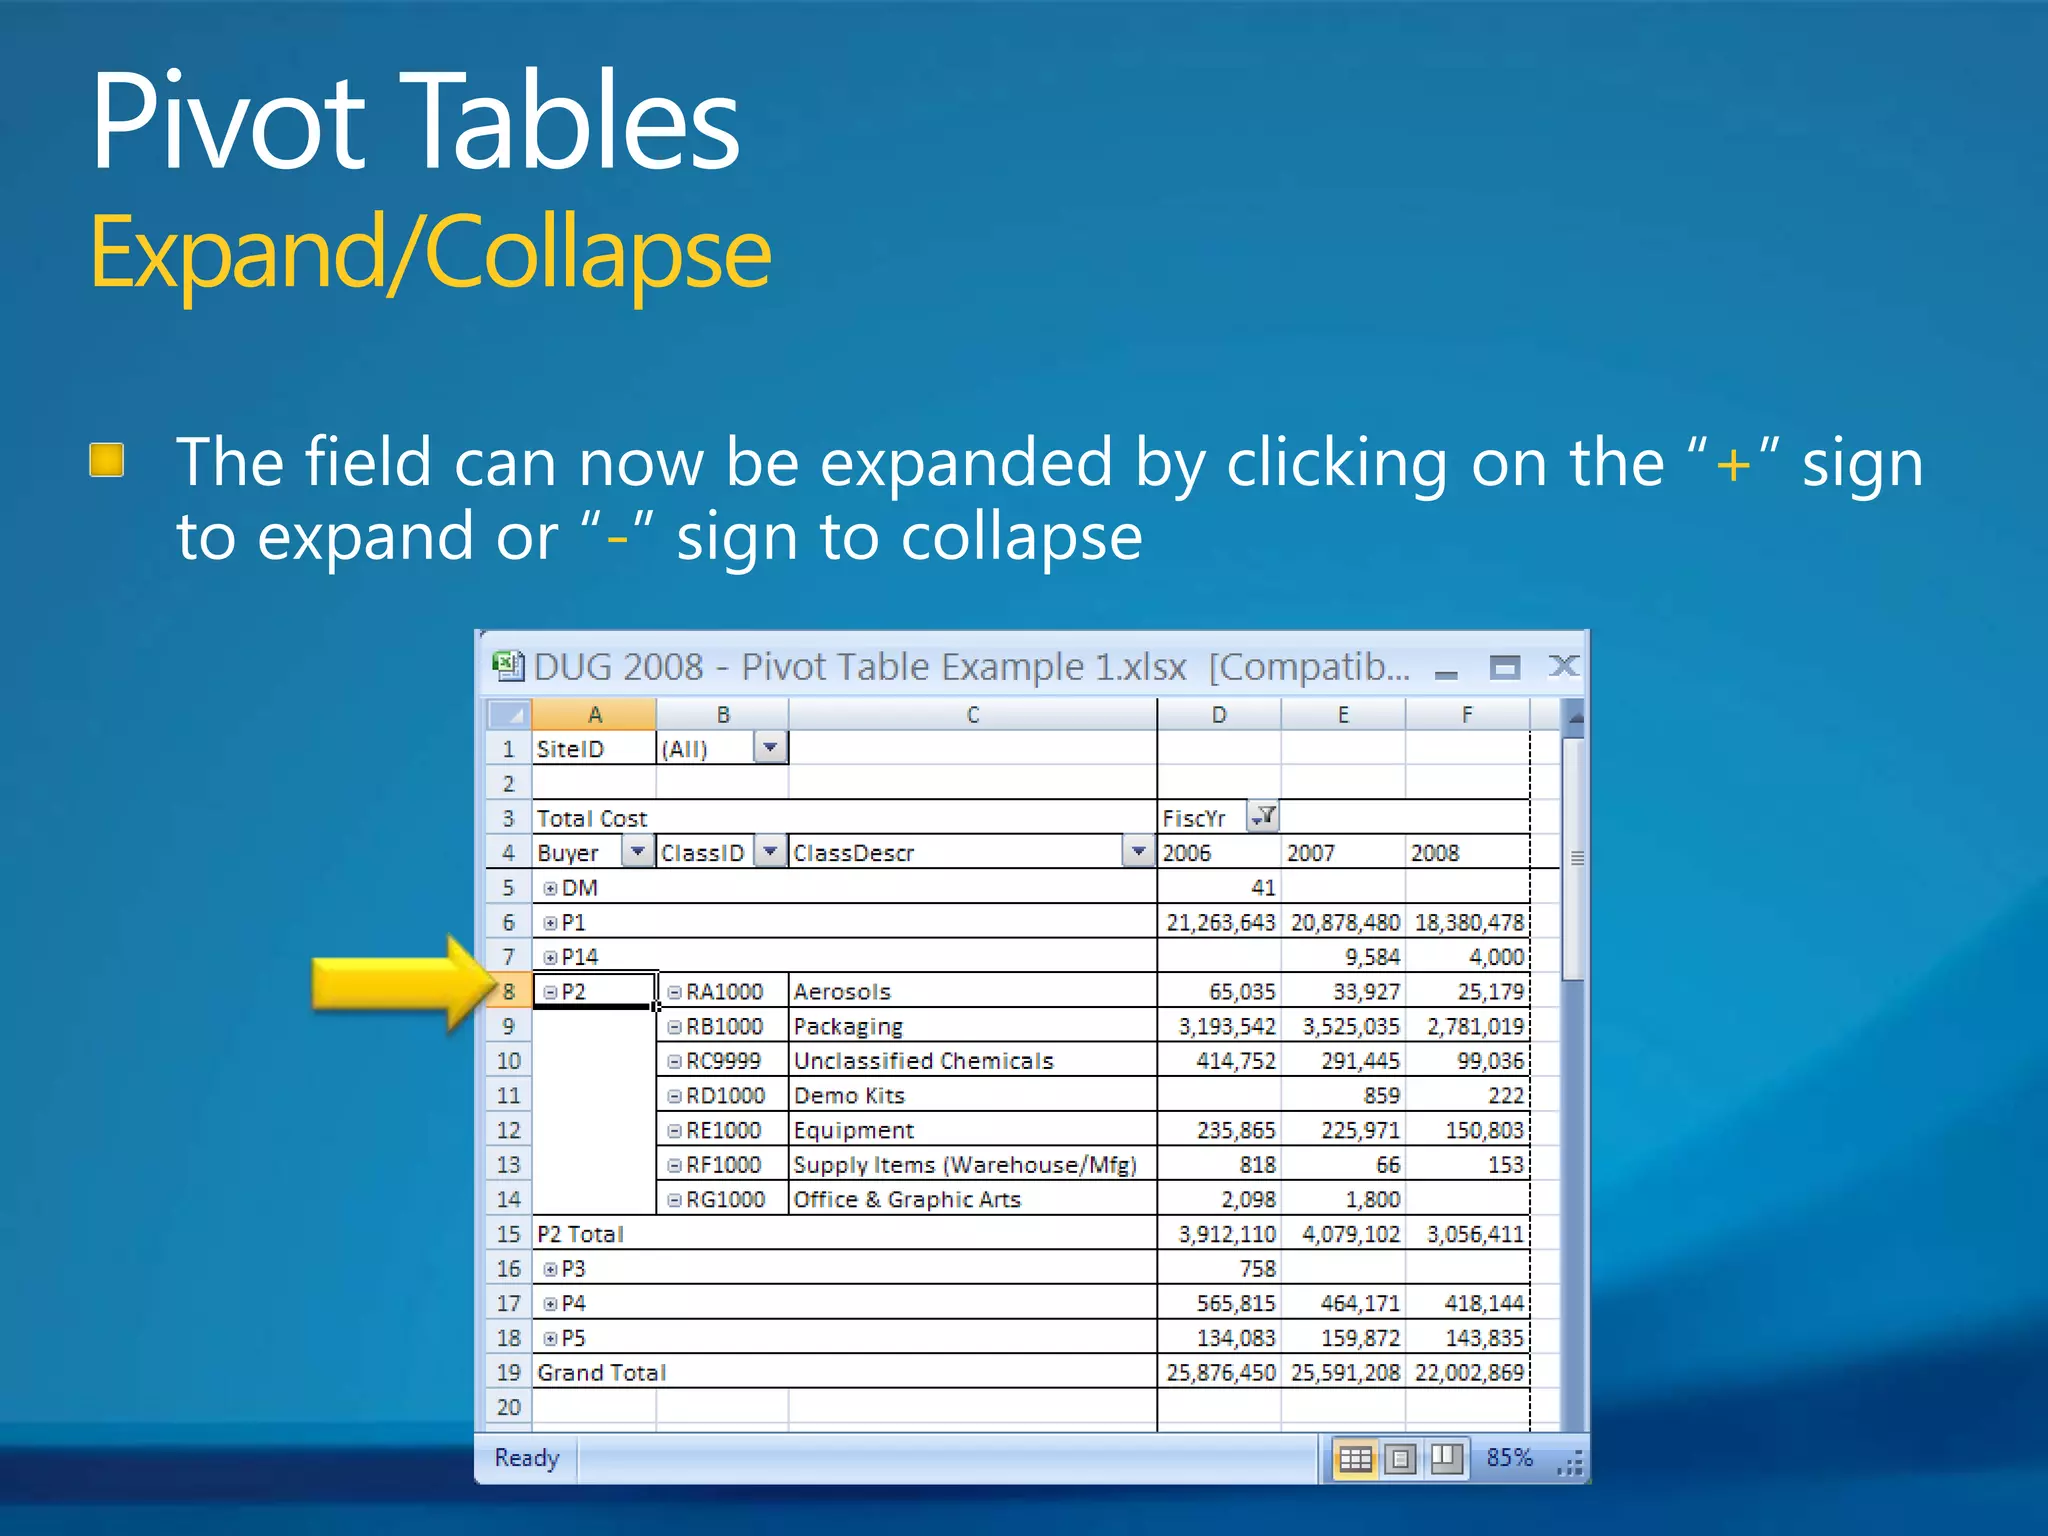
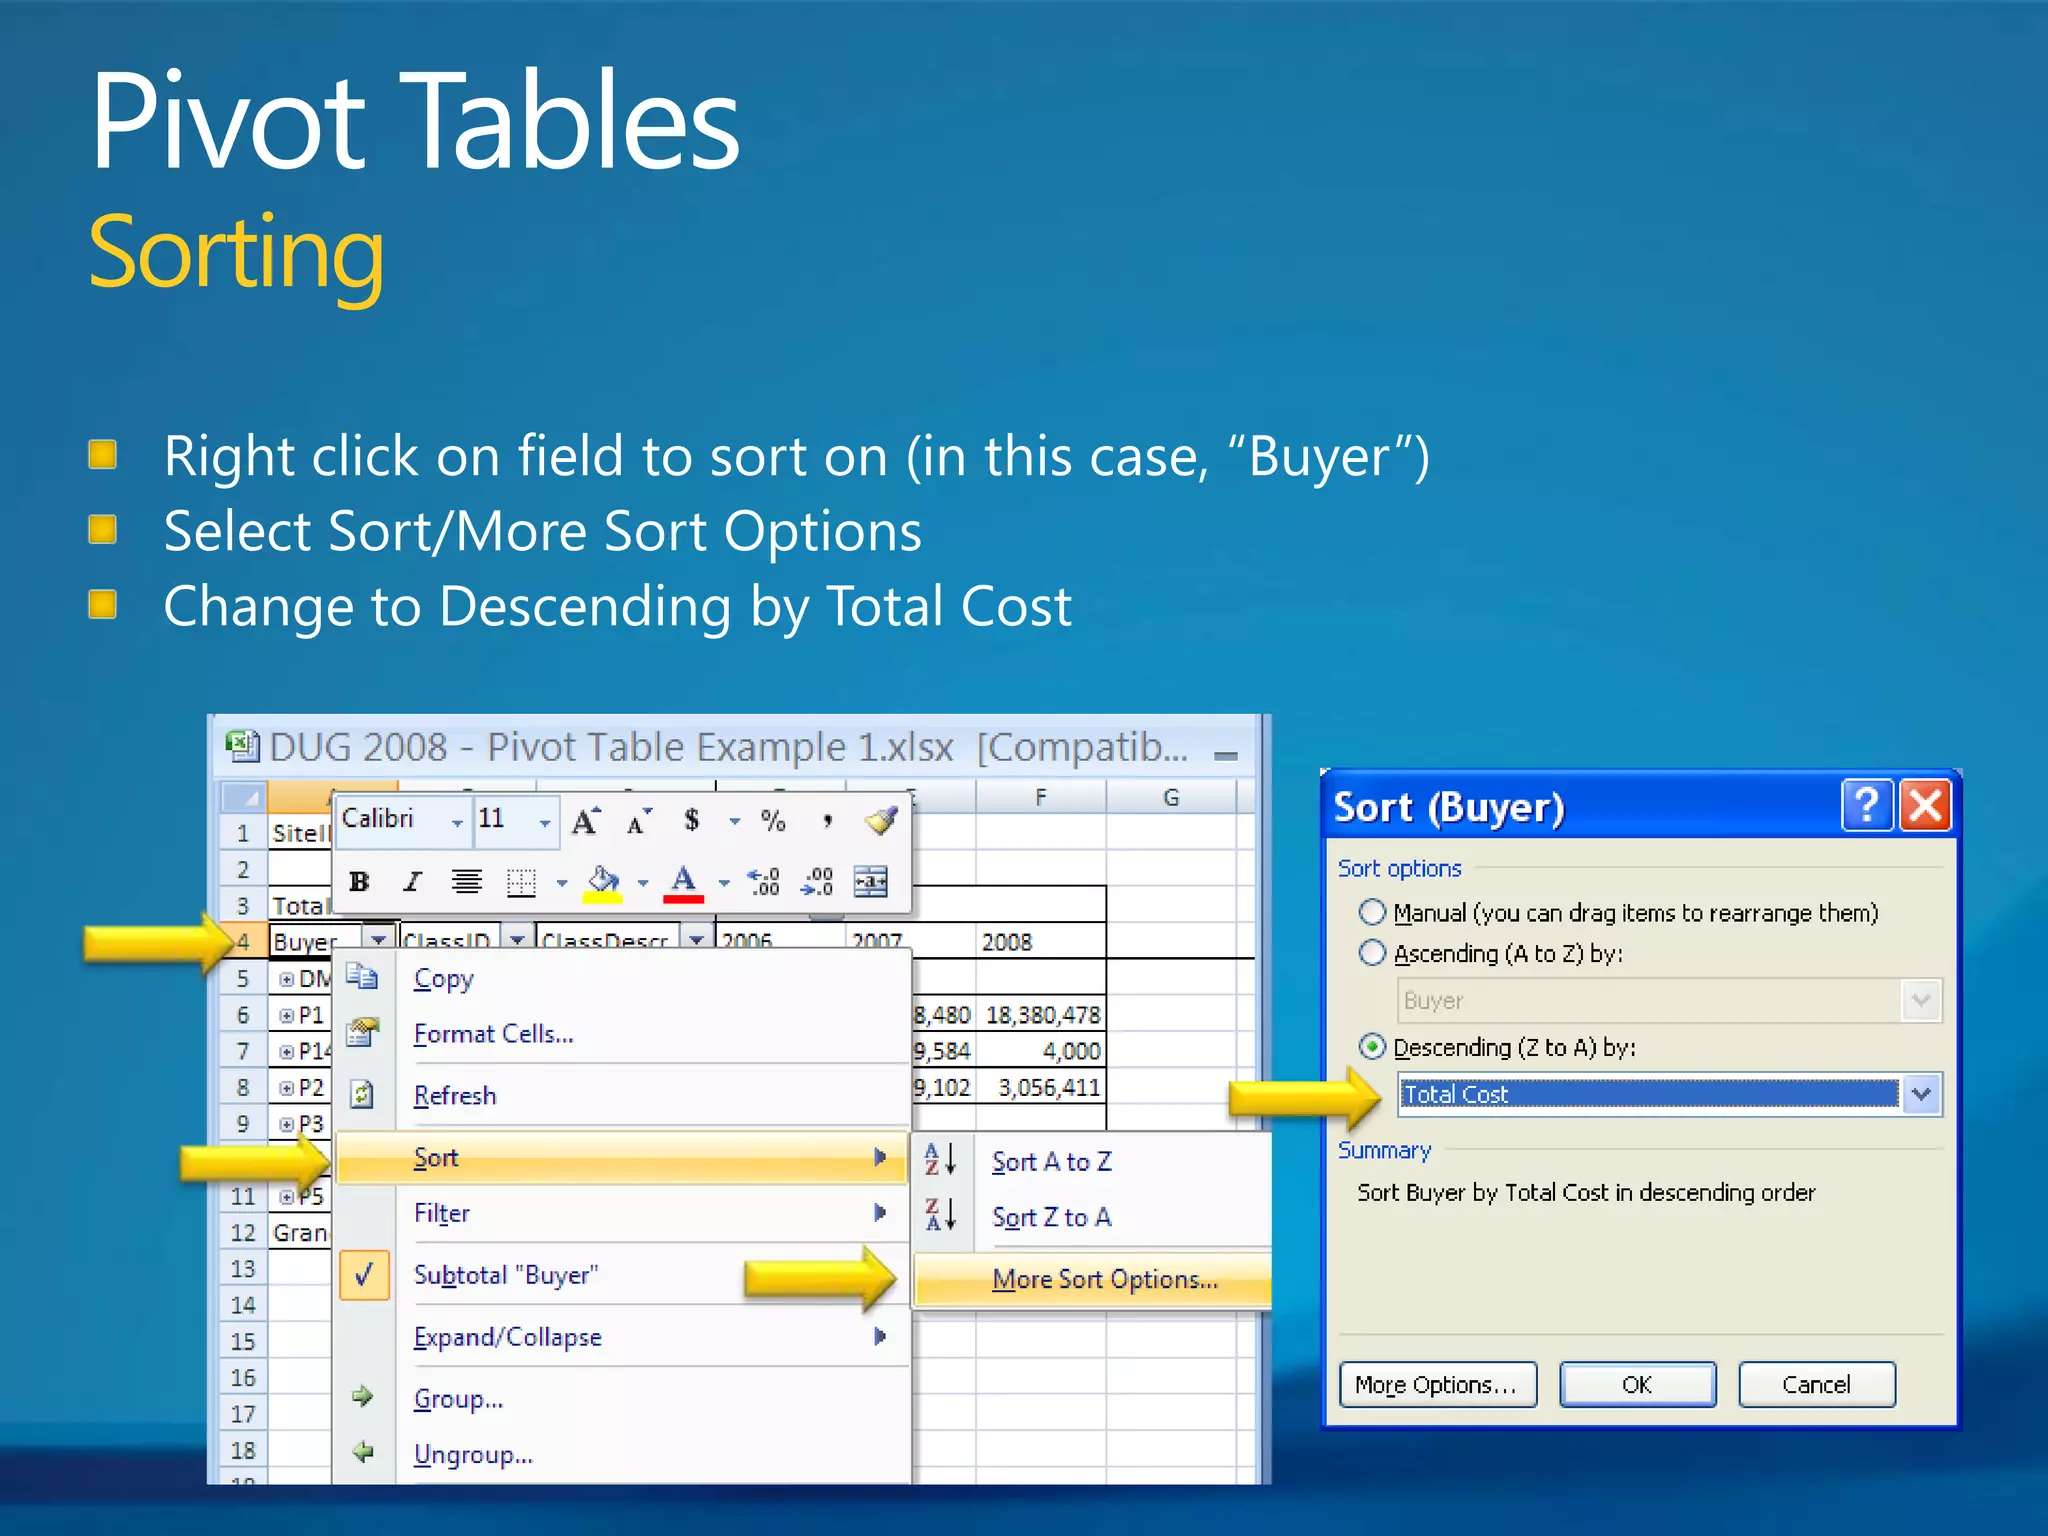
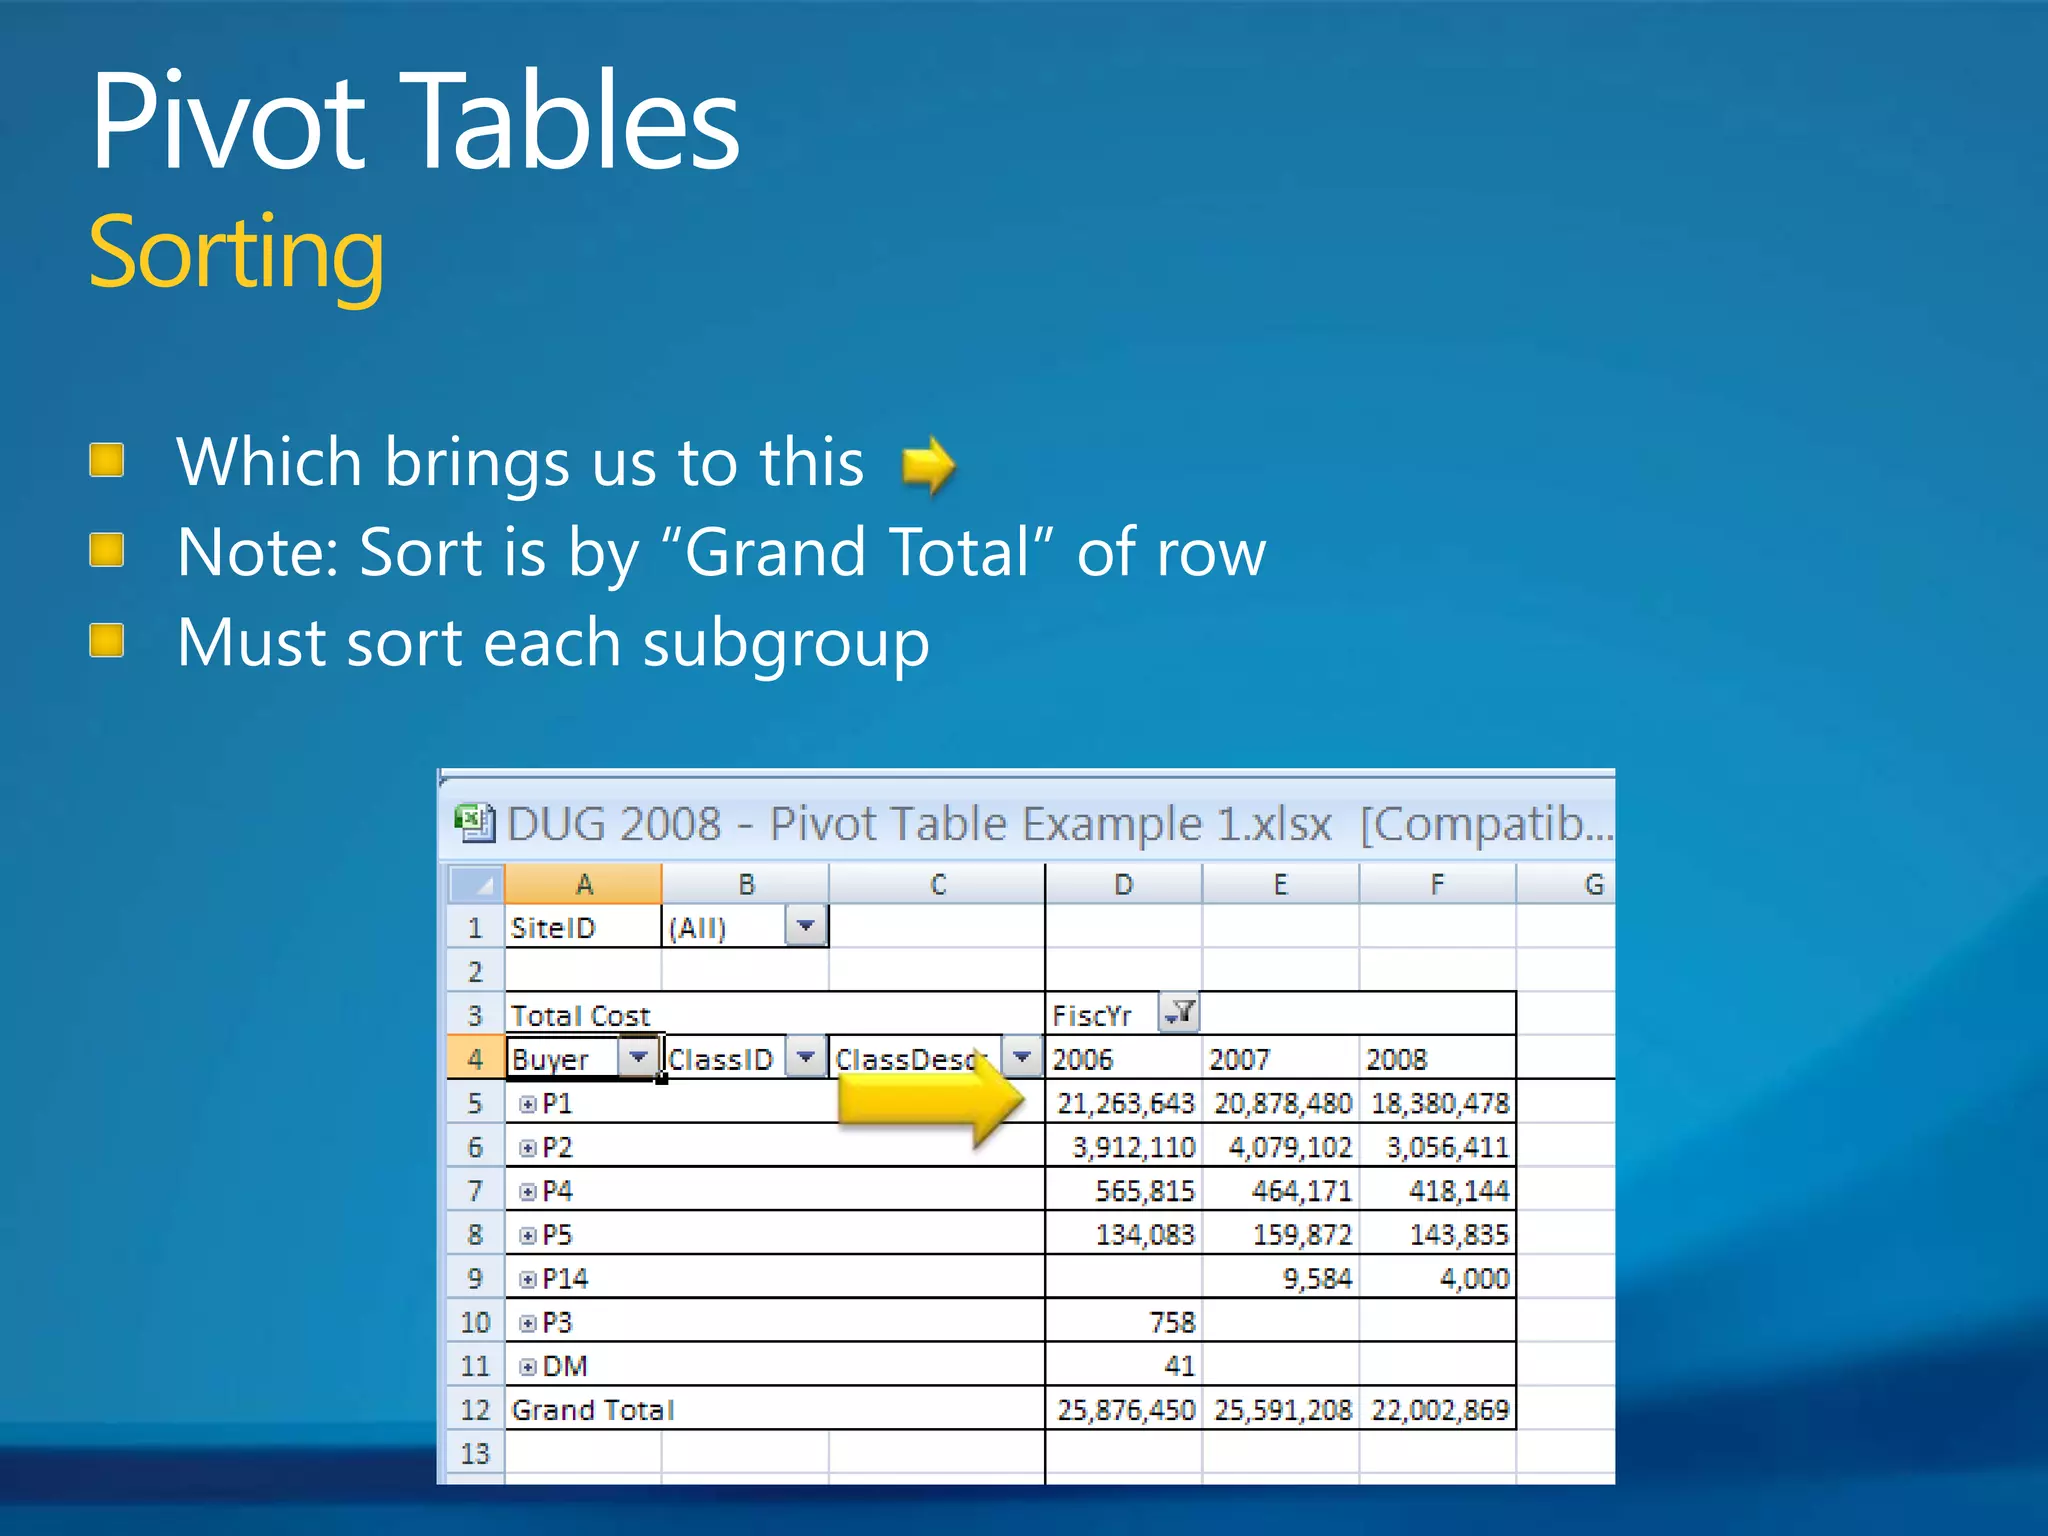
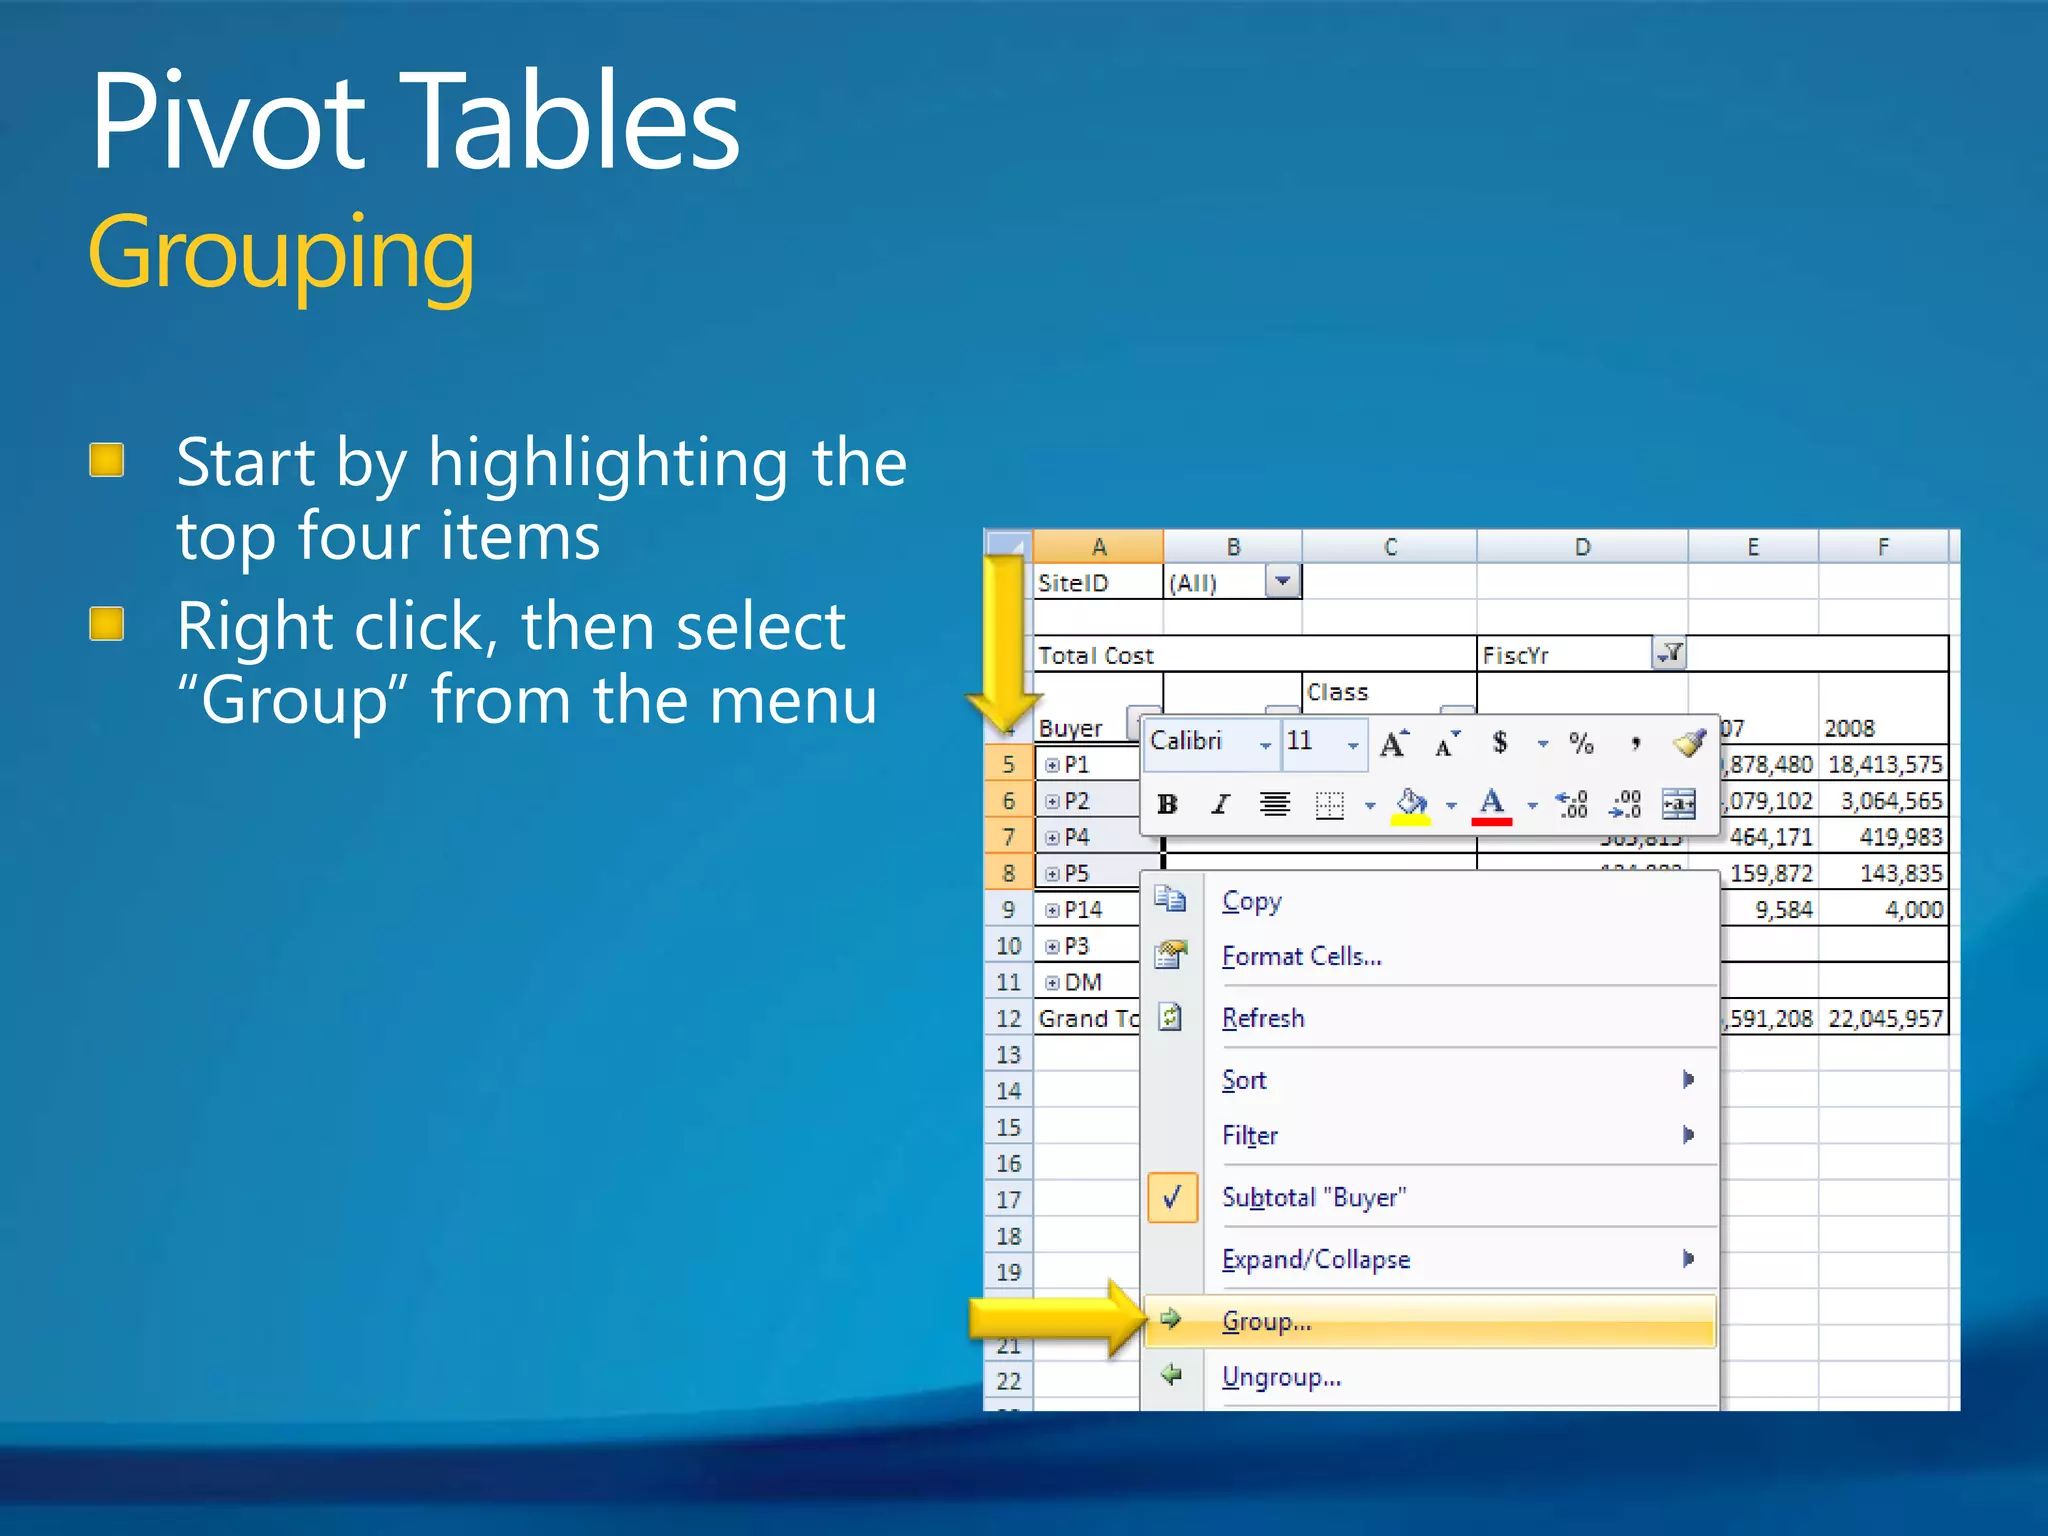
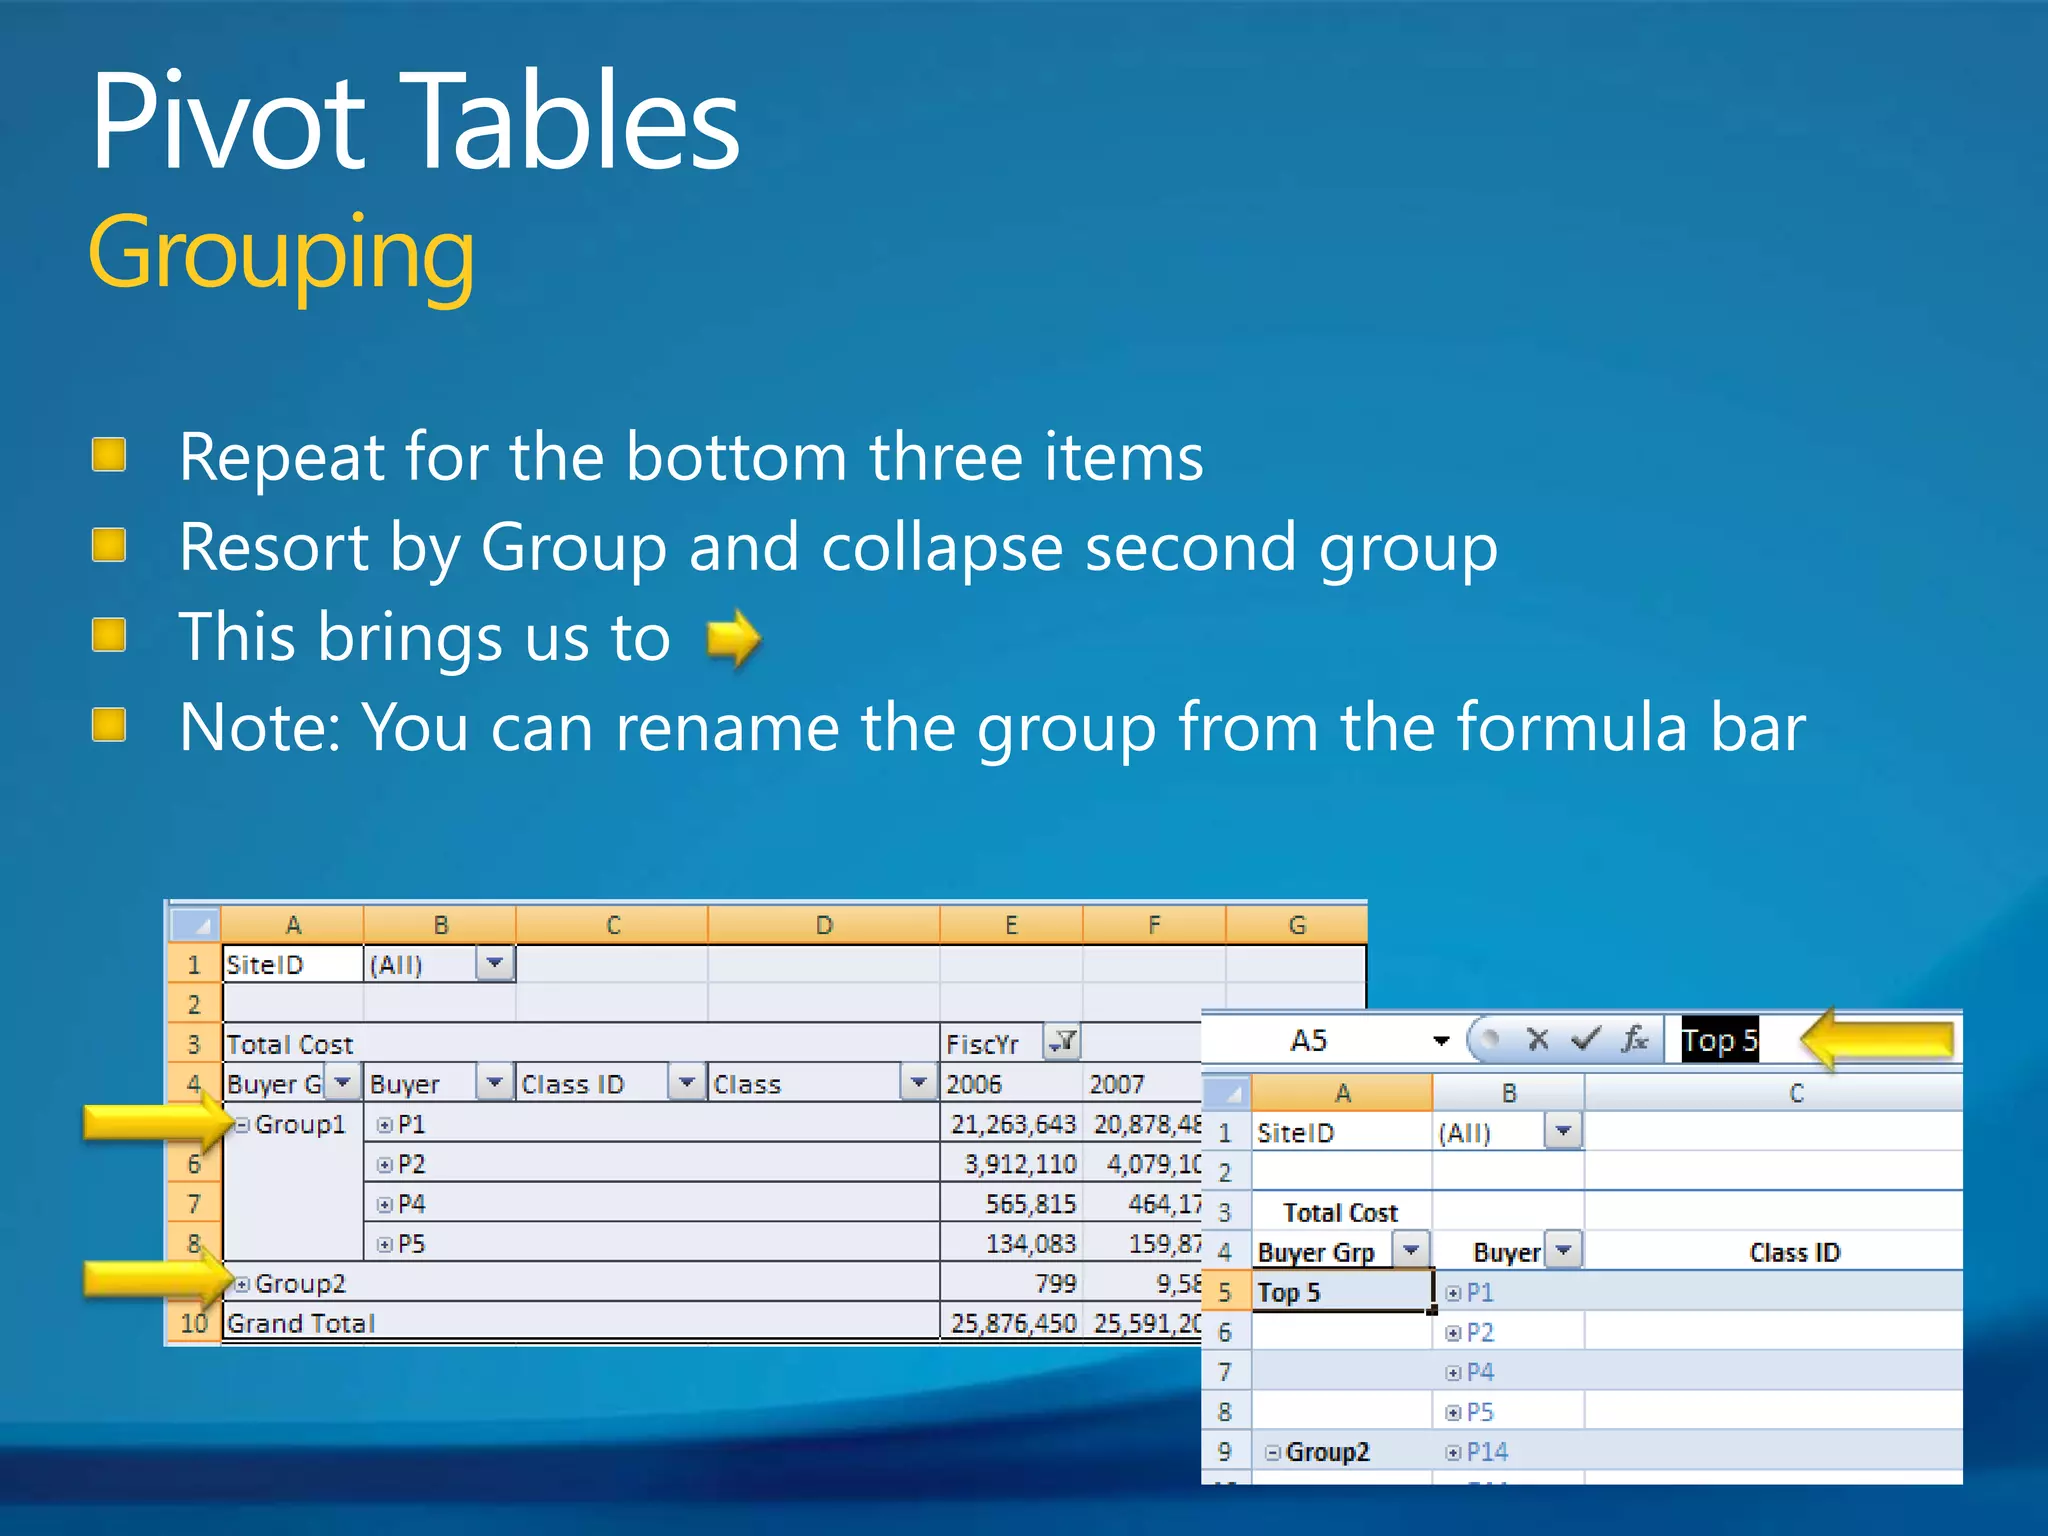
3. Filter, total, subtotal, sort, group, expand, collapse, and otherwise manipulate pivot table data.
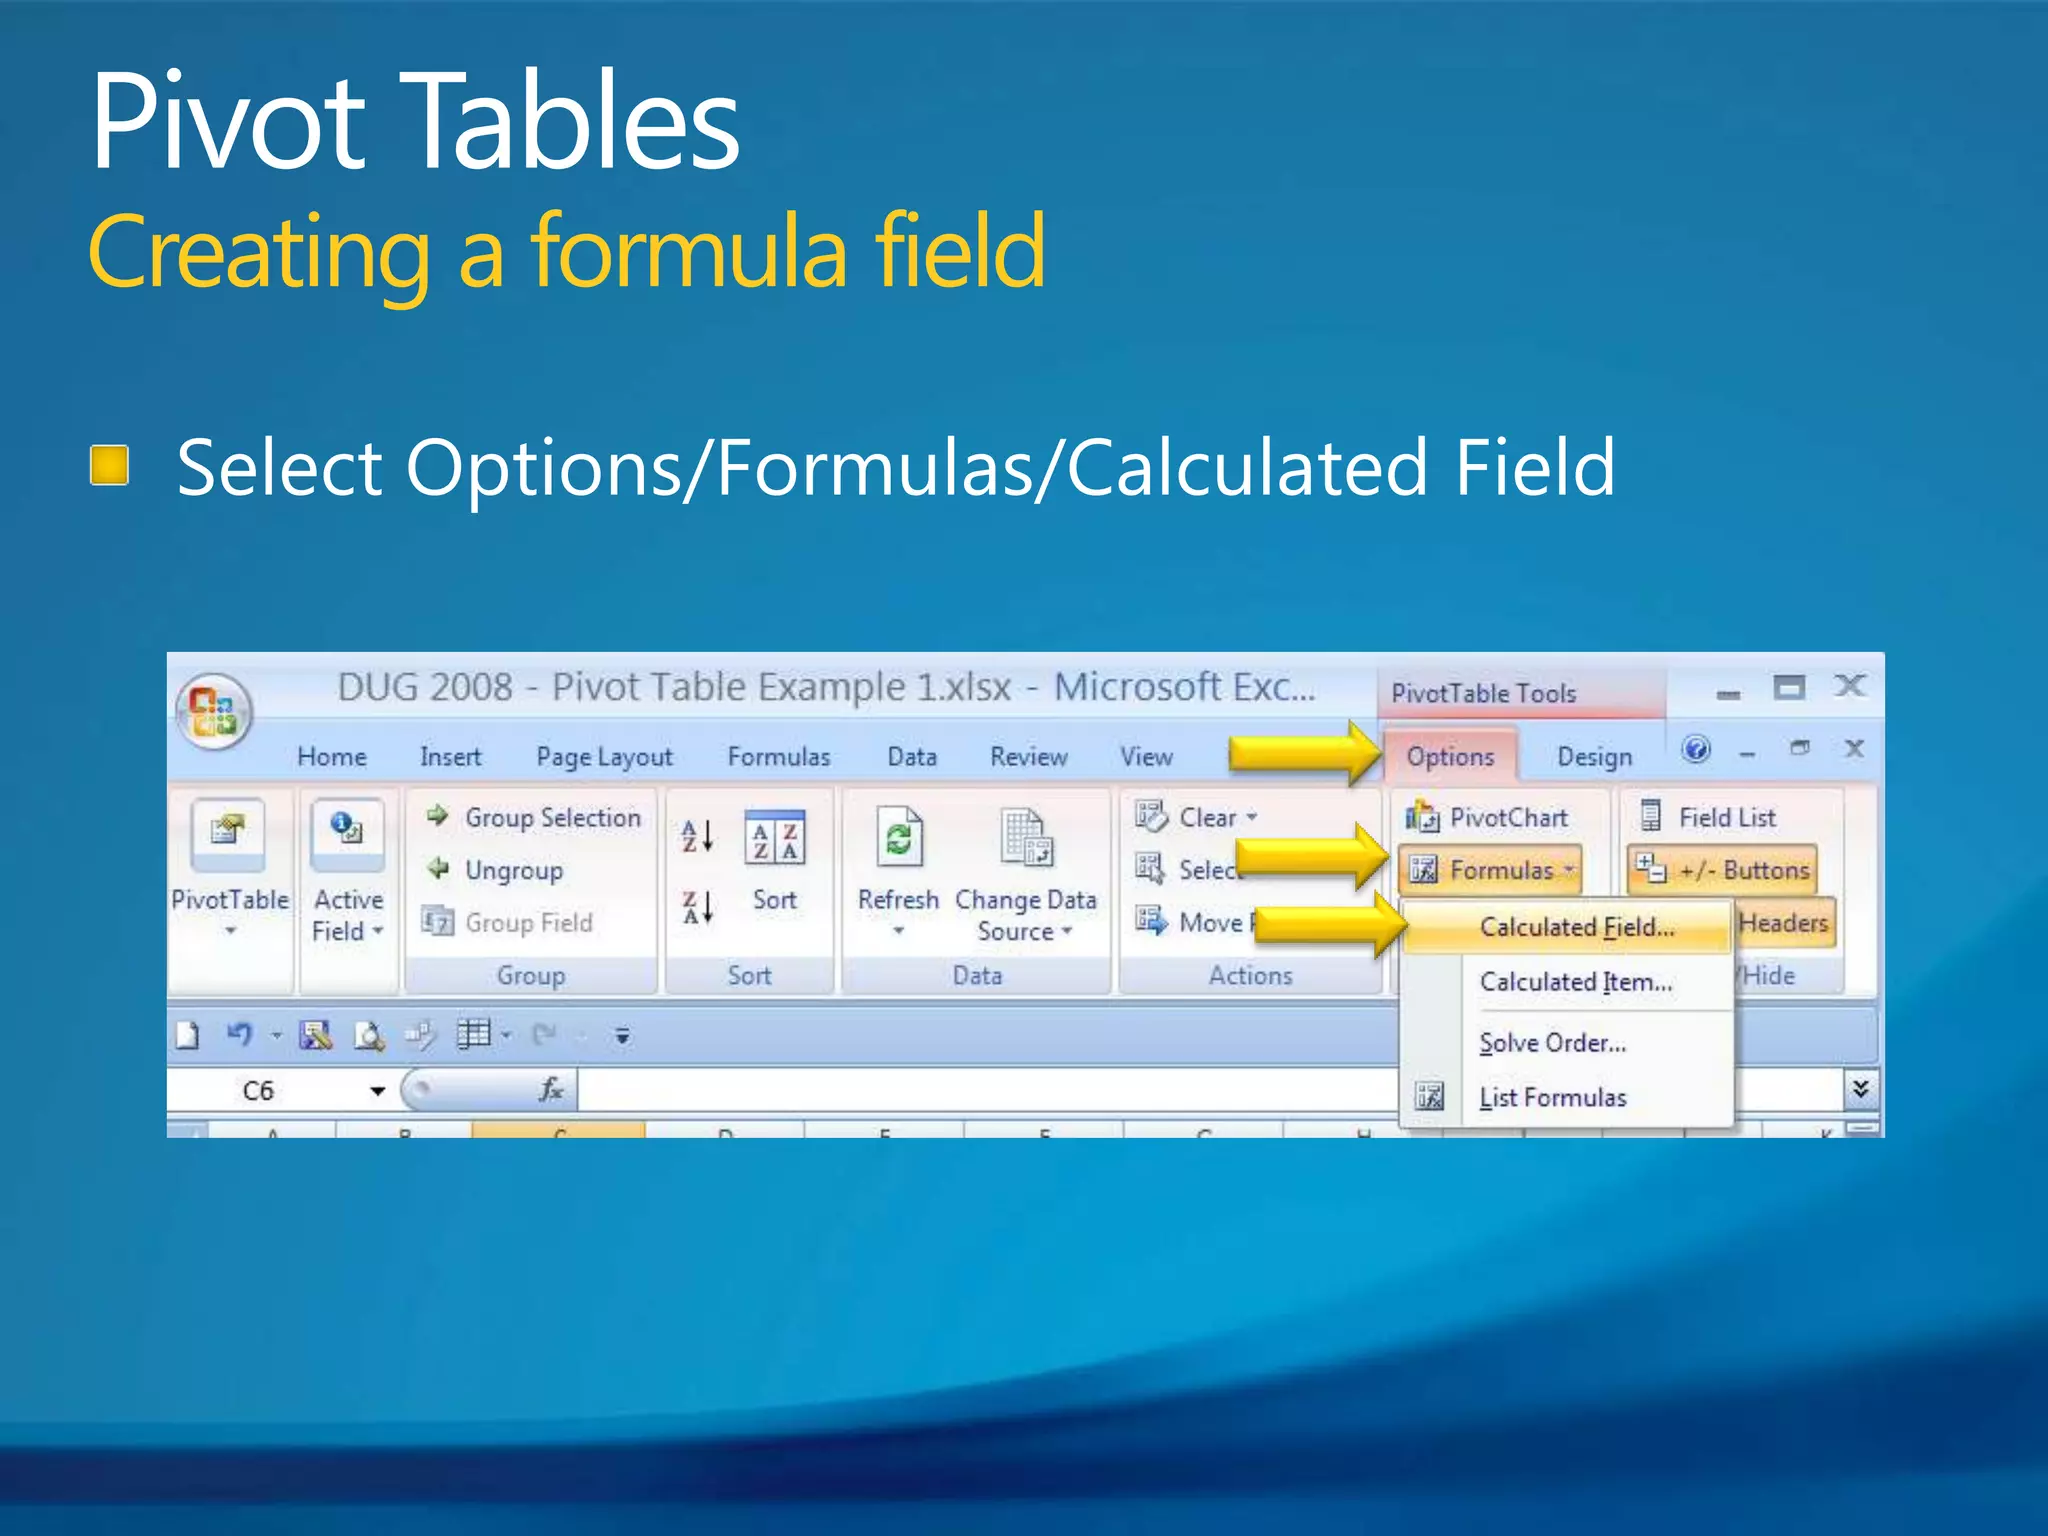
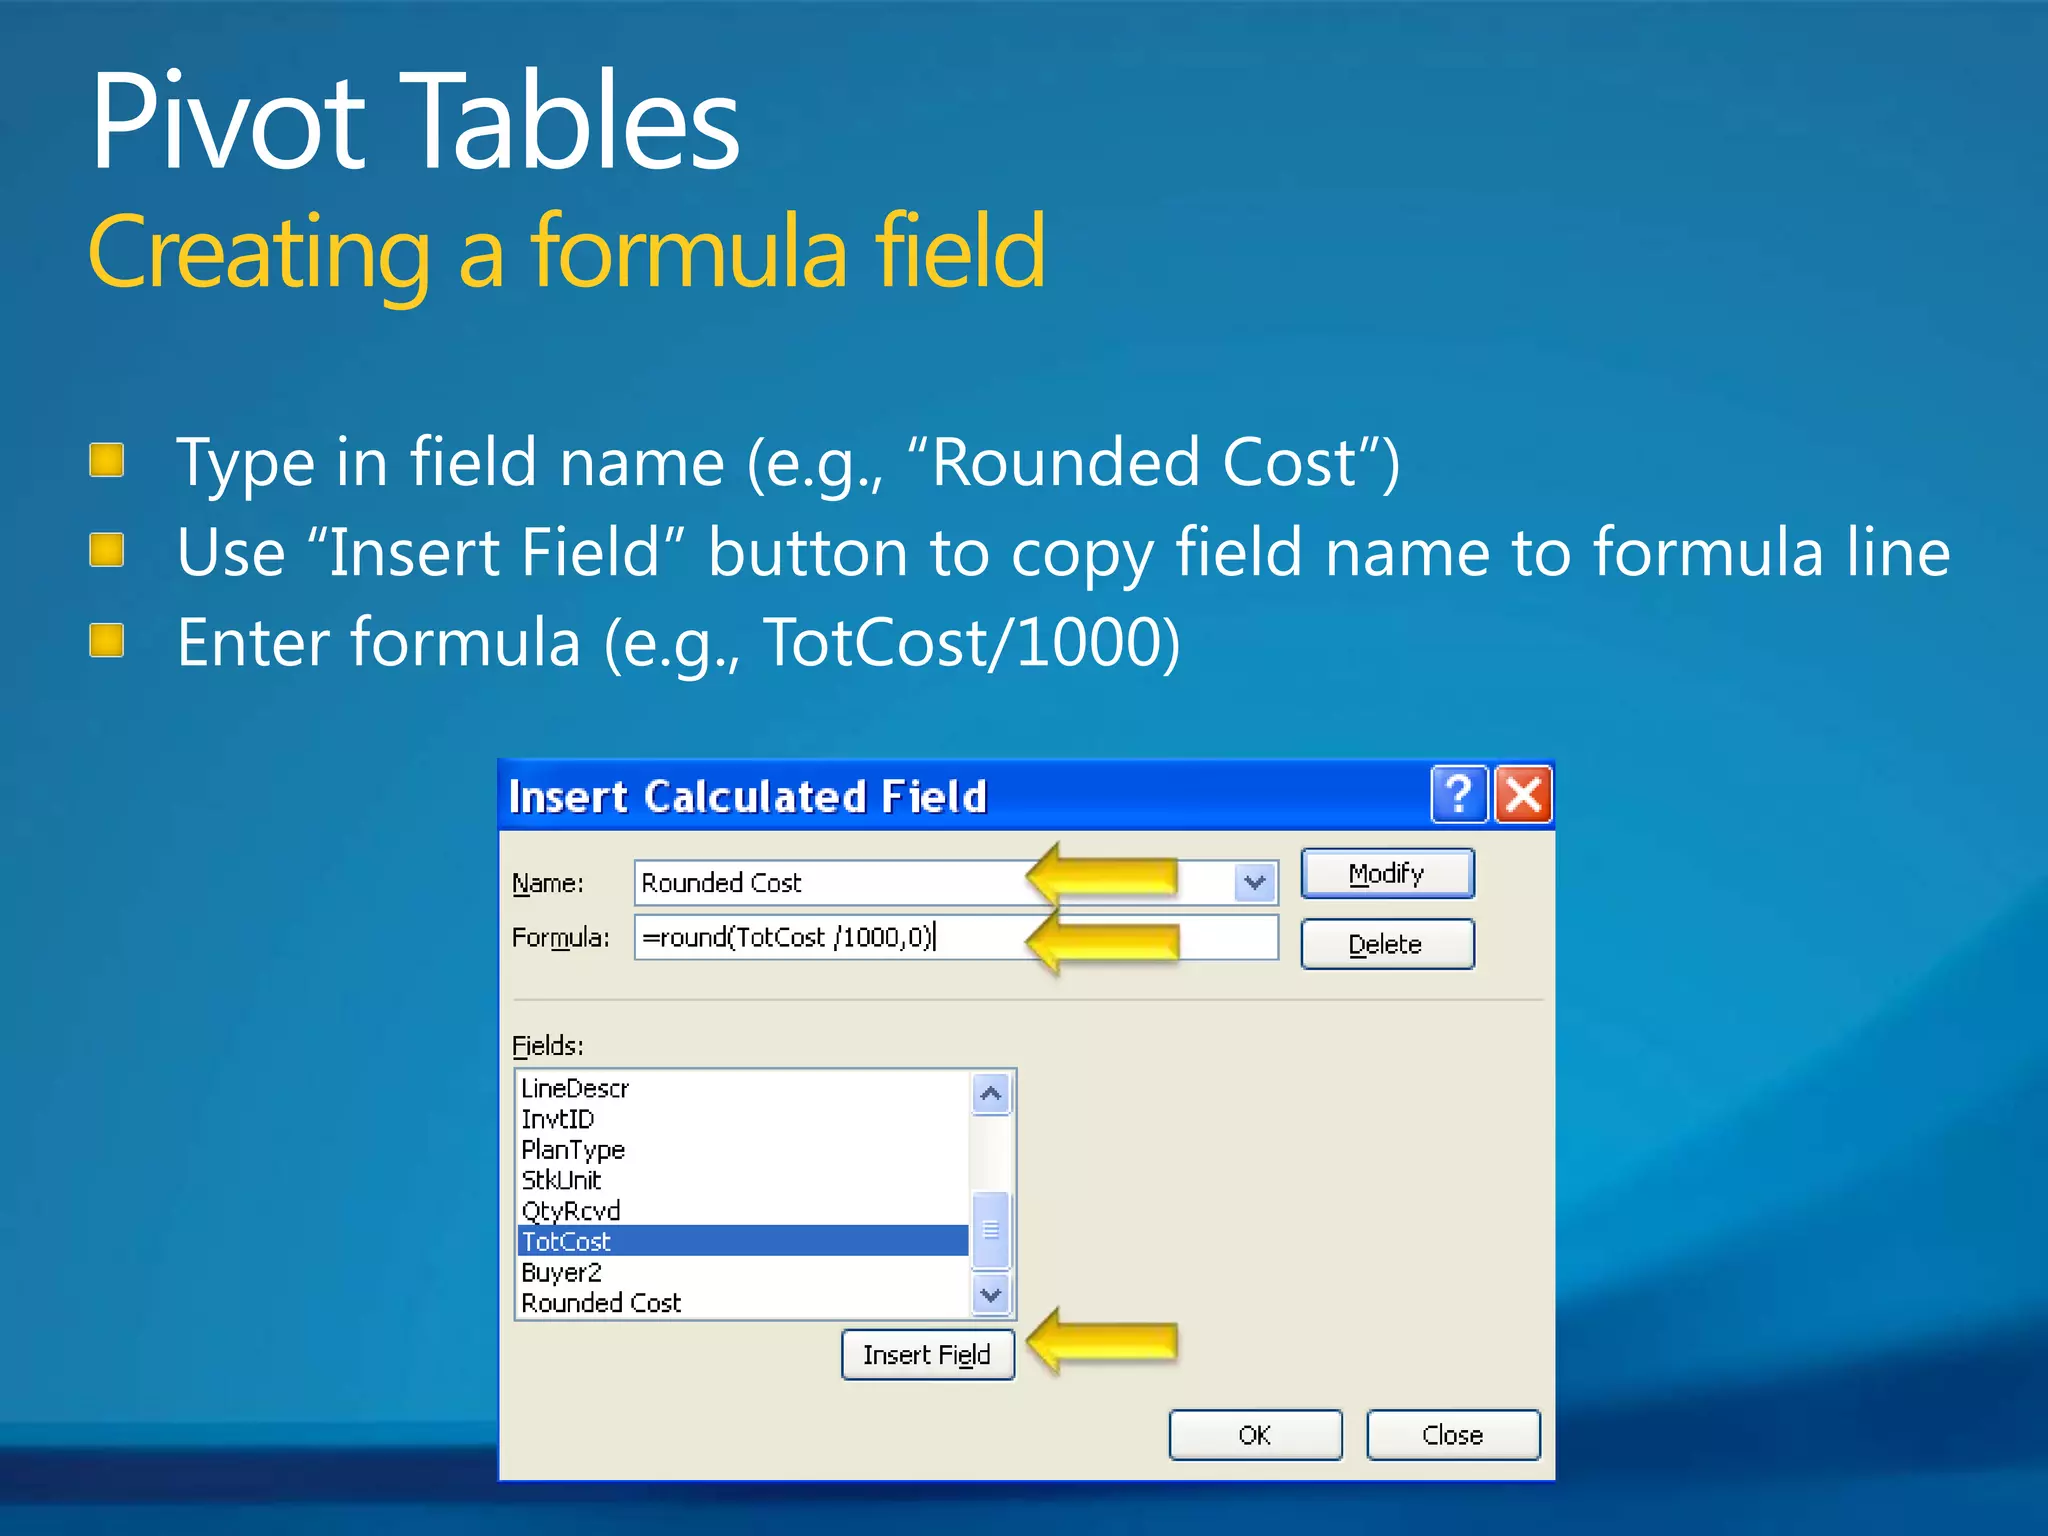
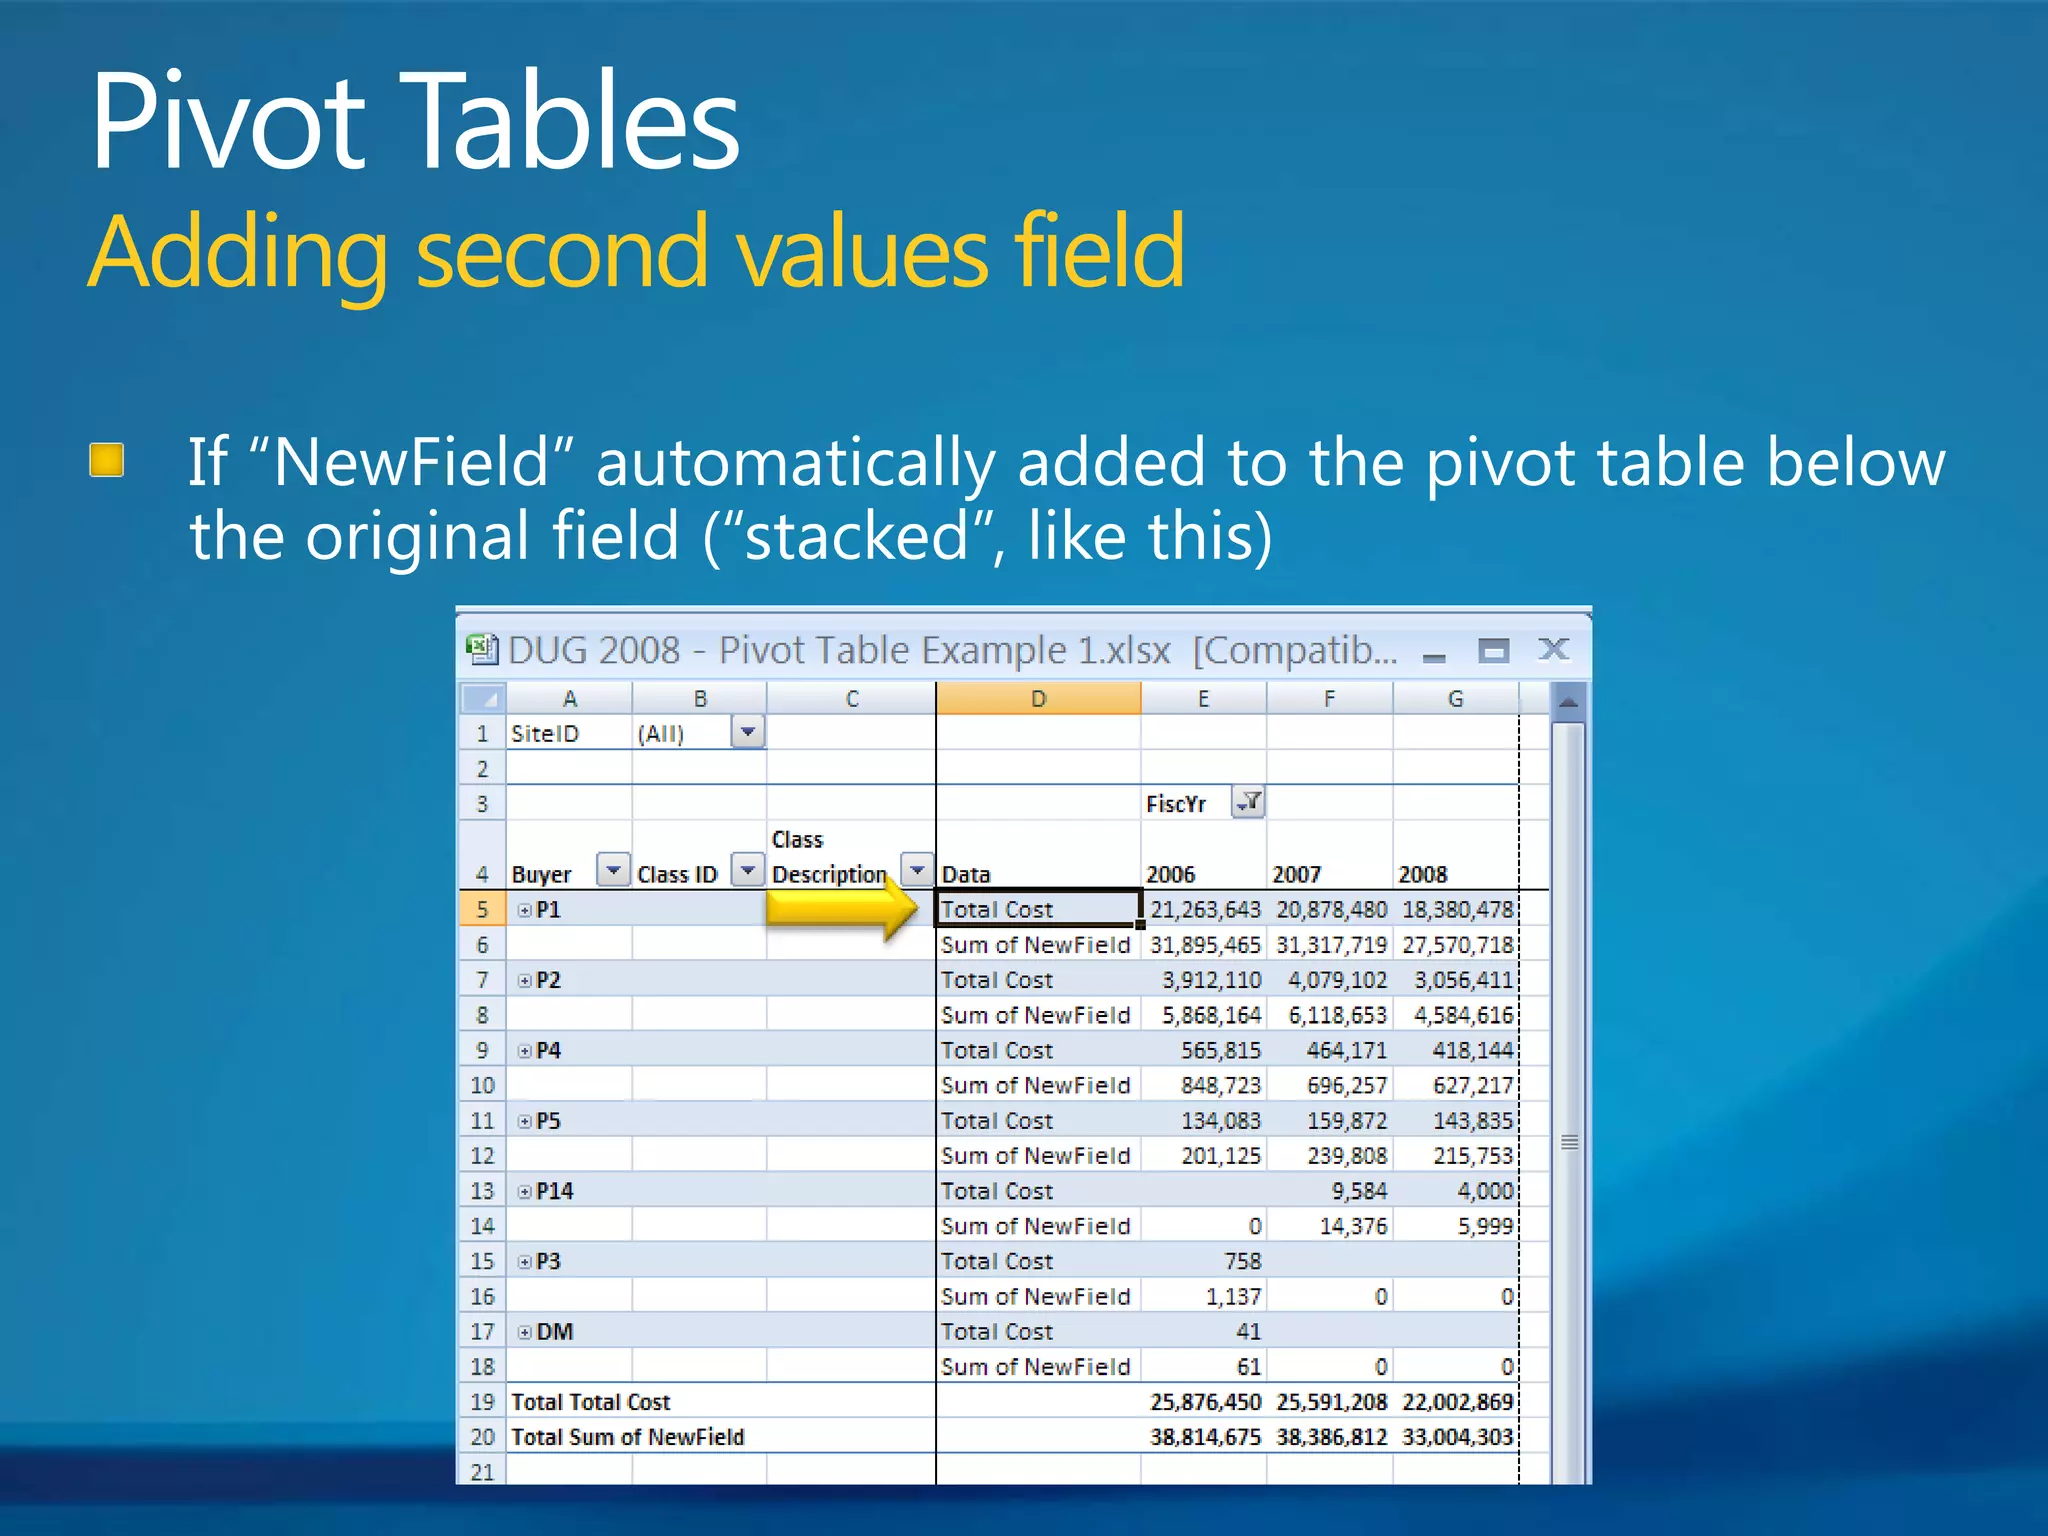
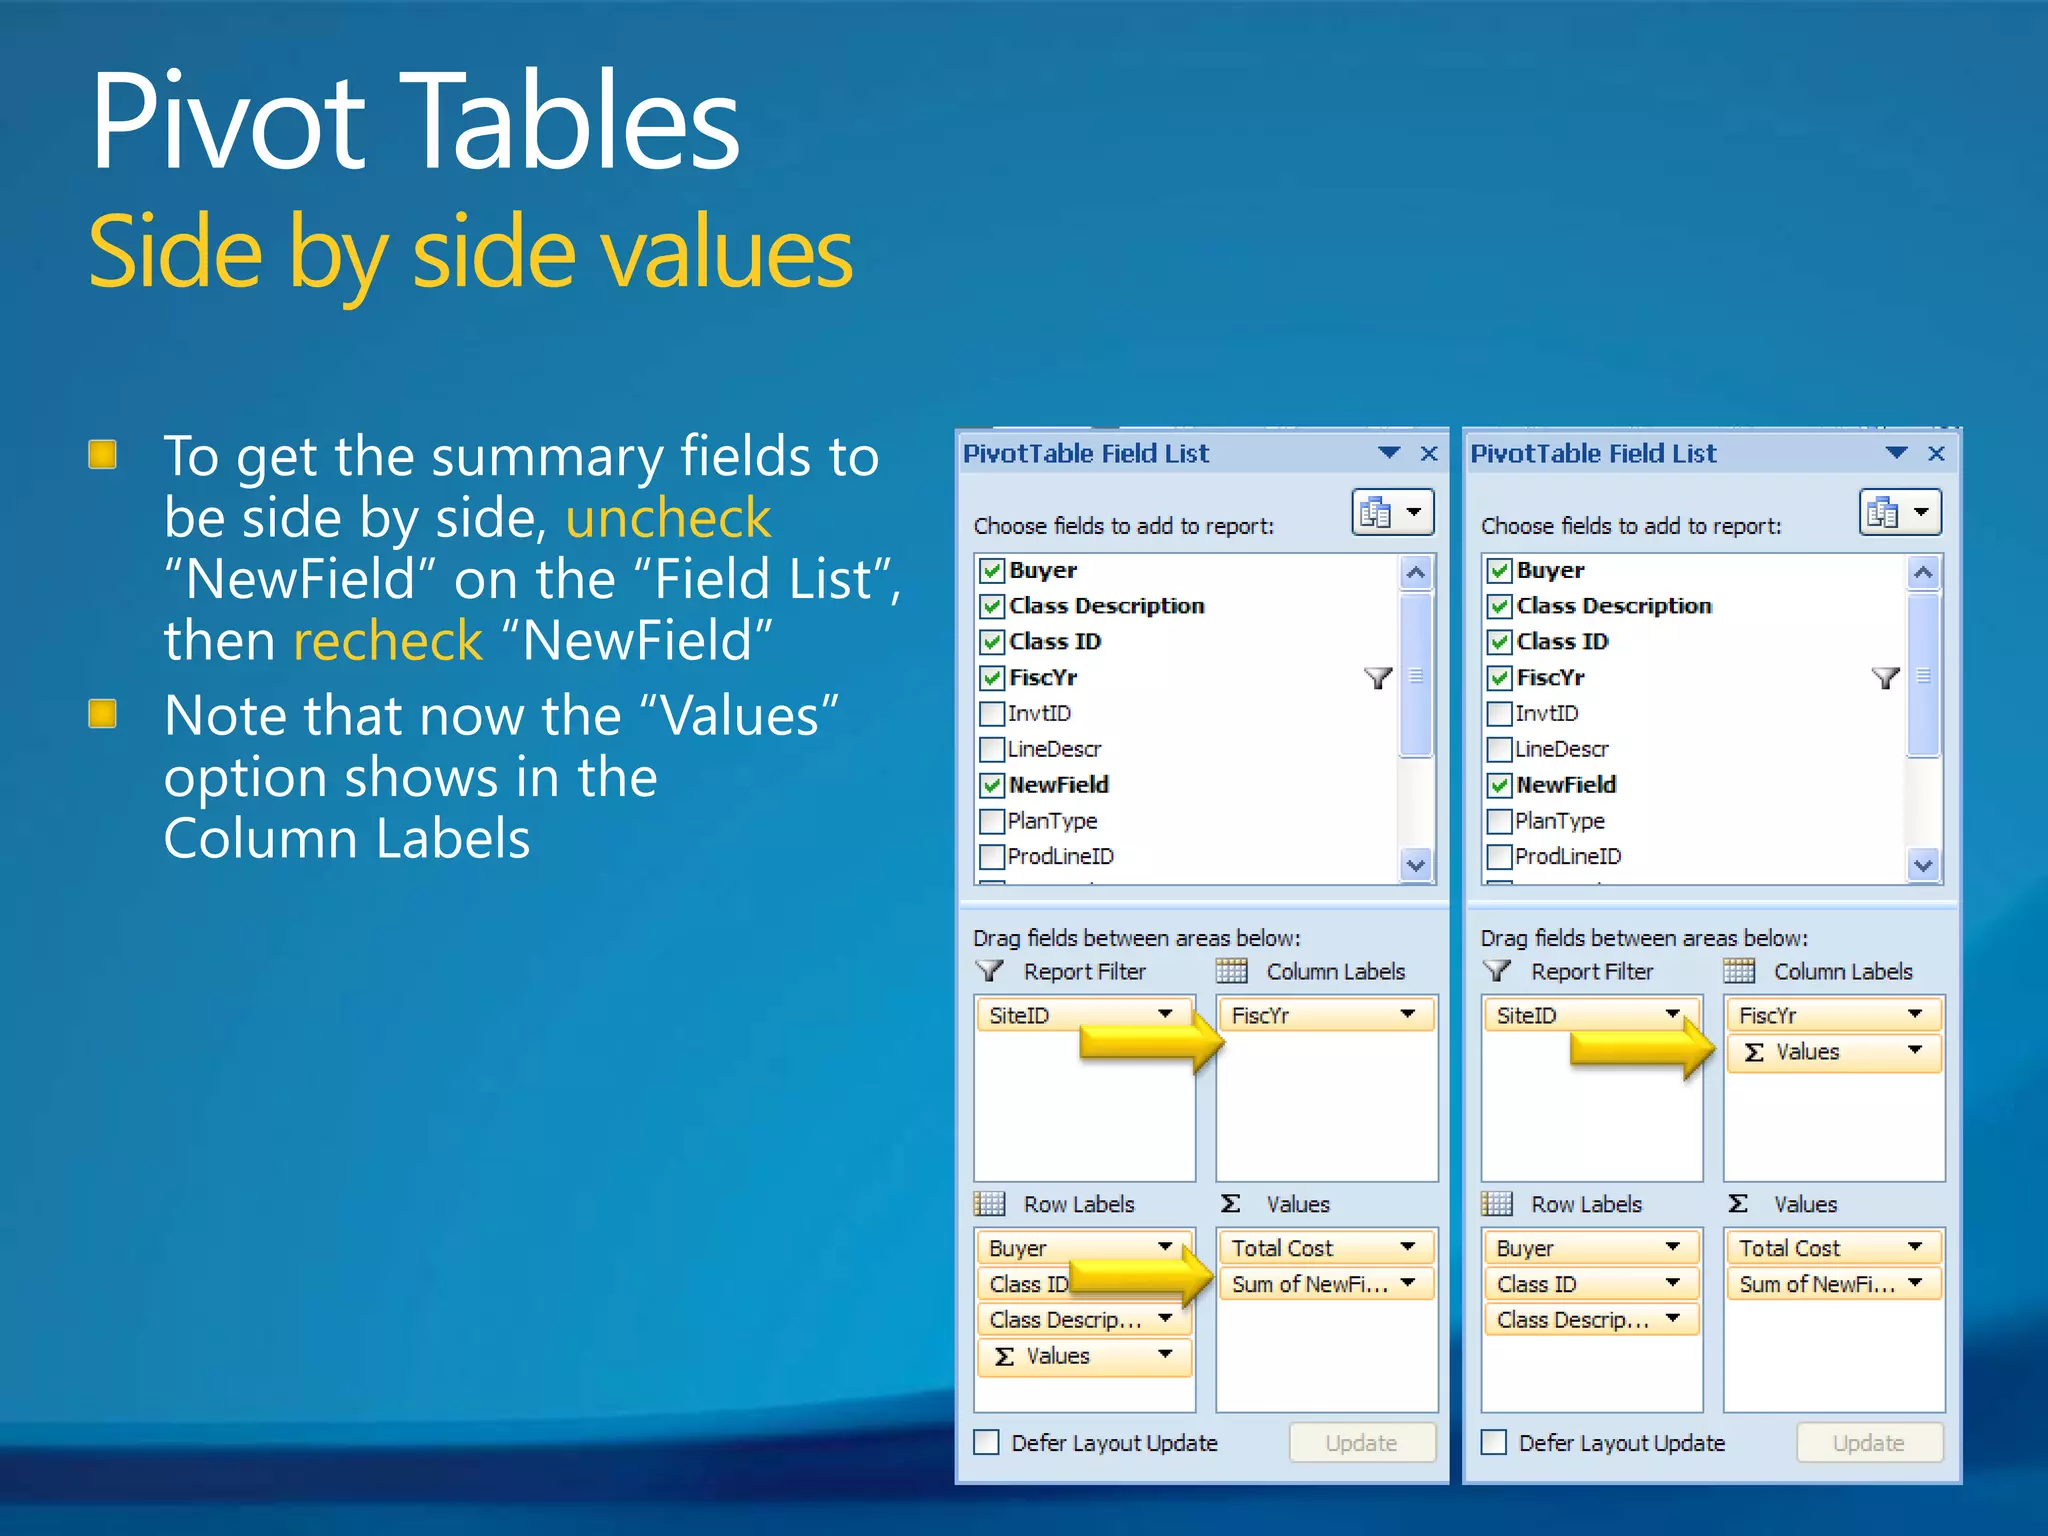
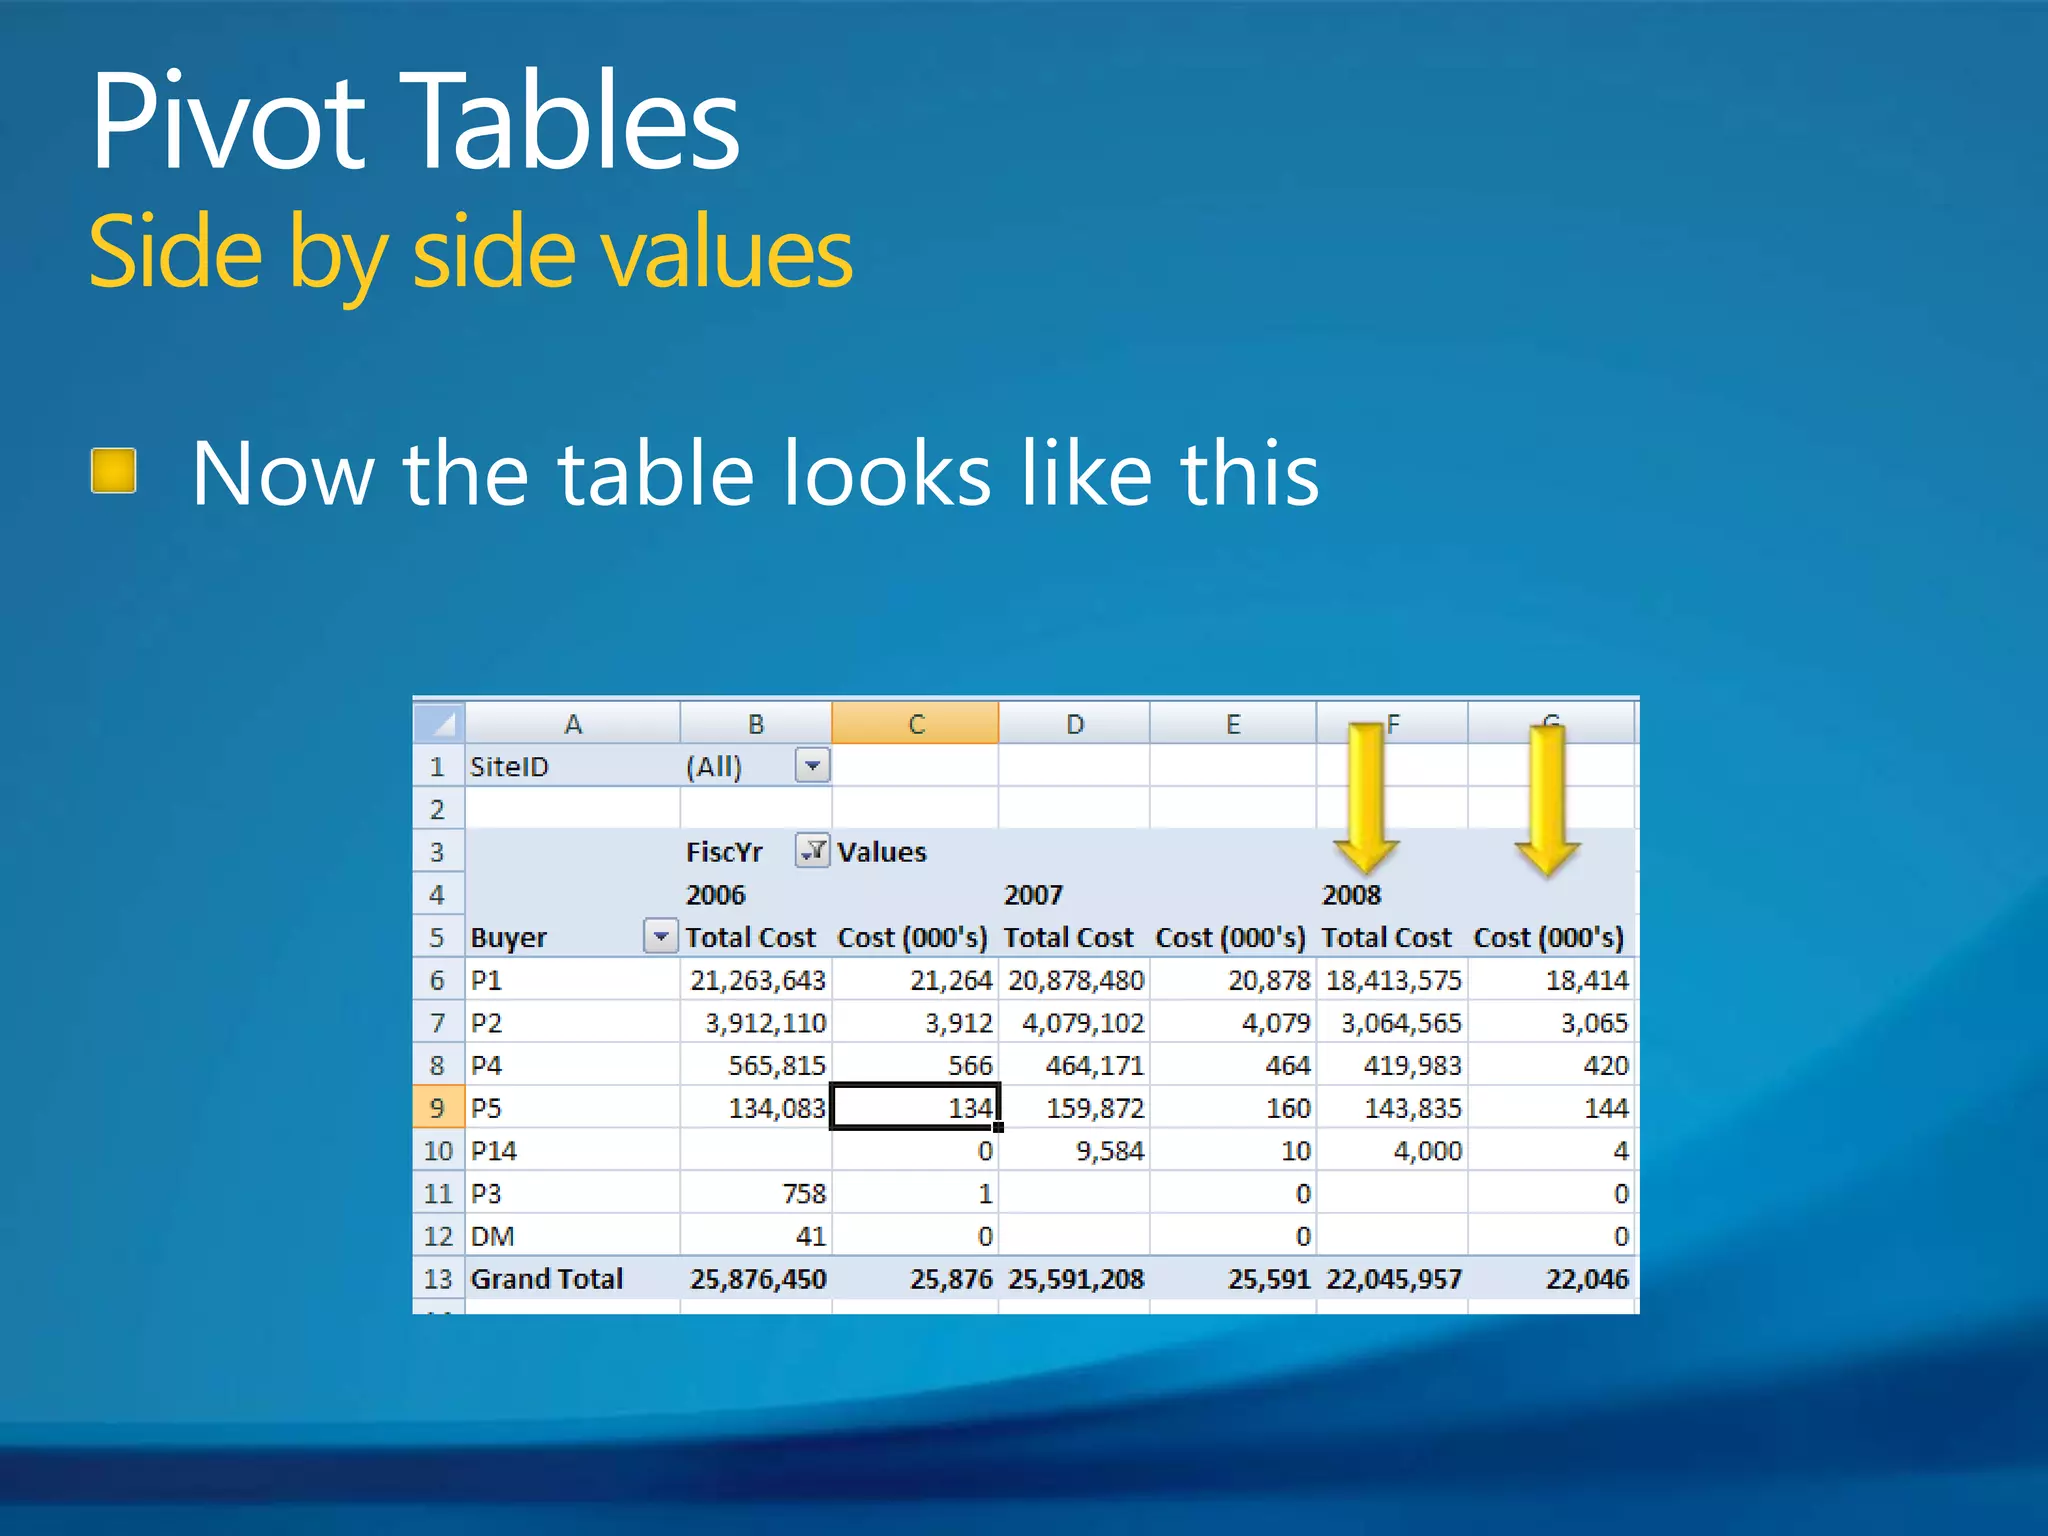
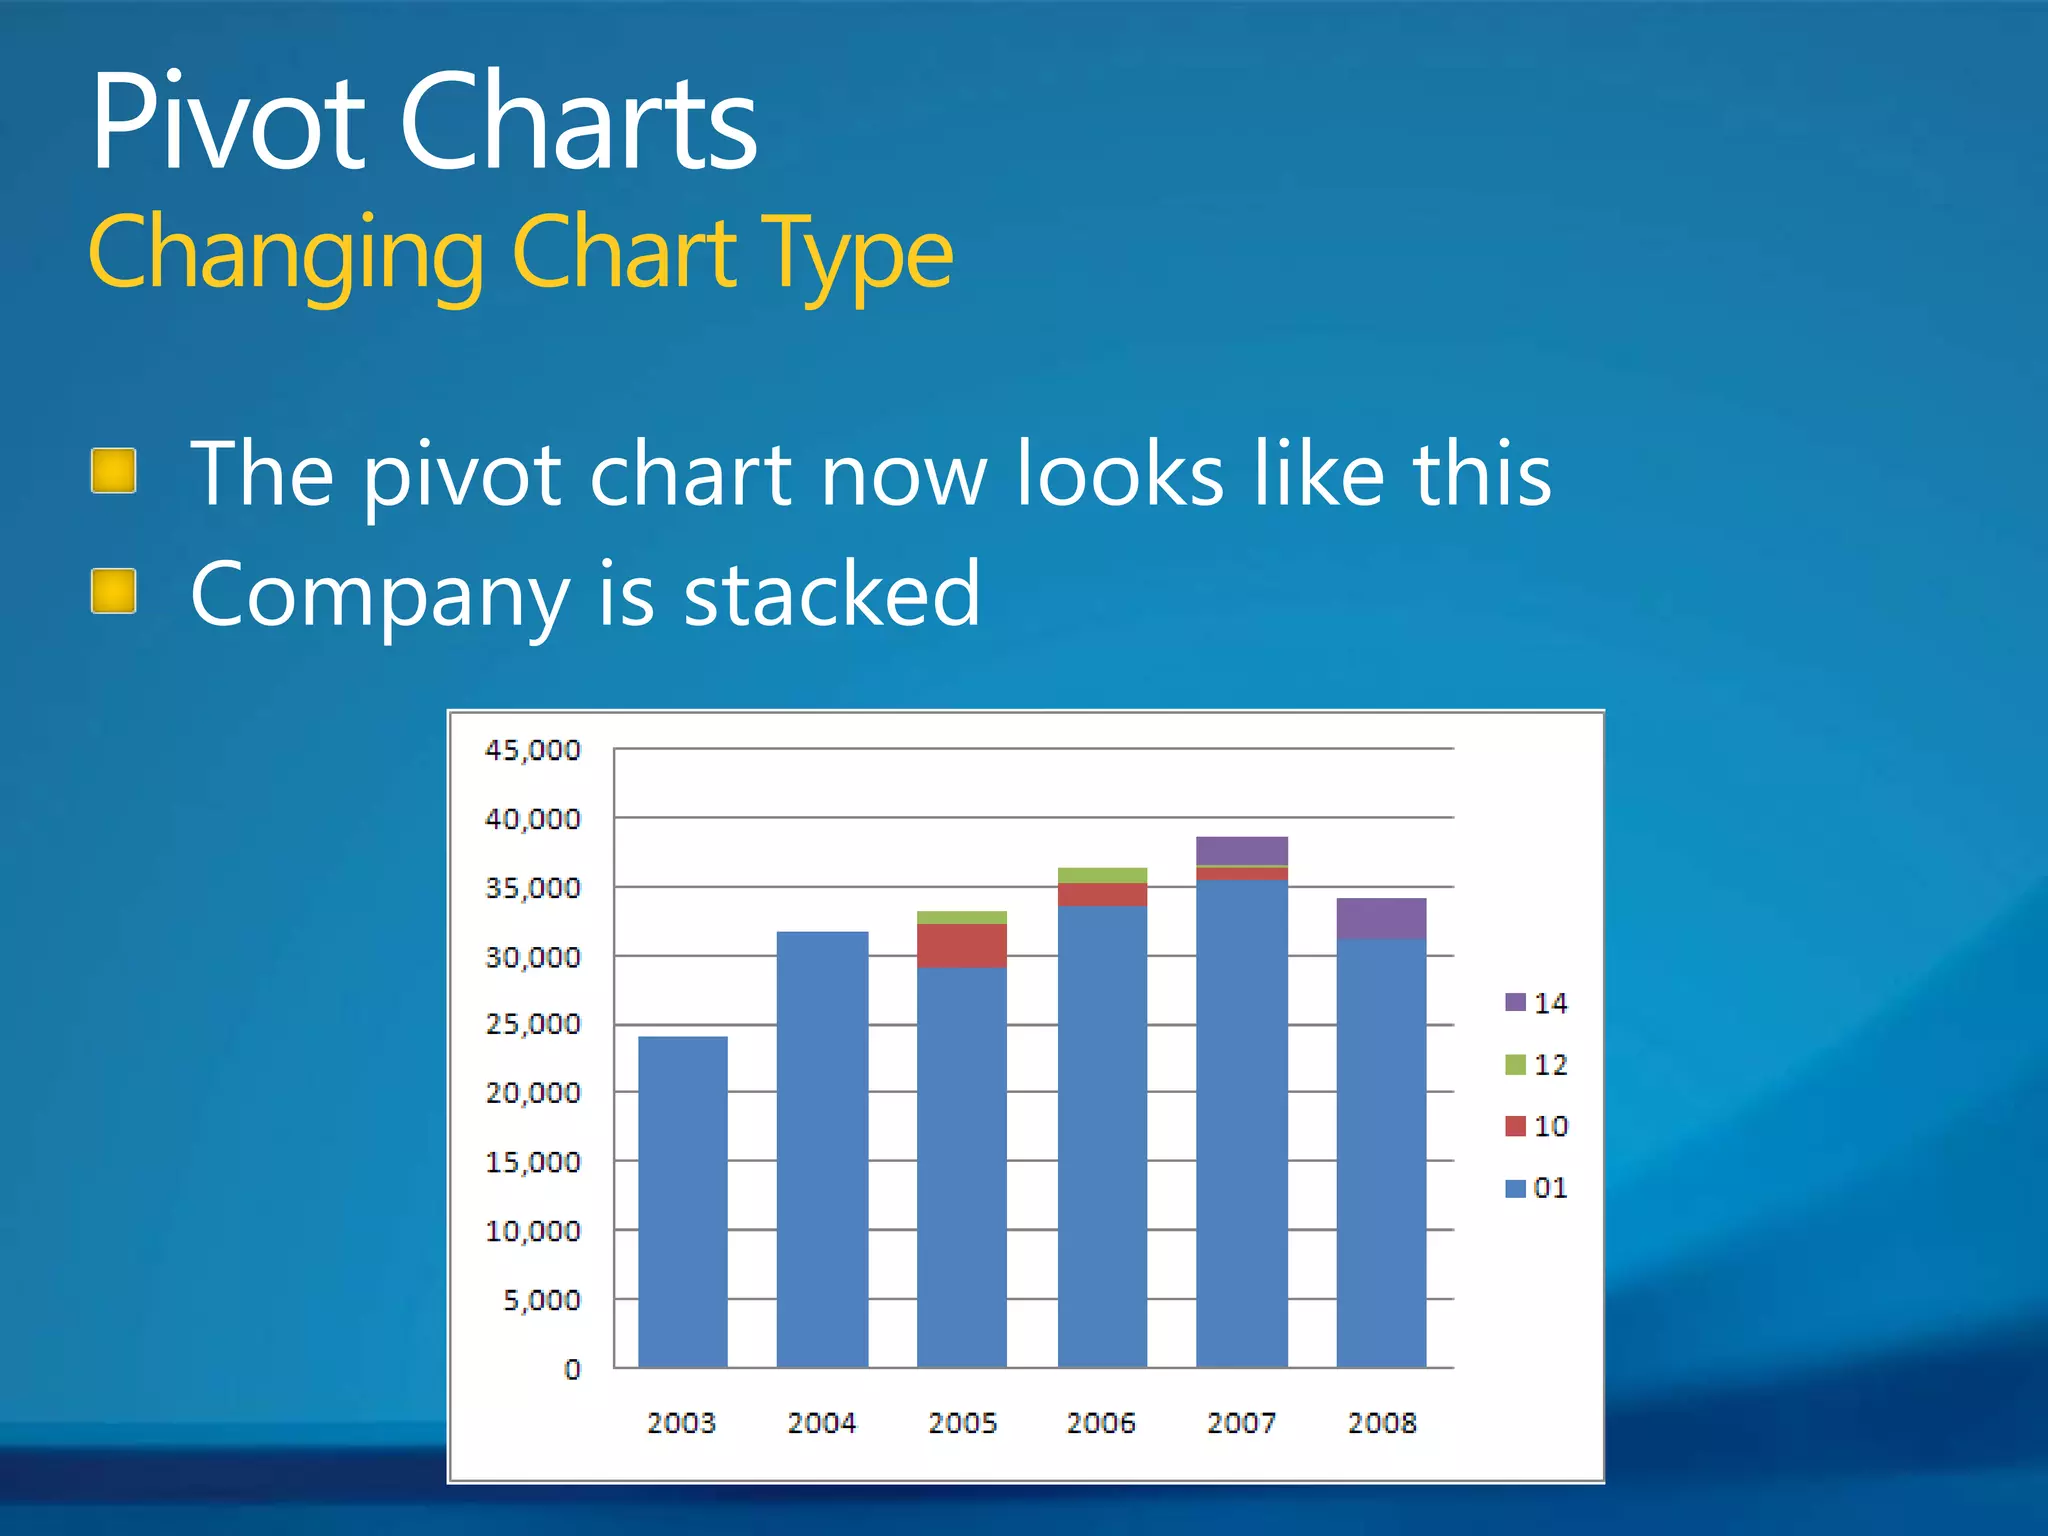
4. Create calculated fields and side-by-side or stacked value fields.
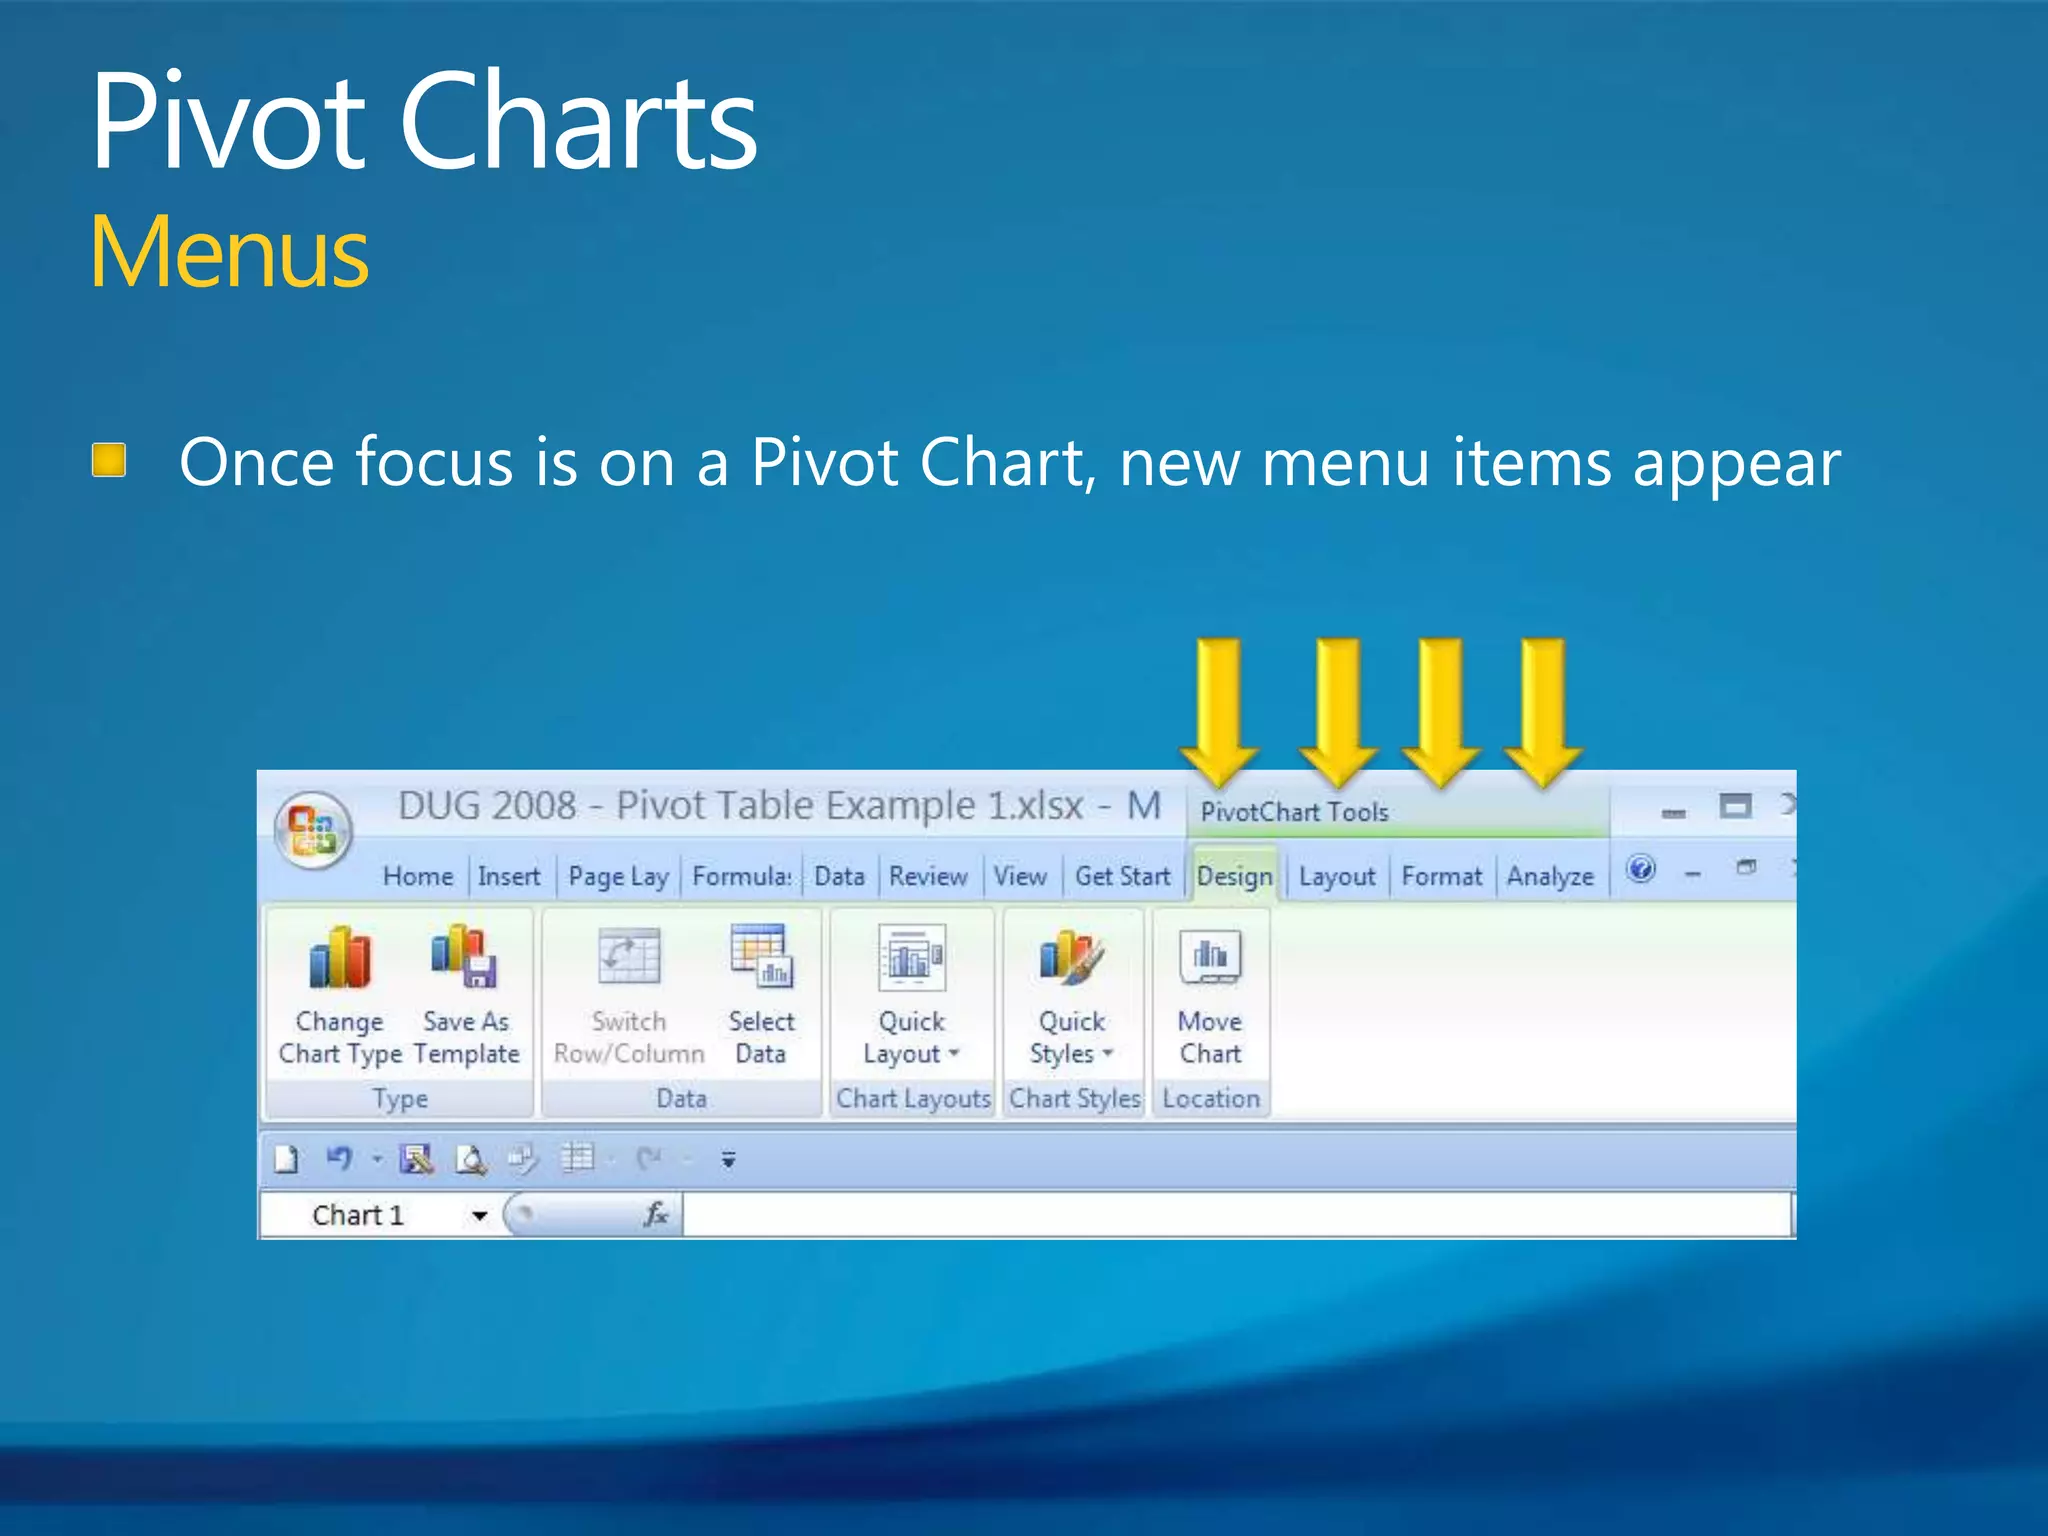
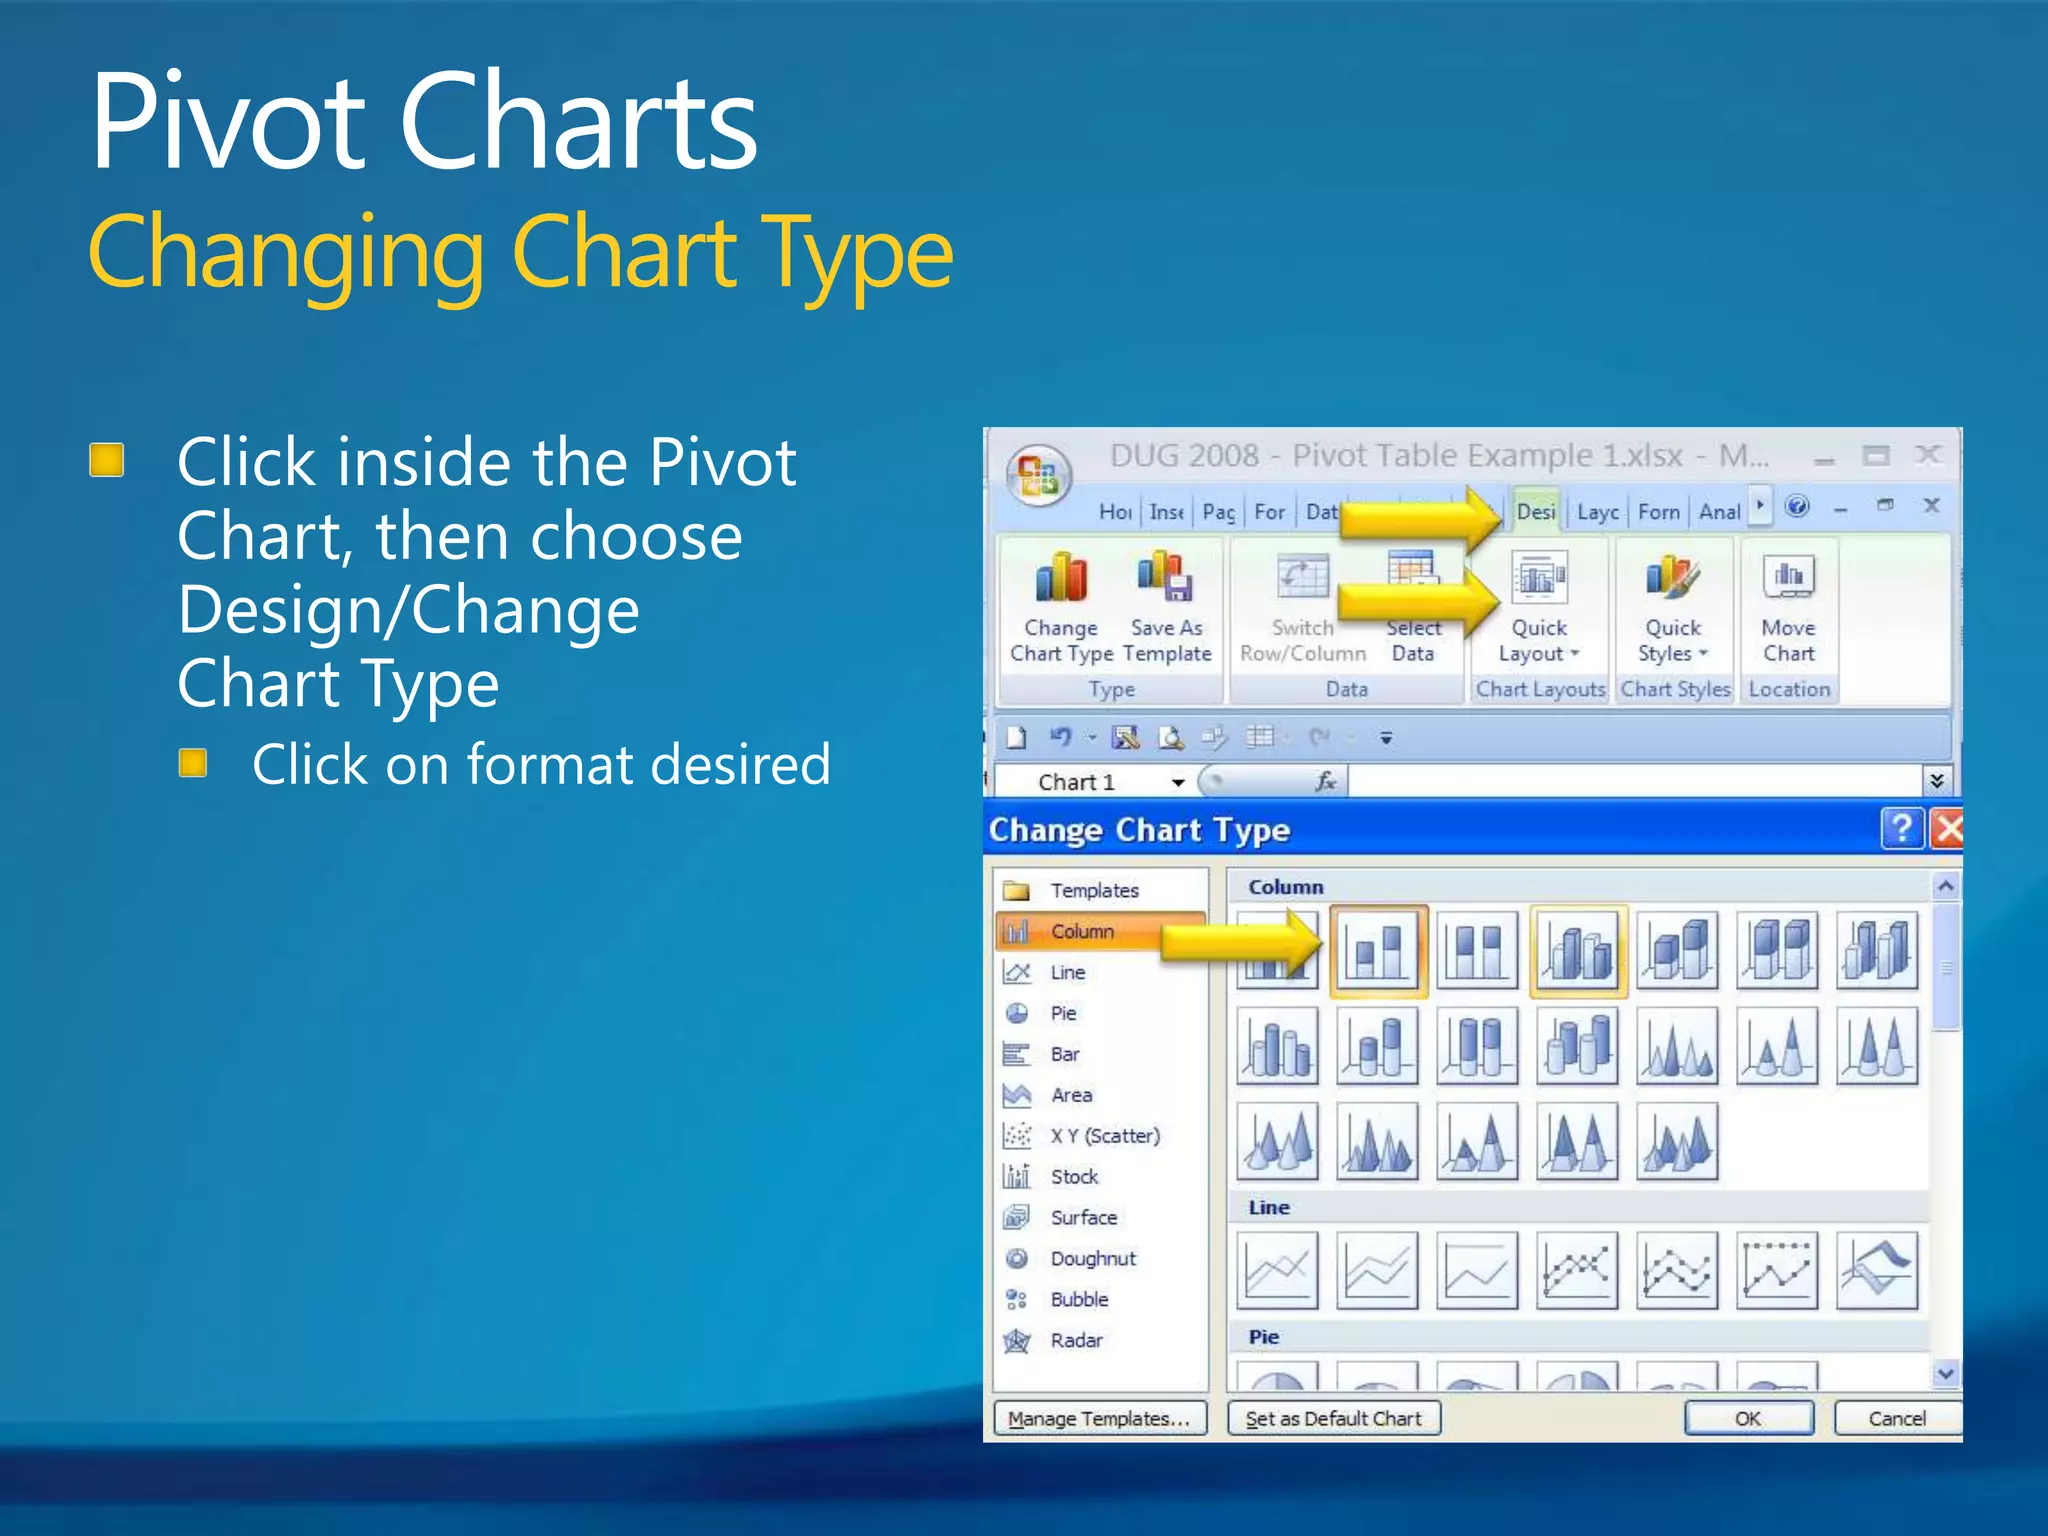
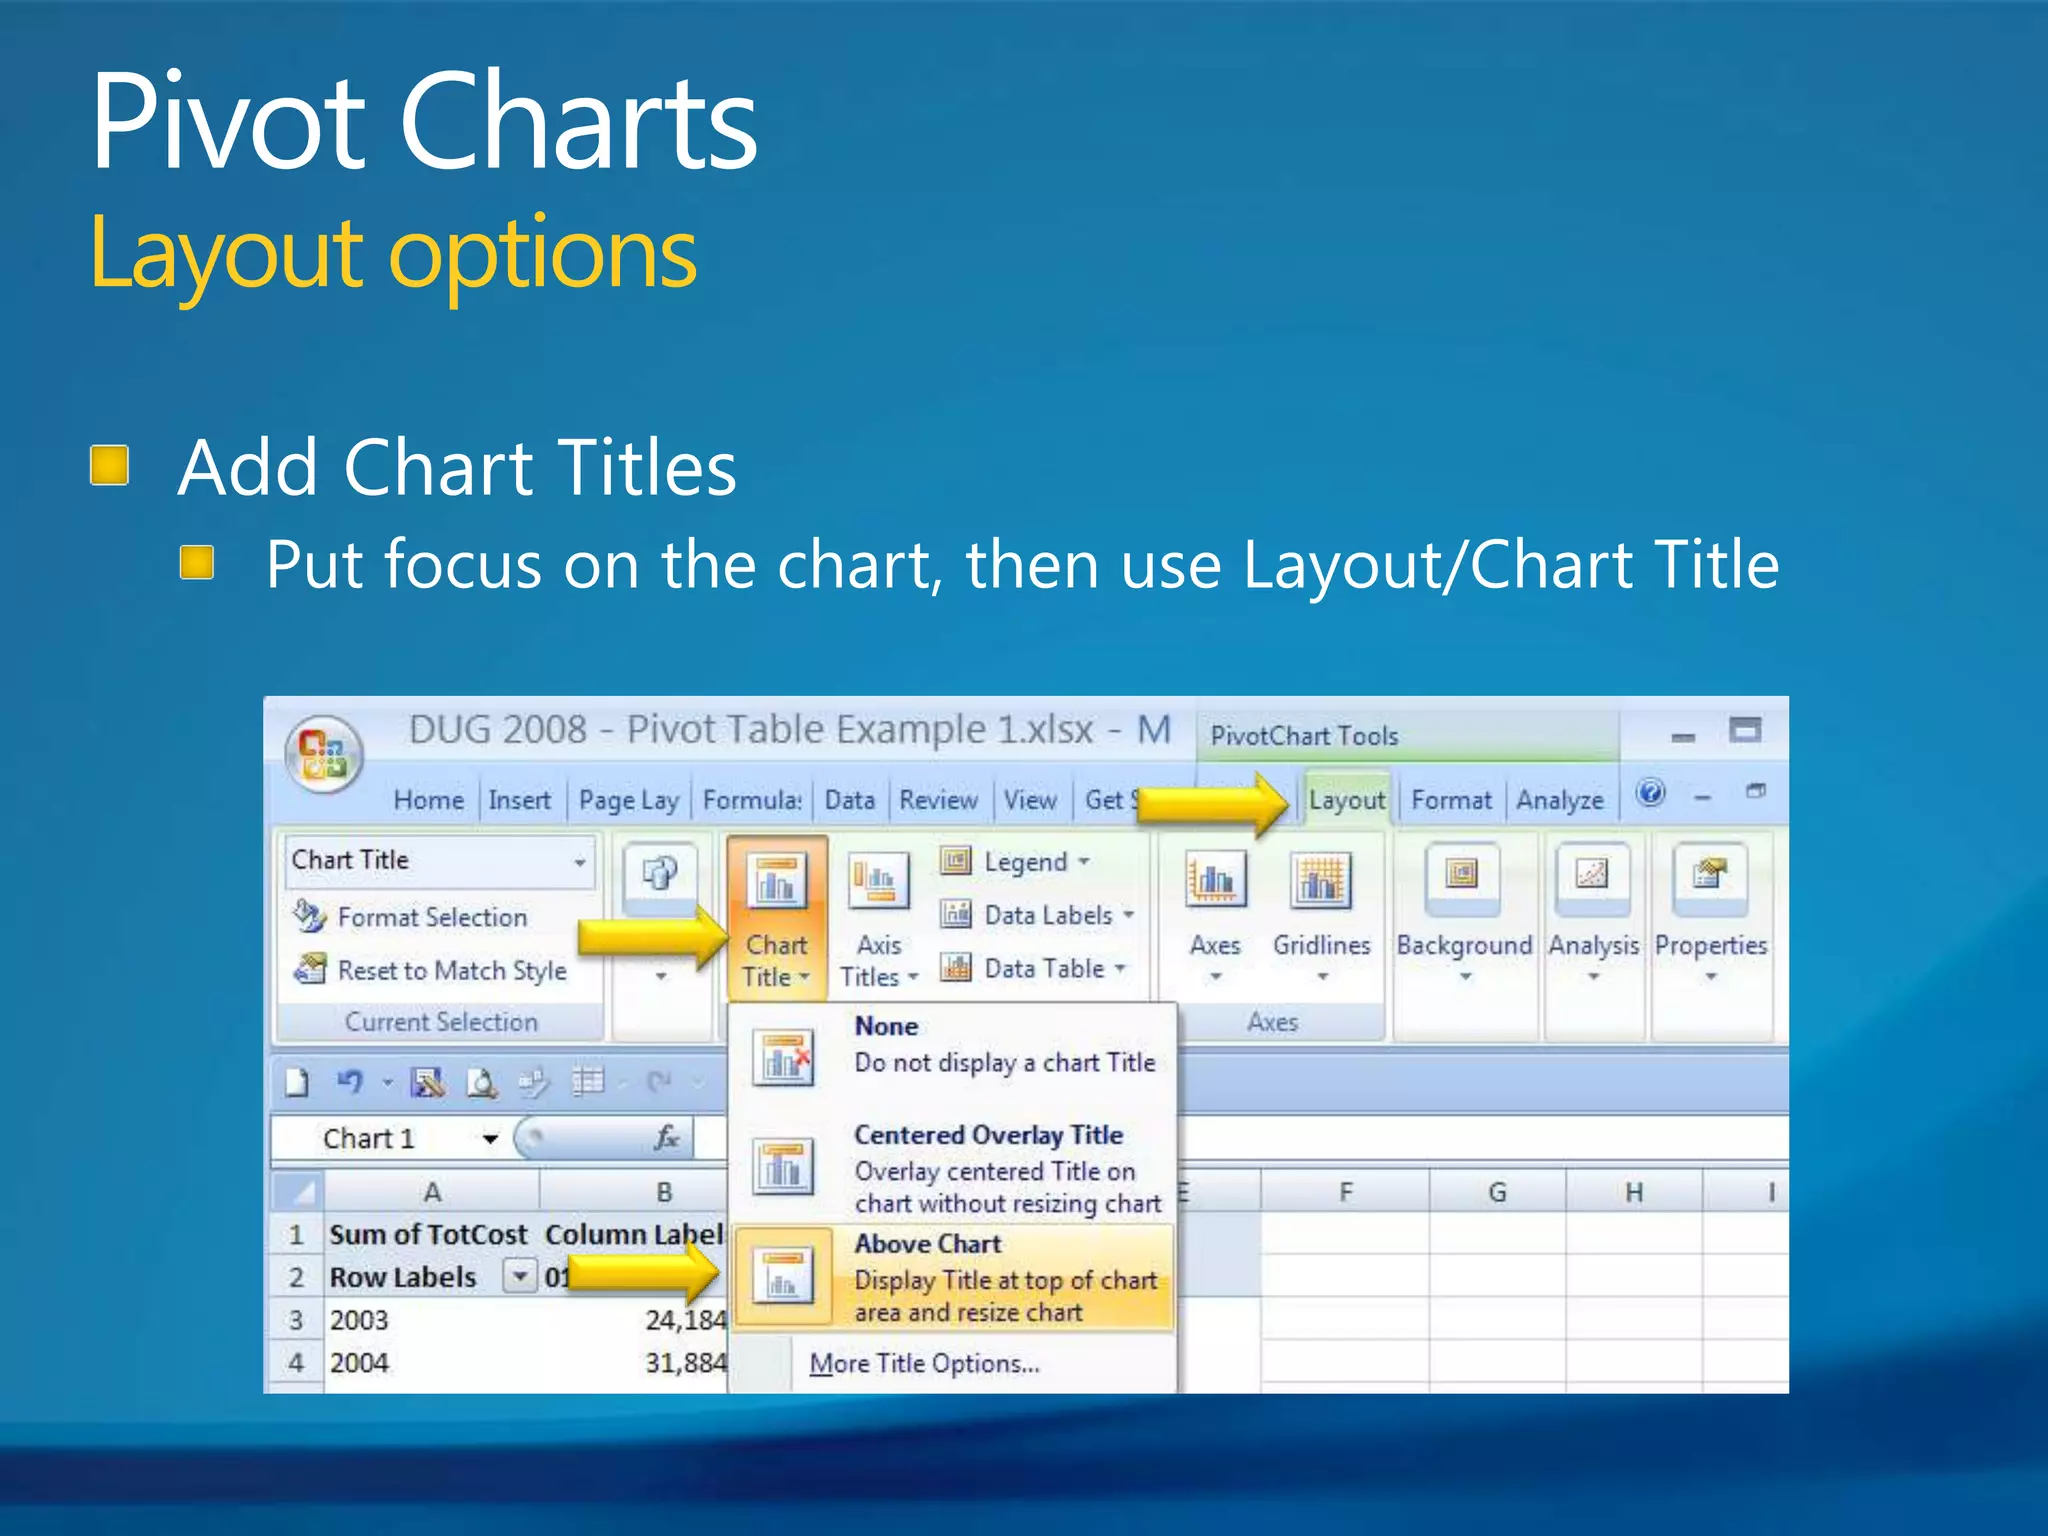
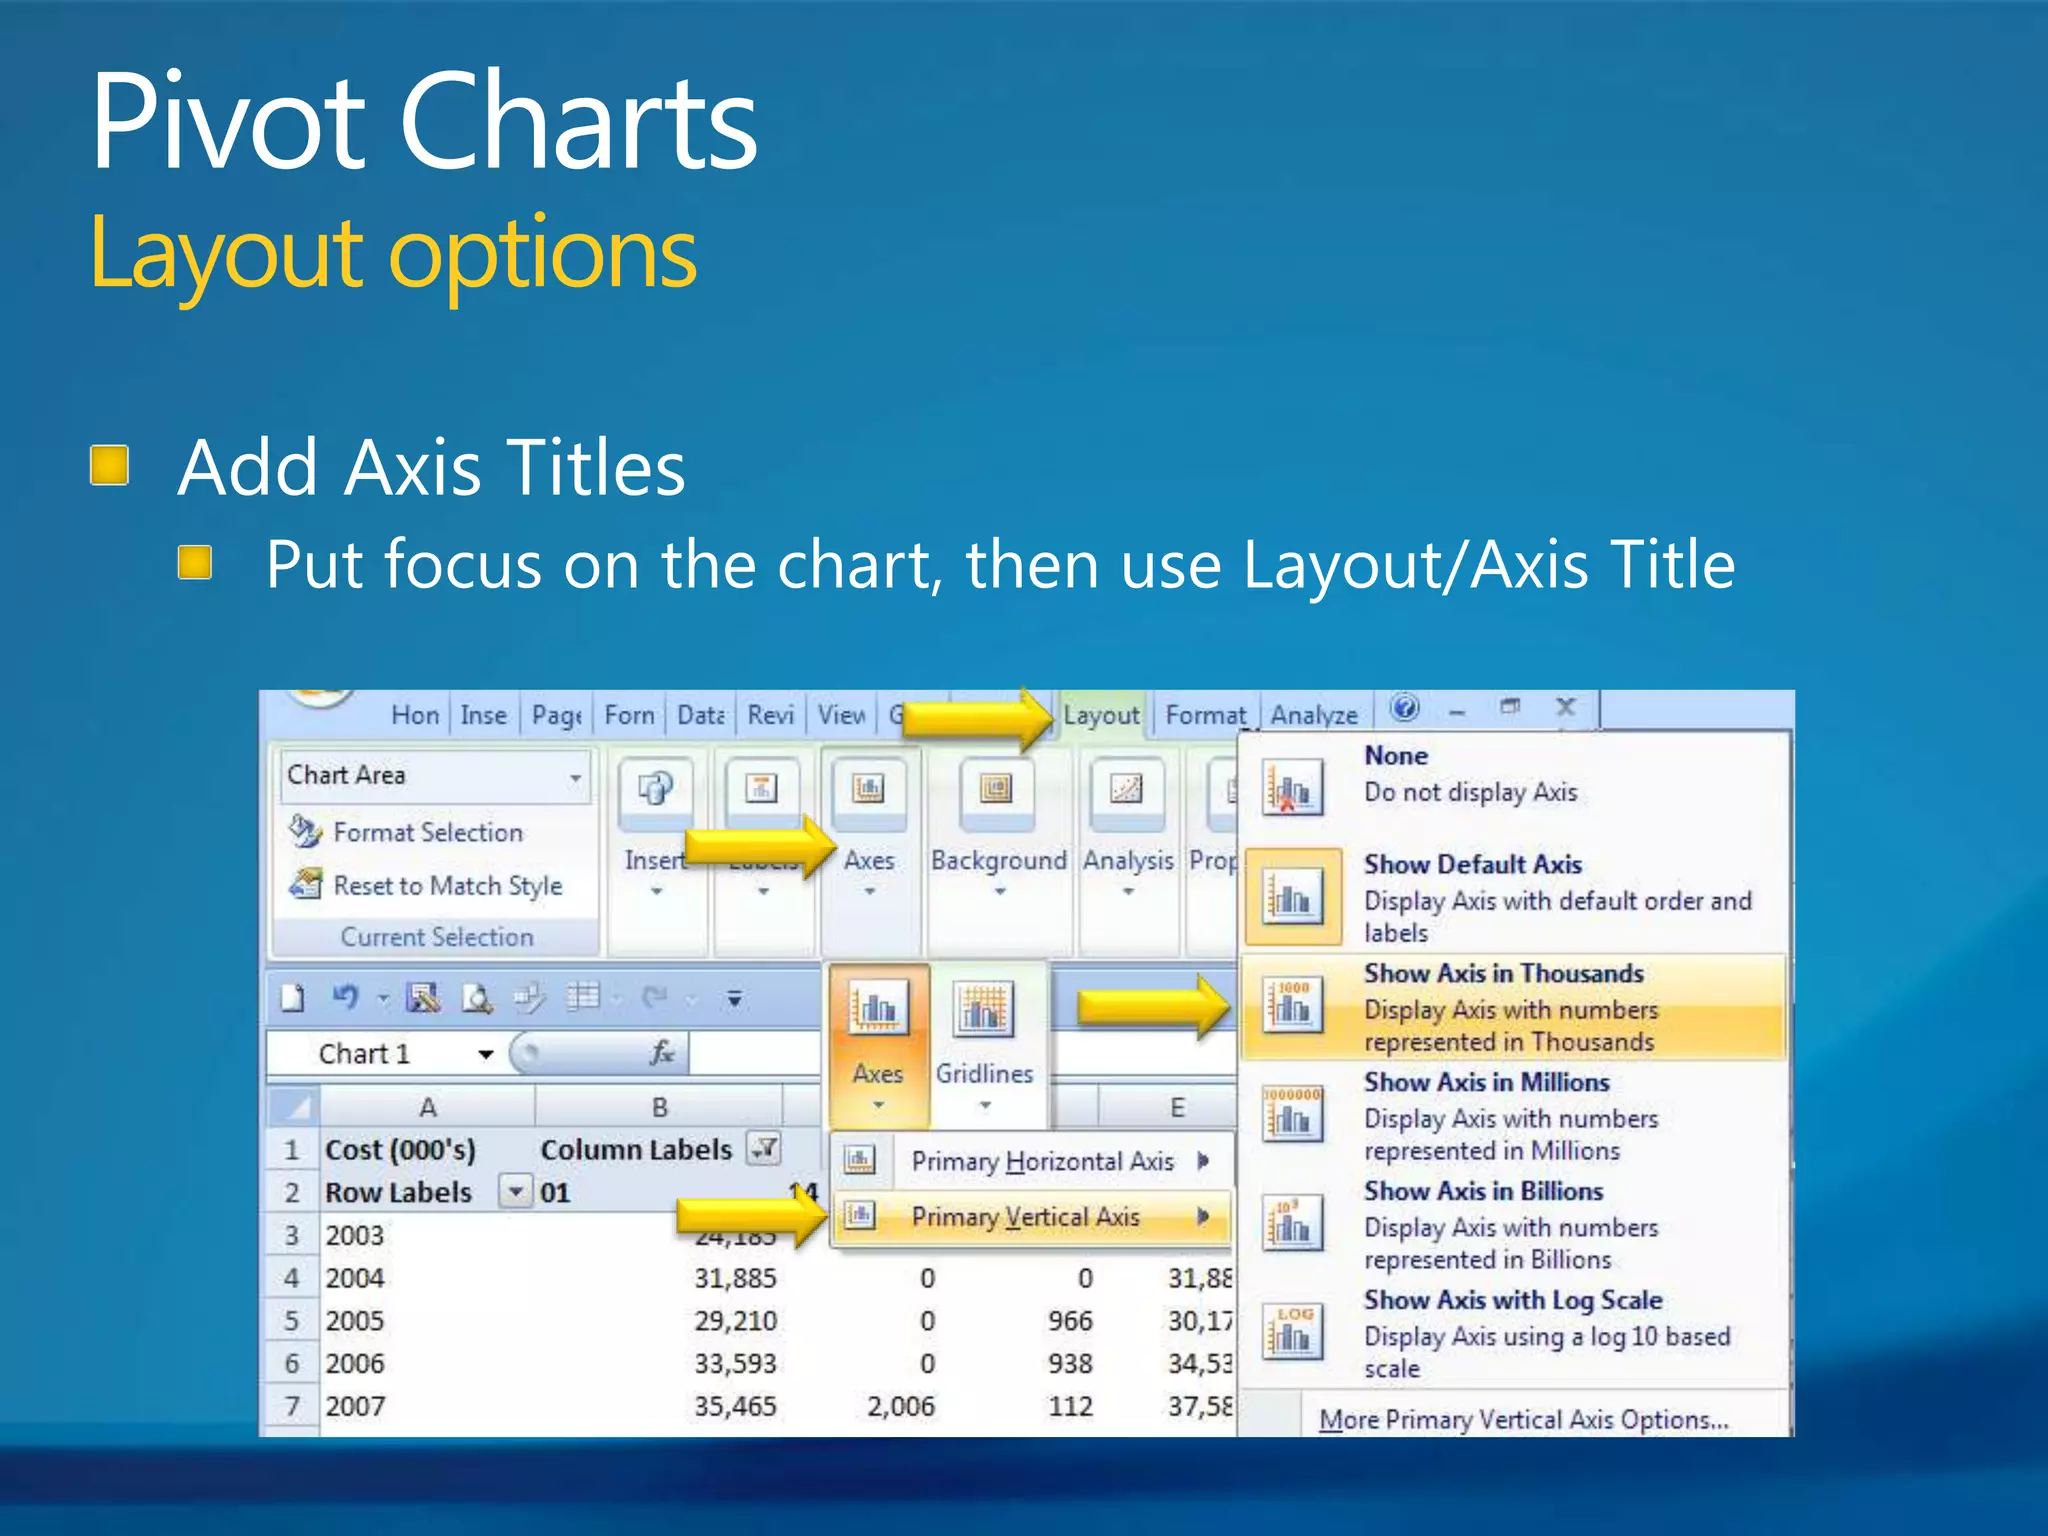
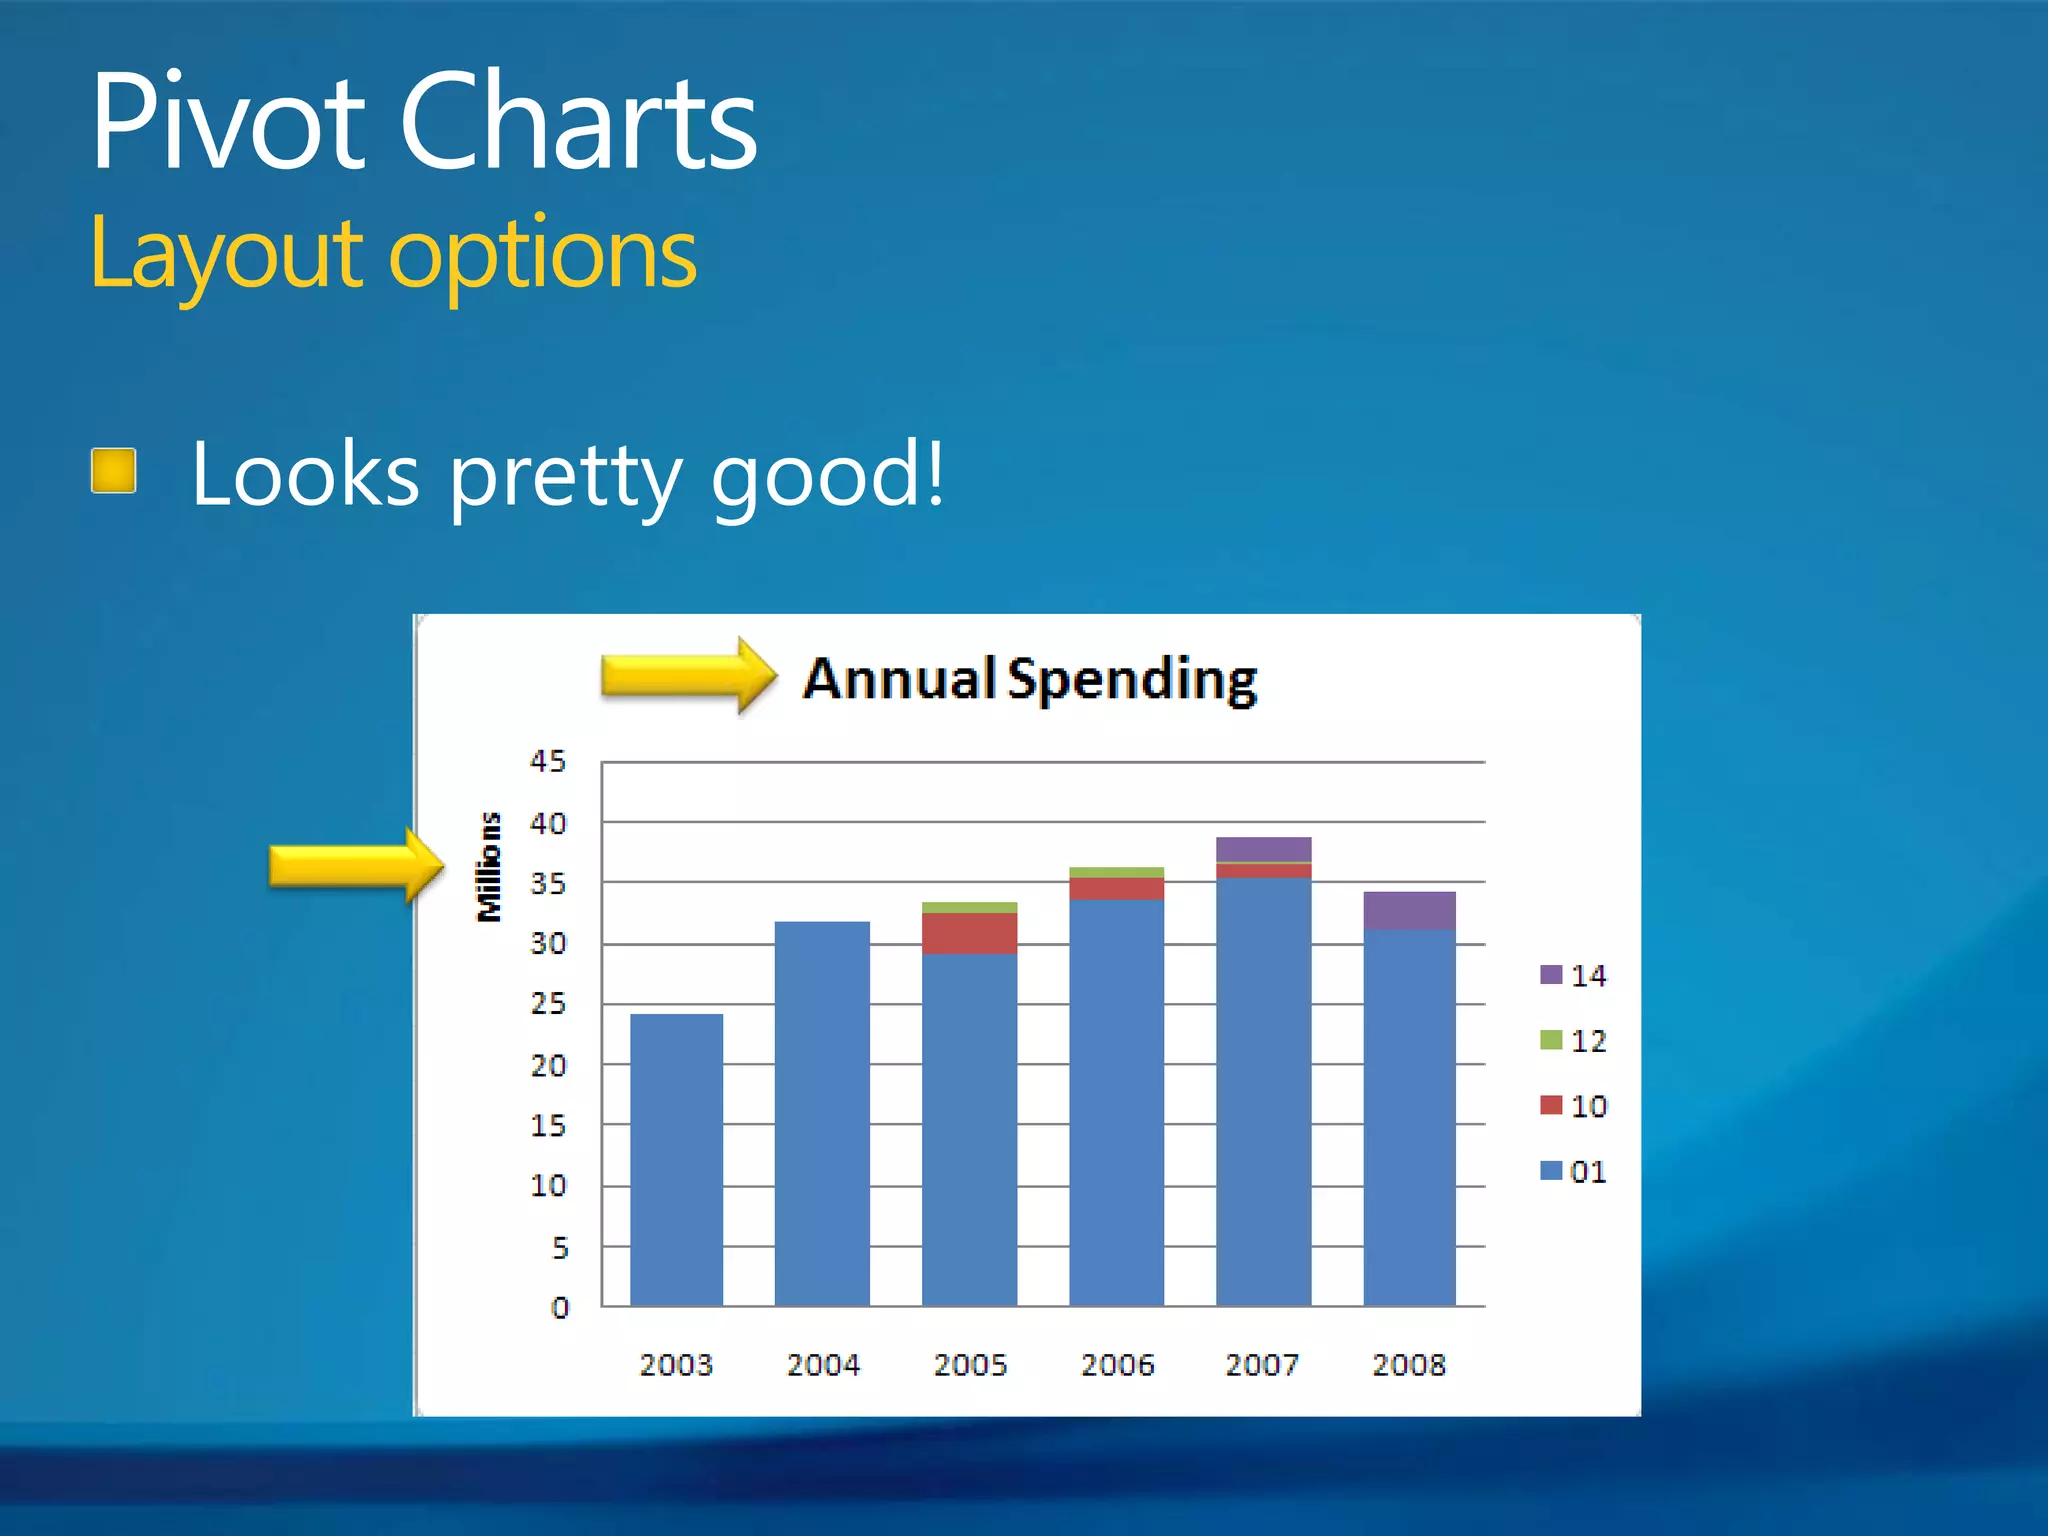
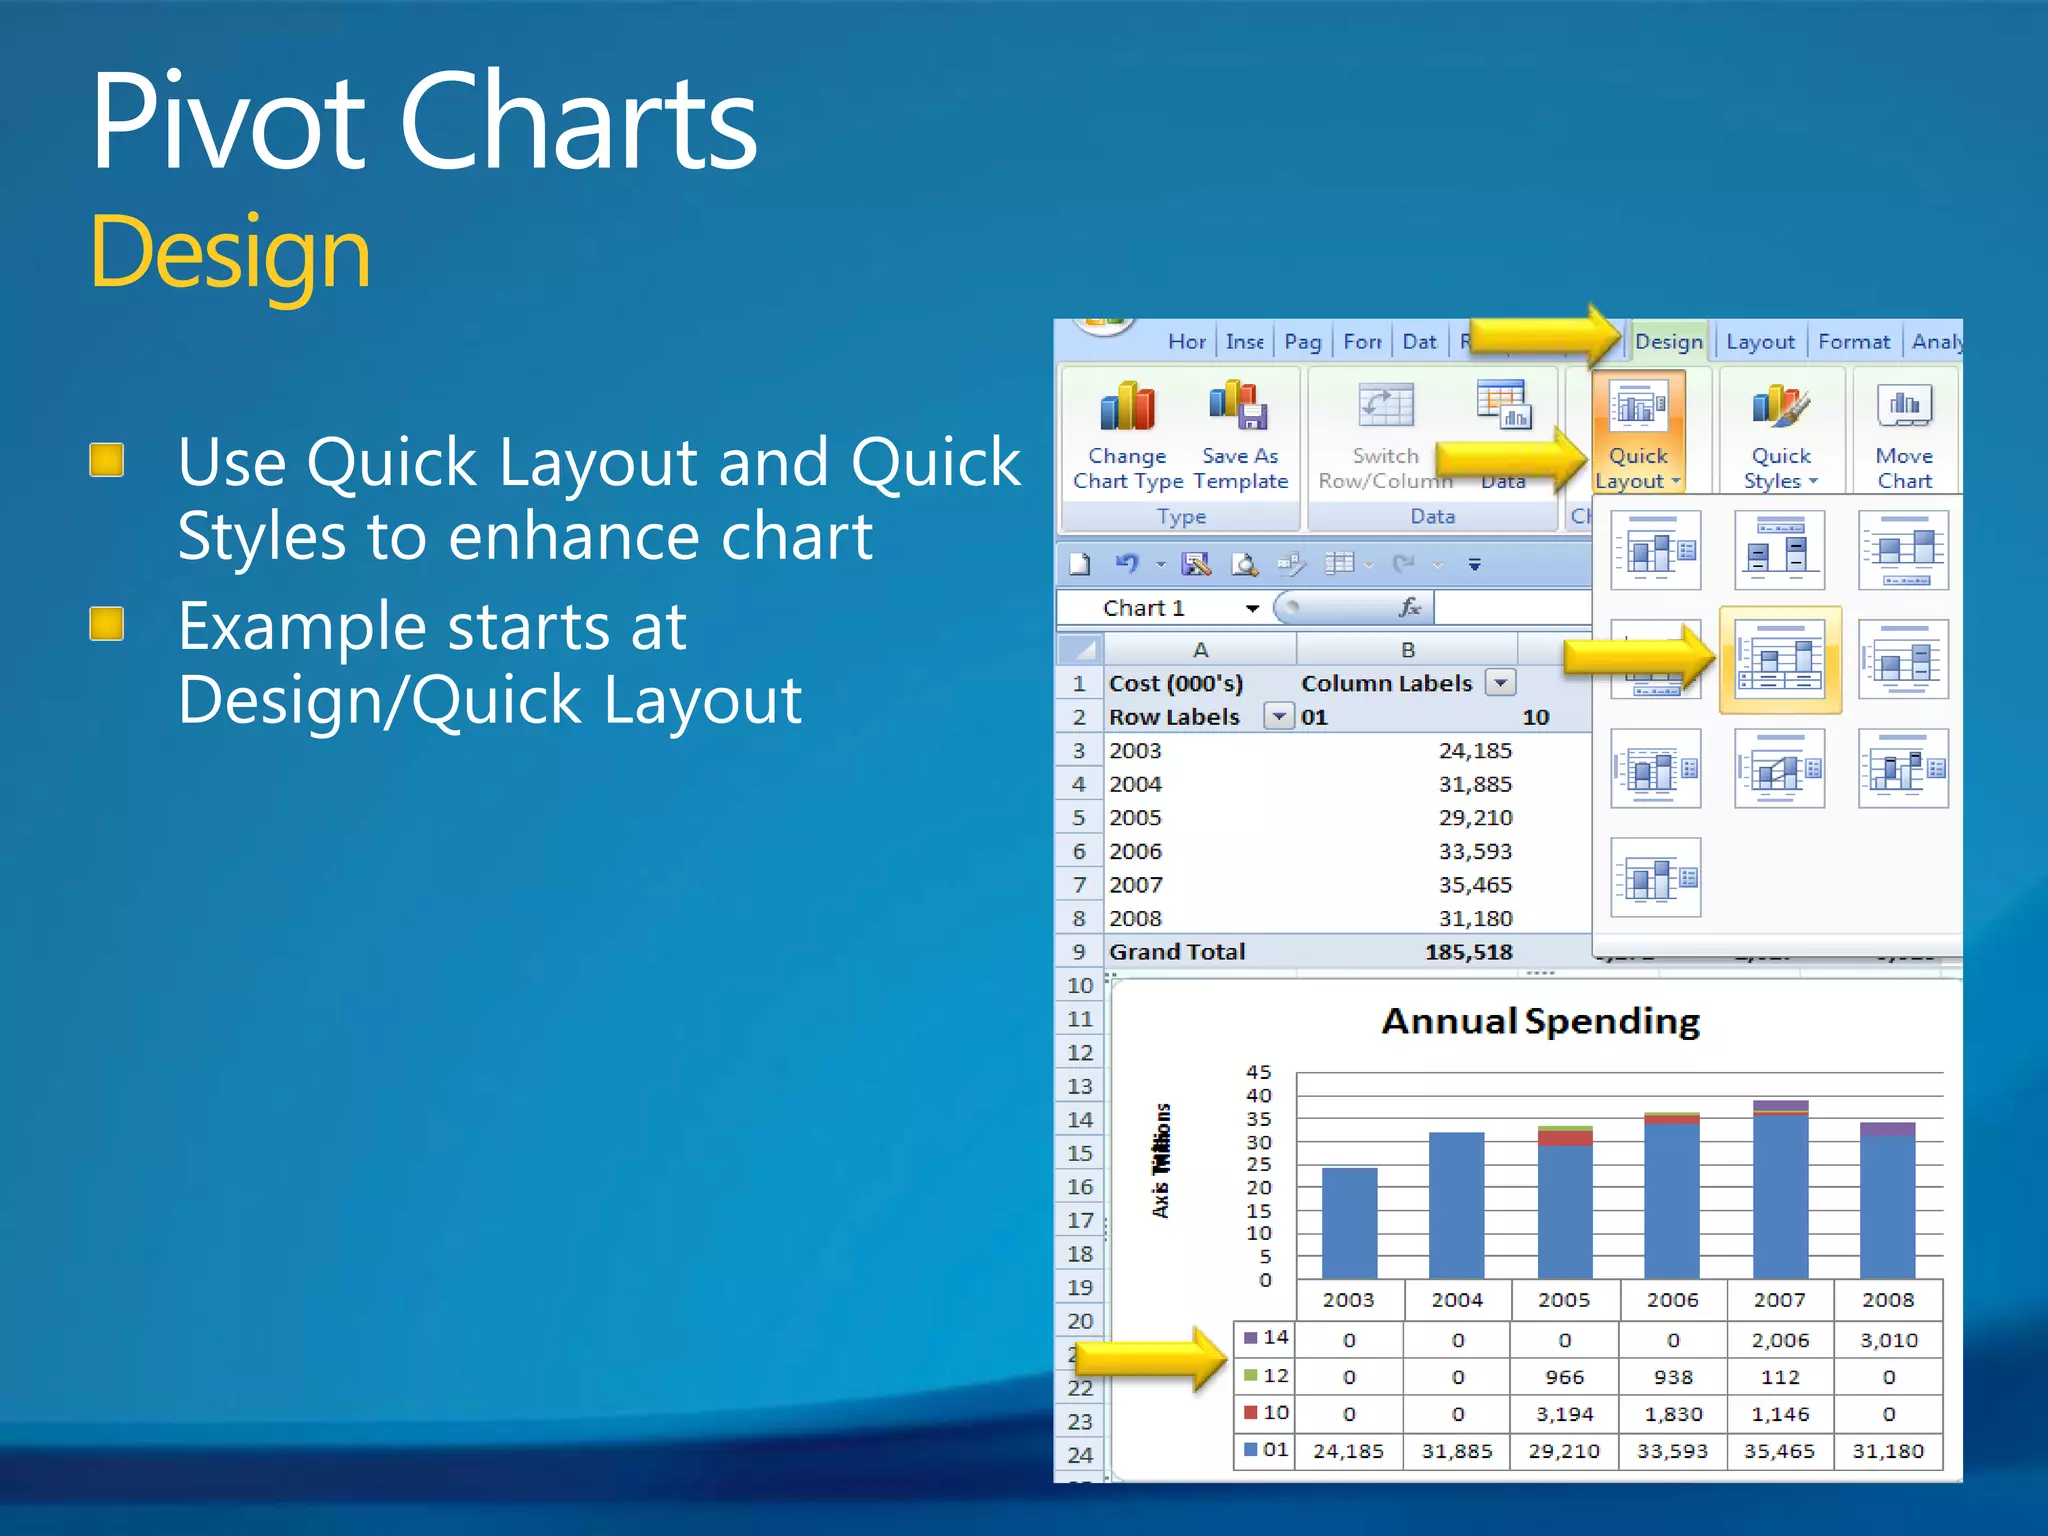
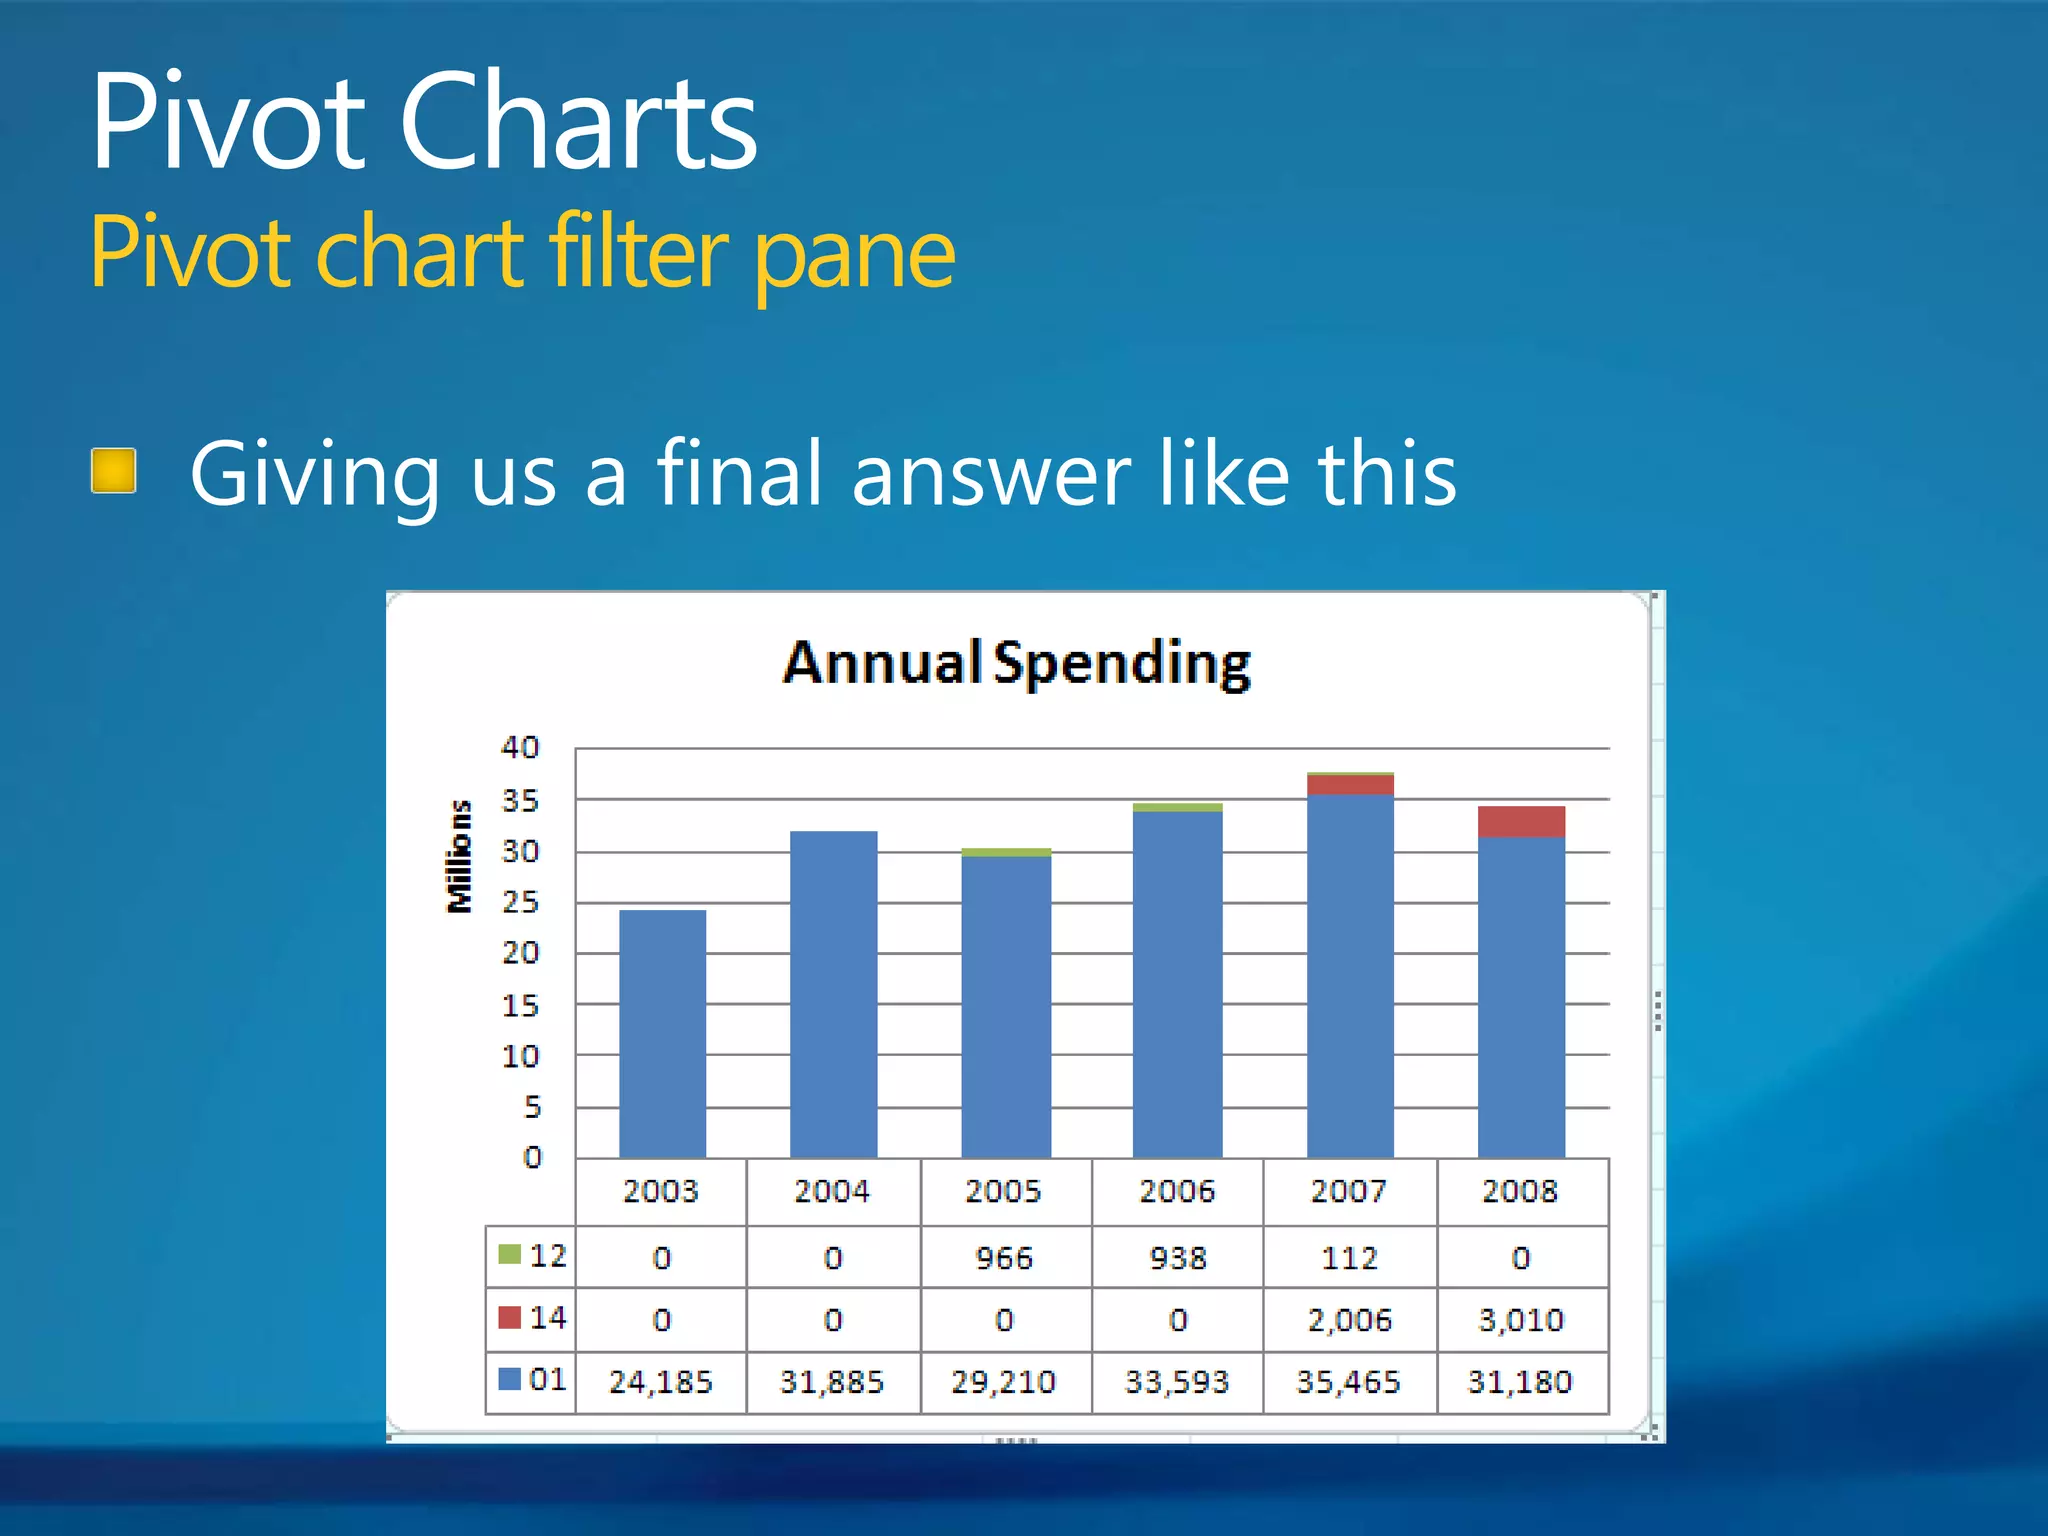
5. Choose data sources and layouts for pivot charts, including changing chart types, adding titles, and using design and layout options