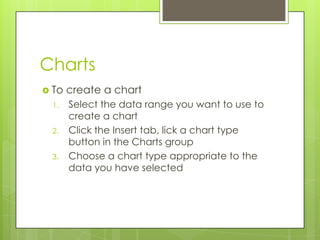
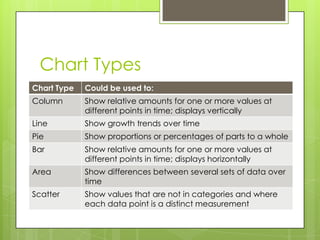
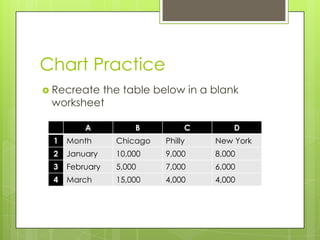
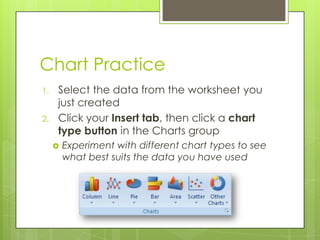
This document discusses creating and formatting charts in Excel 2007. It covers how to choose an appropriate chart type based on the data, such as using a column chart to show relative amounts over time. It also describes how to select data, insert a chart, and use quick layouts and styles to format the chart. The goal is to present data visually using charts.