Downloaded 367 times
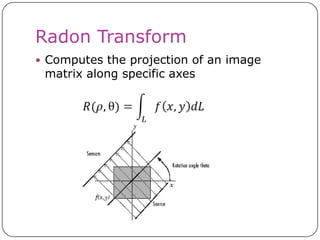
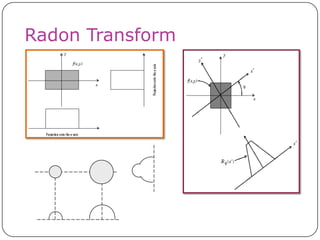
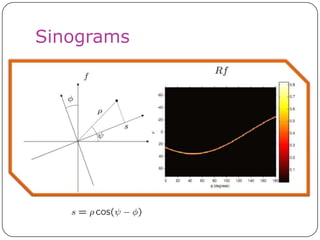
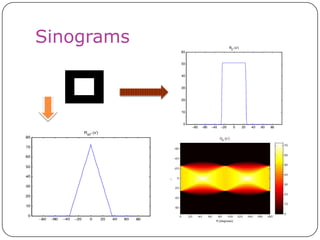
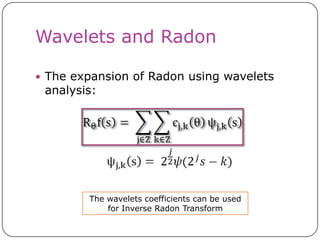
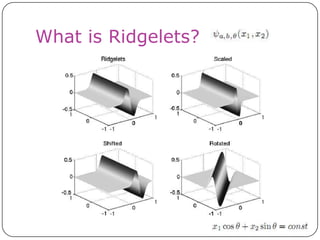

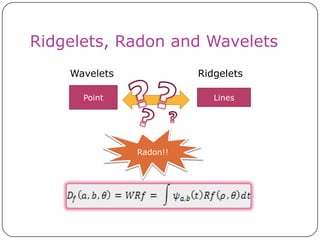
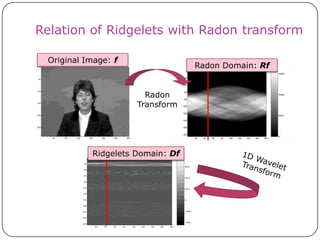
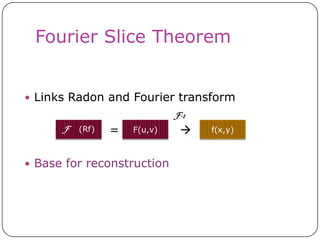
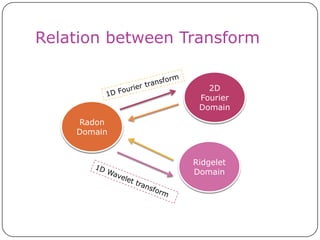
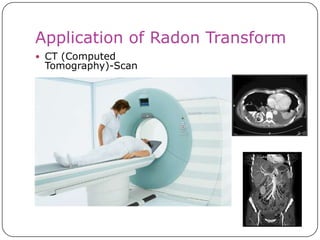
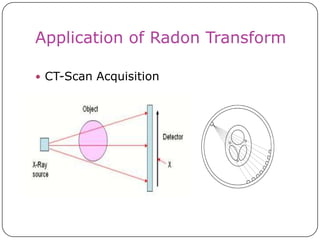
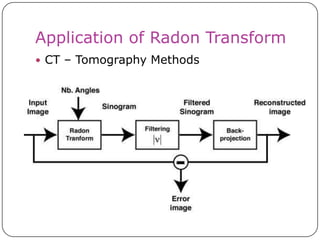
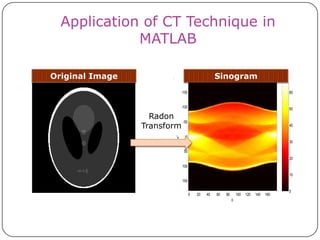
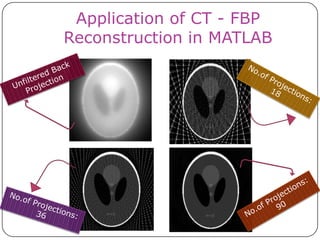
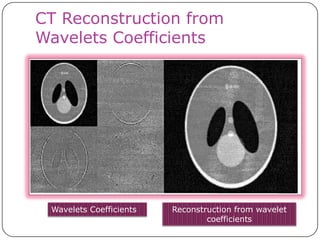
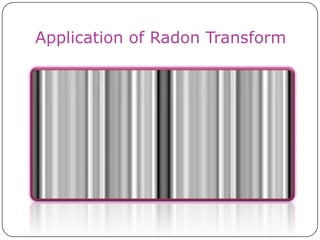
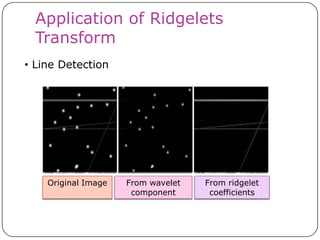

This document discusses the Radon transform and its applications in image processing. It introduces ridgelets as an extension of wavelets that are more effective for line and curve singularities. Ridgelets are derived from the Radon transform and wavelets. The Radon transform computes projections of an image along axes and is used in computed tomography (CT) scans to reconstruct tissue density images from X-ray measurements. Wavelets can localize the Radon transform for reconstruction. Ridgelets and the Radon transform have applications in tasks like line detection in images.


![11.[23 36]quadrature radon transform for smoother tomographic reconstruction](https://cdn.slidesharecdn.com/ss_thumbnails/11-23-36quadratureradontransformforsmoothertomographicreconstruction-120512235621-phpapp01-thumbnail.jpg?width=640&height=640&fit=bounds)