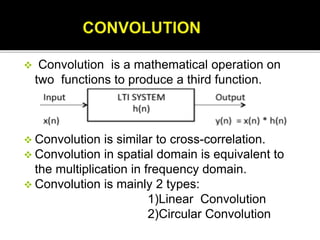
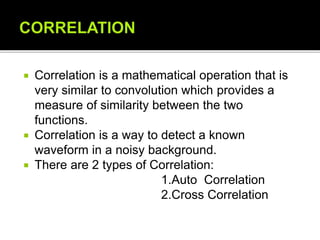
Convolution and correlation are similar mathematical operations used to extract information from images. Convolution operates on two functions to produce a third, and is equivalent to multiplication in the frequency domain. It can be linear or circular. Linear convolution of signals x(n) and h(n) produces output y(n)=x(n)*h(n). Circular convolution uses the maximum length of the signals. Correlation provides a measure of similarity between two functions and can be auto correlation, comparing a function to its shifted self, or cross correlation, comparing two different functions. Both are used in applications like image processing, signal processing, and more.

![1.Linear convolution:
• The Linear convolution of y(n) is
y(n)=x(n)*h(n)
• Linear convolution is divided into 3 types ,
a)Graphical method
b)Tabular method
c)Third method
• Ex: x[n] = {1,2,3} & h[n] = {-1,2,2}
Length=L+M-1=3+3-1=5
* Convoluted output
y[n] = [ -1, -2+2, -3+4+2, 6+4, 6]
= [-1, 0, 3, 10, 6]](https://image.slidesharecdn.com/convolutioncorrelation-180405184549/85/Convolution-Correlation-4-320.jpg)
![2.Cicular convolution:
• The Circular convolution of y(n) is
y(n)=x(n) ʘ h (n)
• Circular convolution is divided into 3 types ,
a)Matrix
b)Concentric circle
c)Using DFT&IDFT
• Ex: x[n] = {-2,4,6,0,0}
h[n] = {1,2,-3,4,-5}
Length=Max(L,M)=Max(5,5)=5
* Convoluted output
y(n) =[2,-30,20,-8,8]](https://image.slidesharecdn.com/convolutioncorrelation-180405184549/85/Convolution-Correlation-5-320.jpg)
![1.Auto correlation
• Auto correlation gives comparison of the function
with its shifted version.
• Auto correlation provides a nice way to
determine the spectral content of random signal.
• Example: x(n)={1,2,3} & x(-n)={3,2,1}
*Auto correlation of x(n)&x(-n) is y(n)
y(n)=[3,8,14,8,3]](https://image.slidesharecdn.com/convolutioncorrelation-180405184549/85/Convolution-Correlation-7-320.jpg)
![2.Cross correlation
• Cross correlation is a measure of similarity of two
series as a function.
• To compare two different functions , we use the
cross correlation function.
• Cross correlation and convolution are similar to
each other.
• Ex:x[n]={2,2,-1}&h[n]={1,2,3}
x[-n]={-1,2,2}
*The correlated output is
y[n] = [ -1, -2+2, -3+4+2, 6+4, 6]
= [-1, 0, 3, 10, 6]](https://image.slidesharecdn.com/convolutioncorrelation-180405184549/85/Convolution-Correlation-8-320.jpg)