Downloaded 151 times

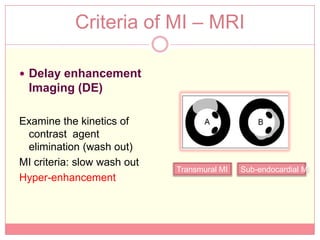
![CT – Perfusion Imaging
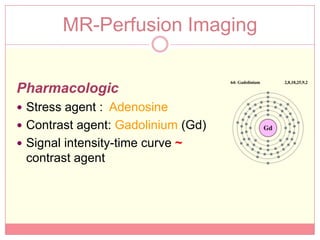
Pharmacologic
Stress agent : Adenosine
Contrast agent : Iodine based (e.g, Visipaque)
[concentration ~ x-ray absorbtion]
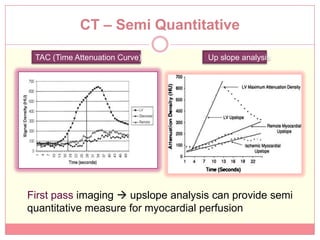
Signal-density-time curve ~ CT attenuation over time](https://image.slidesharecdn.com/midraft3-120605123458-phpapp01/85/Myocardial-Infraction-diagnosis-using-CT-Scan-MRI-7-320.jpg)

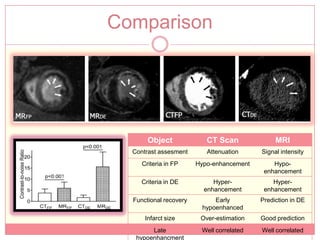
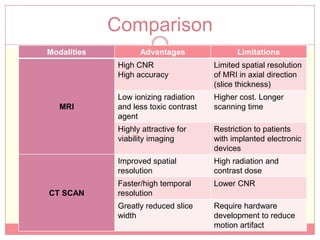
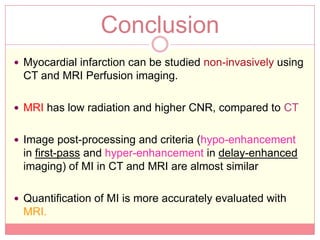

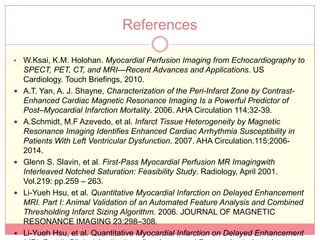

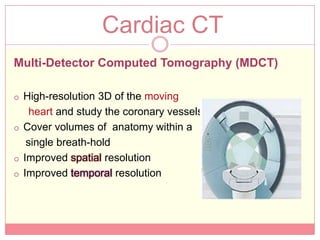
The document reviews various image processing methods for diagnosing myocardial infarction (MI) using MRI and CT scans, discussing the limitations and advantages of each imaging technique. It emphasizes that non-invasive methods like CT and MRI perfusion imaging provide significant insights into MI, with MRI showing better accuracy and lower radiation exposure compared to CT. The document outlines the criteria used for assessing MI via both imaging modalities and highlights the importance of image post-processing for accurate quantification of MI.


![ONFH[AVN HIP] -TRIPLE REGIME -A NOVAL SURGICAL CONCEPT .pptx](https://cdn.slidesharecdn.com/ss_thumbnails/onfhavnhip2026koaconcalicutdrgokuldevdrmashraf-260210064517-213ec005-thumbnail.jpg?width=640&height=640&fit=bounds)


![CTEV [ clubfoot] DR ARUN LAL ,DR MOHAMED ASHRAF travancore medical college k...](https://cdn.slidesharecdn.com/ss_thumbnails/ctevclubfootdrarunlaldrmohamedashraftravancoremedicalcollegekollamkeralaindia-260208063247-18fc466c-thumbnail.jpg?width=640&height=640&fit=bounds)