


![Fourier Slice Theorem
Fourier slice theorem states that “The Fourier transform of the projection of
an object at angle θ is equal to a slice of the Fourier transform of object
along angle θ”.
P(t)
f(x,y)
t
y
x
X-rays
F(u,v)
F[P(t)]](https://image.slidesharecdn.com/imagereconstruction-190304110751/75/CT-Image-reconstruction-26-2048.jpg)


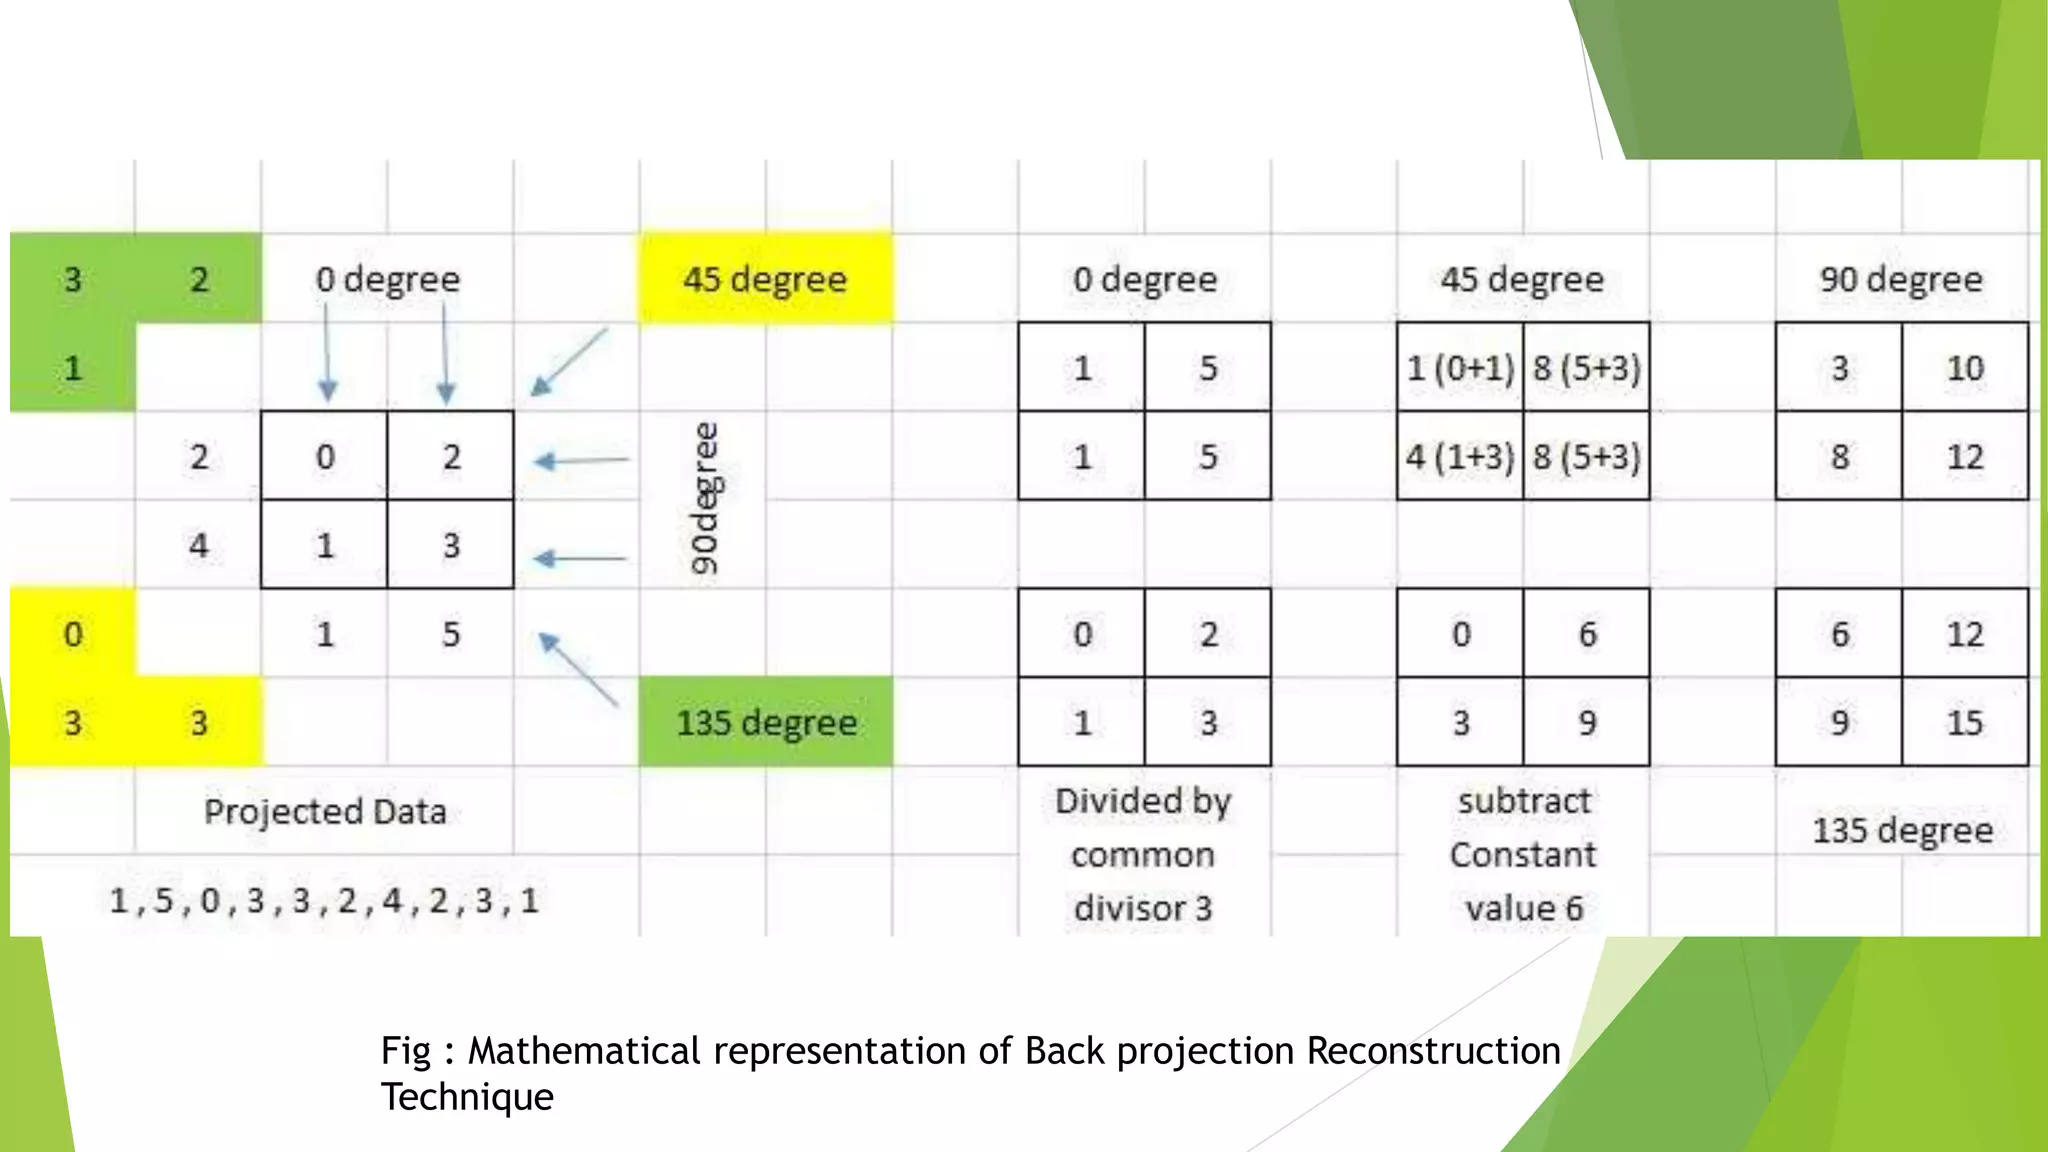
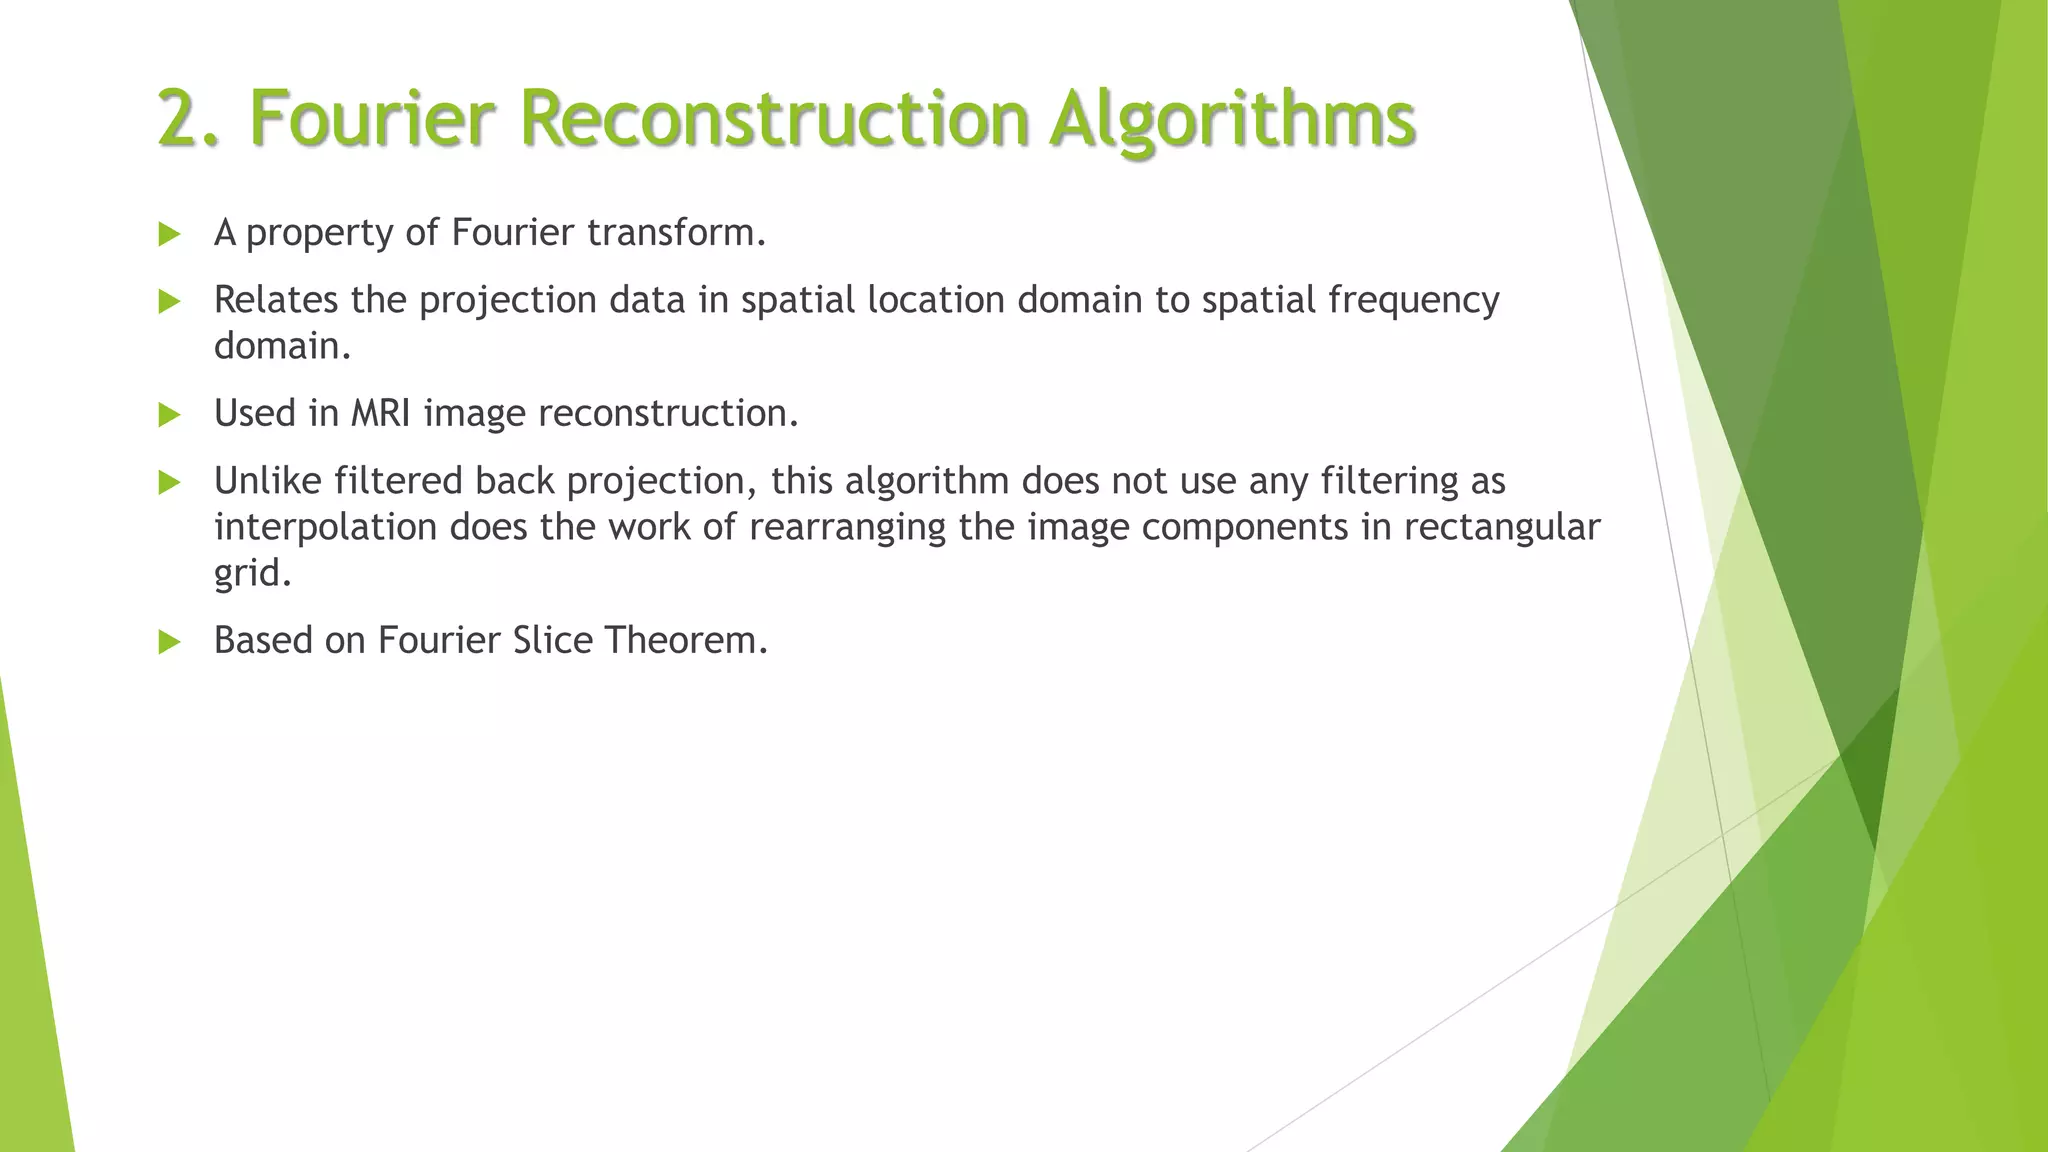
The document discusses image reconstruction in computed tomography (CT), detailing its invention, the evolution through various generations, and the fundamental principles behind CT imaging. It covers technical aspects such as algorithms, convolution, interpolation, and different methods of image reconstruction including back projection, iterative, and analytical methods. The importance of filtering and Fourier reconstruction algorithms in enhancing image quality and reducing artifacts is also highlighted.
Introduces CT and its invention, operating principles, and historical development. Key terms: x-ray imaging, cross-sectional images, attenuation coefficient.
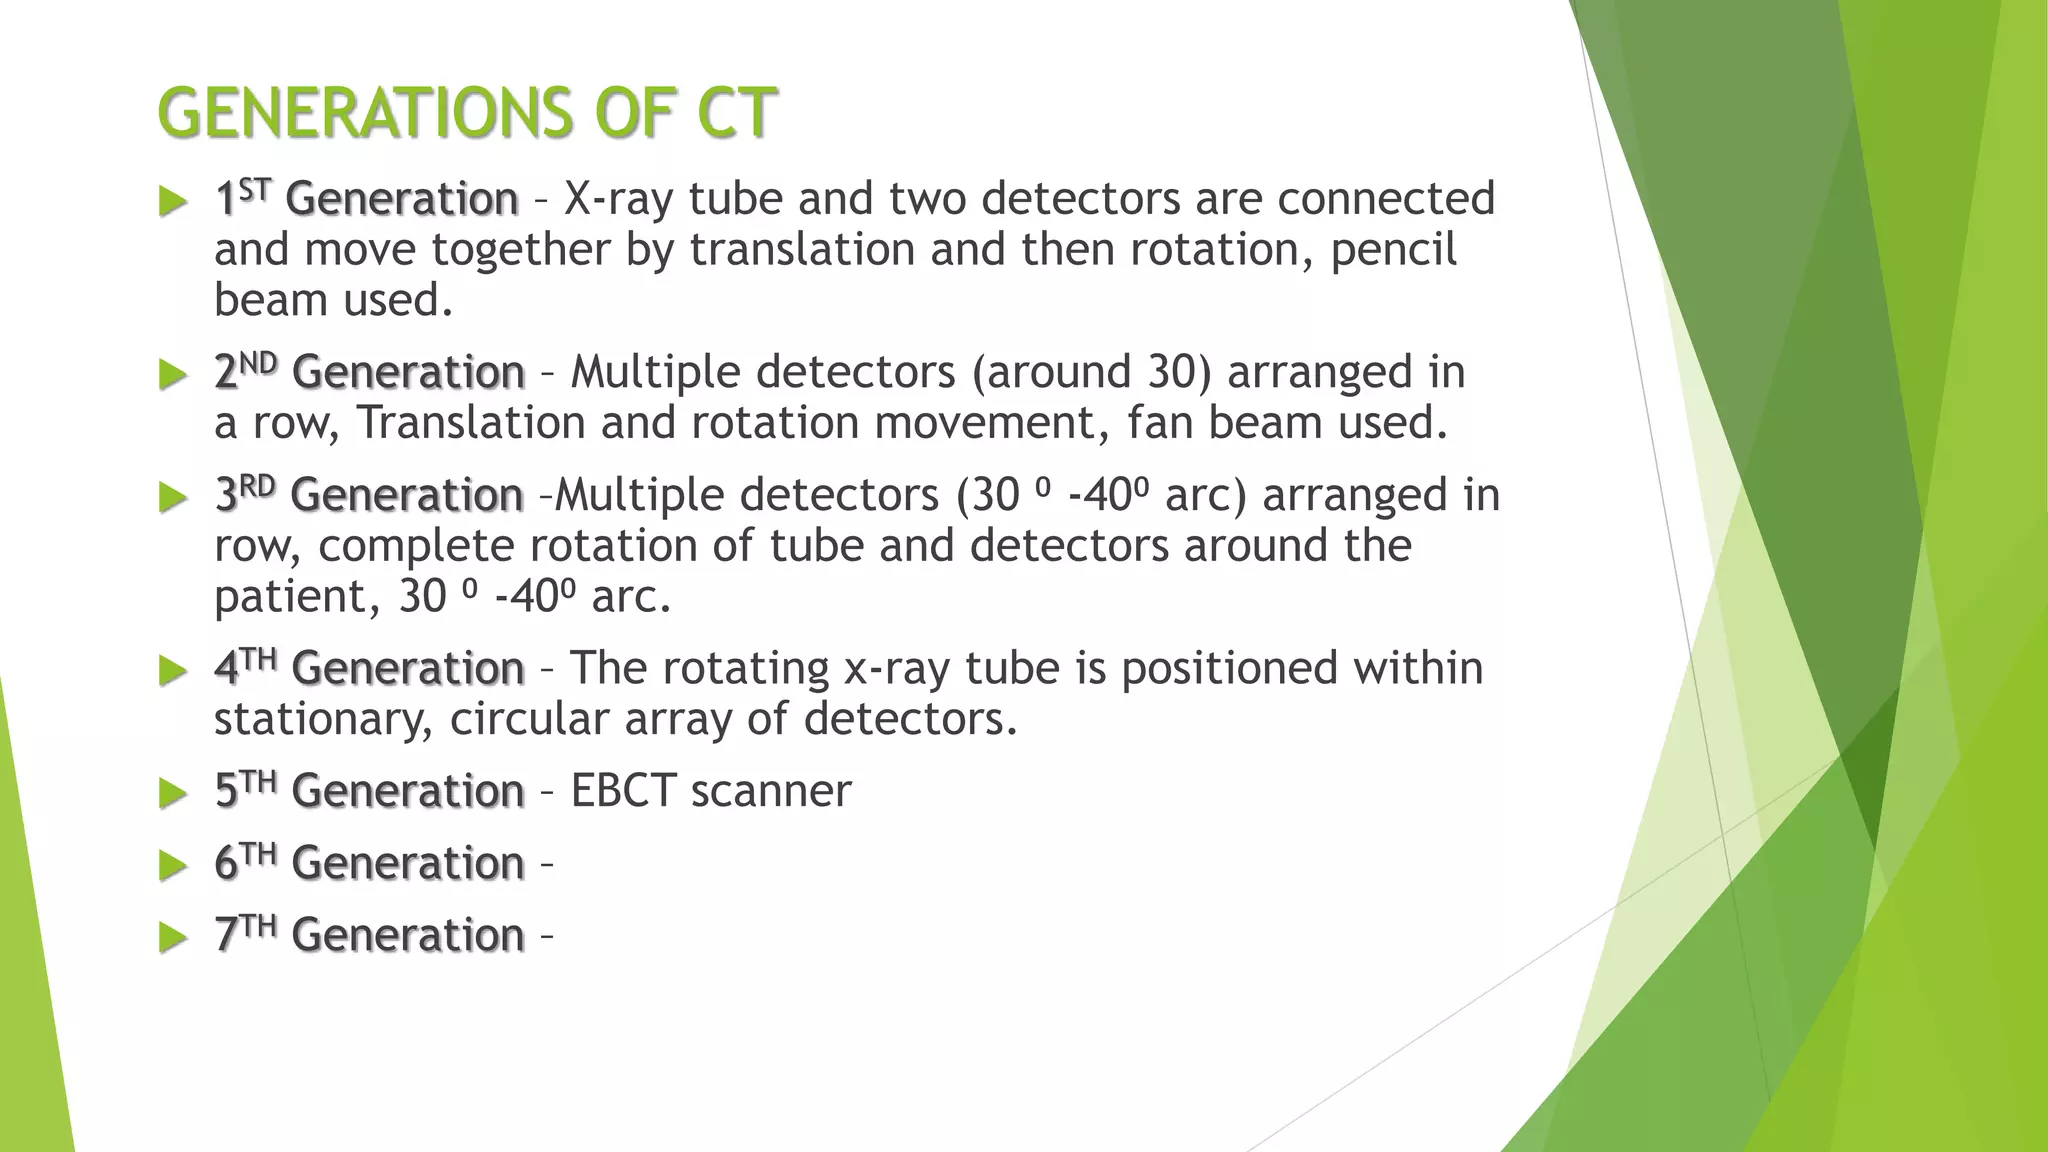
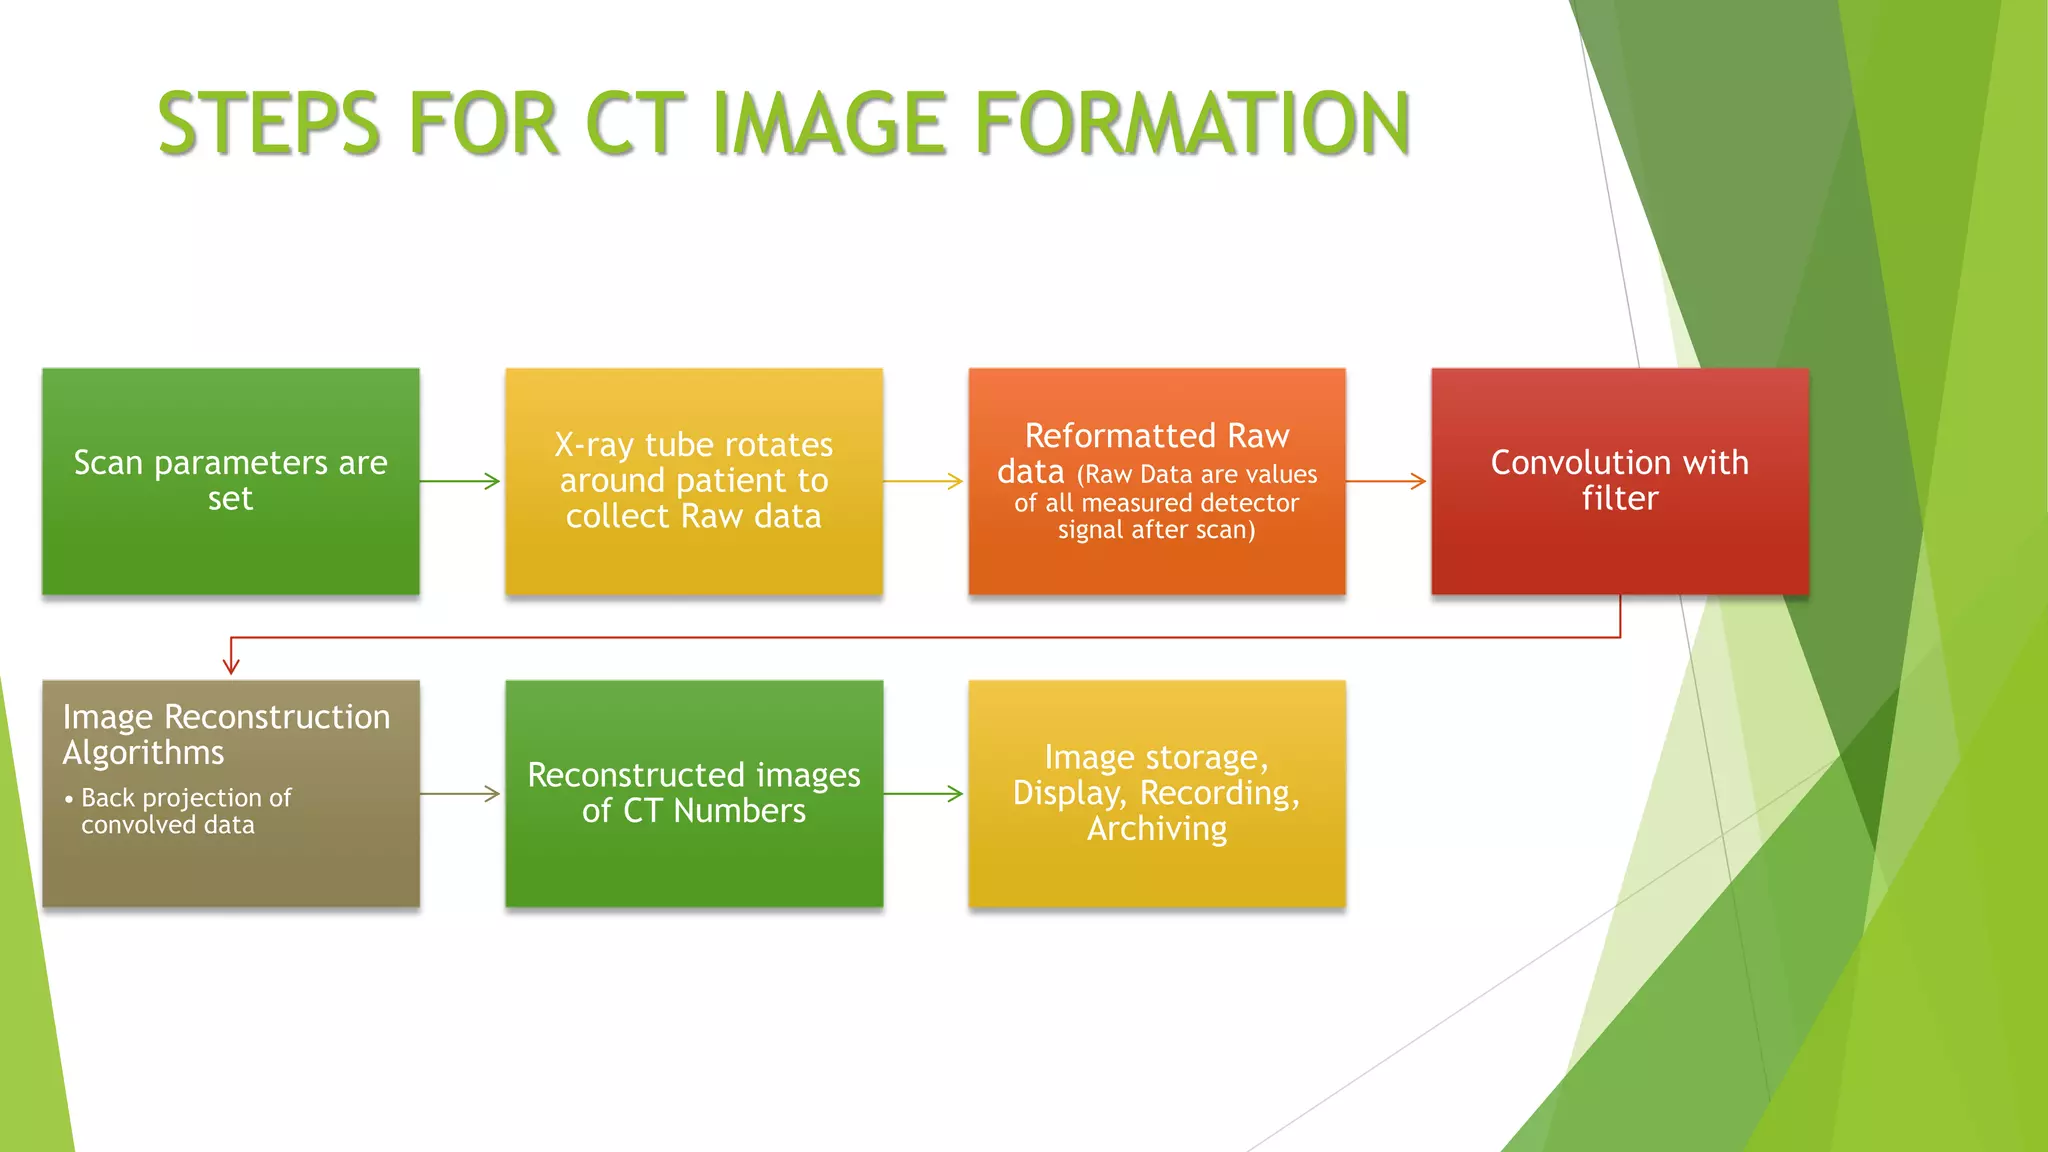
Describes CT generations and detailed steps for image formation. Key terms: detector arrangement, scan parameters, image reconstruction algorithms.
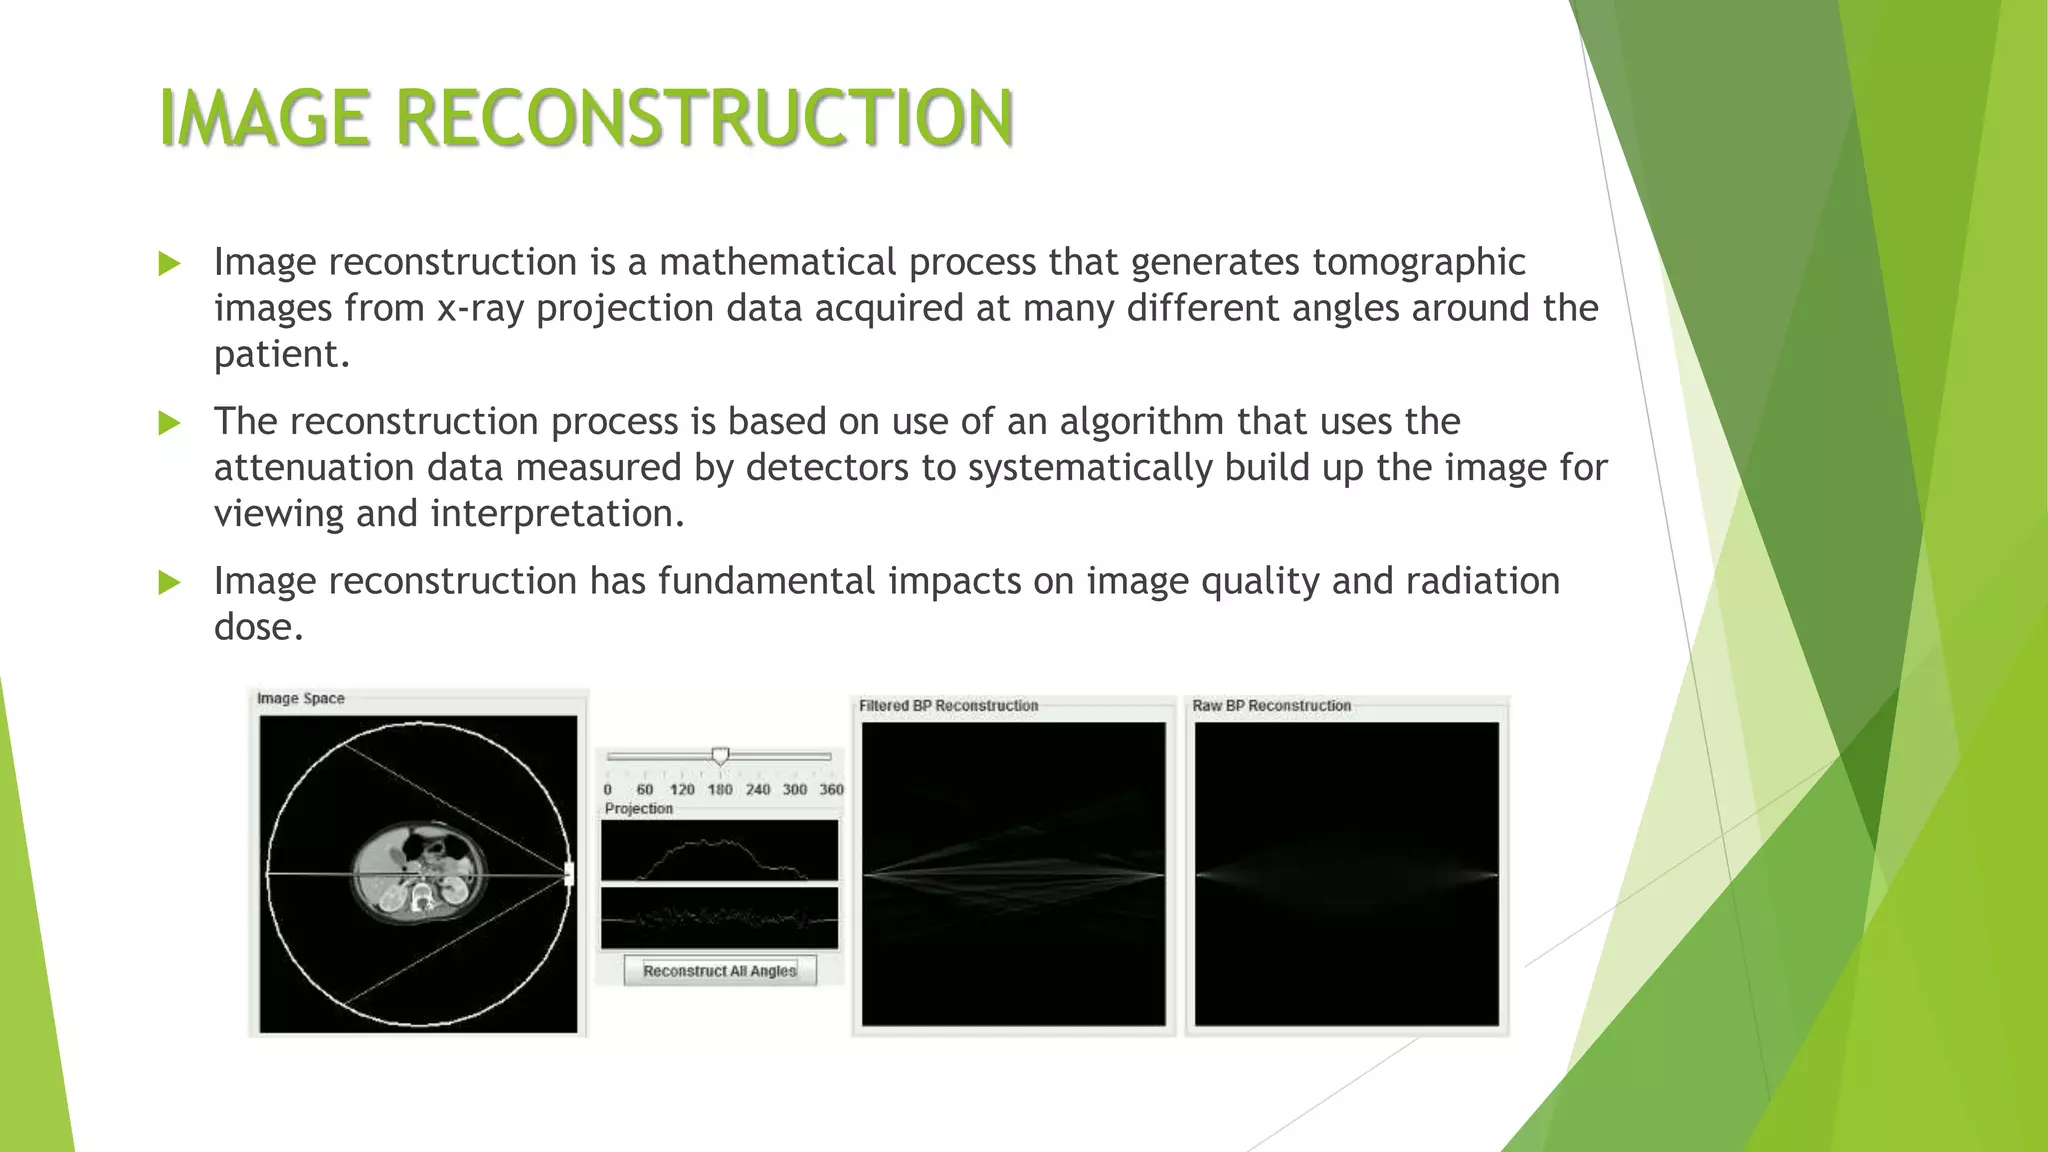
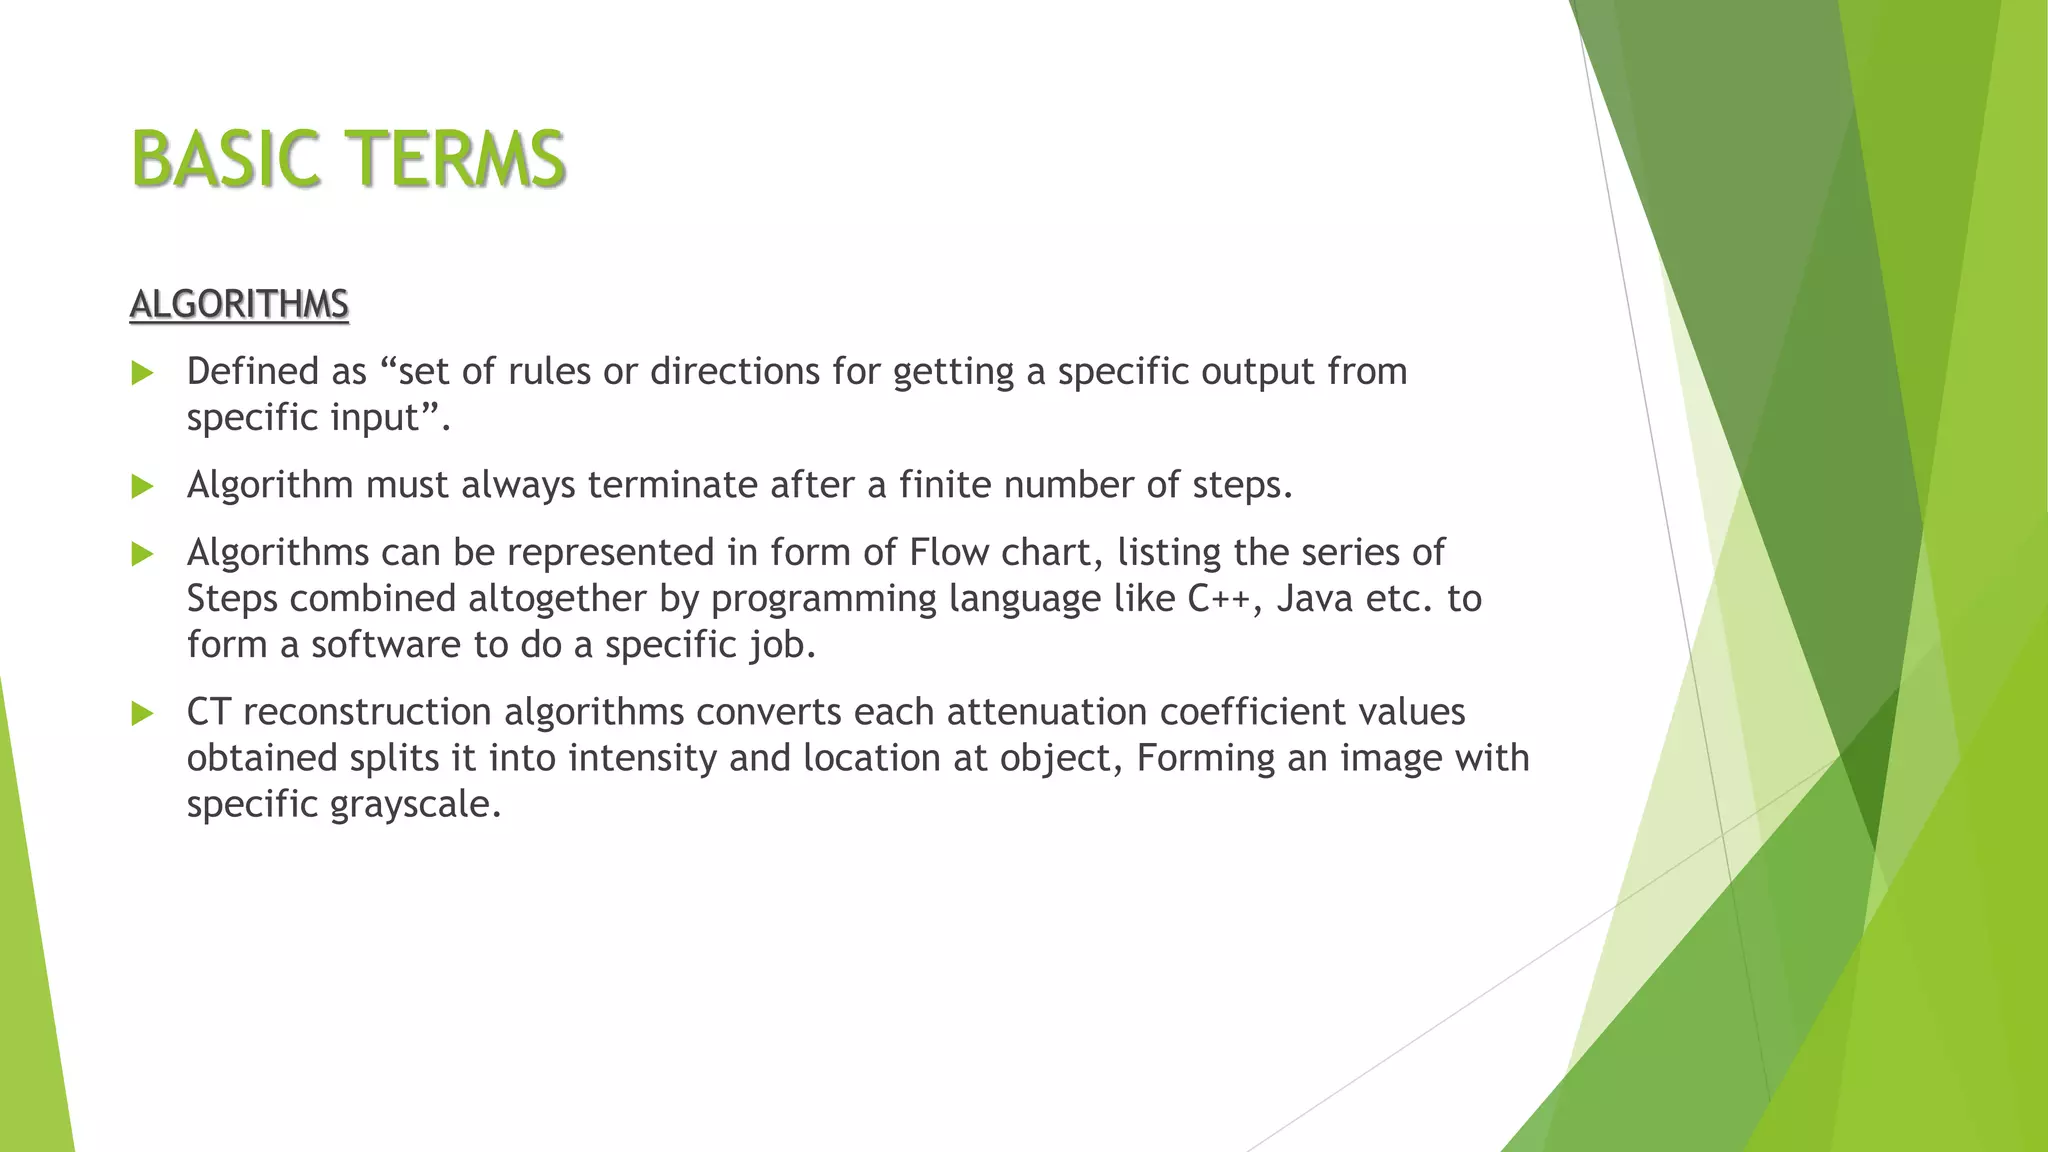
Discusses mathematical processes and algorithms for image reconstruction affecting quality and radiation dose. Keywords: attenuation data, grayscale.
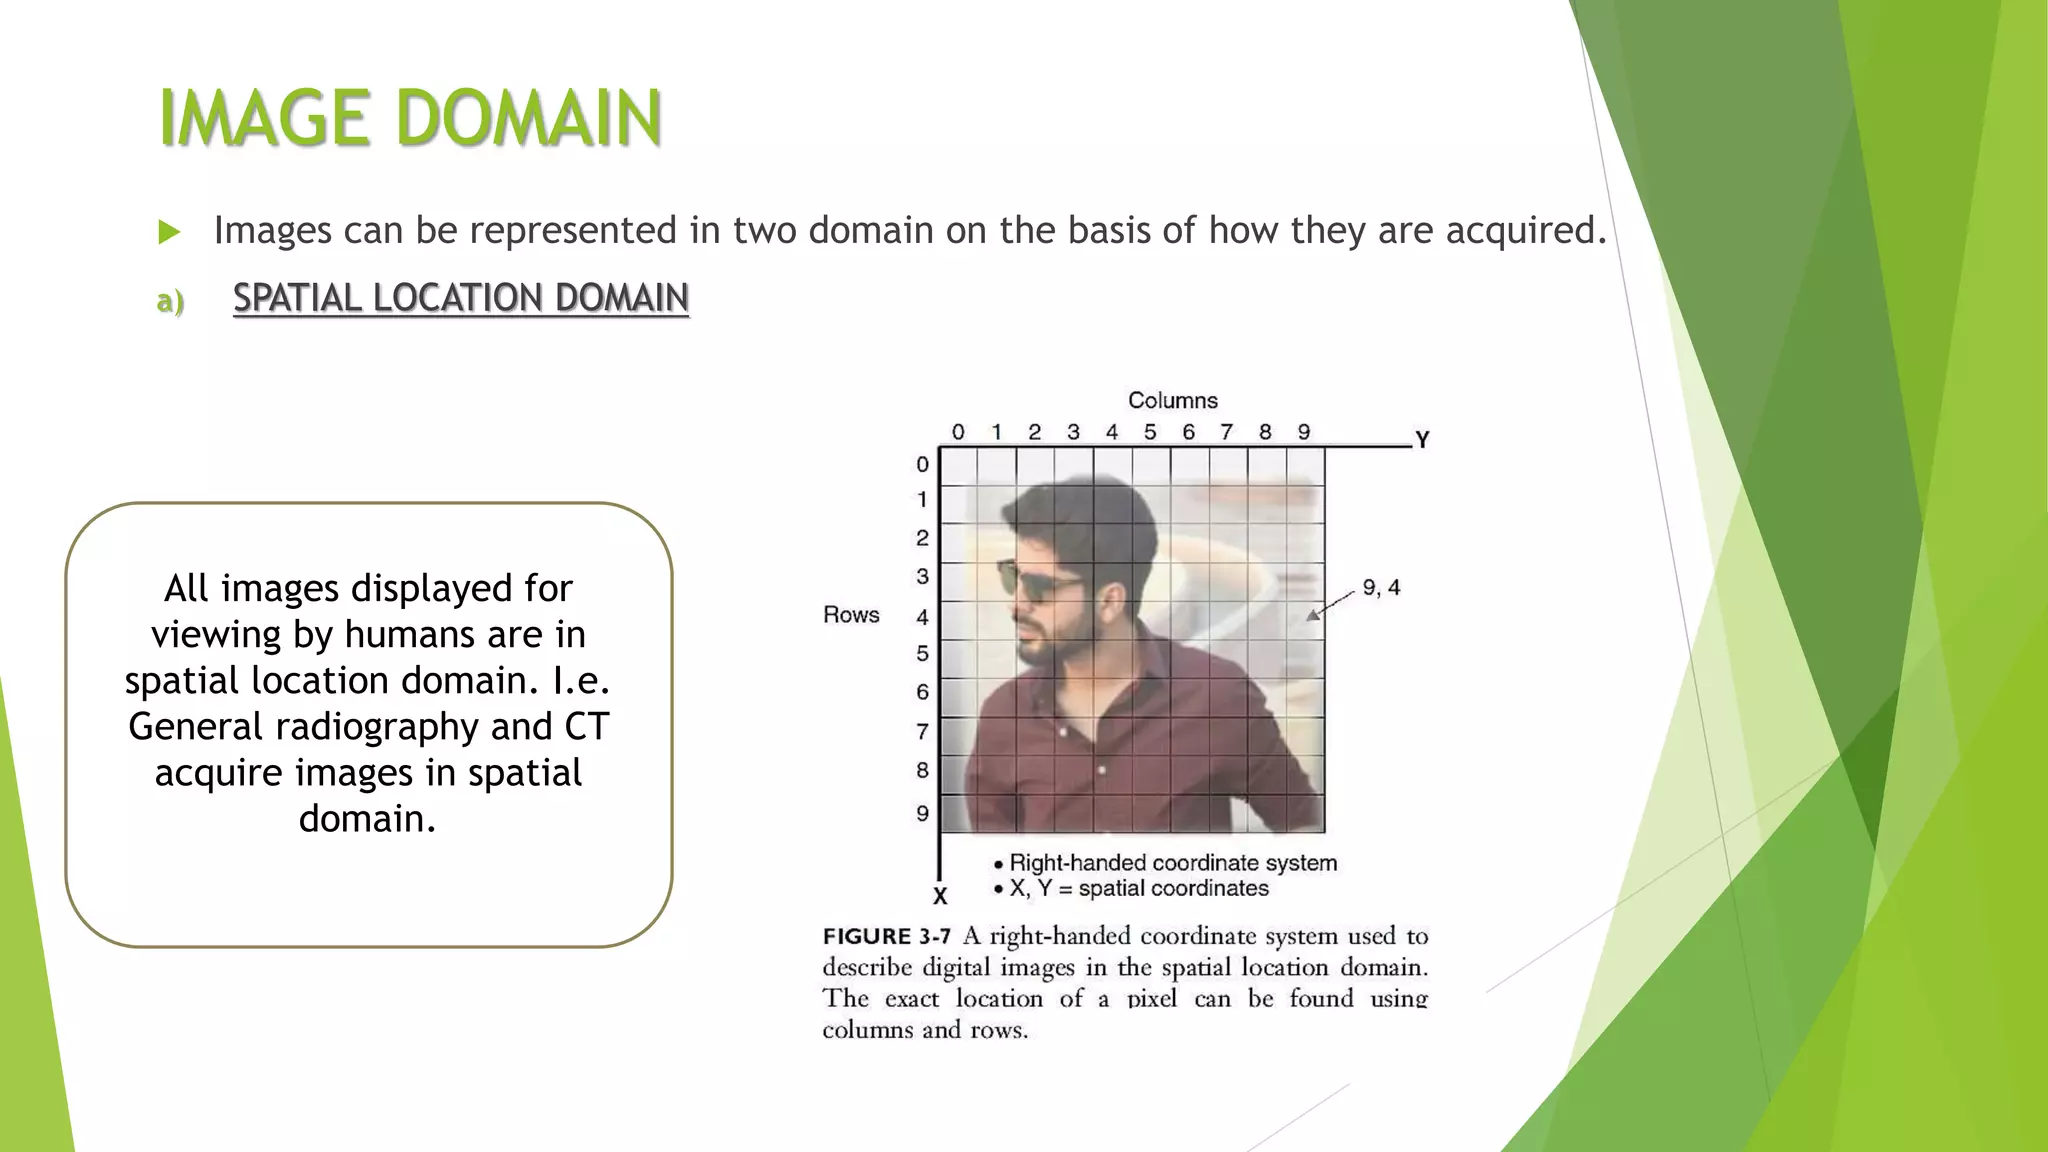
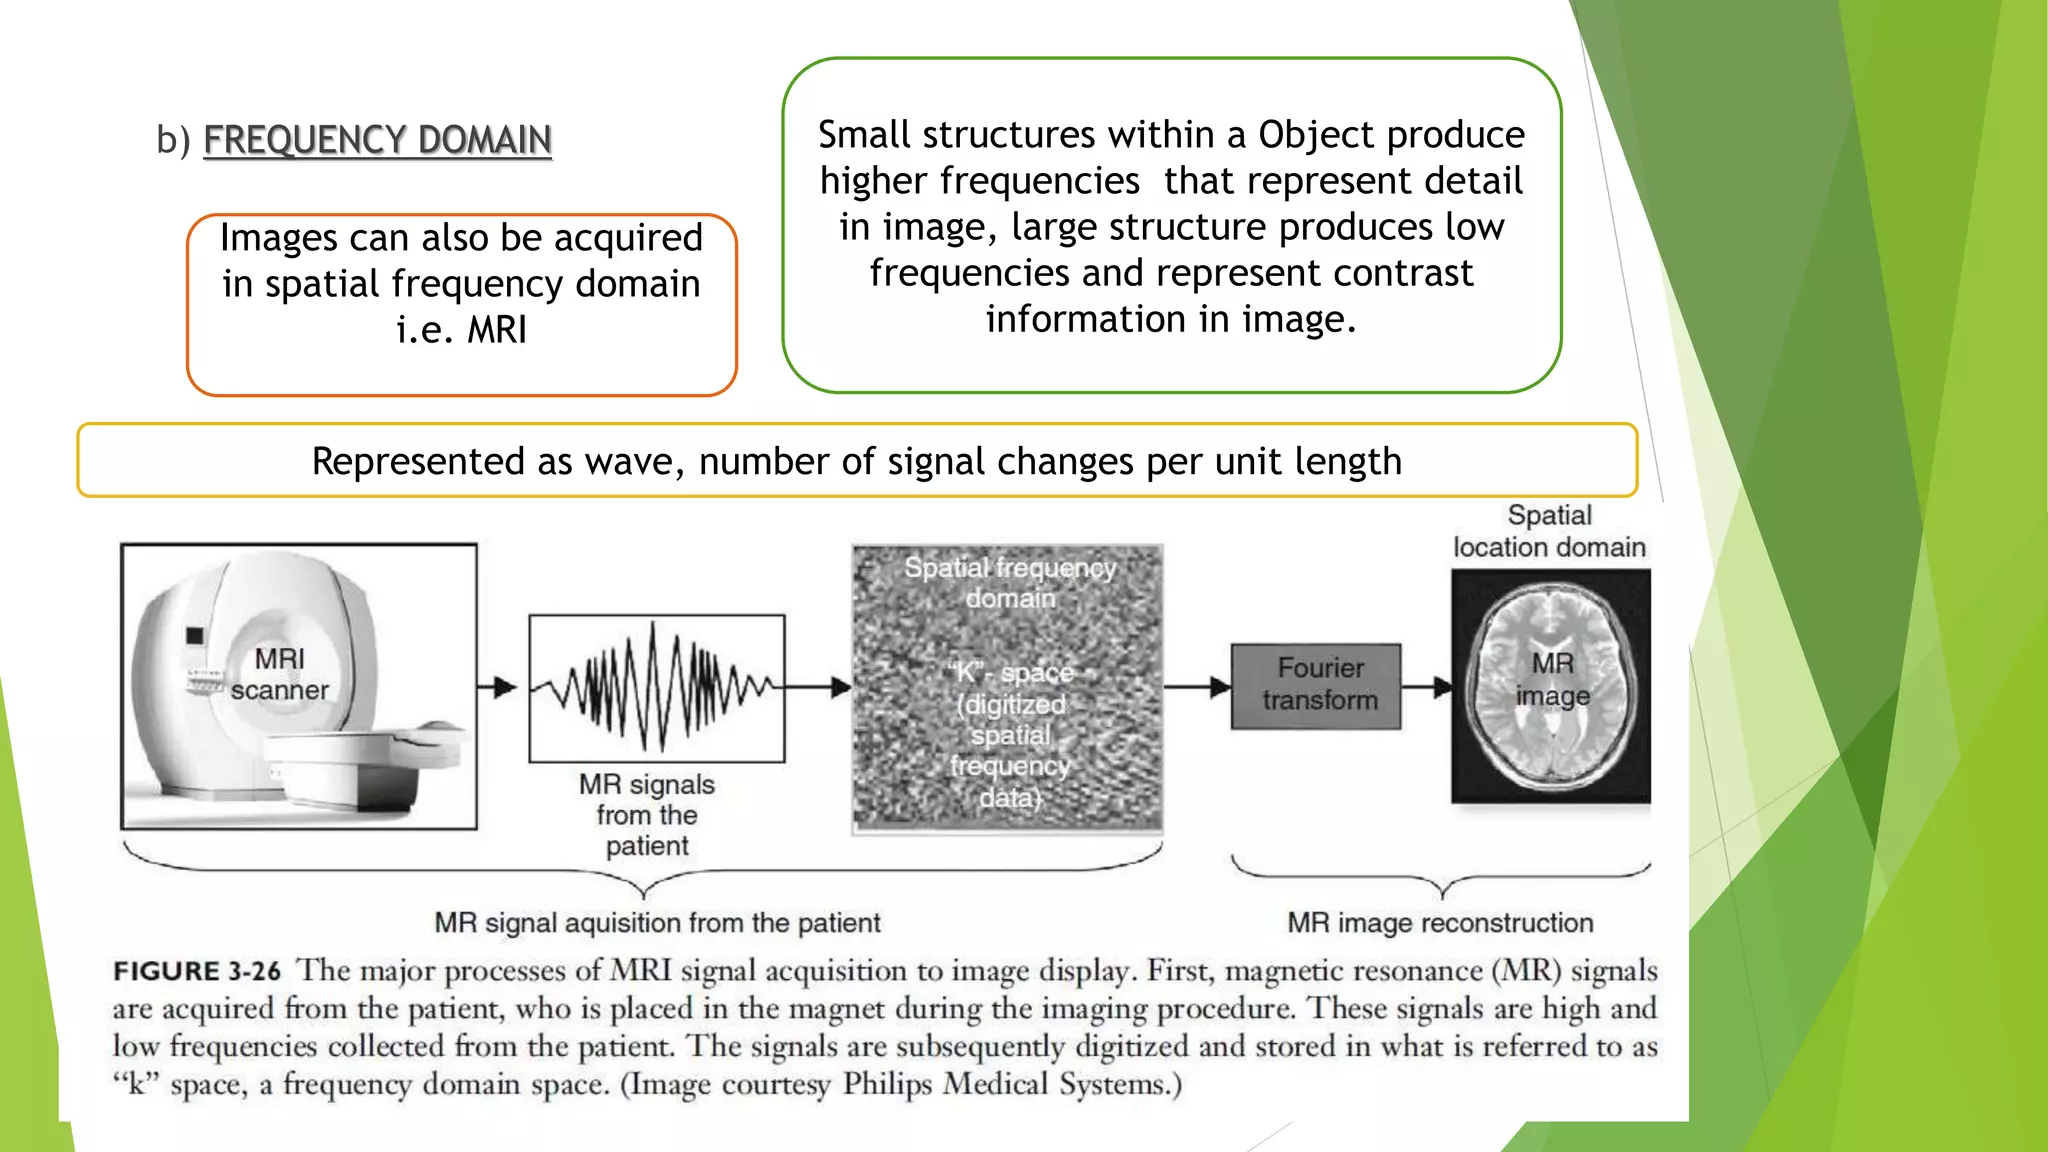
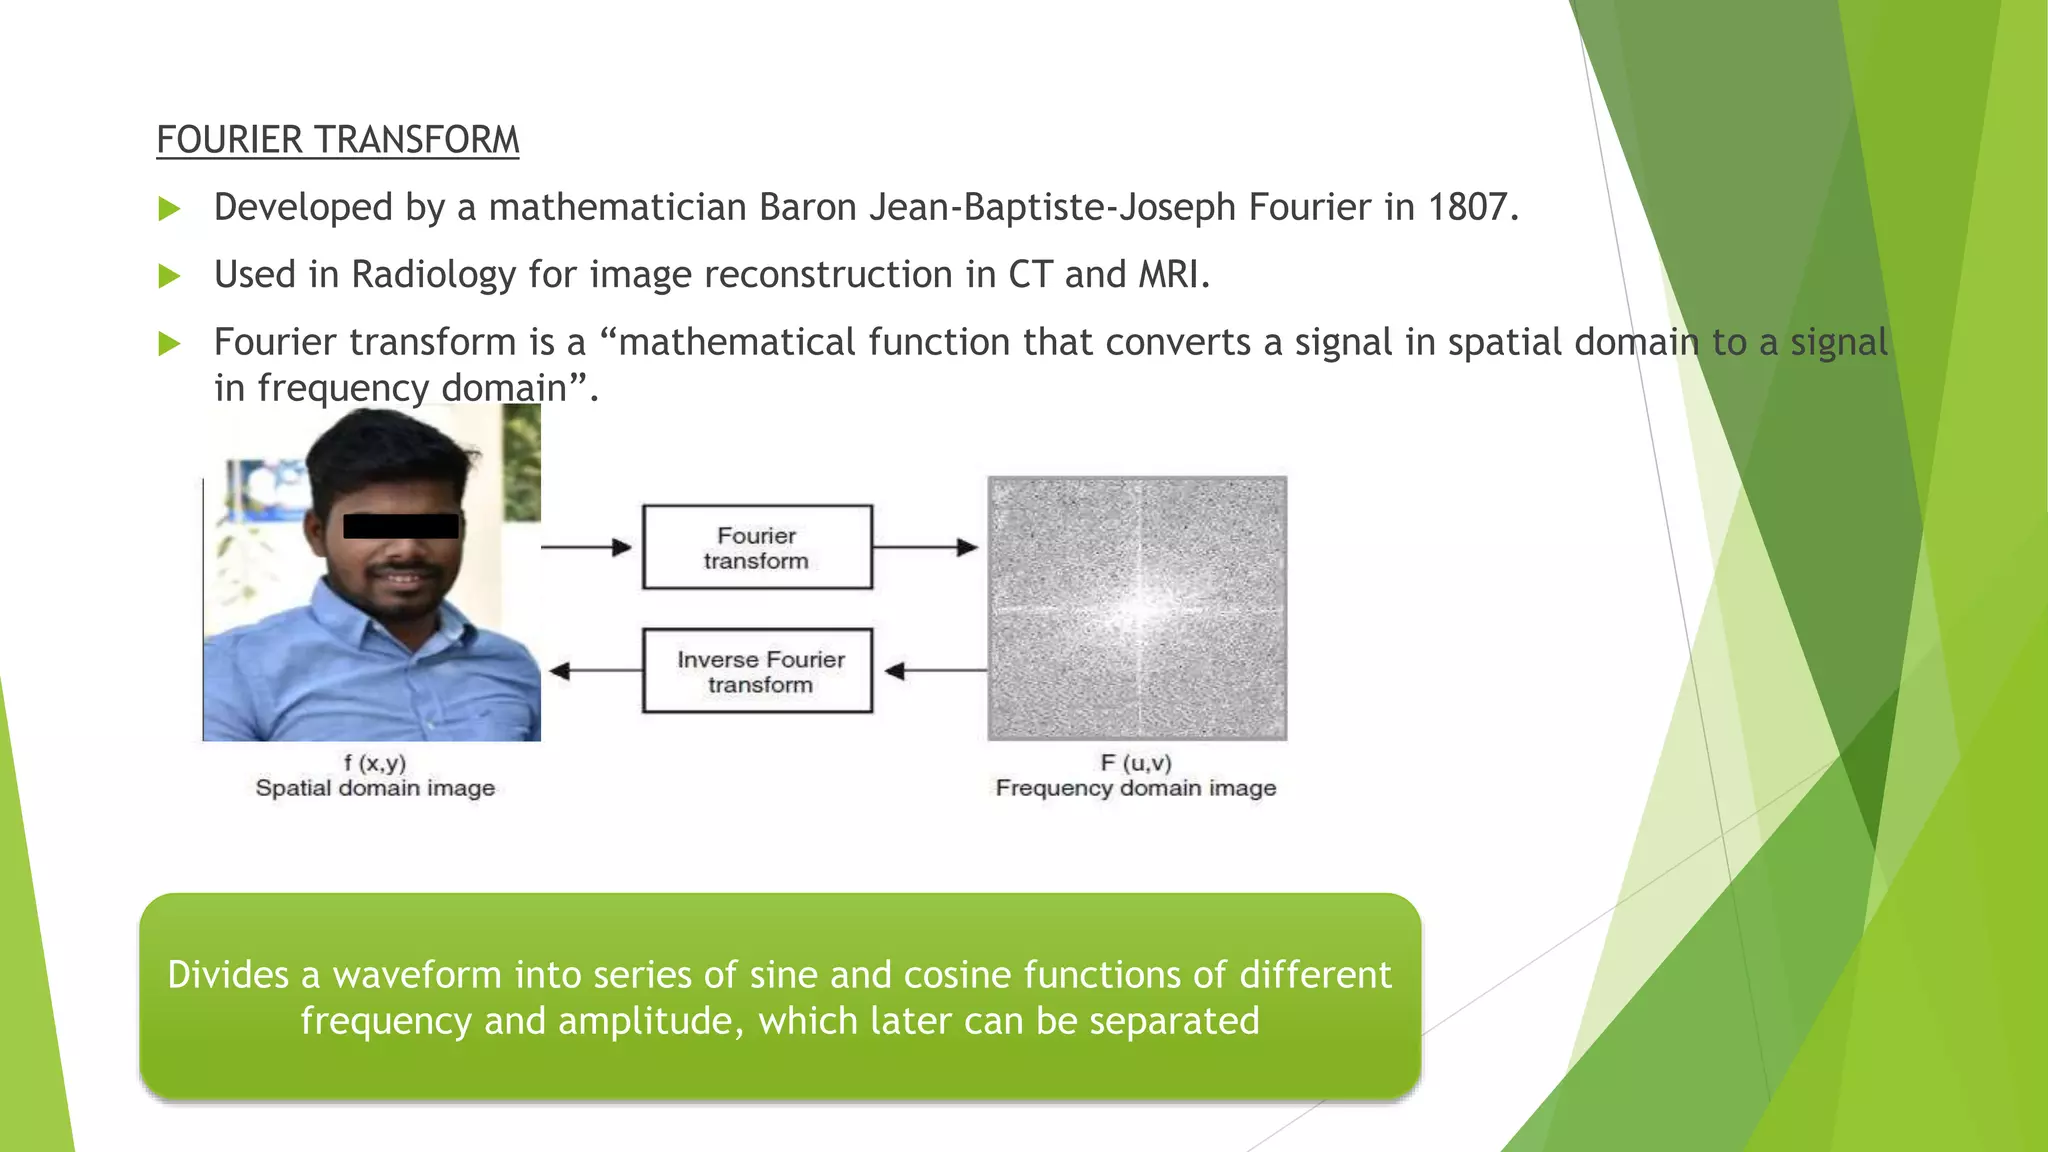
Explains spatial location and frequency domains in imaging techniques. Keywords: spatial domain, frequency domain, details and contrast.
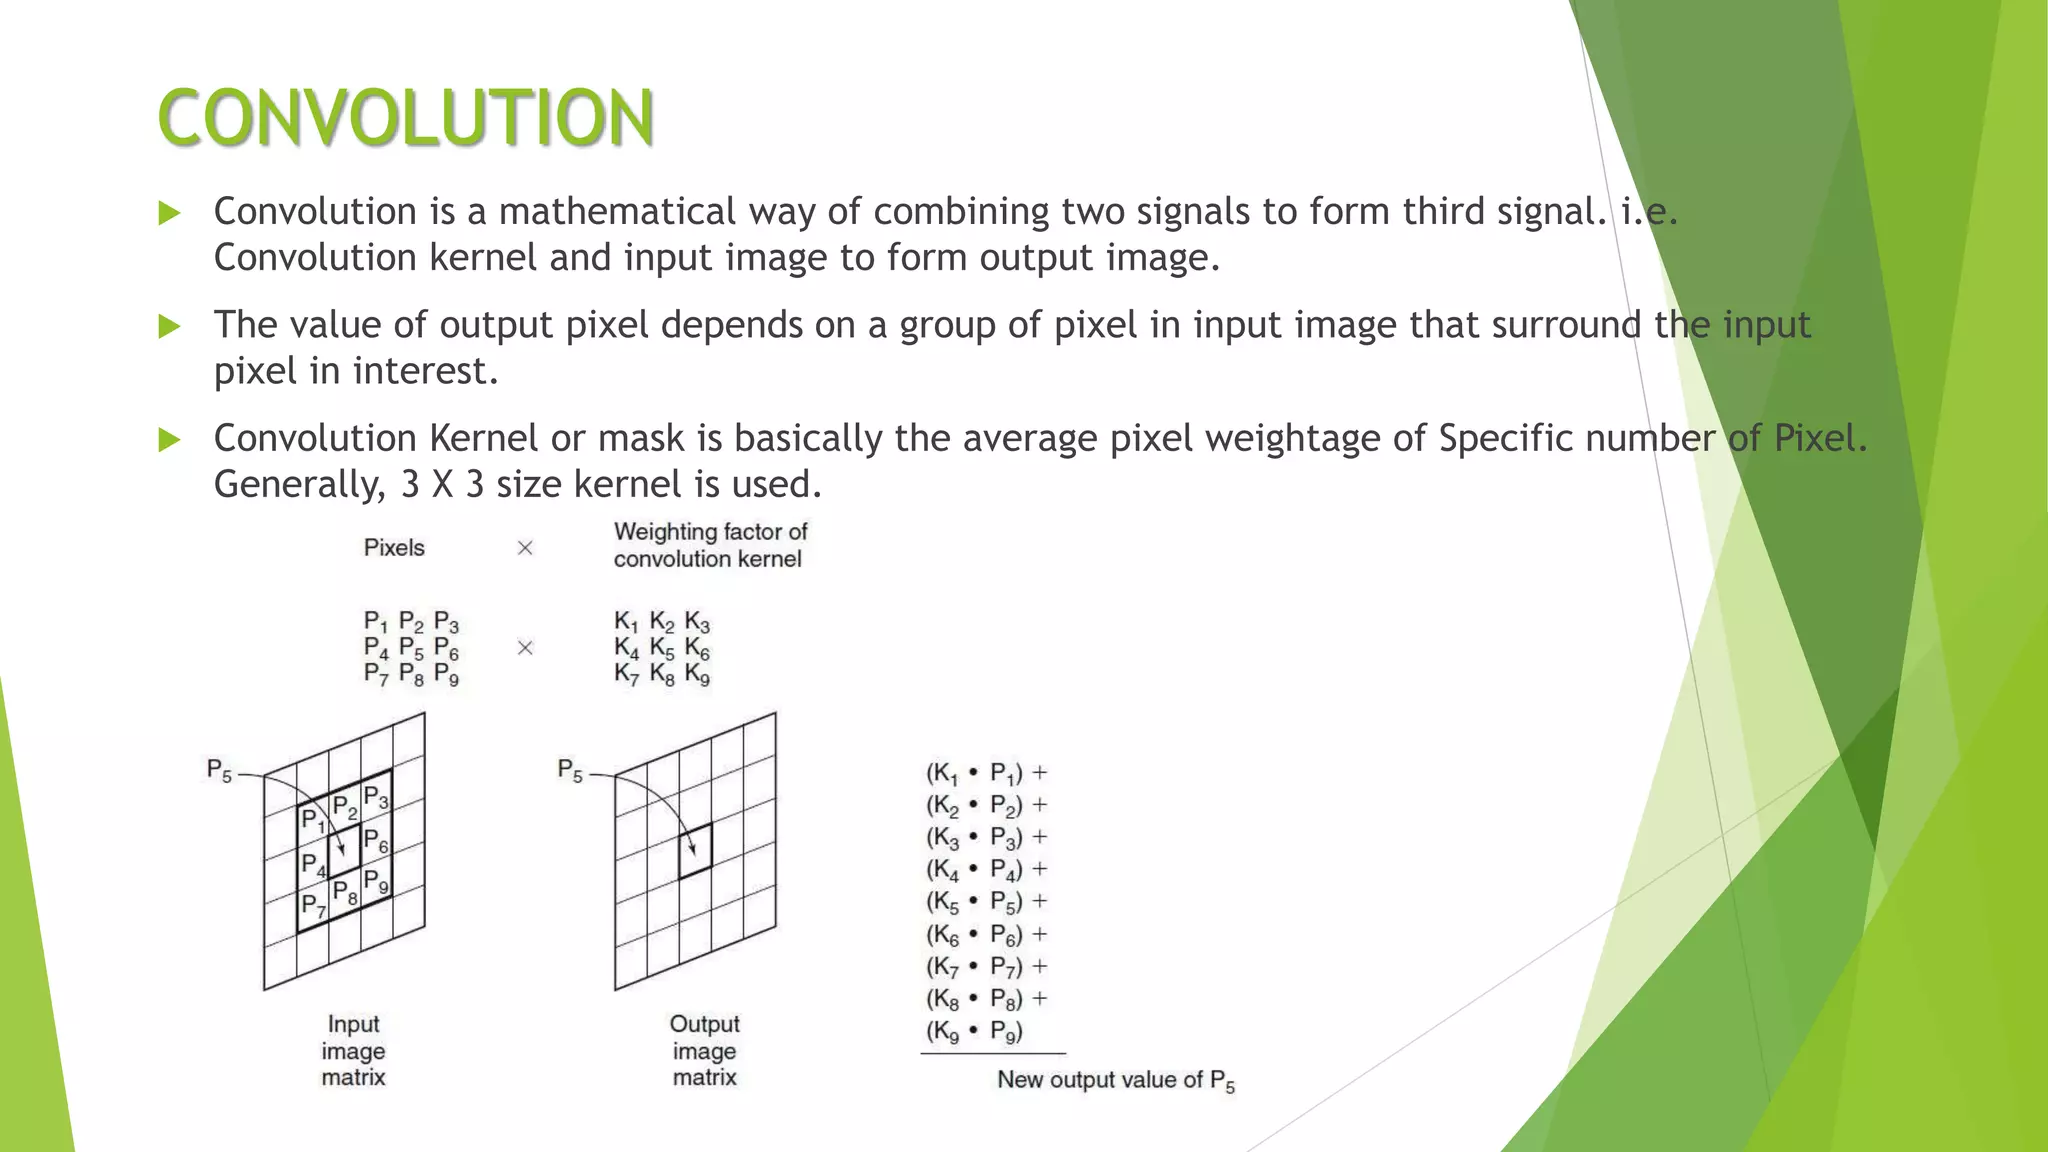
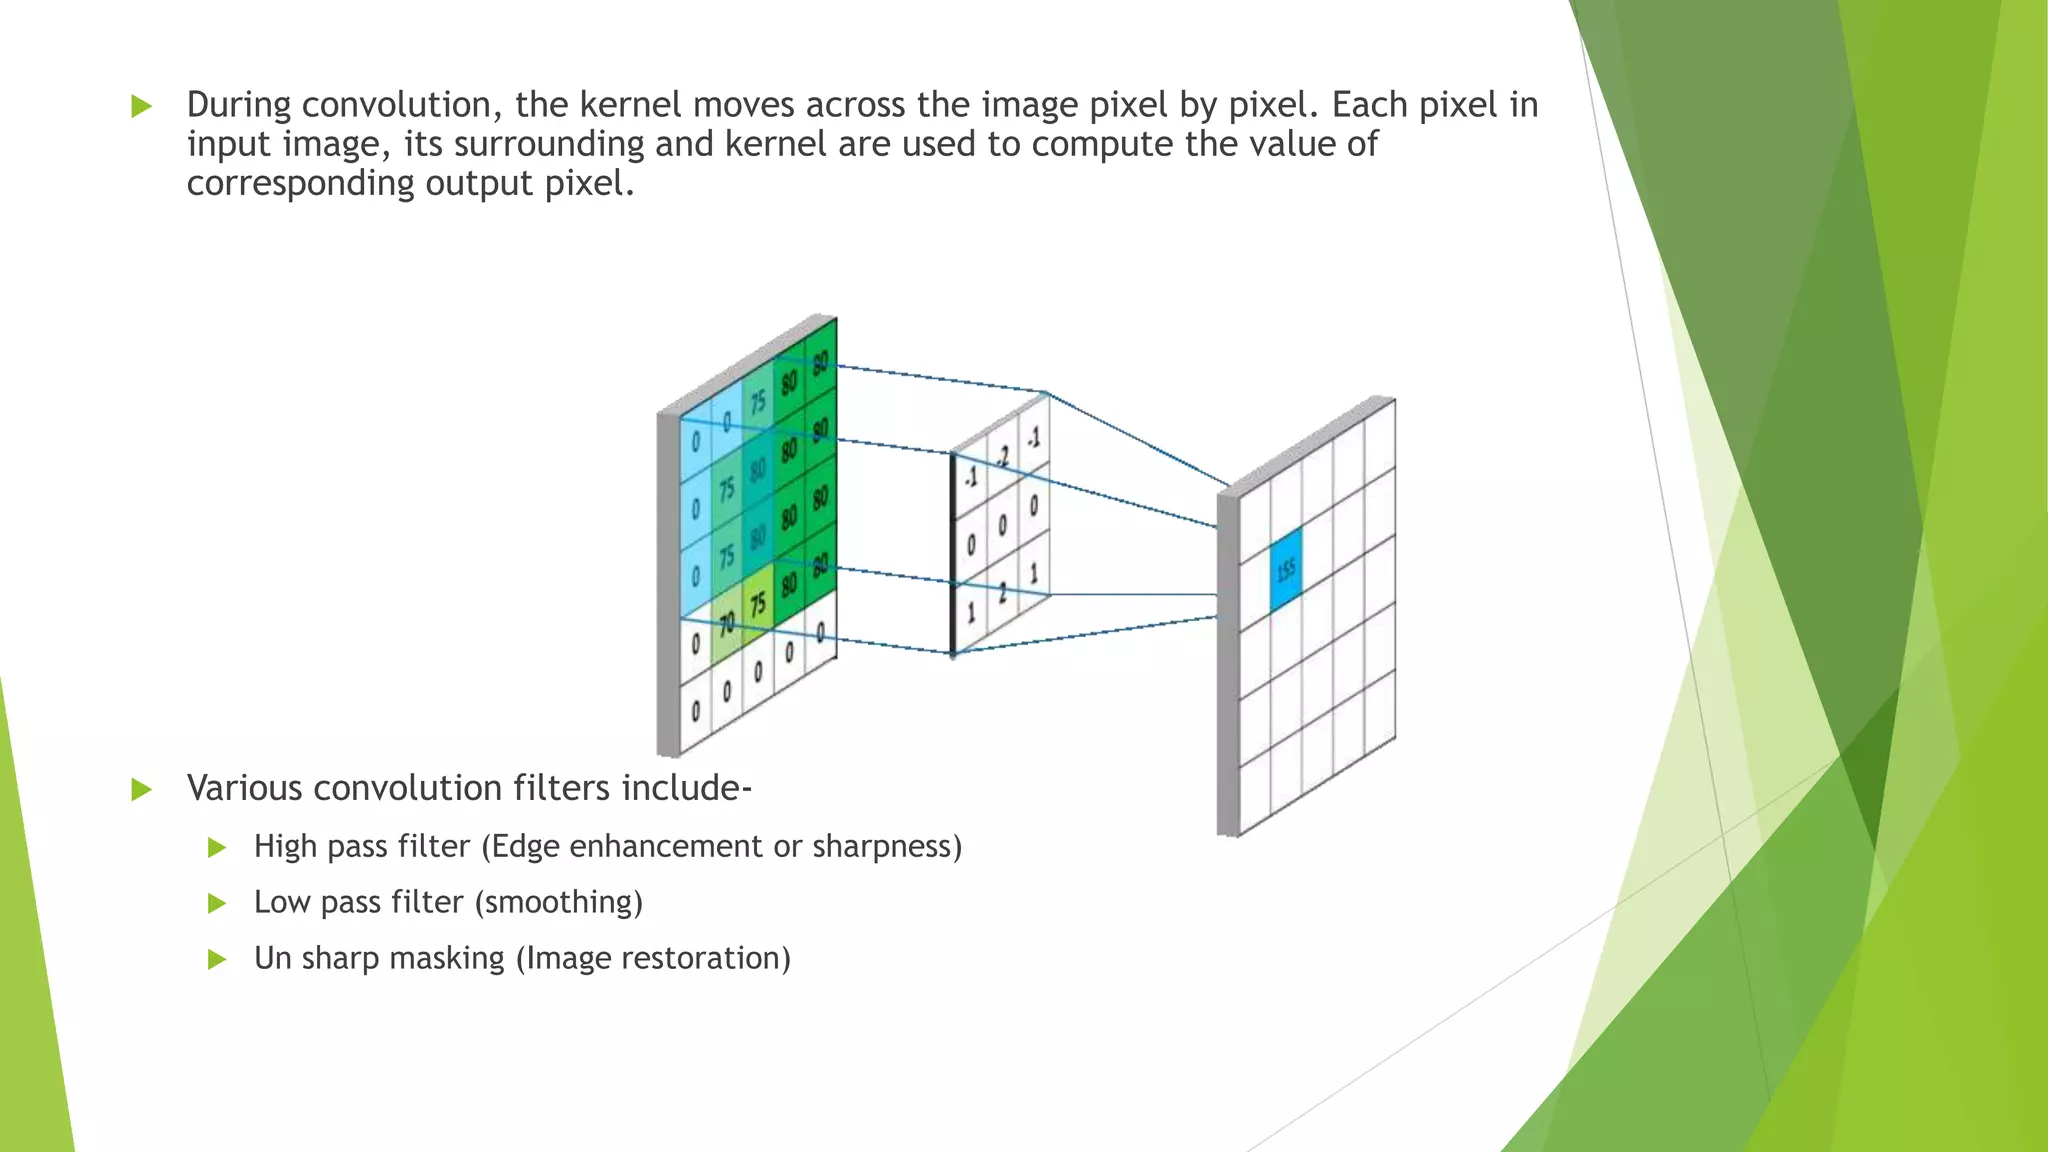
Defines convolution as image processing and discusses various filters for enhancing images. Keywords: convolution kernel, high/low pass filters.
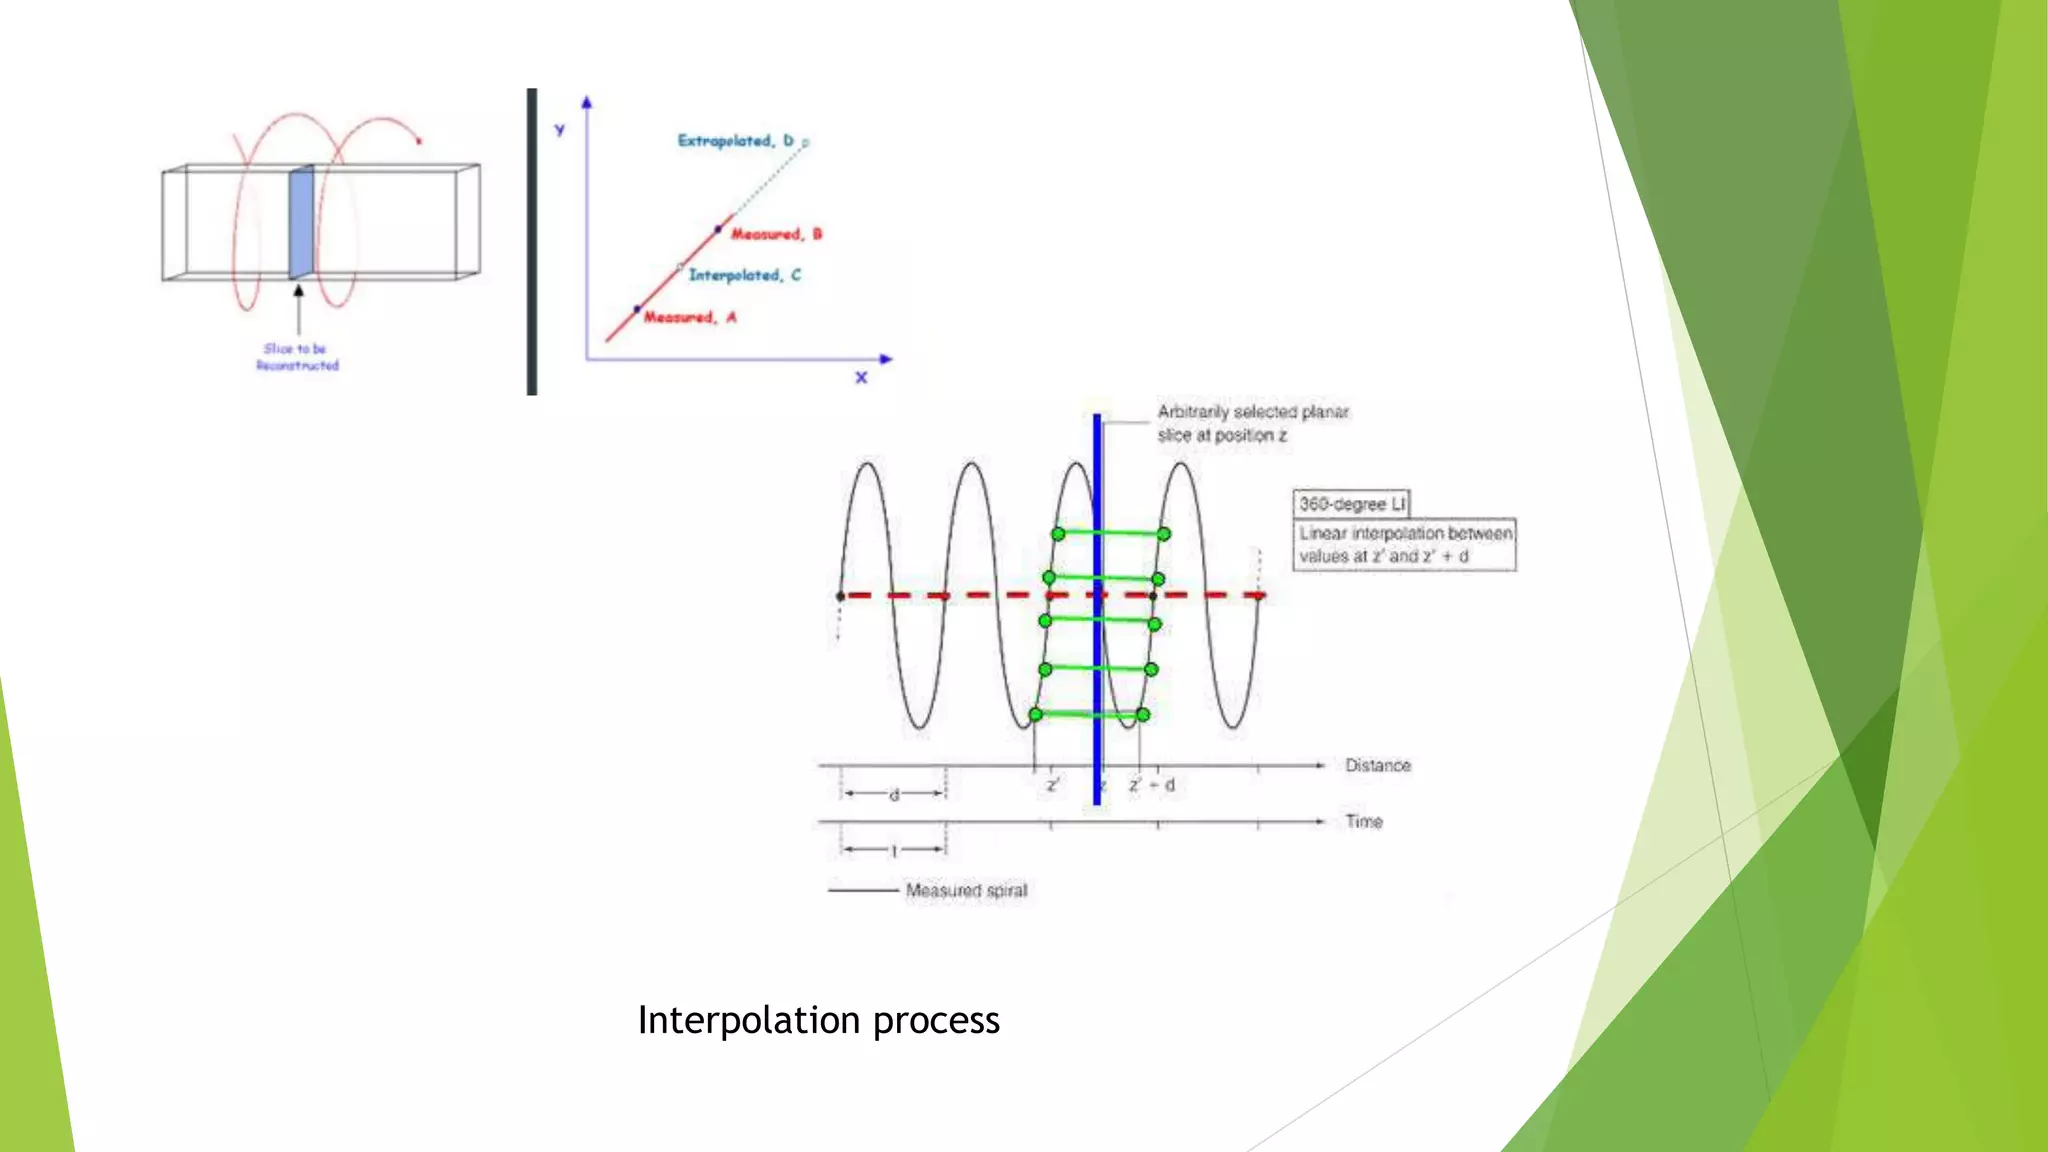
Describes interpolation for estimating values in image reconstruction and creating isotropic images. Keywords: spiral CT, transverse plane.
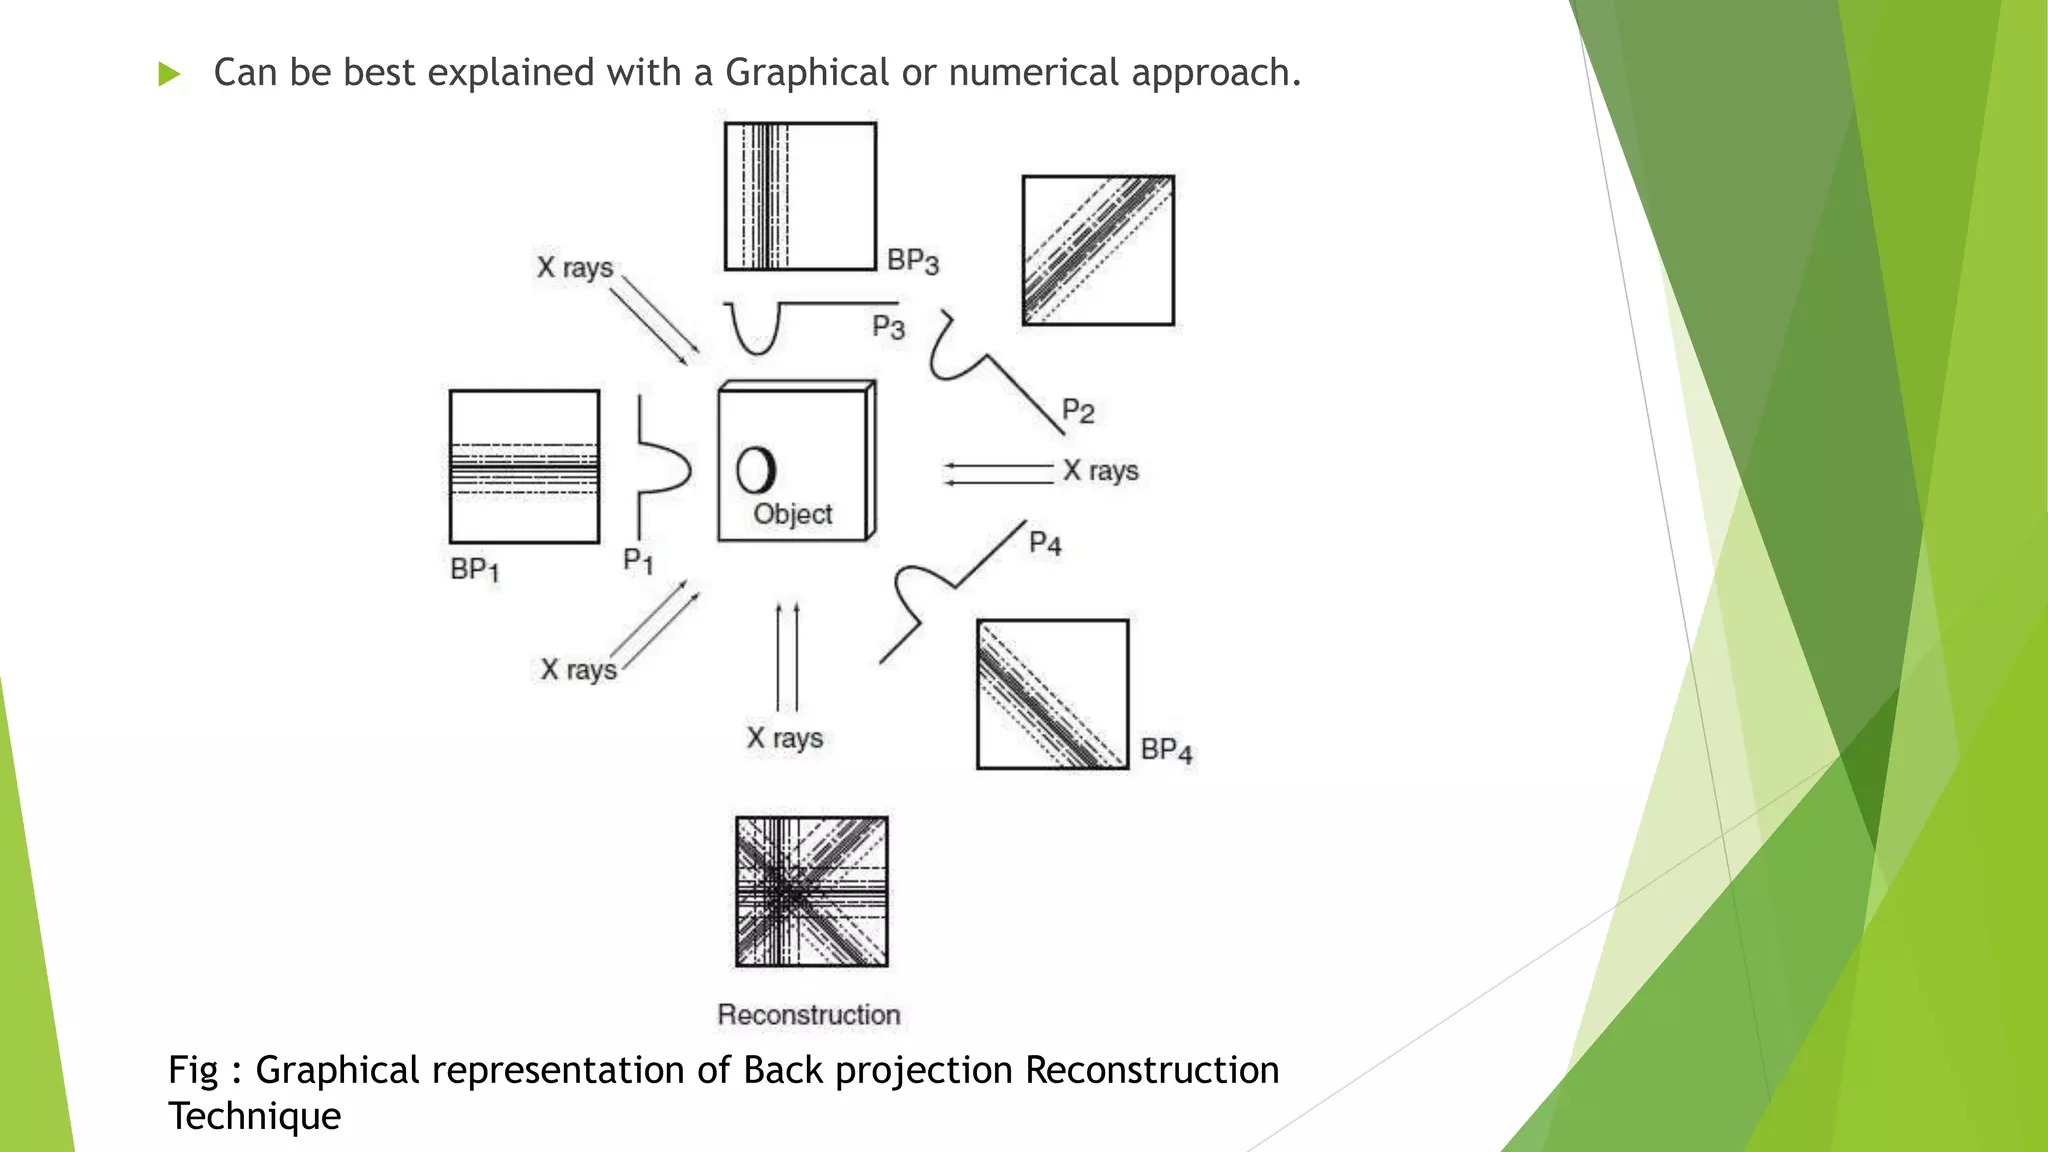
Outlines three main reconstruction techniques: back projection, iterative, and analytical methods. Keywords: back projection, blurring, limitations.
Details iterative and analytical methods for CT image reconstruction including their advantages. Keywords: iterative, filtered back projection.
Explains the filtered back projection technique to reduce blurring in images. Keywords: convolution method, logarithmic data.
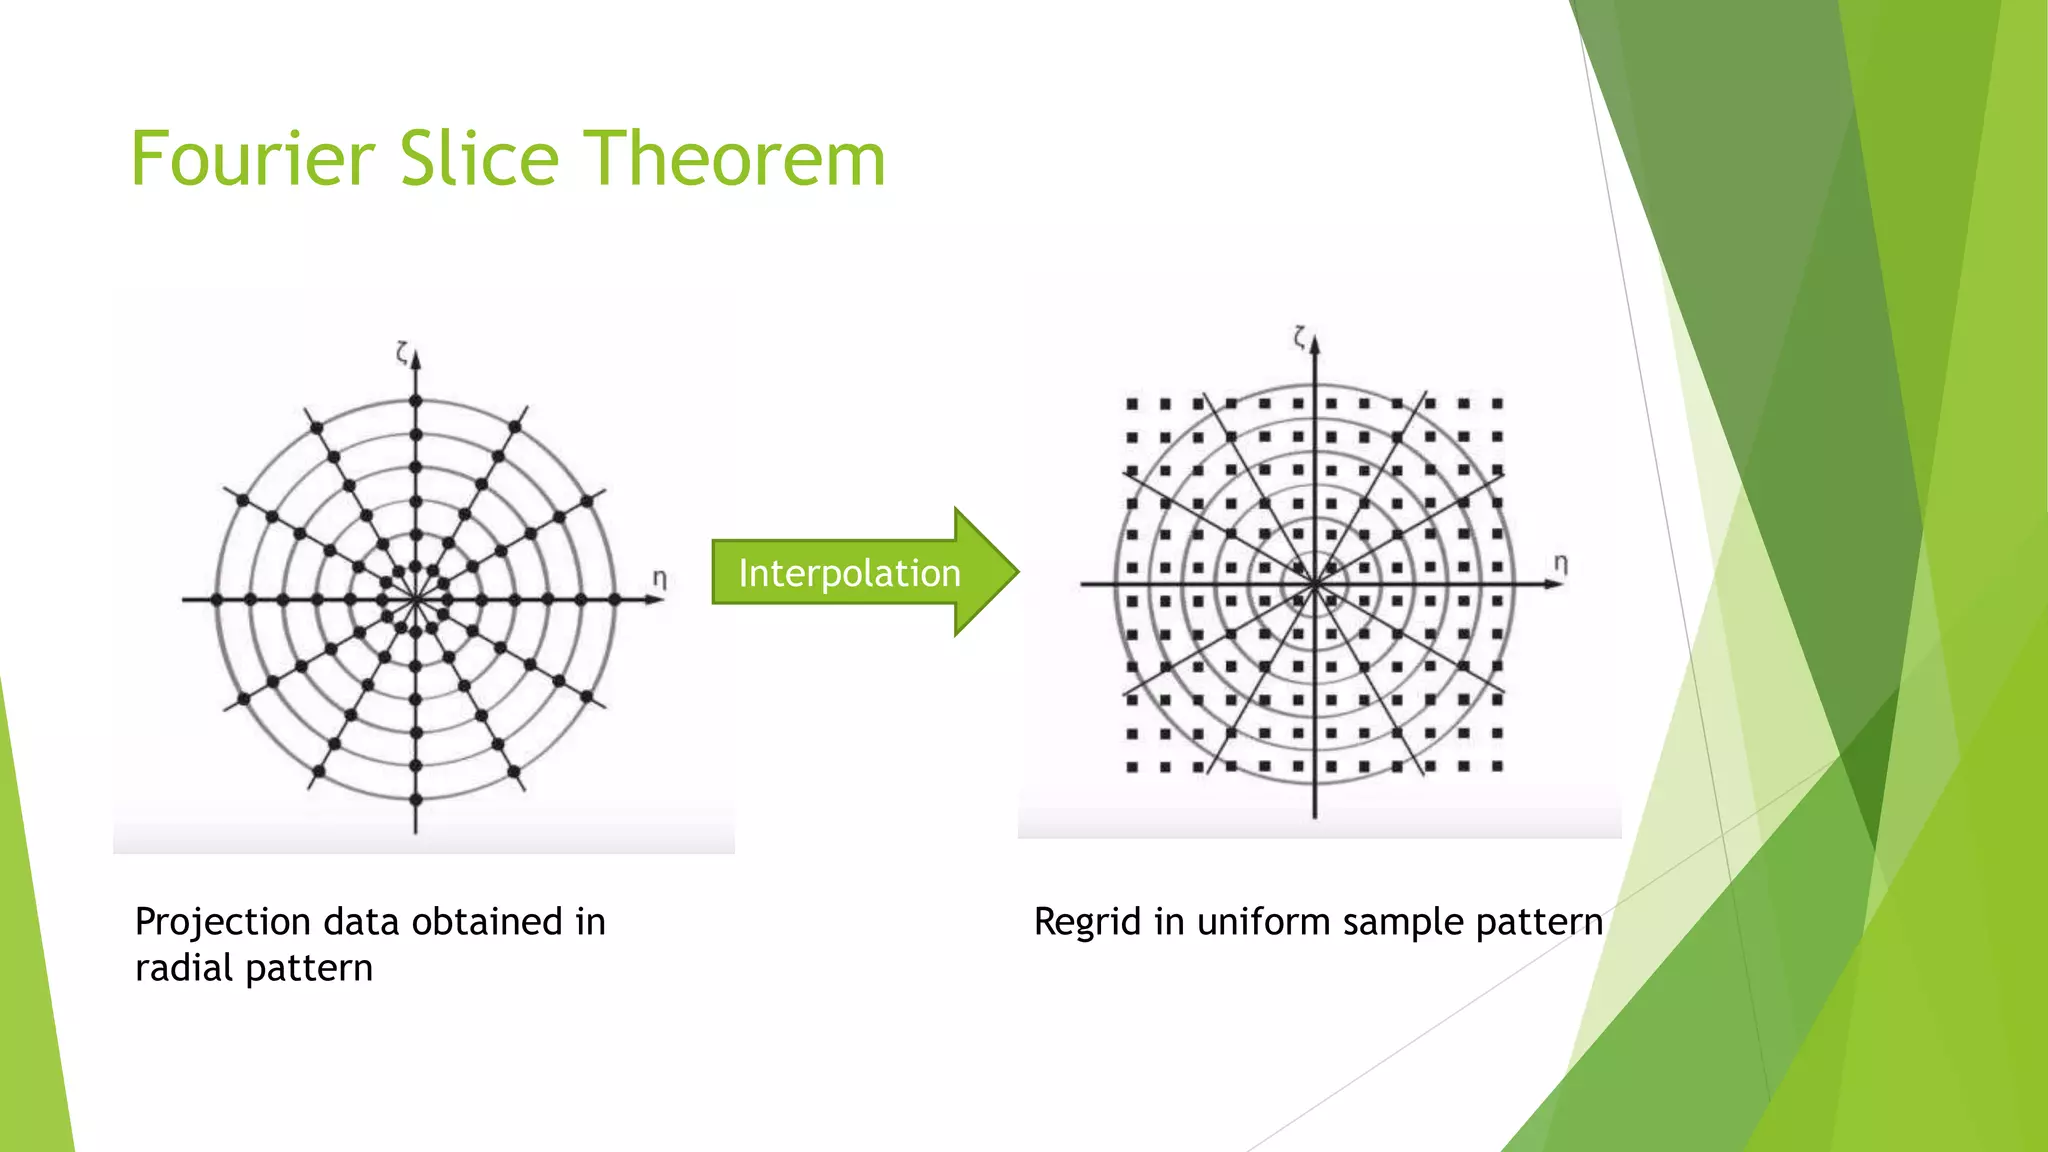
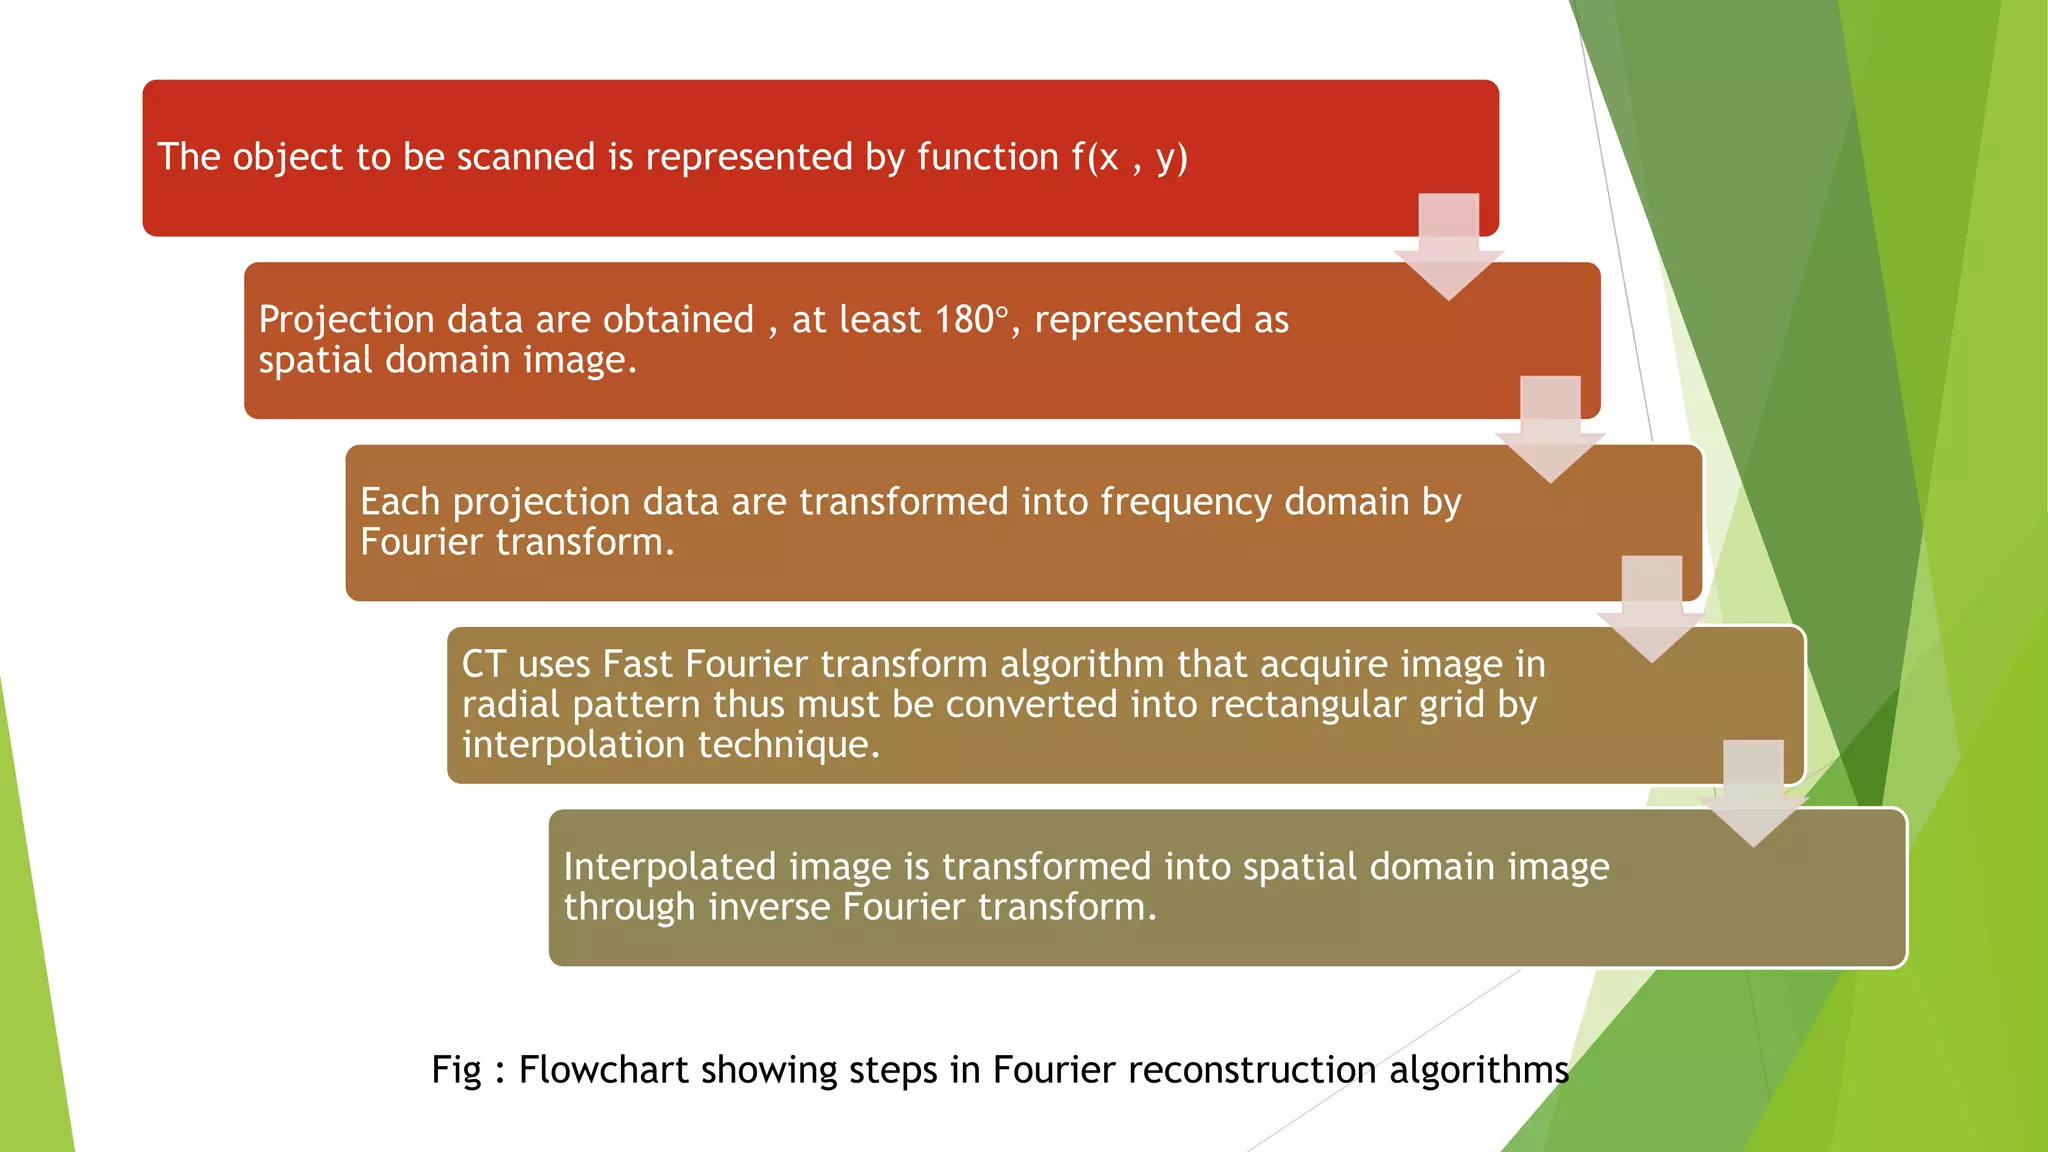
Covers Fourier slice theorem and its application in CT image reconstruction through transforms. Keywords: Fourier transform, frequency domain.
Wraps up the presentation.


