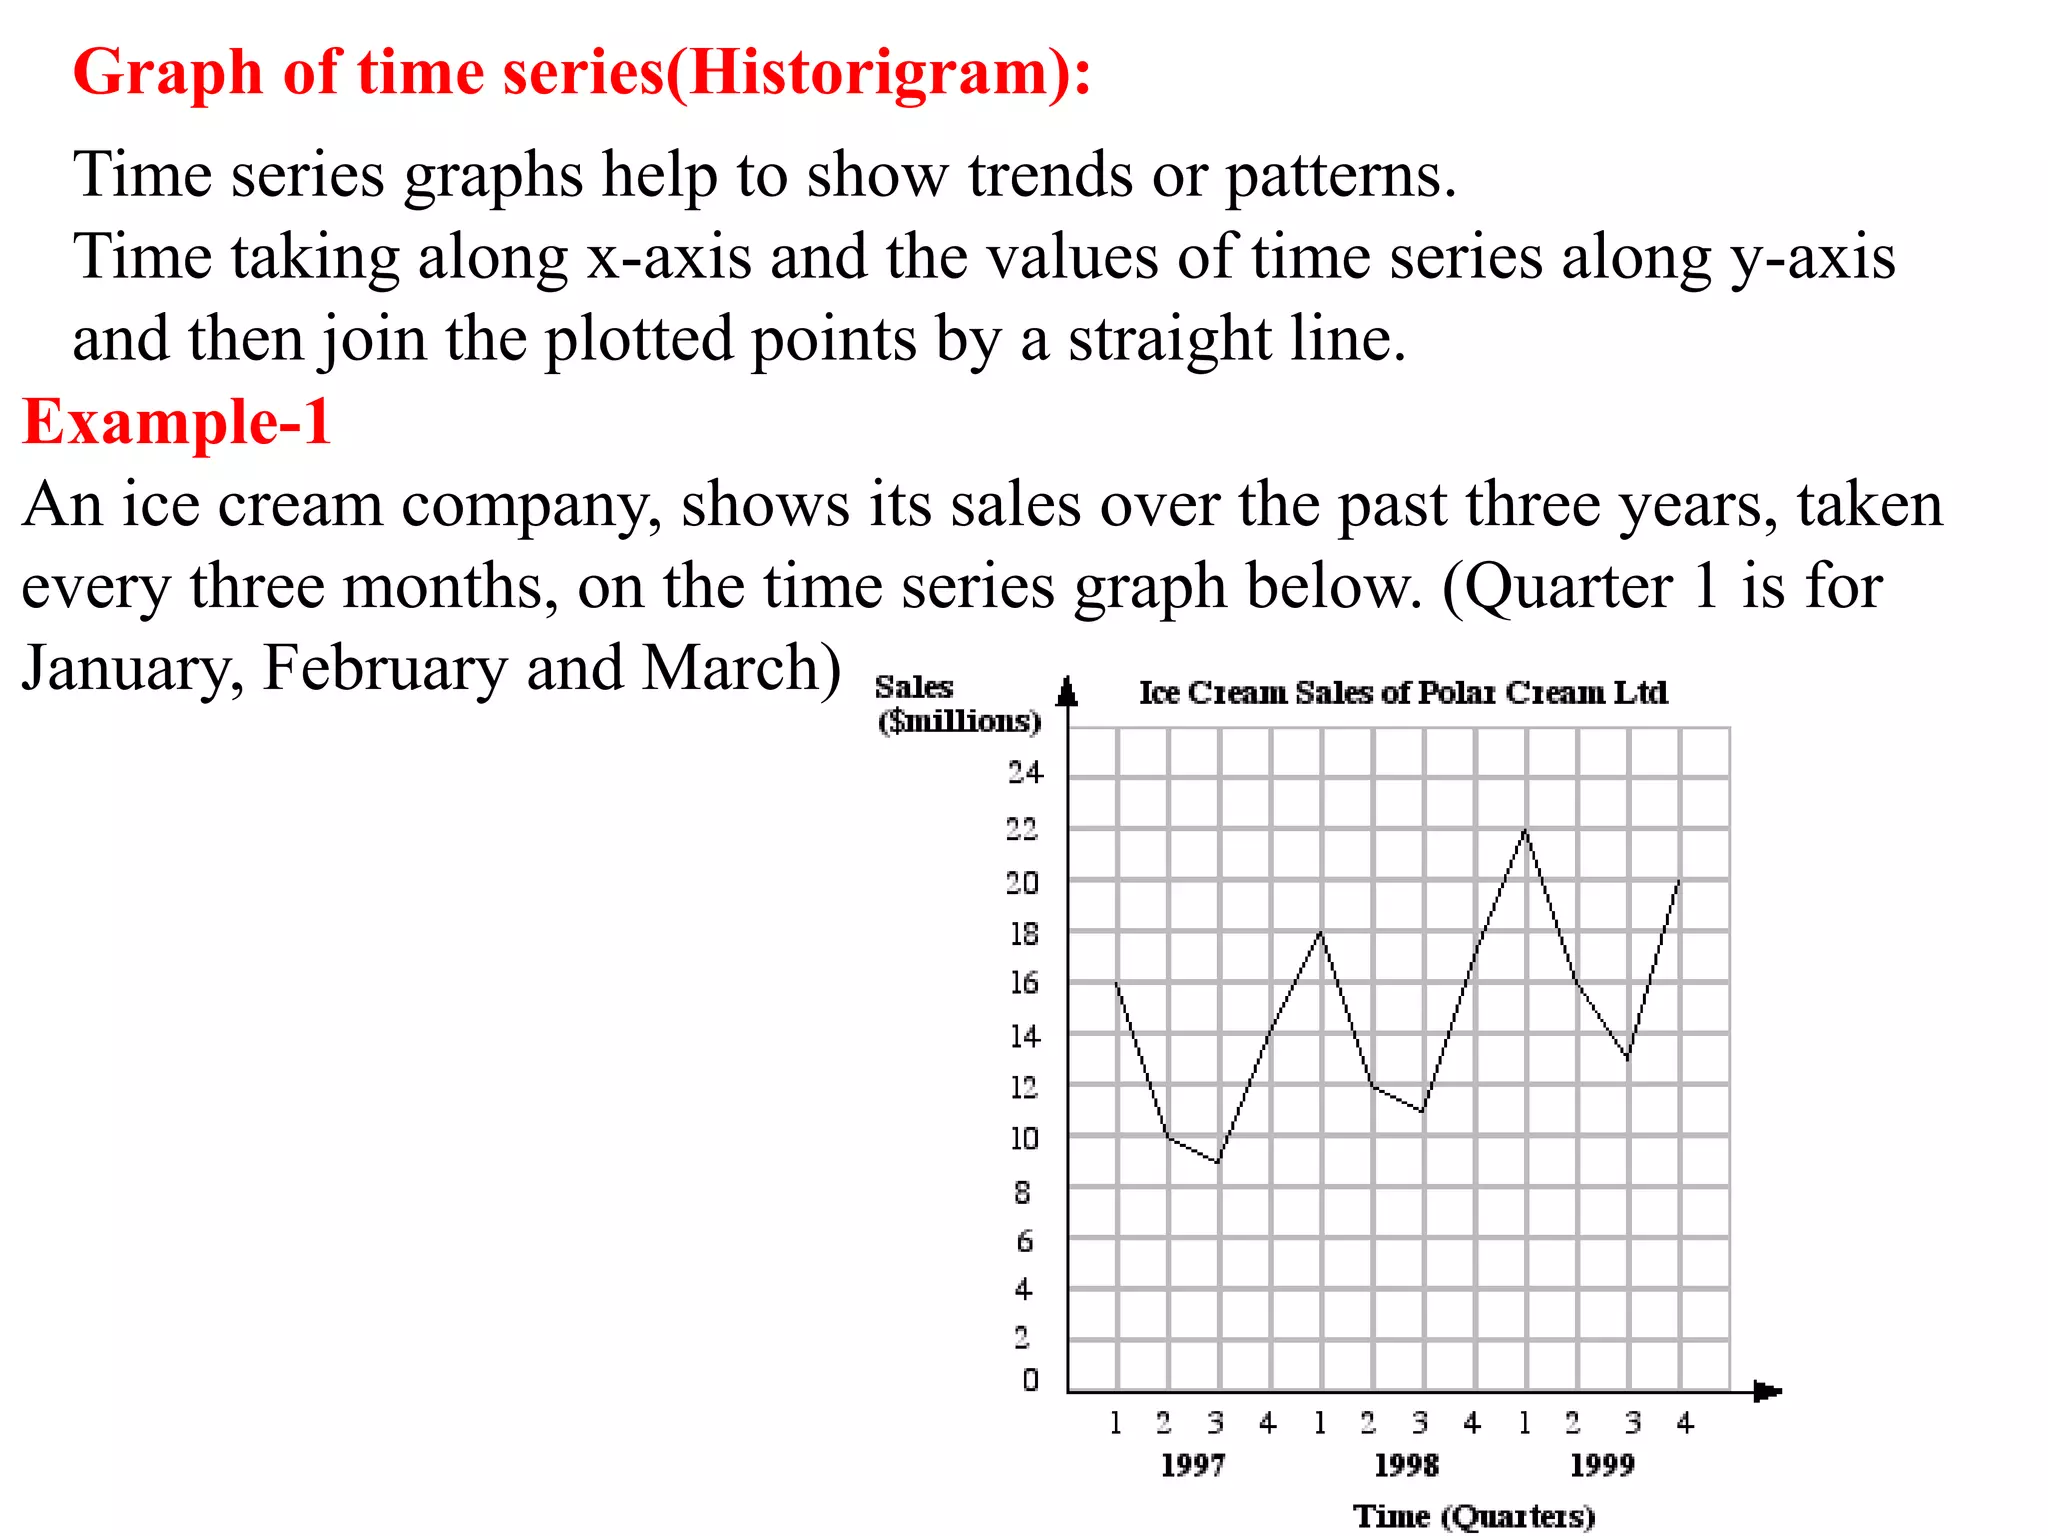
SlideShare a Scribd company logo
NADEEM UDDIN
ASSOCIATE PROFESSOR
OF STATISTICS
https://www.slideshare.net/NadeemUddin17
https://nadeemstats.wordpress.com/listofbooks/
Definition of Time Series:
Time series refers to an arrangement and
presentation of statistical data in chronological
order. The statistical data is collected over a period
of time. According to Spiegel, “A time series is a
set of observations taken at specified times, usually
at equal intervals.” There exist various forces that
affect the values of the phenomenon in a time
series. These are also the components of the time
series analysis.
Examples of time series:
1- The monthly sales of mobiles in Pakistan.
2- The daily consumption of electricity in a sugar mill.
3- The annual rainfall recorded in Karachi.
4- Pakistan’s Imports from 1980 to 2000.
5- Pakistan’s Exports from 1980 to 2000.
6- The hourly temperature recorded in a city.
7- Yearly wheat production in Punjab.
8- The festival sale.
9- The number of patients suffering from flue in winter.
10- The increase in oil price due to Gulf war.
Graph of time series(Historigram):
Time series graphs help to show trends or patterns.
Time taking along x-axis and the values of time series along y-axis
and then join the plotted points by a straight line.
Example-1
An ice cream company, shows its sales over the past three years, taken
every three months, on the time series graph below. (Quarter 1 is for
January, February and March)
Uses of Time Series:
a) The most important use of studying time series is that it
helps us to predict the future behaviour of the variable based
on past experience.
b) It is helpful for business planning as it helps in comparing the
actual current performance with the expected one.
c) From time series, we get to study the past behaviour of the
phenomenon or the variable under consideration.
d) We can compare the changes in the values of different
variables at different times or places, etc.
Components(Variations) of Time Series:
You may have heard people saying that the price of
a particular commodity has increased or decreased
with time. This commodity can be anything like
gold, silver, any eatables, petrol, diesel etc. These
types of data are the time series of data.
fluctuation in a time series is data called the
components of the time series.
Following are the various components of the time series:
Secular Trend or Simple trend or Long term movement:
Secular trend refers to the general tendency of data to increase or
decrease or stagnate over a long period of time. Time series relating to
Economic, Business, and Commerce may show an upward or increasing
tendency. Whereas, the time series relating to death rates, birth rates,
share prices, etc. may show a downward or decreasing tendency.
Seasonal variations:
Seasonal variations refer to the changes that take place due
to the rhythmic forces which operate in a regular and
periodic manner. These forces usually have the same or
most similar pattern year after year. When we record data
weekly, monthly or quarterly, we can see and calculate
seasonal variations. Thus, when a time series consists of
data only based on annual figures, there will be seen no
seasonal variations. These variations may be due to seasons,
weather conditions, habits, customs or traditions. For
example, in summers the sale of ice-cream increases.
Cyclical variations:
Cyclical variations are due to the ups and downs recurring after a
period from time to time. These are due to the business cycle and
every organization has to phase all the four phases of a business cycle
some time or the other. Prosperity or boom, recession, depression, and
recovery are the four phases of a business cycle.
Random or irregular variations:
Random variations are fluctuations which are a result of unforeseen
and unpredictable forces. These forces operate in an absolutely
random or erratic manner and do not have any definite pattern. Thus,
these variations may be due to floods, famines, earthquakes, strikes,
etc.
Signal and noise
The systematic fluctuation or regular pattern in time series is
called signal.
The unsystematic or irregular pattern is called noise.
Linear and Non-Linear Trend:
If we plot the time series values on a graph in accordance with
time t. The pattern of the data clustering shows the type of trend. If
the set of data cluster more or less round a straight line, then the
trend is linear otherwise it is non-linear (Curvilinear).
Time Series Analysis:
There are certain phenomena that define our society such
as population, birth or death rates, incomes, etc. And the
one parameter which shows a clear variation in all of these
phenomena is time. So, when we plot a collection of
readings with respect to a phenomenon against time we
call it a series in time. Furthermore, we can also categorize
the nature of the trend (upward tendency or downward
tendency) which a particular series is displaying. The study
of these various series is what we call time series analysis.
The advantages of time series analysis are as follows:
Reliability:
Time series analysis uses historical data to represent
conditions along with a progressive linear chart. The
information or data used is collected over a period of time
say, weekly, monthly, quarterly or annually. This makes the
data and forecasts reliable.
Seasonal Patterns:
As the data related to a series of periods, it helps us to
understand and predict the seasonal pattern. For example,
the time series may reveal that the demand of clothes not
only increases during festival but also during the wedding
season.
Estimation of trends:
The time series analysis helps in the identification of
trends. The data tendencies are useful to managers as they
show an increase or decrease in sales, production, share
prices, etc.
Growth:
Time series analysis helps in the measurement of financial
growth. It also helps in measuring the internal growth of an
organization that leads to economic growth.
Mathematical Model for Time Series Analysis:
Mathematically, a time series is given as
yt = f (t)
Additive Model for Time Series Analysis:
If yt is the time series value at time t. Tt, St, Ct, and Rt are the trend
value, seasonal, cyclic and random fluctuations at time t respectively.
According to the Additive Model, a time series can be expressed as
yt = Tt + St + Ct + Rt.
This model assumes that all four components of the time series act
independently of each other.
Multiplicative Model for Time Series Analysis:
The multiplicative model assumes that the various components in a
time series operate proportionately to each other. According to this
model
yt = Tt × St × Ct × Rt

More Related Content

What's hot

Time series analysis
Time series analysisTime series analysis
Time series analysis
Utkarsh Sharma
 
Time Series Analysis Ravi
Time Series Analysis RaviTime Series Analysis Ravi
Time Series Analysis Ravi
RAVINDRA KUMAR KUMAWAT
 
Time Series, Moving Average
Time Series, Moving AverageTime Series, Moving Average
Time Series, Moving Average
SOMASUNDARAM T
 
Introduction to Statistics (Part -I)
Introduction to Statistics (Part -I)Introduction to Statistics (Part -I)
Introduction to Statistics (Part -I)
YesAnalytics
 
Time Series Analysis, Components and Application in Forecasting
Time Series Analysis, Components and Application in ForecastingTime Series Analysis, Components and Application in Forecasting
Time Series Analysis, Components and Application in Forecasting
Sundar B N
 
Mba 532 2011_part_3_time_series_analysis
Mba 532 2011_part_3_time_series_analysisMba 532 2011_part_3_time_series_analysis
Mba 532 2011_part_3_time_series_analysis
Chandra Kodituwakku
 
Trend analysis and time Series Analysis
Trend analysis and time Series Analysis Trend analysis and time Series Analysis
Trend analysis and time Series Analysis
Amna Kouser
 
Skewness & Kurtosis
Skewness & KurtosisSkewness & Kurtosis
Skewness & Kurtosis
Navin Bafna
 
Analyzing and forecasting time series data ppt @ bec doms
Analyzing and forecasting time series data ppt @ bec domsAnalyzing and forecasting time series data ppt @ bec doms
Analyzing and forecasting time series data ppt @ bec doms
Babasab Patil
 
Meaning and Importance of Statistics
Meaning and Importance of StatisticsMeaning and Importance of Statistics
Meaning and Importance of Statistics
Flipped Channel
 
Time series analysis in Stata
Time series analysis in StataTime series analysis in Stata
Time series analysis in Stata
shahisec1
 
Regression analysis
Regression analysisRegression analysis
Regression analysis
Teachers Mitraa
 
Time series forecasting
Time series forecastingTime series forecasting
Time series forecasting
Firas Kastantin
 
Timeseries forecasting
Timeseries forecastingTimeseries forecasting
Timeseries forecasting
Venkata Reddy Konasani
 
Introduction to Statistics
Introduction to StatisticsIntroduction to Statistics
Introduction to Statistics
Anjan Mahanta
 
Time Series Analysis/ Forecasting
Time Series Analysis/ Forecasting  Time Series Analysis/ Forecasting
Time Series Analysis/ Forecasting
Samudra Kanankearachchi
 
Statistics: Chapter One
Statistics: Chapter OneStatistics: Chapter One
Statistics: Chapter One
Saed Jama
 
Time Series Analysis - Modeling and Forecasting
Time Series Analysis - Modeling and ForecastingTime Series Analysis - Modeling and Forecasting
Time Series Analysis - Modeling and Forecasting
Maruthi Nataraj K
 
Eco Basic 1 8
Eco Basic 1 8Eco Basic 1 8
Eco Basic 1 8
kit11229
 
Analysis of Time Series
Analysis of Time SeriesAnalysis of Time Series
Analysis of Time Series
Manu Antony
 

What's hot (20)

Time series analysis
Time series analysisTime series analysis
Time series analysis
 
Time Series Analysis Ravi
Time Series Analysis RaviTime Series Analysis Ravi
Time Series Analysis Ravi
 
Time Series, Moving Average
Time Series, Moving AverageTime Series, Moving Average
Time Series, Moving Average
 
Introduction to Statistics (Part -I)
Introduction to Statistics (Part -I)Introduction to Statistics (Part -I)
Introduction to Statistics (Part -I)
 
Time Series Analysis, Components and Application in Forecasting
Time Series Analysis, Components and Application in ForecastingTime Series Analysis, Components and Application in Forecasting
Time Series Analysis, Components and Application in Forecasting
 
Mba 532 2011_part_3_time_series_analysis
Mba 532 2011_part_3_time_series_analysisMba 532 2011_part_3_time_series_analysis
Mba 532 2011_part_3_time_series_analysis
 
Trend analysis and time Series Analysis
Trend analysis and time Series Analysis Trend analysis and time Series Analysis
Trend analysis and time Series Analysis
 
Skewness & Kurtosis
Skewness & KurtosisSkewness & Kurtosis
Skewness & Kurtosis
 
Analyzing and forecasting time series data ppt @ bec doms
Analyzing and forecasting time series data ppt @ bec domsAnalyzing and forecasting time series data ppt @ bec doms
Analyzing and forecasting time series data ppt @ bec doms
 
Meaning and Importance of Statistics
Meaning and Importance of StatisticsMeaning and Importance of Statistics
Meaning and Importance of Statistics
 
Time series analysis in Stata
Time series analysis in StataTime series analysis in Stata
Time series analysis in Stata
 
Regression analysis
Regression analysisRegression analysis
Regression analysis
 
Time series forecasting
Time series forecastingTime series forecasting
Time series forecasting
 
Timeseries forecasting
Timeseries forecastingTimeseries forecasting
Timeseries forecasting
 
Introduction to Statistics
Introduction to StatisticsIntroduction to Statistics
Introduction to Statistics
 
Time Series Analysis/ Forecasting
Time Series Analysis/ Forecasting  Time Series Analysis/ Forecasting
Time Series Analysis/ Forecasting
 
Statistics: Chapter One
Statistics: Chapter OneStatistics: Chapter One
Statistics: Chapter One
 
Time Series Analysis - Modeling and Forecasting
Time Series Analysis - Modeling and ForecastingTime Series Analysis - Modeling and Forecasting
Time Series Analysis - Modeling and Forecasting
 
Eco Basic 1 8
Eco Basic 1 8Eco Basic 1 8
Eco Basic 1 8
 
Analysis of Time Series
Analysis of Time SeriesAnalysis of Time Series
Analysis of Time Series
 

Similar to Time series

Trend analysis - Lecture Notes
Trend analysis - Lecture NotesTrend analysis - Lecture Notes
Trend analysis - Lecture Notes
Dr. Nirav Vyas
 
Time series
Time seriesTime series
Time series
Hasnain Baber
 
Time series
Time seriesTime series
Time series
JamshidRaqi
 
TIME SERIES
TIME SERIESTIME SERIES
TIME SERIES
AryanMohanty4
 
Trend and Seasonal Components / abshor.marantika / Dwi Puspita Rini
Trend and Seasonal Components / abshor.marantika / Dwi Puspita RiniTrend and Seasonal Components / abshor.marantika / Dwi Puspita Rini
Trend and Seasonal Components / abshor.marantika / Dwi Puspita Rini
Dwi Puspita Rini
 
Time Series Analysis (Business Statistics Tutorial )
Time Series Analysis (Business Statistics Tutorial )Time Series Analysis (Business Statistics Tutorial )
Time Series Analysis (Business Statistics Tutorial )
Mahmudul Hasan Nakib
 
time series.pdf
time series.pdftime series.pdf
time series.pdf
college
 
Time Series Analysis.pptx
Time Series Analysis.pptxTime Series Analysis.pptx
Time Series Analysis.pptx
Mr M Alam
 
Time series analysis
Time series analysisTime series analysis
Time series analysis
Parveen Vashisth
 
Demand forecasting by time series analysis
Demand forecasting by time series analysisDemand forecasting by time series analysis
Demand forecasting by time series analysis
Sunny Gandhi
 
Time series anlaysis.pptx
Time series anlaysis.pptxTime series anlaysis.pptx
Time series anlaysis.pptx
tripathineeharika
 
Data Science - Part X - Time Series Forecasting
Data Science - Part X - Time Series ForecastingData Science - Part X - Time Series Forecasting
Data Science - Part X - Time Series Forecasting
Derek Kane
 
Presentation 2
Presentation 2Presentation 2
Presentation 2
uliana8
 
What Are Data Trends and Patterns, and How Do They Impact Business Decisions?
What Are Data Trends and Patterns, and How Do They Impact Business Decisions?What Are Data Trends and Patterns, and How Do They Impact Business Decisions?
What Are Data Trends and Patterns, and How Do They Impact Business Decisions?
Smarten Augmented Analytics
 
Time series
Time seriesTime series
Time series
Muhammad Umar
 
03.time series presentation
03.time series presentation03.time series presentation
03.time series presentation
Dr. Hari Arora
 
Module 3 - Time Series.pptx
Module 3 - Time Series.pptxModule 3 - Time Series.pptx
Module 3 - Time Series.pptx
nikshaikh786
 
Time serial forcasting
Time serial forcastingTime serial forcasting
Time serial forcasting
omaraldabash
 
Time Series
Time SeriesTime Series
Time Series
yush313
 
Chapter 4 time series
Chapter 4     time seriesChapter 4     time series
Chapter 4 time series
swati sharma
 

Similar to Time series (20)

Trend analysis - Lecture Notes
Trend analysis - Lecture NotesTrend analysis - Lecture Notes
Trend analysis - Lecture Notes
 
Time series
Time seriesTime series
Time series
 
Time series
Time seriesTime series
Time series
 
TIME SERIES
TIME SERIESTIME SERIES
TIME SERIES
 
Trend and Seasonal Components / abshor.marantika / Dwi Puspita Rini
Trend and Seasonal Components / abshor.marantika / Dwi Puspita RiniTrend and Seasonal Components / abshor.marantika / Dwi Puspita Rini
Trend and Seasonal Components / abshor.marantika / Dwi Puspita Rini
 
Time Series Analysis (Business Statistics Tutorial )
Time Series Analysis (Business Statistics Tutorial )Time Series Analysis (Business Statistics Tutorial )
Time Series Analysis (Business Statistics Tutorial )
 
time series.pdf
time series.pdftime series.pdf
time series.pdf
 
Time Series Analysis.pptx
Time Series Analysis.pptxTime Series Analysis.pptx
Time Series Analysis.pptx
 
Time series analysis
Time series analysisTime series analysis
Time series analysis
 
Demand forecasting by time series analysis
Demand forecasting by time series analysisDemand forecasting by time series analysis
Demand forecasting by time series analysis
 
Time series anlaysis.pptx
Time series anlaysis.pptxTime series anlaysis.pptx
Time series anlaysis.pptx
 
Data Science - Part X - Time Series Forecasting
Data Science - Part X - Time Series ForecastingData Science - Part X - Time Series Forecasting
Data Science - Part X - Time Series Forecasting
 
Presentation 2
Presentation 2Presentation 2
Presentation 2
 
What Are Data Trends and Patterns, and How Do They Impact Business Decisions?
What Are Data Trends and Patterns, and How Do They Impact Business Decisions?What Are Data Trends and Patterns, and How Do They Impact Business Decisions?
What Are Data Trends and Patterns, and How Do They Impact Business Decisions?
 
Time series
Time seriesTime series
Time series
 
03.time series presentation
03.time series presentation03.time series presentation
03.time series presentation
 
Module 3 - Time Series.pptx
Module 3 - Time Series.pptxModule 3 - Time Series.pptx
Module 3 - Time Series.pptx
 
Time serial forcasting
Time serial forcastingTime serial forcasting
Time serial forcasting
 
Time Series
Time SeriesTime Series
Time Series
 
Chapter 4 time series
Chapter 4     time seriesChapter 4     time series
Chapter 4 time series
 

More from Nadeem Uddin

A corporation has 15 salesmen.pdf
A corporation has 15 salesmen.pdfA corporation has 15 salesmen.pdf
A corporation has 15 salesmen.pdf
Nadeem Uddin
 
A question paper is divided into three groups A.docx
A question paper is divided into three groups A.docxA question paper is divided into three groups A.docx
A question paper is divided into three groups A.docx
Nadeem Uddin
 
If on the average the rain falls on twelve days in every thirty day.docx
If on the average  the rain falls on twelve days in every thirty day.docxIf on the average  the rain falls on twelve days in every thirty day.docx
If on the average the rain falls on twelve days in every thirty day.docx
Nadeem Uddin
 
If on the average the rain falls on twelve days in every thirty days.docx
If on the average  the rain falls on twelve days in every thirty days.docxIf on the average  the rain falls on twelve days in every thirty days.docx
If on the average the rain falls on twelve days in every thirty days.docx
Nadeem Uddin
 
If A and B play a game in which the probability that A wins is (2).docx
If A and B play a game in which the probability that A wins is (2).docxIf A and B play a game in which the probability that A wins is (2).docx
If A and B play a game in which the probability that A wins is (2).docx
Nadeem Uddin
 
If A and B play a game in which the probability that A wins is.docx
If A and B play a game in which the probability that A wins is.docxIf A and B play a game in which the probability that A wins is.docx
If A and B play a game in which the probability that A wins is.docx
Nadeem Uddin
 
Suppose you are eating at cafeteria with two friends.docx
Suppose you are eating at cafeteria with two friends.docxSuppose you are eating at cafeteria with two friends.docx
Suppose you are eating at cafeteria with two friends.docx
Nadeem Uddin
 
Three men toss in succession for a prize to be given to the one.docx
Three men toss in succession for a prize to be given to the one.docxThree men toss in succession for a prize to be given to the one.docx
Three men toss in succession for a prize to be given to the one.docx
Nadeem Uddin
 
Two men A and B toss in succession for a prize to be given to the one.docx
Two men A and B toss in succession for a prize to be given to the one.docxTwo men A and B toss in succession for a prize to be given to the one.docx
Two men A and B toss in succession for a prize to be given to the one.docx
Nadeem Uddin
 
For the following venn diagram.docx
For the following venn diagram.docxFor the following venn diagram.docx
For the following venn diagram.docx
Nadeem Uddin
 
A group of 50 people was asked of three newspapers.docx
A group of 50 people was asked of three newspapers.docxA group of 50 people was asked of three newspapers.docx
A group of 50 people was asked of three newspapers.docx
Nadeem Uddin
 
In a survey of 100 participants.docx
In a survey of 100 participants.docxIn a survey of 100 participants.docx
In a survey of 100 participants.docx
Nadeem Uddin
 
Probability by venn diagram.docx
Probability by venn diagram.docxProbability by venn diagram.docx
Probability by venn diagram.docx
Nadeem Uddin
 
A bag contains 6 red and 4 black balls.docx
A bag contains 6 red and 4 black balls.docxA bag contains 6 red and 4 black balls.docx
A bag contains 6 red and 4 black balls.docx
Nadeem Uddin
 
Suppose that the probability is 0.8 that any given person will believe a tale...
Suppose that the probability is 0.8 that any given person will believe a tale...Suppose that the probability is 0.8 that any given person will believe a tale...
Suppose that the probability is 0.8 that any given person will believe a tale...
Nadeem Uddin
 
A man draws 2 balls from a bag containing 3 white and 5 black balls.docx
A man draws 2 balls from a bag containing 3 white and 5 black balls.docxA man draws 2 balls from a bag containing 3 white and 5 black balls.docx
A man draws 2 balls from a bag containing 3 white and 5 black balls.docx
Nadeem Uddin
 
The probability that a candidate passes a certain professional examination is...
The probability that a candidate passes a certain professional examination is...The probability that a candidate passes a certain professional examination is...
The probability that a candidate passes a certain professional examination is...
Nadeem Uddin
 
The probability that three men hit a target are respectively 1.docx
The probability that  three men hit a target are respectively 1.docxThe probability that  three men hit a target are respectively 1.docx
The probability that three men hit a target are respectively 1.docx
Nadeem Uddin
 
In a survey of a group of people the following results are obtained.docx
In a survey of a group of people the following results are obtained.docxIn a survey of a group of people the following results are obtained.docx
In a survey of a group of people the following results are obtained.docx
Nadeem Uddin
 
The probability that a student passes mathematics is 2.docx
The probability that a student passes mathematics is 2.docxThe probability that a student passes mathematics is 2.docx
The probability that a student passes mathematics is 2.docx
Nadeem Uddin
 

More from Nadeem Uddin (20)

A corporation has 15 salesmen.pdf
A corporation has 15 salesmen.pdfA corporation has 15 salesmen.pdf
A corporation has 15 salesmen.pdf
 
A question paper is divided into three groups A.docx
A question paper is divided into three groups A.docxA question paper is divided into three groups A.docx
A question paper is divided into three groups A.docx
 
If on the average the rain falls on twelve days in every thirty day.docx
If on the average  the rain falls on twelve days in every thirty day.docxIf on the average  the rain falls on twelve days in every thirty day.docx
If on the average the rain falls on twelve days in every thirty day.docx
 
If on the average the rain falls on twelve days in every thirty days.docx
If on the average  the rain falls on twelve days in every thirty days.docxIf on the average  the rain falls on twelve days in every thirty days.docx
If on the average the rain falls on twelve days in every thirty days.docx
 
If A and B play a game in which the probability that A wins is (2).docx
If A and B play a game in which the probability that A wins is (2).docxIf A and B play a game in which the probability that A wins is (2).docx
If A and B play a game in which the probability that A wins is (2).docx
 
If A and B play a game in which the probability that A wins is.docx
If A and B play a game in which the probability that A wins is.docxIf A and B play a game in which the probability that A wins is.docx
If A and B play a game in which the probability that A wins is.docx
 
Suppose you are eating at cafeteria with two friends.docx
Suppose you are eating at cafeteria with two friends.docxSuppose you are eating at cafeteria with two friends.docx
Suppose you are eating at cafeteria with two friends.docx
 
Three men toss in succession for a prize to be given to the one.docx
Three men toss in succession for a prize to be given to the one.docxThree men toss in succession for a prize to be given to the one.docx
Three men toss in succession for a prize to be given to the one.docx
 
Two men A and B toss in succession for a prize to be given to the one.docx
Two men A and B toss in succession for a prize to be given to the one.docxTwo men A and B toss in succession for a prize to be given to the one.docx
Two men A and B toss in succession for a prize to be given to the one.docx
 
For the following venn diagram.docx
For the following venn diagram.docxFor the following venn diagram.docx
For the following venn diagram.docx
 
A group of 50 people was asked of three newspapers.docx
A group of 50 people was asked of three newspapers.docxA group of 50 people was asked of three newspapers.docx
A group of 50 people was asked of three newspapers.docx
 
In a survey of 100 participants.docx
In a survey of 100 participants.docxIn a survey of 100 participants.docx
In a survey of 100 participants.docx
 
Probability by venn diagram.docx
Probability by venn diagram.docxProbability by venn diagram.docx
Probability by venn diagram.docx
 
A bag contains 6 red and 4 black balls.docx
A bag contains 6 red and 4 black balls.docxA bag contains 6 red and 4 black balls.docx
A bag contains 6 red and 4 black balls.docx
 
Suppose that the probability is 0.8 that any given person will believe a tale...
Suppose that the probability is 0.8 that any given person will believe a tale...Suppose that the probability is 0.8 that any given person will believe a tale...
Suppose that the probability is 0.8 that any given person will believe a tale...
 
A man draws 2 balls from a bag containing 3 white and 5 black balls.docx
A man draws 2 balls from a bag containing 3 white and 5 black balls.docxA man draws 2 balls from a bag containing 3 white and 5 black balls.docx
A man draws 2 balls from a bag containing 3 white and 5 black balls.docx
 
The probability that a candidate passes a certain professional examination is...
The probability that a candidate passes a certain professional examination is...The probability that a candidate passes a certain professional examination is...
The probability that a candidate passes a certain professional examination is...
 
The probability that three men hit a target are respectively 1.docx
The probability that  three men hit a target are respectively 1.docxThe probability that  three men hit a target are respectively 1.docx
The probability that three men hit a target are respectively 1.docx
 
In a survey of a group of people the following results are obtained.docx
In a survey of a group of people the following results are obtained.docxIn a survey of a group of people the following results are obtained.docx
In a survey of a group of people the following results are obtained.docx
 
The probability that a student passes mathematics is 2.docx
The probability that a student passes mathematics is 2.docxThe probability that a student passes mathematics is 2.docx
The probability that a student passes mathematics is 2.docx
 

Recently uploaded

Pride Month Slides 2024 David Douglas School District
Pride Month Slides 2024 David Douglas School DistrictPride Month Slides 2024 David Douglas School District
Pride Month Slides 2024 David Douglas School District
David Douglas School District
 
The basics of sentences session 6pptx.pptx
The basics of sentences session 6pptx.pptxThe basics of sentences session 6pptx.pptx
The basics of sentences session 6pptx.pptx
heathfieldcps1
 
C1 Rubenstein AP HuG xxxxxxxxxxxxxx.pptx
C1 Rubenstein AP HuG xxxxxxxxxxxxxx.pptxC1 Rubenstein AP HuG xxxxxxxxxxxxxx.pptx
C1 Rubenstein AP HuG xxxxxxxxxxxxxx.pptx
mulvey2
 
Film vocab for eal 3 students: Australia the movie
Film vocab for eal 3 students: Australia the movieFilm vocab for eal 3 students: Australia the movie
Film vocab for eal 3 students: Australia the movie
Nicholas Montgomery
 
LAND USE LAND COVER AND NDVI OF MIRZAPUR DISTRICT, UP
LAND USE LAND COVER AND NDVI OF MIRZAPUR DISTRICT, UPLAND USE LAND COVER AND NDVI OF MIRZAPUR DISTRICT, UP
LAND USE LAND COVER AND NDVI OF MIRZAPUR DISTRICT, UP
RAHUL
 
Pengantar Penggunaan Flutter - Dart programming language1.pptx
Pengantar Penggunaan Flutter - Dart programming language1.pptxPengantar Penggunaan Flutter - Dart programming language1.pptx
Pengantar Penggunaan Flutter - Dart programming language1.pptx
Fajar Baskoro
 
Digital Artefact 1 - Tiny Home Environmental Design
Digital Artefact 1 - Tiny Home Environmental DesignDigital Artefact 1 - Tiny Home Environmental Design
Digital Artefact 1 - Tiny Home Environmental Design
amberjdewit93
 
What is Digital Literacy? A guest blog from Andy McLaughlin, University of Ab...
What is Digital Literacy? A guest blog from Andy McLaughlin, University of Ab...What is Digital Literacy? A guest blog from Andy McLaughlin, University of Ab...
What is Digital Literacy? A guest blog from Andy McLaughlin, University of Ab...
GeorgeMilliken2
 
S1-Introduction-Biopesticides in ICM.pptx
S1-Introduction-Biopesticides in ICM.pptxS1-Introduction-Biopesticides in ICM.pptx
S1-Introduction-Biopesticides in ICM.pptx
tarandeep35
 
A Independência da América Espanhola LAPBOOK.pdf
A Independência da América Espanhola LAPBOOK.pdfA Independência da América Espanhola LAPBOOK.pdf
A Independência da América Espanhola LAPBOOK.pdf
Jean Carlos Nunes Paixão
 
How to Manage Your Lost Opportunities in Odoo 17 CRM
How to Manage Your Lost Opportunities in Odoo 17 CRMHow to Manage Your Lost Opportunities in Odoo 17 CRM
How to Manage Your Lost Opportunities in Odoo 17 CRM
Celine George
 
The Diamonds of 2023-2024 in the IGRA collection
The Diamonds of 2023-2024 in the IGRA collectionThe Diamonds of 2023-2024 in the IGRA collection
The Diamonds of 2023-2024 in the IGRA collection
Israel Genealogy Research Association
 
Your Skill Boost Masterclass: Strategies for Effective Upskilling
Your Skill Boost Masterclass: Strategies for Effective UpskillingYour Skill Boost Masterclass: Strategies for Effective Upskilling
Your Skill Boost Masterclass: Strategies for Effective Upskilling
Excellence Foundation for South Sudan
 
Community pharmacy- Social and preventive pharmacy UNIT 5
Community pharmacy- Social and preventive pharmacy UNIT 5Community pharmacy- Social and preventive pharmacy UNIT 5
Community pharmacy- Social and preventive pharmacy UNIT 5
sayalidalavi006
 
Walmart Business+ and Spark Good for Nonprofits.pdf
Walmart Business+ and Spark Good for Nonprofits.pdfWalmart Business+ and Spark Good for Nonprofits.pdf
Walmart Business+ and Spark Good for Nonprofits.pdf
TechSoup
 
Smart-Money for SMC traders good time and ICT
Smart-Money for SMC traders good time and ICTSmart-Money for SMC traders good time and ICT
Smart-Money for SMC traders good time and ICT
simonomuemu
 
BBR 2024 Summer Sessions Interview Training
BBR  2024 Summer Sessions Interview TrainingBBR  2024 Summer Sessions Interview Training
BBR 2024 Summer Sessions Interview Training
Katrina Pritchard
 
Pollock and Snow "DEIA in the Scholarly Landscape, Session One: Setting Expec...
Pollock and Snow "DEIA in the Scholarly Landscape, Session One: Setting Expec...Pollock and Snow "DEIA in the Scholarly Landscape, Session One: Setting Expec...
Pollock and Snow "DEIA in the Scholarly Landscape, Session One: Setting Expec...
National Information Standards Organization (NISO)
 
Cognitive Development Adolescence Psychology
Cognitive Development Adolescence PsychologyCognitive Development Adolescence Psychology
Cognitive Development Adolescence Psychology
paigestewart1632
 
The simplified electron and muon model, Oscillating Spacetime: The Foundation...
The simplified electron and muon model, Oscillating Spacetime: The Foundation...The simplified electron and muon model, Oscillating Spacetime: The Foundation...
The simplified electron and muon model, Oscillating Spacetime: The Foundation...
RitikBhardwaj56
 

Recently uploaded (20)

Pride Month Slides 2024 David Douglas School District
Pride Month Slides 2024 David Douglas School DistrictPride Month Slides 2024 David Douglas School District
Pride Month Slides 2024 David Douglas School District
 
The basics of sentences session 6pptx.pptx
The basics of sentences session 6pptx.pptxThe basics of sentences session 6pptx.pptx
The basics of sentences session 6pptx.pptx
 
C1 Rubenstein AP HuG xxxxxxxxxxxxxx.pptx
C1 Rubenstein AP HuG xxxxxxxxxxxxxx.pptxC1 Rubenstein AP HuG xxxxxxxxxxxxxx.pptx
C1 Rubenstein AP HuG xxxxxxxxxxxxxx.pptx
 
Film vocab for eal 3 students: Australia the movie
Film vocab for eal 3 students: Australia the movieFilm vocab for eal 3 students: Australia the movie
Film vocab for eal 3 students: Australia the movie
 
LAND USE LAND COVER AND NDVI OF MIRZAPUR DISTRICT, UP
LAND USE LAND COVER AND NDVI OF MIRZAPUR DISTRICT, UPLAND USE LAND COVER AND NDVI OF MIRZAPUR DISTRICT, UP
LAND USE LAND COVER AND NDVI OF MIRZAPUR DISTRICT, UP
 
Pengantar Penggunaan Flutter - Dart programming language1.pptx
Pengantar Penggunaan Flutter - Dart programming language1.pptxPengantar Penggunaan Flutter - Dart programming language1.pptx
Pengantar Penggunaan Flutter - Dart programming language1.pptx
 
Digital Artefact 1 - Tiny Home Environmental Design
Digital Artefact 1 - Tiny Home Environmental DesignDigital Artefact 1 - Tiny Home Environmental Design
Digital Artefact 1 - Tiny Home Environmental Design
 
What is Digital Literacy? A guest blog from Andy McLaughlin, University of Ab...
What is Digital Literacy? A guest blog from Andy McLaughlin, University of Ab...What is Digital Literacy? A guest blog from Andy McLaughlin, University of Ab...
What is Digital Literacy? A guest blog from Andy McLaughlin, University of Ab...
 
S1-Introduction-Biopesticides in ICM.pptx
S1-Introduction-Biopesticides in ICM.pptxS1-Introduction-Biopesticides in ICM.pptx
S1-Introduction-Biopesticides in ICM.pptx
 
A Independência da América Espanhola LAPBOOK.pdf
A Independência da América Espanhola LAPBOOK.pdfA Independência da América Espanhola LAPBOOK.pdf
A Independência da América Espanhola LAPBOOK.pdf
 
How to Manage Your Lost Opportunities in Odoo 17 CRM
How to Manage Your Lost Opportunities in Odoo 17 CRMHow to Manage Your Lost Opportunities in Odoo 17 CRM
How to Manage Your Lost Opportunities in Odoo 17 CRM
 
The Diamonds of 2023-2024 in the IGRA collection
The Diamonds of 2023-2024 in the IGRA collectionThe Diamonds of 2023-2024 in the IGRA collection
The Diamonds of 2023-2024 in the IGRA collection
 
Your Skill Boost Masterclass: Strategies for Effective Upskilling
Your Skill Boost Masterclass: Strategies for Effective UpskillingYour Skill Boost Masterclass: Strategies for Effective Upskilling
Your Skill Boost Masterclass: Strategies for Effective Upskilling
 
Community pharmacy- Social and preventive pharmacy UNIT 5
Community pharmacy- Social and preventive pharmacy UNIT 5Community pharmacy- Social and preventive pharmacy UNIT 5
Community pharmacy- Social and preventive pharmacy UNIT 5
 
Walmart Business+ and Spark Good for Nonprofits.pdf
Walmart Business+ and Spark Good for Nonprofits.pdfWalmart Business+ and Spark Good for Nonprofits.pdf
Walmart Business+ and Spark Good for Nonprofits.pdf
 
Smart-Money for SMC traders good time and ICT
Smart-Money for SMC traders good time and ICTSmart-Money for SMC traders good time and ICT
Smart-Money for SMC traders good time and ICT
 
BBR 2024 Summer Sessions Interview Training
BBR  2024 Summer Sessions Interview TrainingBBR  2024 Summer Sessions Interview Training
BBR 2024 Summer Sessions Interview Training
 
Pollock and Snow "DEIA in the Scholarly Landscape, Session One: Setting Expec...
Pollock and Snow "DEIA in the Scholarly Landscape, Session One: Setting Expec...Pollock and Snow "DEIA in the Scholarly Landscape, Session One: Setting Expec...
Pollock and Snow "DEIA in the Scholarly Landscape, Session One: Setting Expec...
 
Cognitive Development Adolescence Psychology
Cognitive Development Adolescence PsychologyCognitive Development Adolescence Psychology
Cognitive Development Adolescence Psychology
 
The simplified electron and muon model, Oscillating Spacetime: The Foundation...
The simplified electron and muon model, Oscillating Spacetime: The Foundation...The simplified electron and muon model, Oscillating Spacetime: The Foundation...
The simplified electron and muon model, Oscillating Spacetime: The Foundation...
 

Time series

  • 1. NADEEM UDDIN ASSOCIATE PROFESSOR OF STATISTICS https://www.slideshare.net/NadeemUddin17 https://nadeemstats.wordpress.com/listofbooks/
  • 2. Definition of Time Series: Time series refers to an arrangement and presentation of statistical data in chronological order. The statistical data is collected over a period of time. According to Spiegel, “A time series is a set of observations taken at specified times, usually at equal intervals.” There exist various forces that affect the values of the phenomenon in a time series. These are also the components of the time series analysis.
  • 3. Examples of time series: 1- The monthly sales of mobiles in Pakistan. 2- The daily consumption of electricity in a sugar mill. 3- The annual rainfall recorded in Karachi. 4- Pakistan’s Imports from 1980 to 2000. 5- Pakistan’s Exports from 1980 to 2000. 6- The hourly temperature recorded in a city. 7- Yearly wheat production in Punjab. 8- The festival sale. 9- The number of patients suffering from flue in winter. 10- The increase in oil price due to Gulf war.
  • 4. Graph of time series(Historigram): Time series graphs help to show trends or patterns. Time taking along x-axis and the values of time series along y-axis and then join the plotted points by a straight line. Example-1 An ice cream company, shows its sales over the past three years, taken every three months, on the time series graph below. (Quarter 1 is for January, February and March)
  • 5. Uses of Time Series: a) The most important use of studying time series is that it helps us to predict the future behaviour of the variable based on past experience. b) It is helpful for business planning as it helps in comparing the actual current performance with the expected one. c) From time series, we get to study the past behaviour of the phenomenon or the variable under consideration. d) We can compare the changes in the values of different variables at different times or places, etc.
  • 6. Components(Variations) of Time Series: You may have heard people saying that the price of a particular commodity has increased or decreased with time. This commodity can be anything like gold, silver, any eatables, petrol, diesel etc. These types of data are the time series of data. fluctuation in a time series is data called the components of the time series.
  • 7. Following are the various components of the time series: Secular Trend or Simple trend or Long term movement: Secular trend refers to the general tendency of data to increase or decrease or stagnate over a long period of time. Time series relating to Economic, Business, and Commerce may show an upward or increasing tendency. Whereas, the time series relating to death rates, birth rates, share prices, etc. may show a downward or decreasing tendency.
  • 8. Seasonal variations: Seasonal variations refer to the changes that take place due to the rhythmic forces which operate in a regular and periodic manner. These forces usually have the same or most similar pattern year after year. When we record data weekly, monthly or quarterly, we can see and calculate seasonal variations. Thus, when a time series consists of data only based on annual figures, there will be seen no seasonal variations. These variations may be due to seasons, weather conditions, habits, customs or traditions. For example, in summers the sale of ice-cream increases.
  • 9.
  • 10. Cyclical variations: Cyclical variations are due to the ups and downs recurring after a period from time to time. These are due to the business cycle and every organization has to phase all the four phases of a business cycle some time or the other. Prosperity or boom, recession, depression, and recovery are the four phases of a business cycle.
  • 11. Random or irregular variations: Random variations are fluctuations which are a result of unforeseen and unpredictable forces. These forces operate in an absolutely random or erratic manner and do not have any definite pattern. Thus, these variations may be due to floods, famines, earthquakes, strikes, etc.
  • 12. Signal and noise The systematic fluctuation or regular pattern in time series is called signal. The unsystematic or irregular pattern is called noise. Linear and Non-Linear Trend: If we plot the time series values on a graph in accordance with time t. The pattern of the data clustering shows the type of trend. If the set of data cluster more or less round a straight line, then the trend is linear otherwise it is non-linear (Curvilinear).
  • 13. Time Series Analysis: There are certain phenomena that define our society such as population, birth or death rates, incomes, etc. And the one parameter which shows a clear variation in all of these phenomena is time. So, when we plot a collection of readings with respect to a phenomenon against time we call it a series in time. Furthermore, we can also categorize the nature of the trend (upward tendency or downward tendency) which a particular series is displaying. The study of these various series is what we call time series analysis.
  • 14. The advantages of time series analysis are as follows: Reliability: Time series analysis uses historical data to represent conditions along with a progressive linear chart. The information or data used is collected over a period of time say, weekly, monthly, quarterly or annually. This makes the data and forecasts reliable. Seasonal Patterns: As the data related to a series of periods, it helps us to understand and predict the seasonal pattern. For example, the time series may reveal that the demand of clothes not only increases during festival but also during the wedding season.
  • 15. Estimation of trends: The time series analysis helps in the identification of trends. The data tendencies are useful to managers as they show an increase or decrease in sales, production, share prices, etc. Growth: Time series analysis helps in the measurement of financial growth. It also helps in measuring the internal growth of an organization that leads to economic growth.
  • 16. Mathematical Model for Time Series Analysis: Mathematically, a time series is given as yt = f (t) Additive Model for Time Series Analysis: If yt is the time series value at time t. Tt, St, Ct, and Rt are the trend value, seasonal, cyclic and random fluctuations at time t respectively. According to the Additive Model, a time series can be expressed as yt = Tt + St + Ct + Rt. This model assumes that all four components of the time series act independently of each other.
  • 17. Multiplicative Model for Time Series Analysis: The multiplicative model assumes that the various components in a time series operate proportionately to each other. According to this model yt = Tt × St × Ct × Rt