Downloaded 653 times
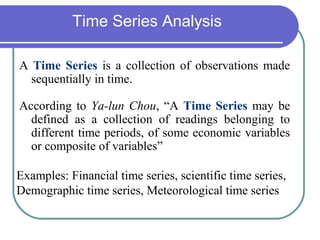

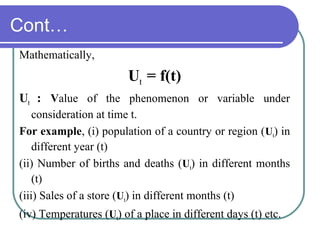


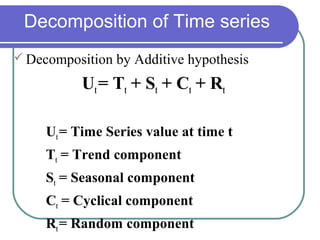

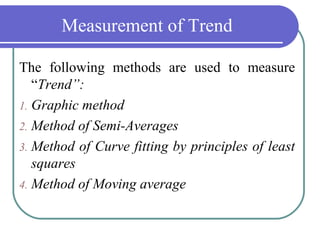

This document discusses time series analysis. It defines a time series as a collection of observations made sequentially over time. Examples include financial, scientific, demographic, and meteorological time series data. The document contrasts time series data with cross-sectional data. It also describes the components of a time series, including trends, seasonal variations, cyclical variations, and irregular/random variations. The purposes and uses of time series analysis are discussed, along with methods for decomposing and measuring trends in time series data.


