Downloaded 1,016 times
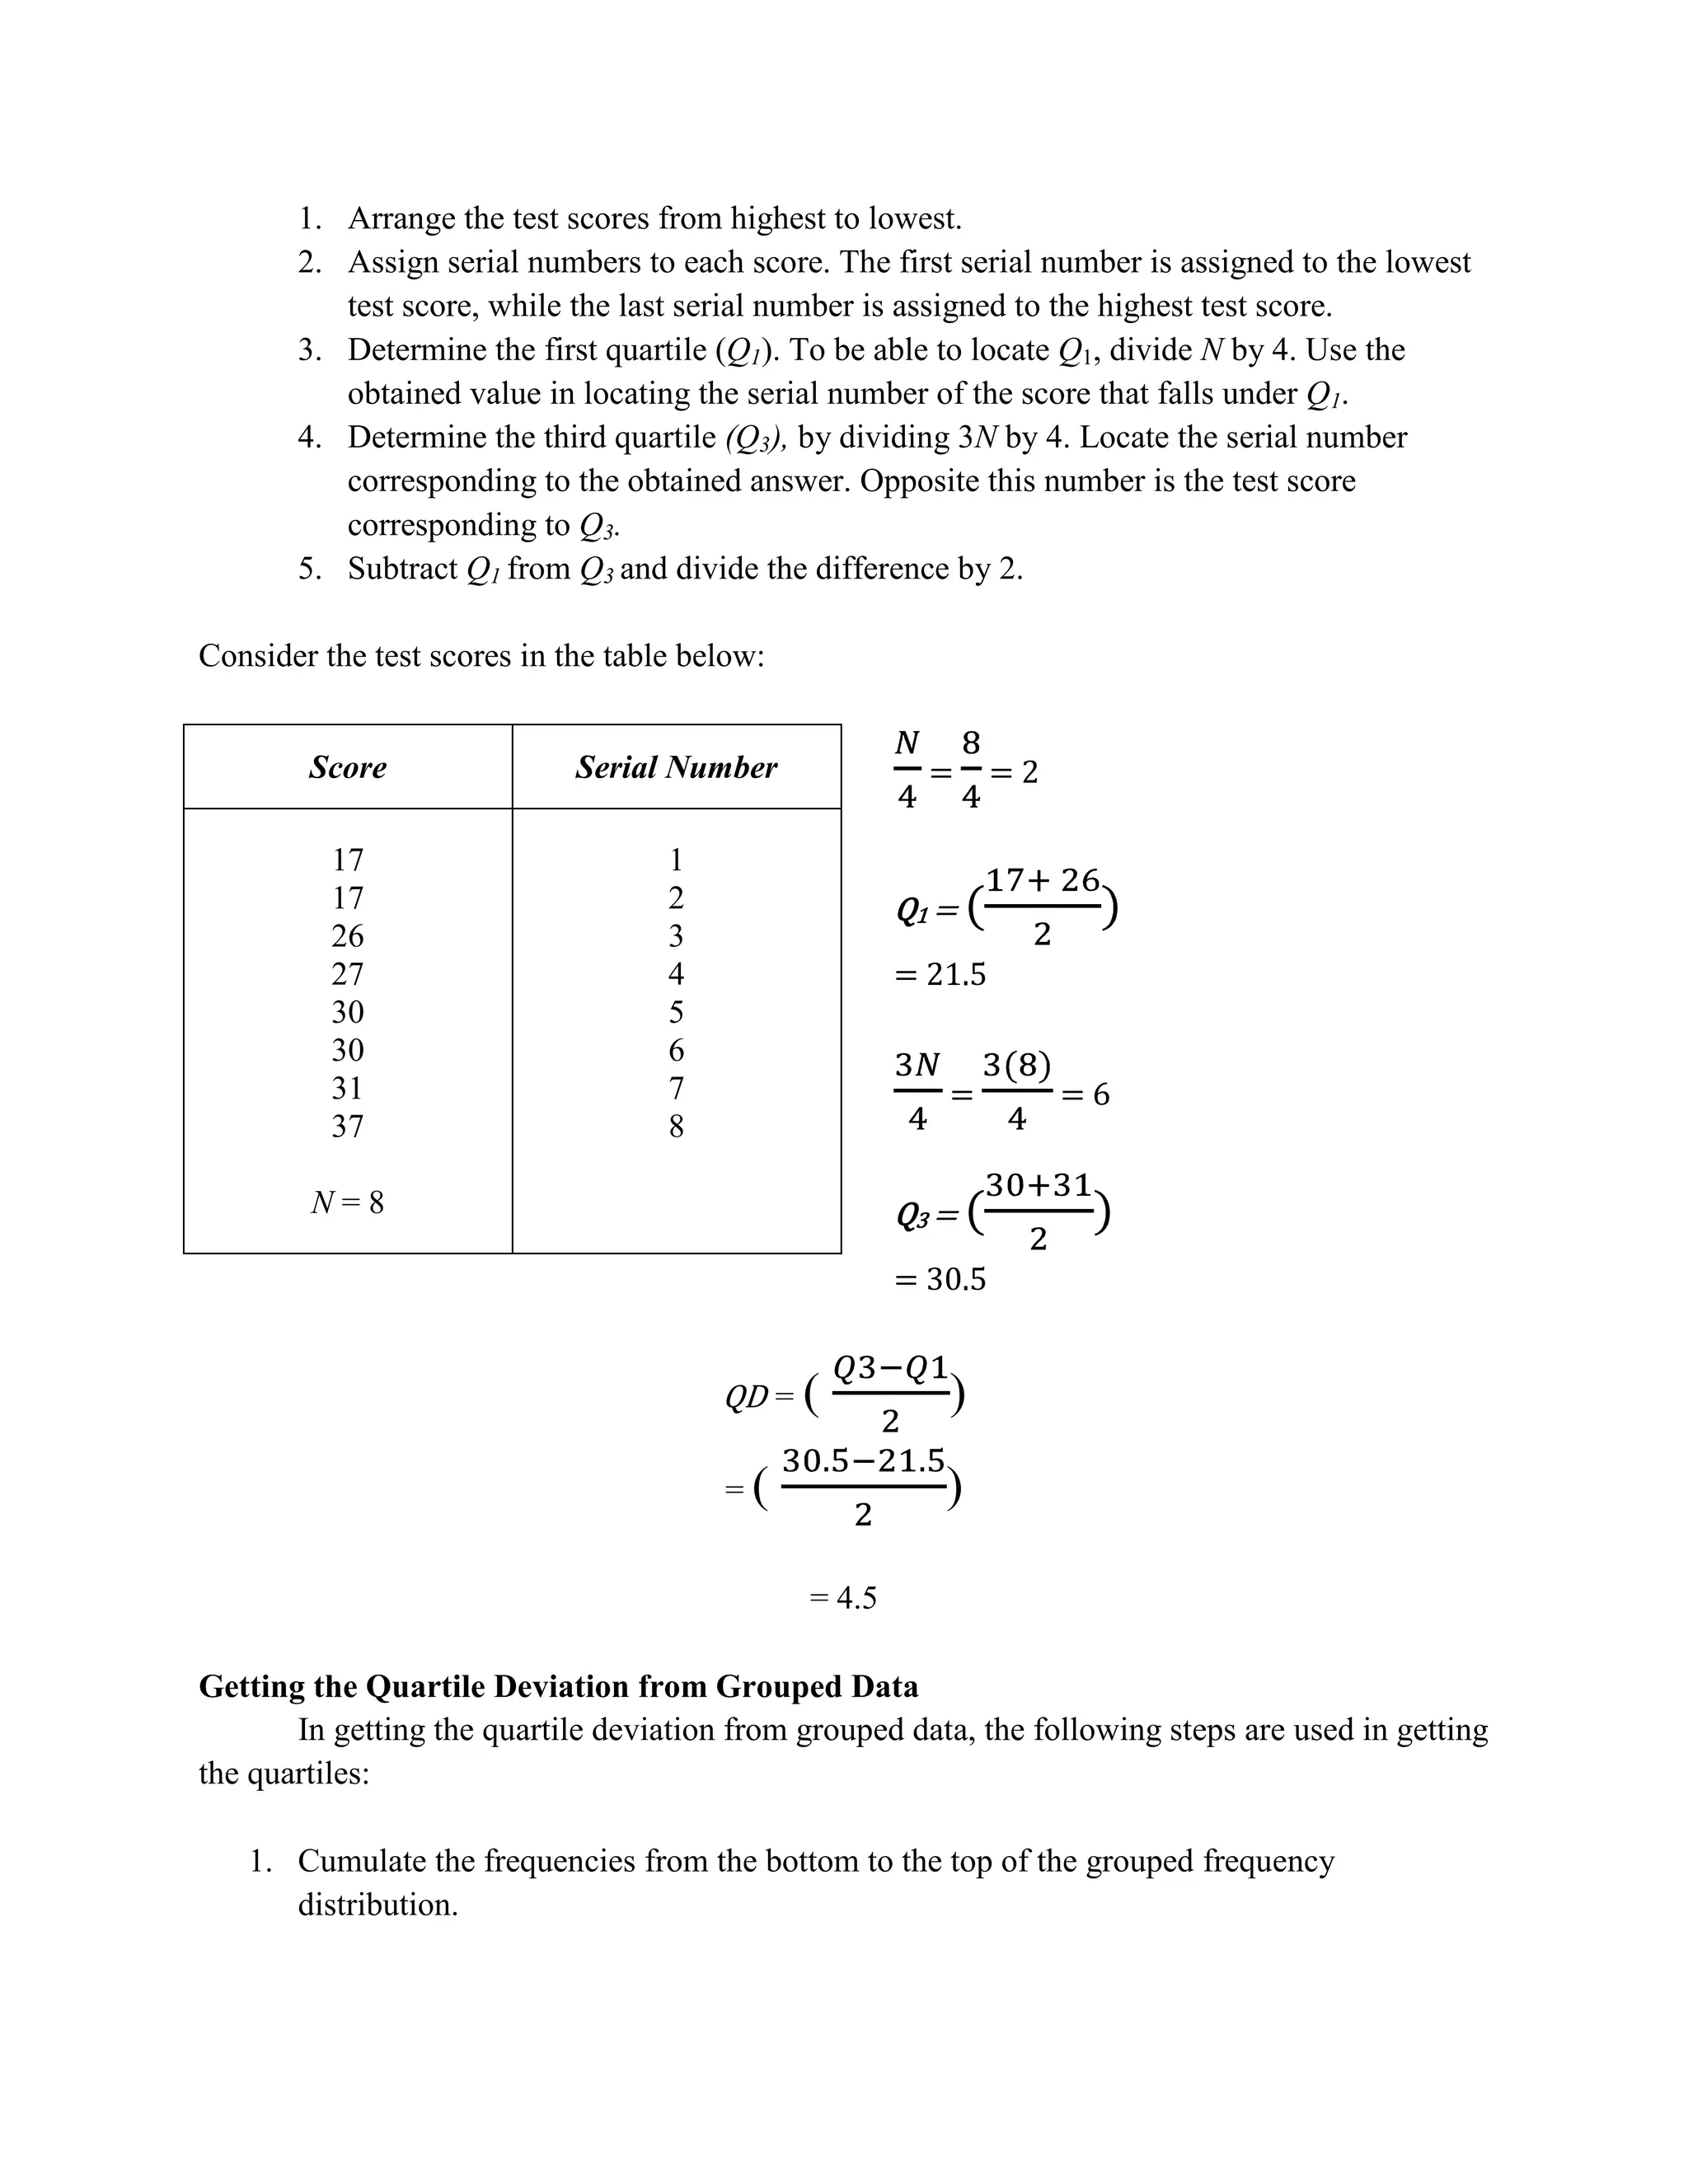
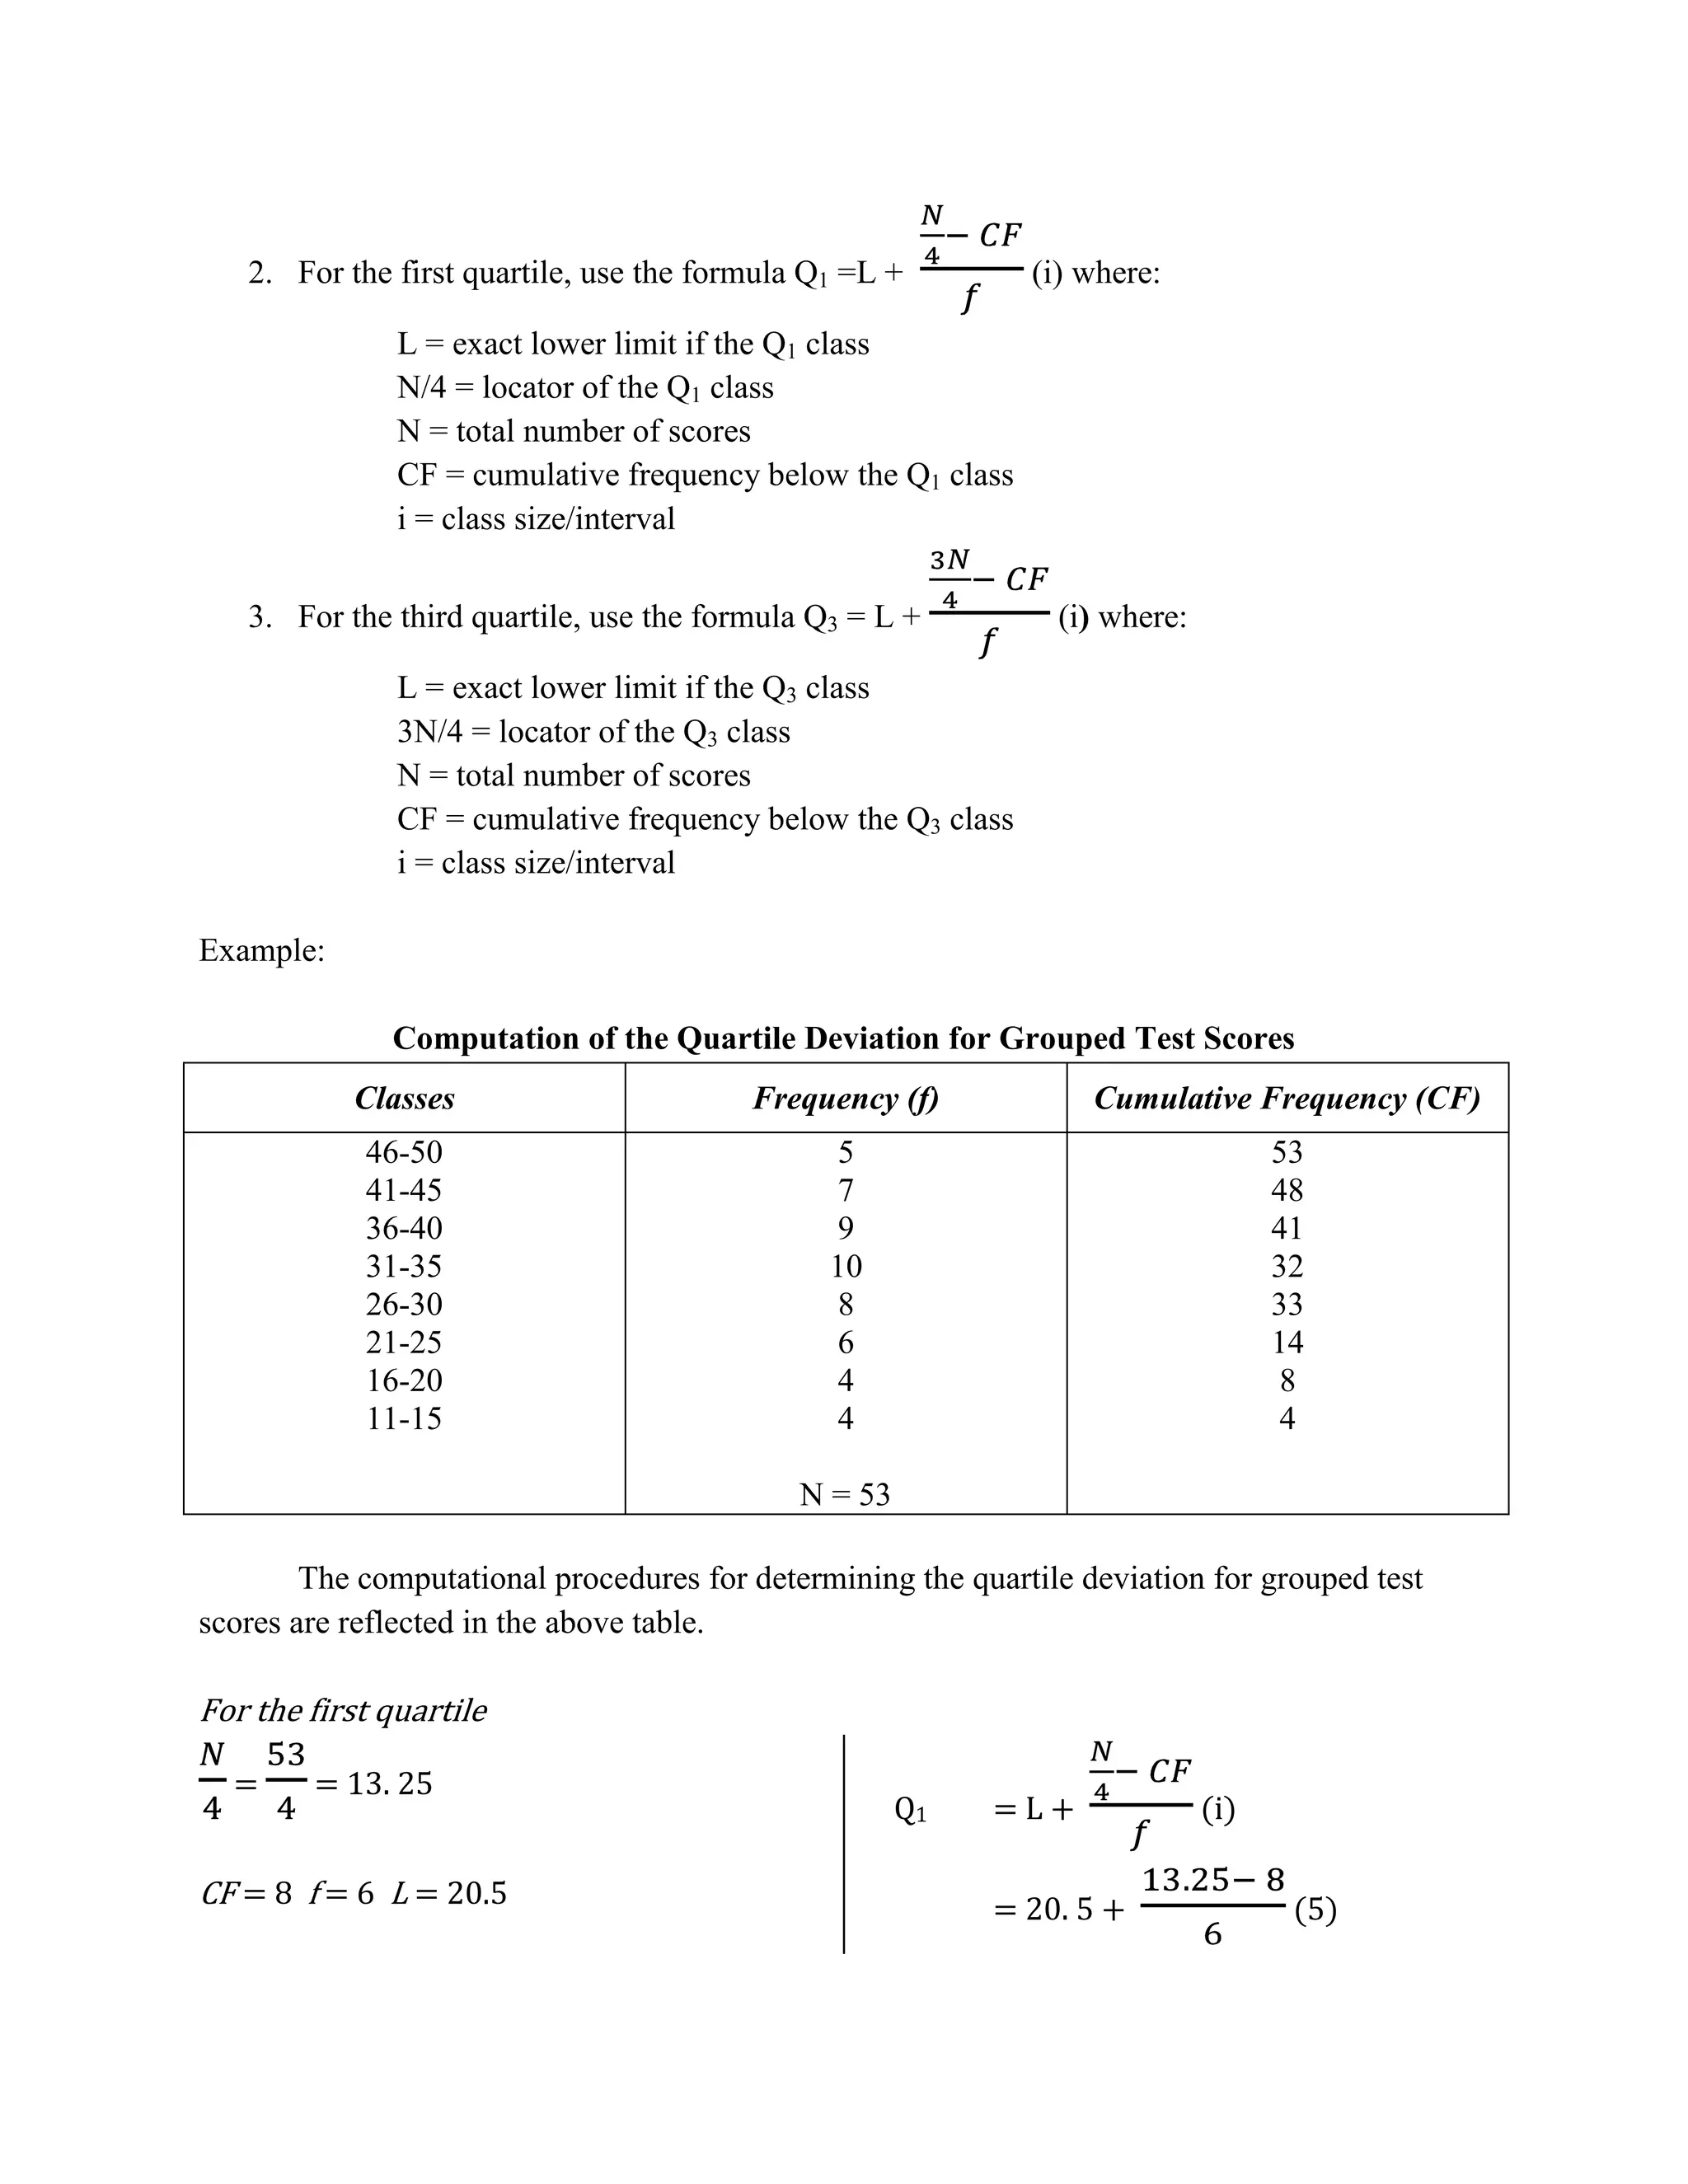
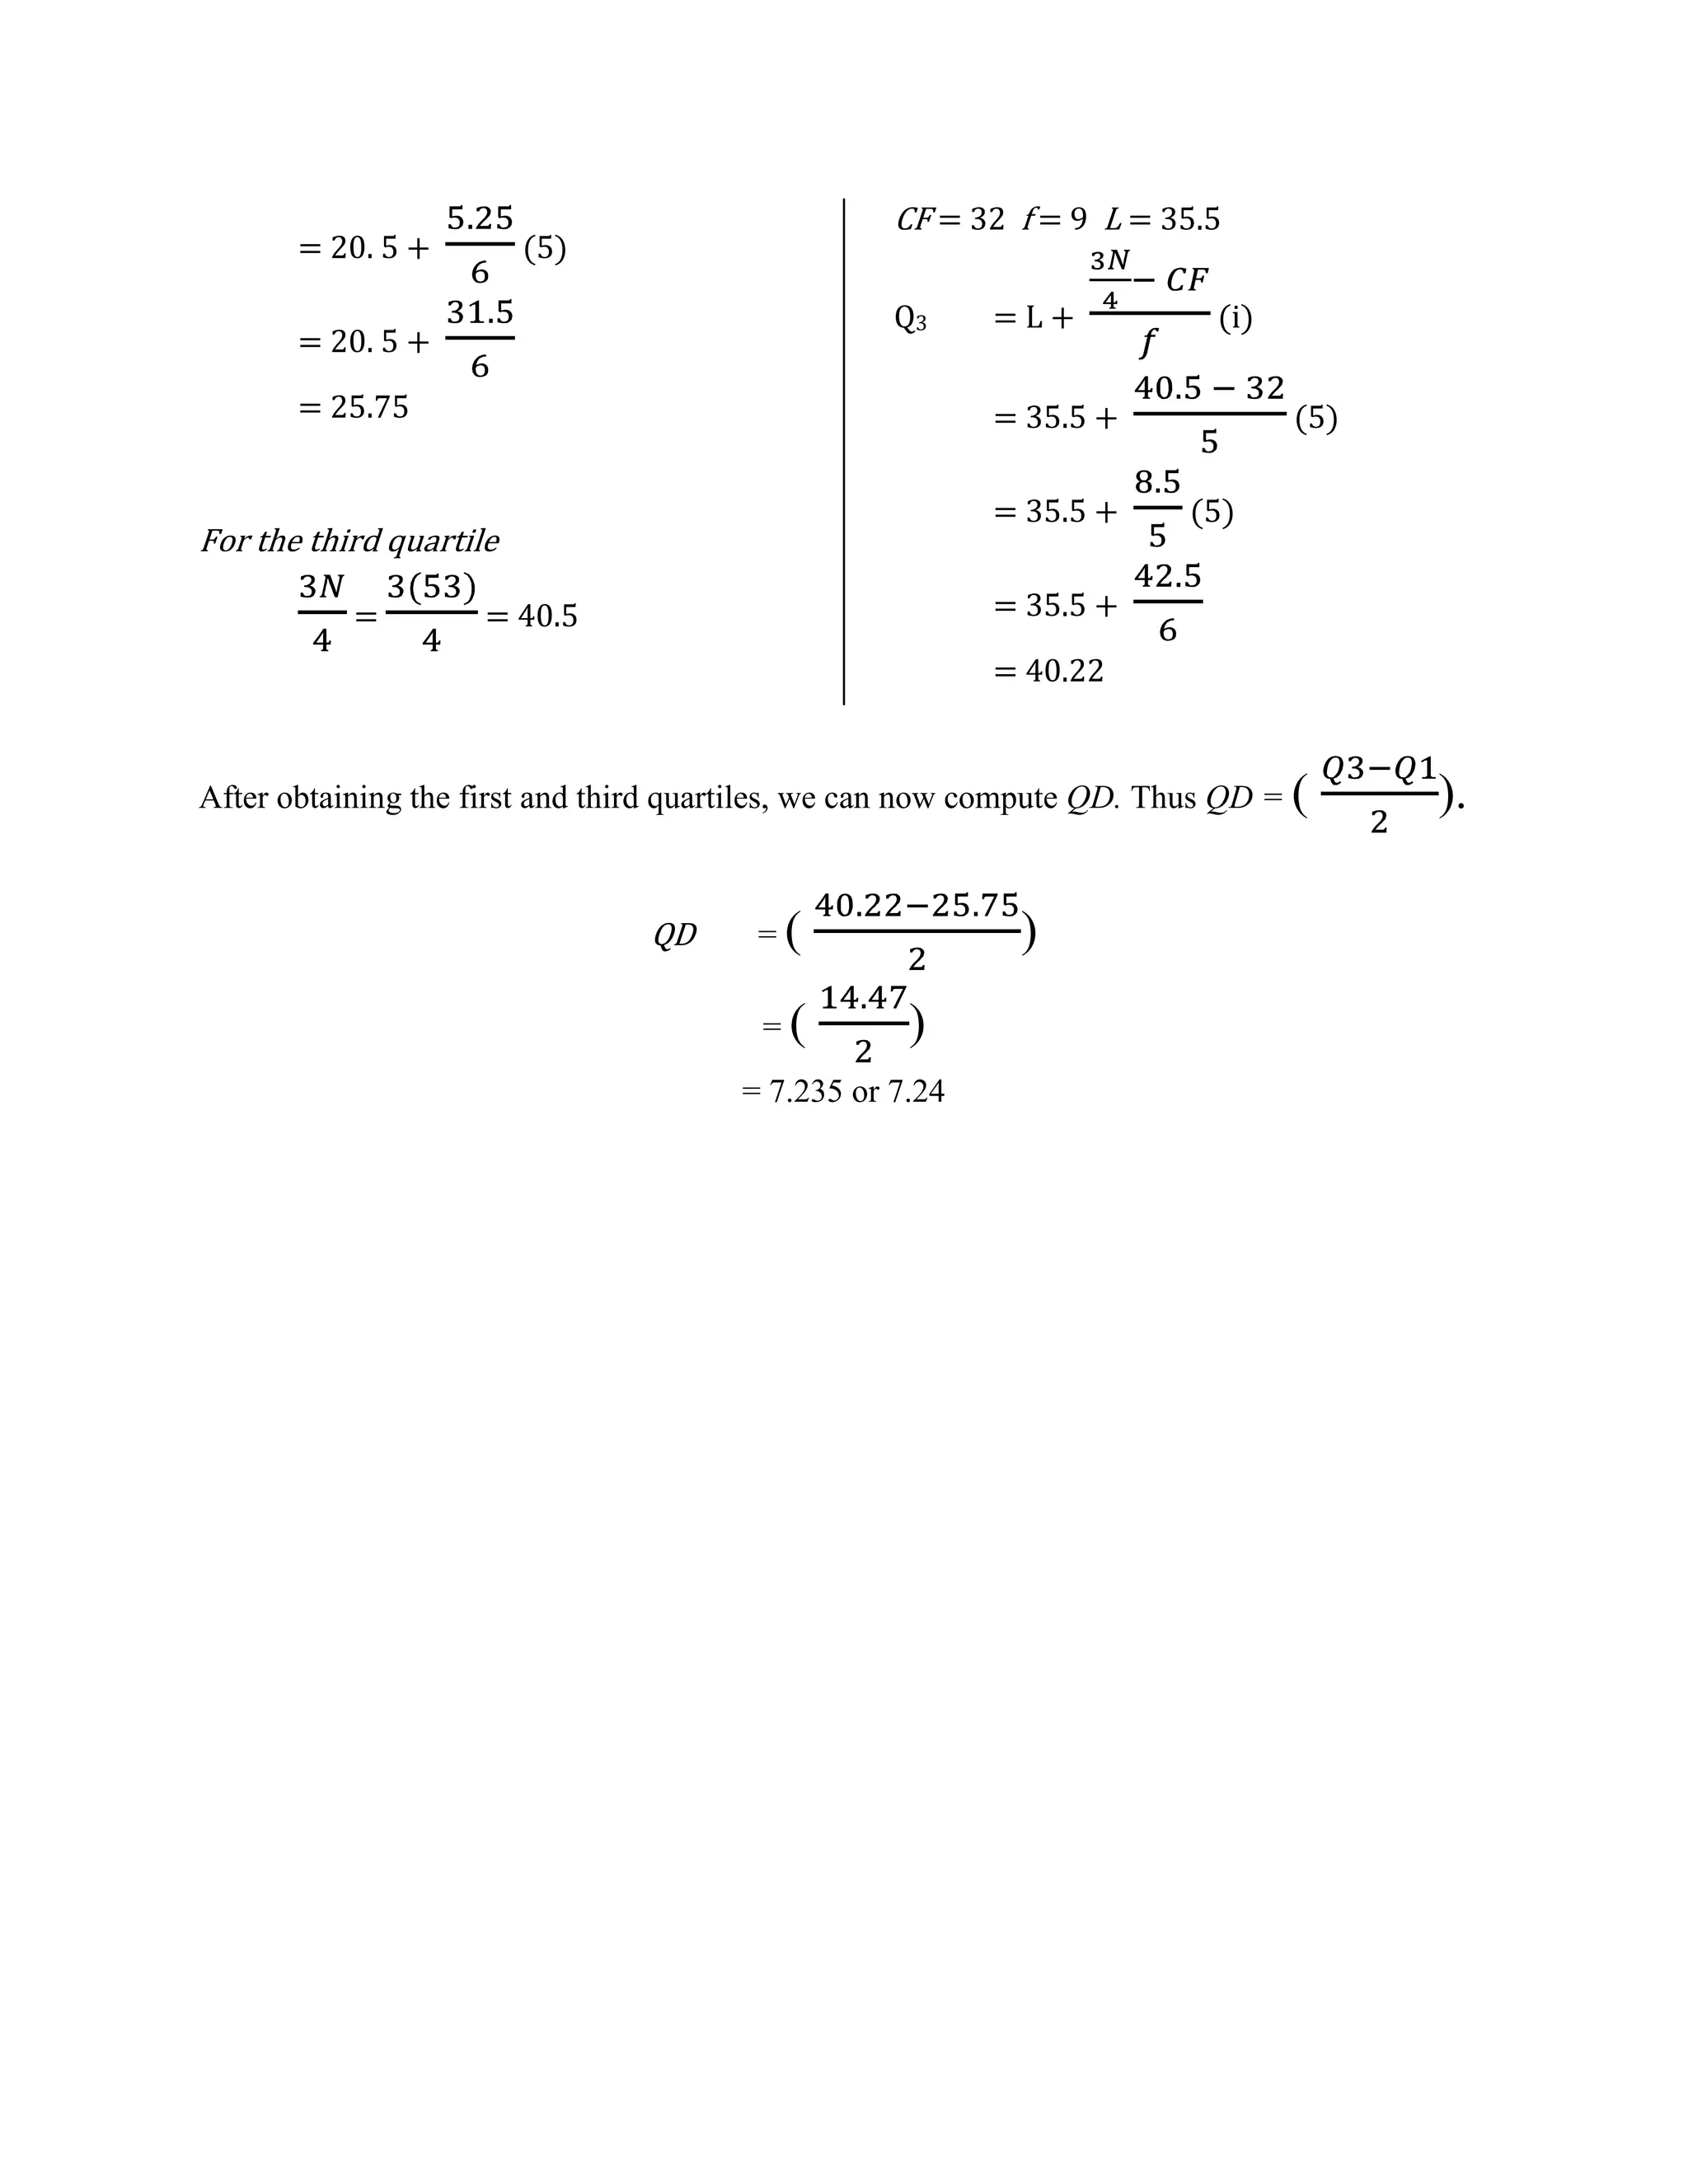

This document discusses the calculation of quartile deviation from both ungrouped and grouped data. It defines quartiles as values that divide a data distribution into four equal parts (Q1, Q2, Q3). The quartile deviation is half the difference between the first (Q1) and third (Q3) quartiles. It provides the steps to find Q1, Q3, and quartile deviation from ungrouped data by ranking scores and using quartile locators. For grouped data, it uses formulas involving class limits and cumulative frequencies to determine Q1 and Q3, then takes half their difference. An example calculation is shown.