Statistics - Basic concepts
BY
Ibrahim Abdelmonaem
ZMRS TEAM
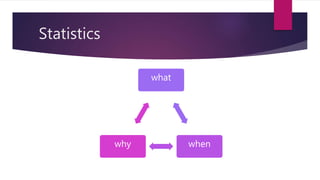
Statistics
what
when
why
What … ?
 Statistics is the science concerned with collection, organization, analysis,
interpretation and presentation of data.
 Why … ??
 When … ??
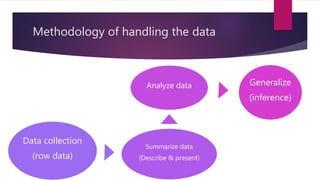
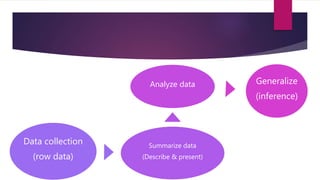
Methodology of handling the data
Data collection
(row data)
Summarize data
(Describe & present)
Analyze data Generalize
(inference)
Data Vs Information
 Data: row materials (individual values)
 Information: processed data – management of data
 Variable !!!
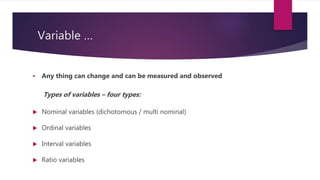
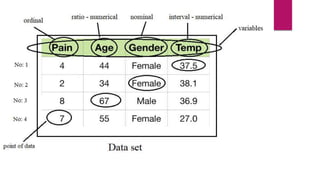
Variable …
 Any thing can change and can be measured and observed
Types of variables – four types:
 Nominal variables (dichotomous / multi nominal)
 Ordinal variables
 Interval variables
 Ratio variables
Data
 Quantitative Data (numerical)
 Qualitative Data (categorical)
Data collection
(row data)
Summarize data
(Describe & present)
Analyze data Generalize
(inference)
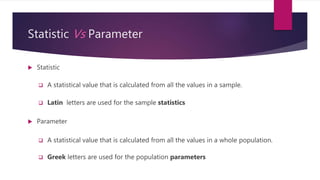
Statistic Vs Parameter
 Statistic
 A statistical value that is calculated from all the values in a sample.
 Latin letters are used for the sample statistics
 Parameter
 A statistical value that is calculated from all the values in a whole population.
 Greek letters are used for the population parameters
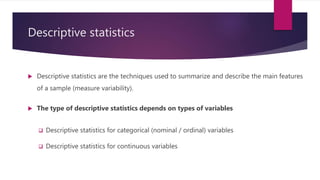
Descriptive statistics
 Descriptive statistics are the techniques used to summarize and describe the main features
of a sample (measure variability).
 The type of descriptive statistics depends on types of variables
 Descriptive statistics for categorical (nominal / ordinal) variables
 Descriptive statistics for continuous variables
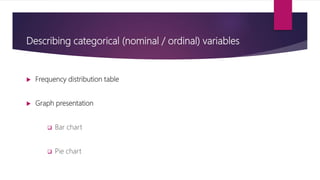
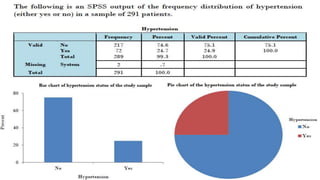
Describing categorical (nominal / ordinal) variables
 Frequency distribution table
 Graph presentation
 Bar chart
 Pie chart
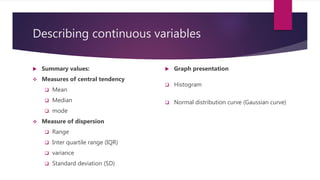
Describing continuous variables
 Summary values:
 Measures of central tendency
 Mean
 Median
 mode
 Measure of dispersion
 Range
 Inter quartile range (IQR)
 variance
 Standard deviation (SD)
 Graph presentation
 Histogram
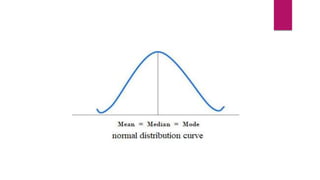
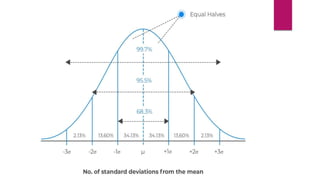
 Normal distribution curve (Gaussian curve)
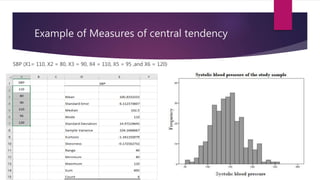
Example of Measures of central tendency
SBP (X1= 110, X2 = 80, X3 = 90, X4 = 110, X5 = 95 ,and X6 = 120)
Inferential statistics
 Inferential statistics is a type of statistics that is used to draw conclusions on a population used
data that was collected on a sample.
 A statistical step performed to generalize the results found in the study to the population under
consideration.
 There are two main types of inferential statistics:
 Confidence interval.
 Hypothesis testing (p-value).
Probability and Hypothesis
 Inferential statistics is highly related to probability distributions.
 Probability distribution is a statistical function describing the probability of all possible values
of a continuous variable.
 The most frequently used distribution is the normal distribution.
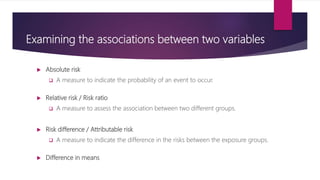
Examining the associations between two variables
 Absolute risk
 A measure to indicate the probability of an event to occur.
 Relative risk / Risk ratio
 A measure to assess the association between two different groups.
 Risk difference / Attributable risk
 A measure to indicate the difference in the risks between the exposure groups.
 Difference in means
THANK YOU