Download as PDF, PPTX

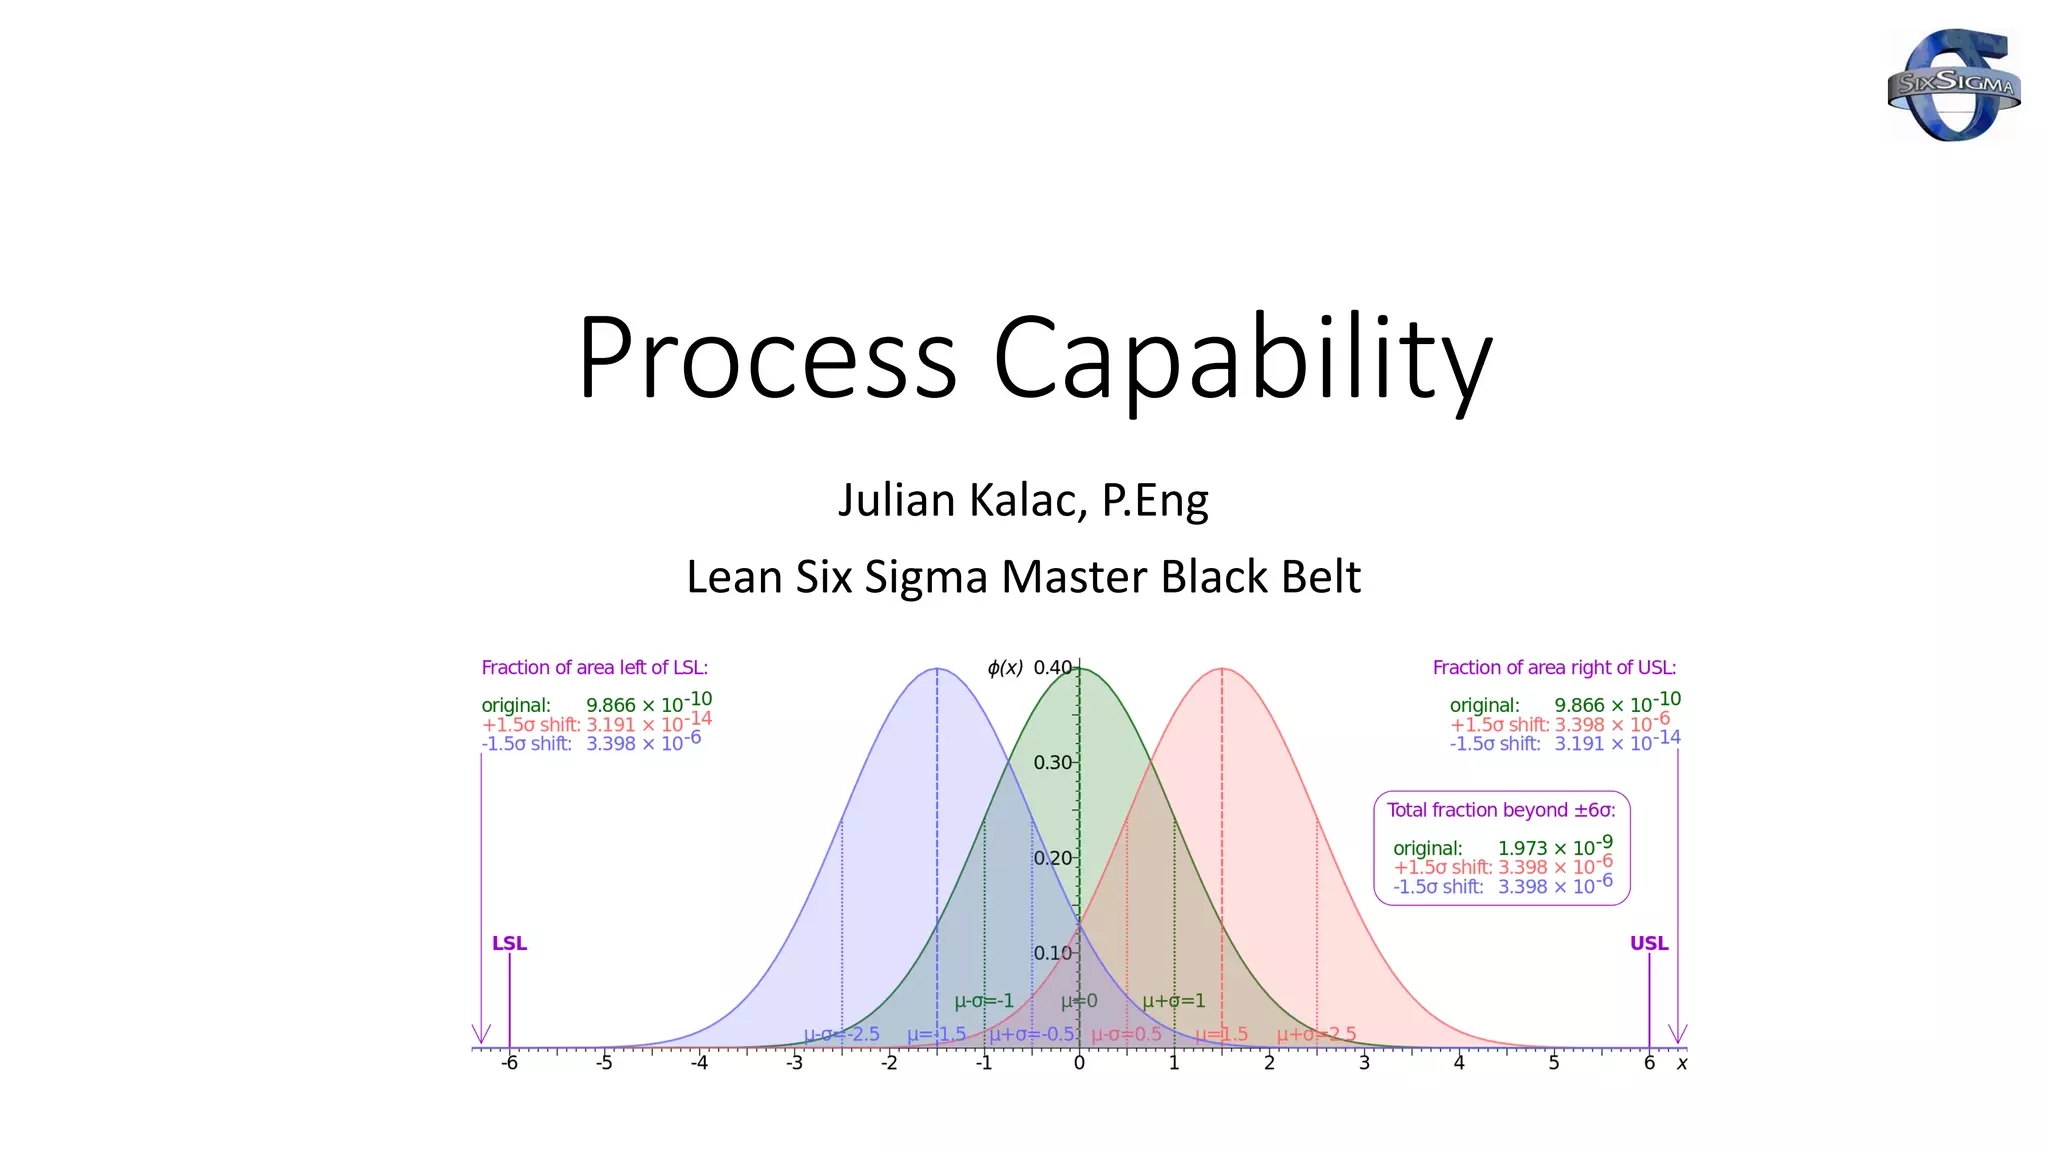
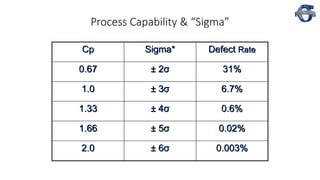
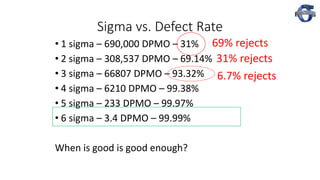
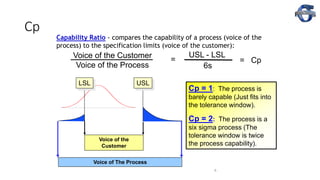
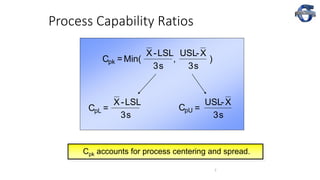
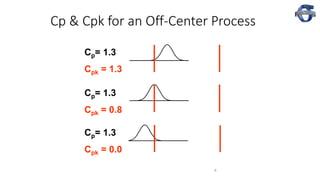
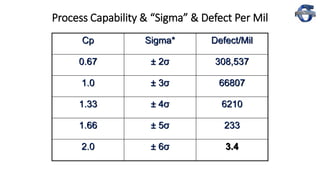
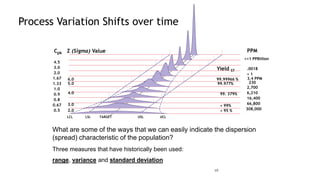
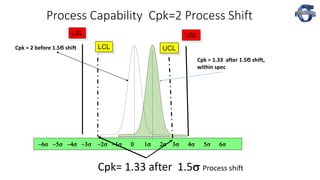
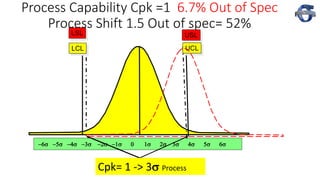
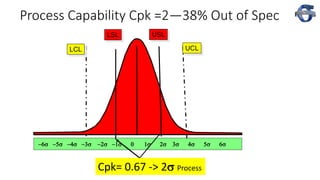
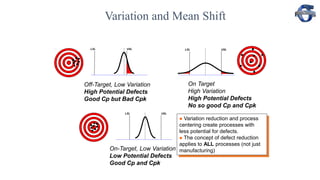

1) The document discusses process capability and sigma metrics, which are used to measure process performance and defect rates. It provides examples of how defect rates decrease significantly as sigma levels increase from 1 to 6. 2) It explains key process capability ratios like Cp, Cpk, and how they are calculated. Cp measures how close the process is to the specification limits, while Cpk also considers whether the process is centered between the limits. 3) The document provides examples of how a process shift can decrease Cpk and increase defect rates, even if the process remains within specifications. Maintaining low variation and centering are important to minimize defects.


![7 qc tools training material[1]](https://cdn.slidesharecdn.com/ss_thumbnails/7qctoolstrainingmaterial1-120925054558-phpapp02-thumbnail.jpg?width=640&height=640&fit=bounds)


![Process Capability[1]](https://cdn.slidesharecdn.com/ss_thumbnails/processcapability1-1226090261326164-9-thumbnail.jpg?width=640&height=640&fit=bounds)


![[Deck] What's New in Spark-Iceberg Integration via DSV2.pptx](https://cdn.slidesharecdn.com/ss_thumbnails/deckwhatsnewinspark-icebergintegrationviadsv2-260210005337-25955b12-thumbnail.jpg?width=640&height=640&fit=bounds)


