Downloaded 553 times
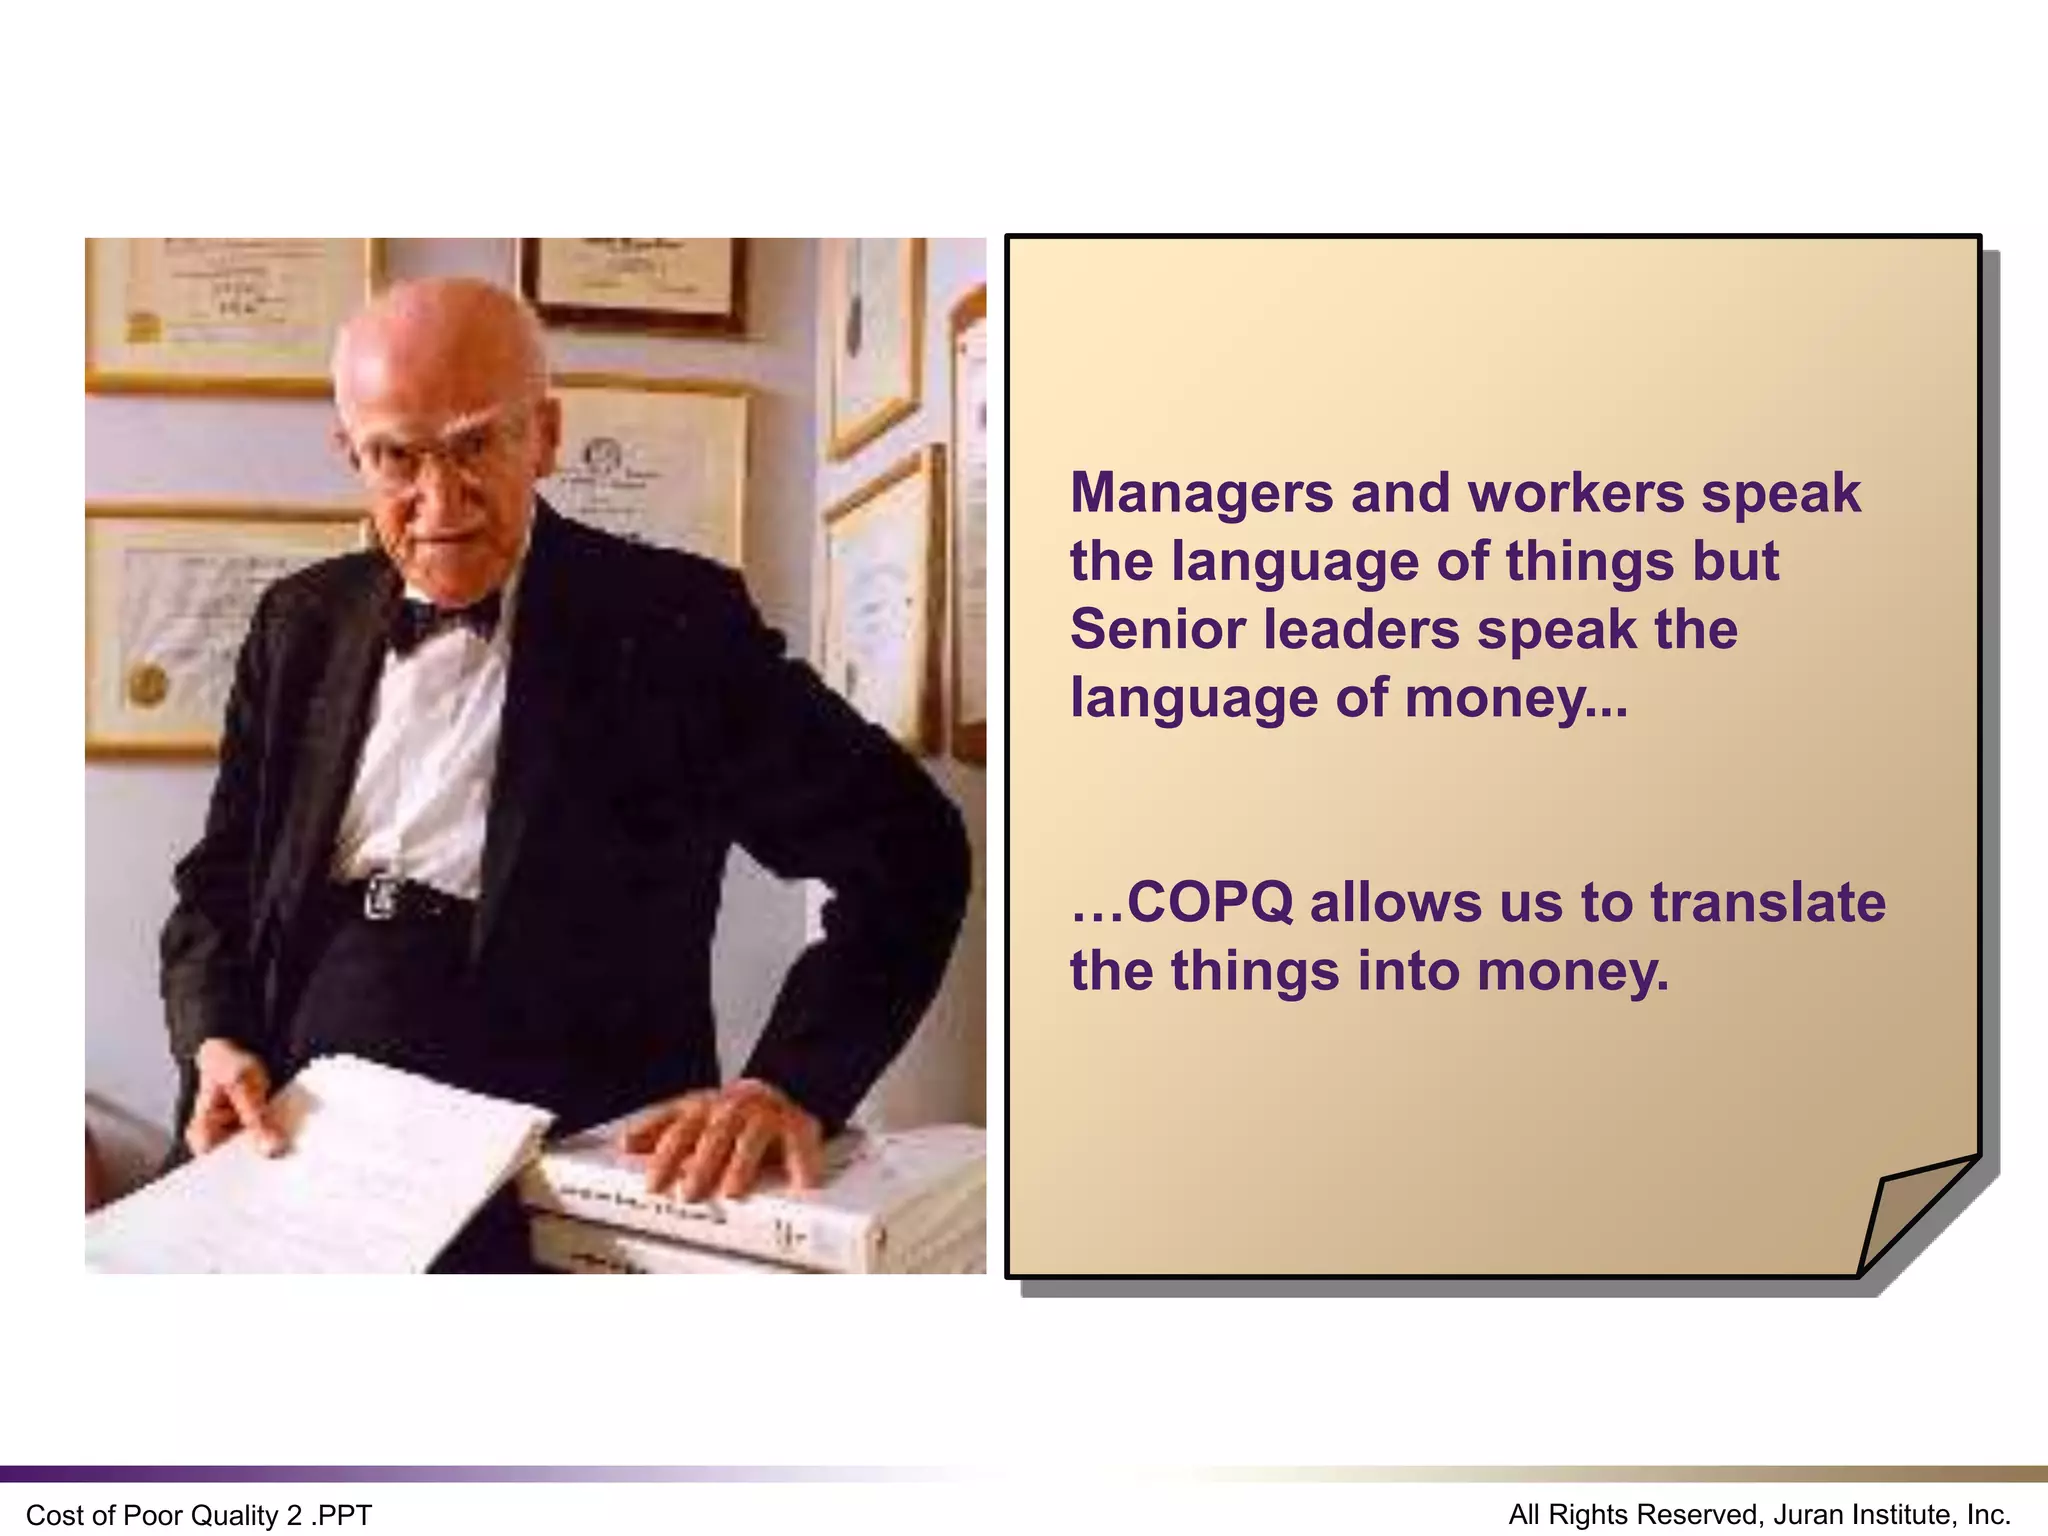
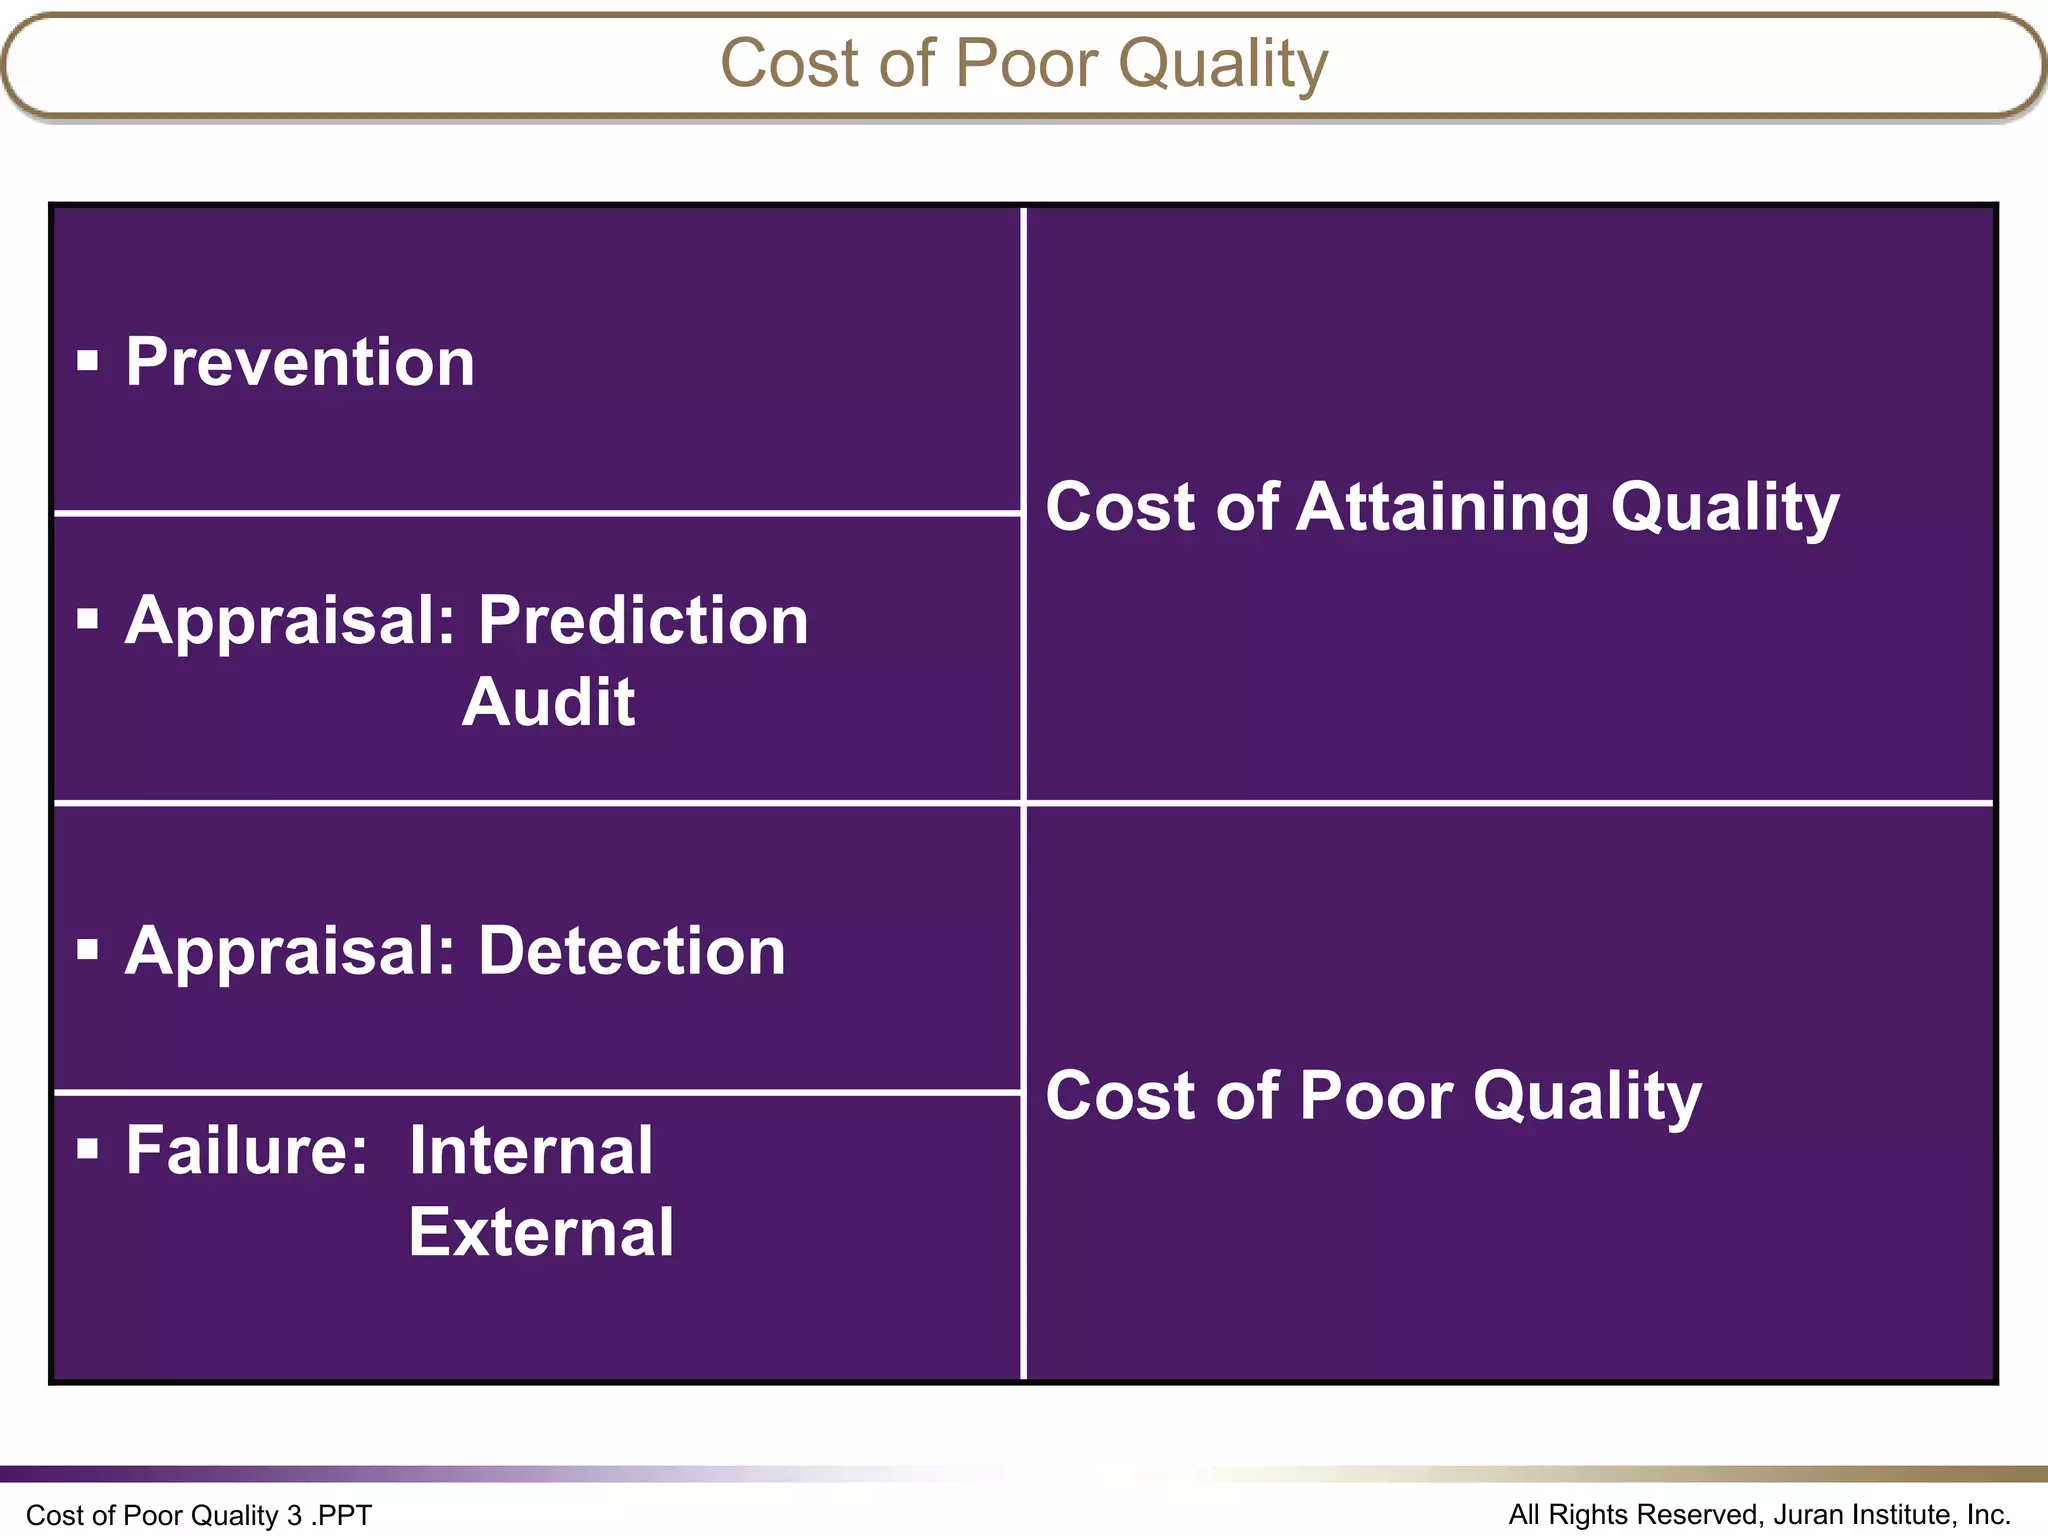
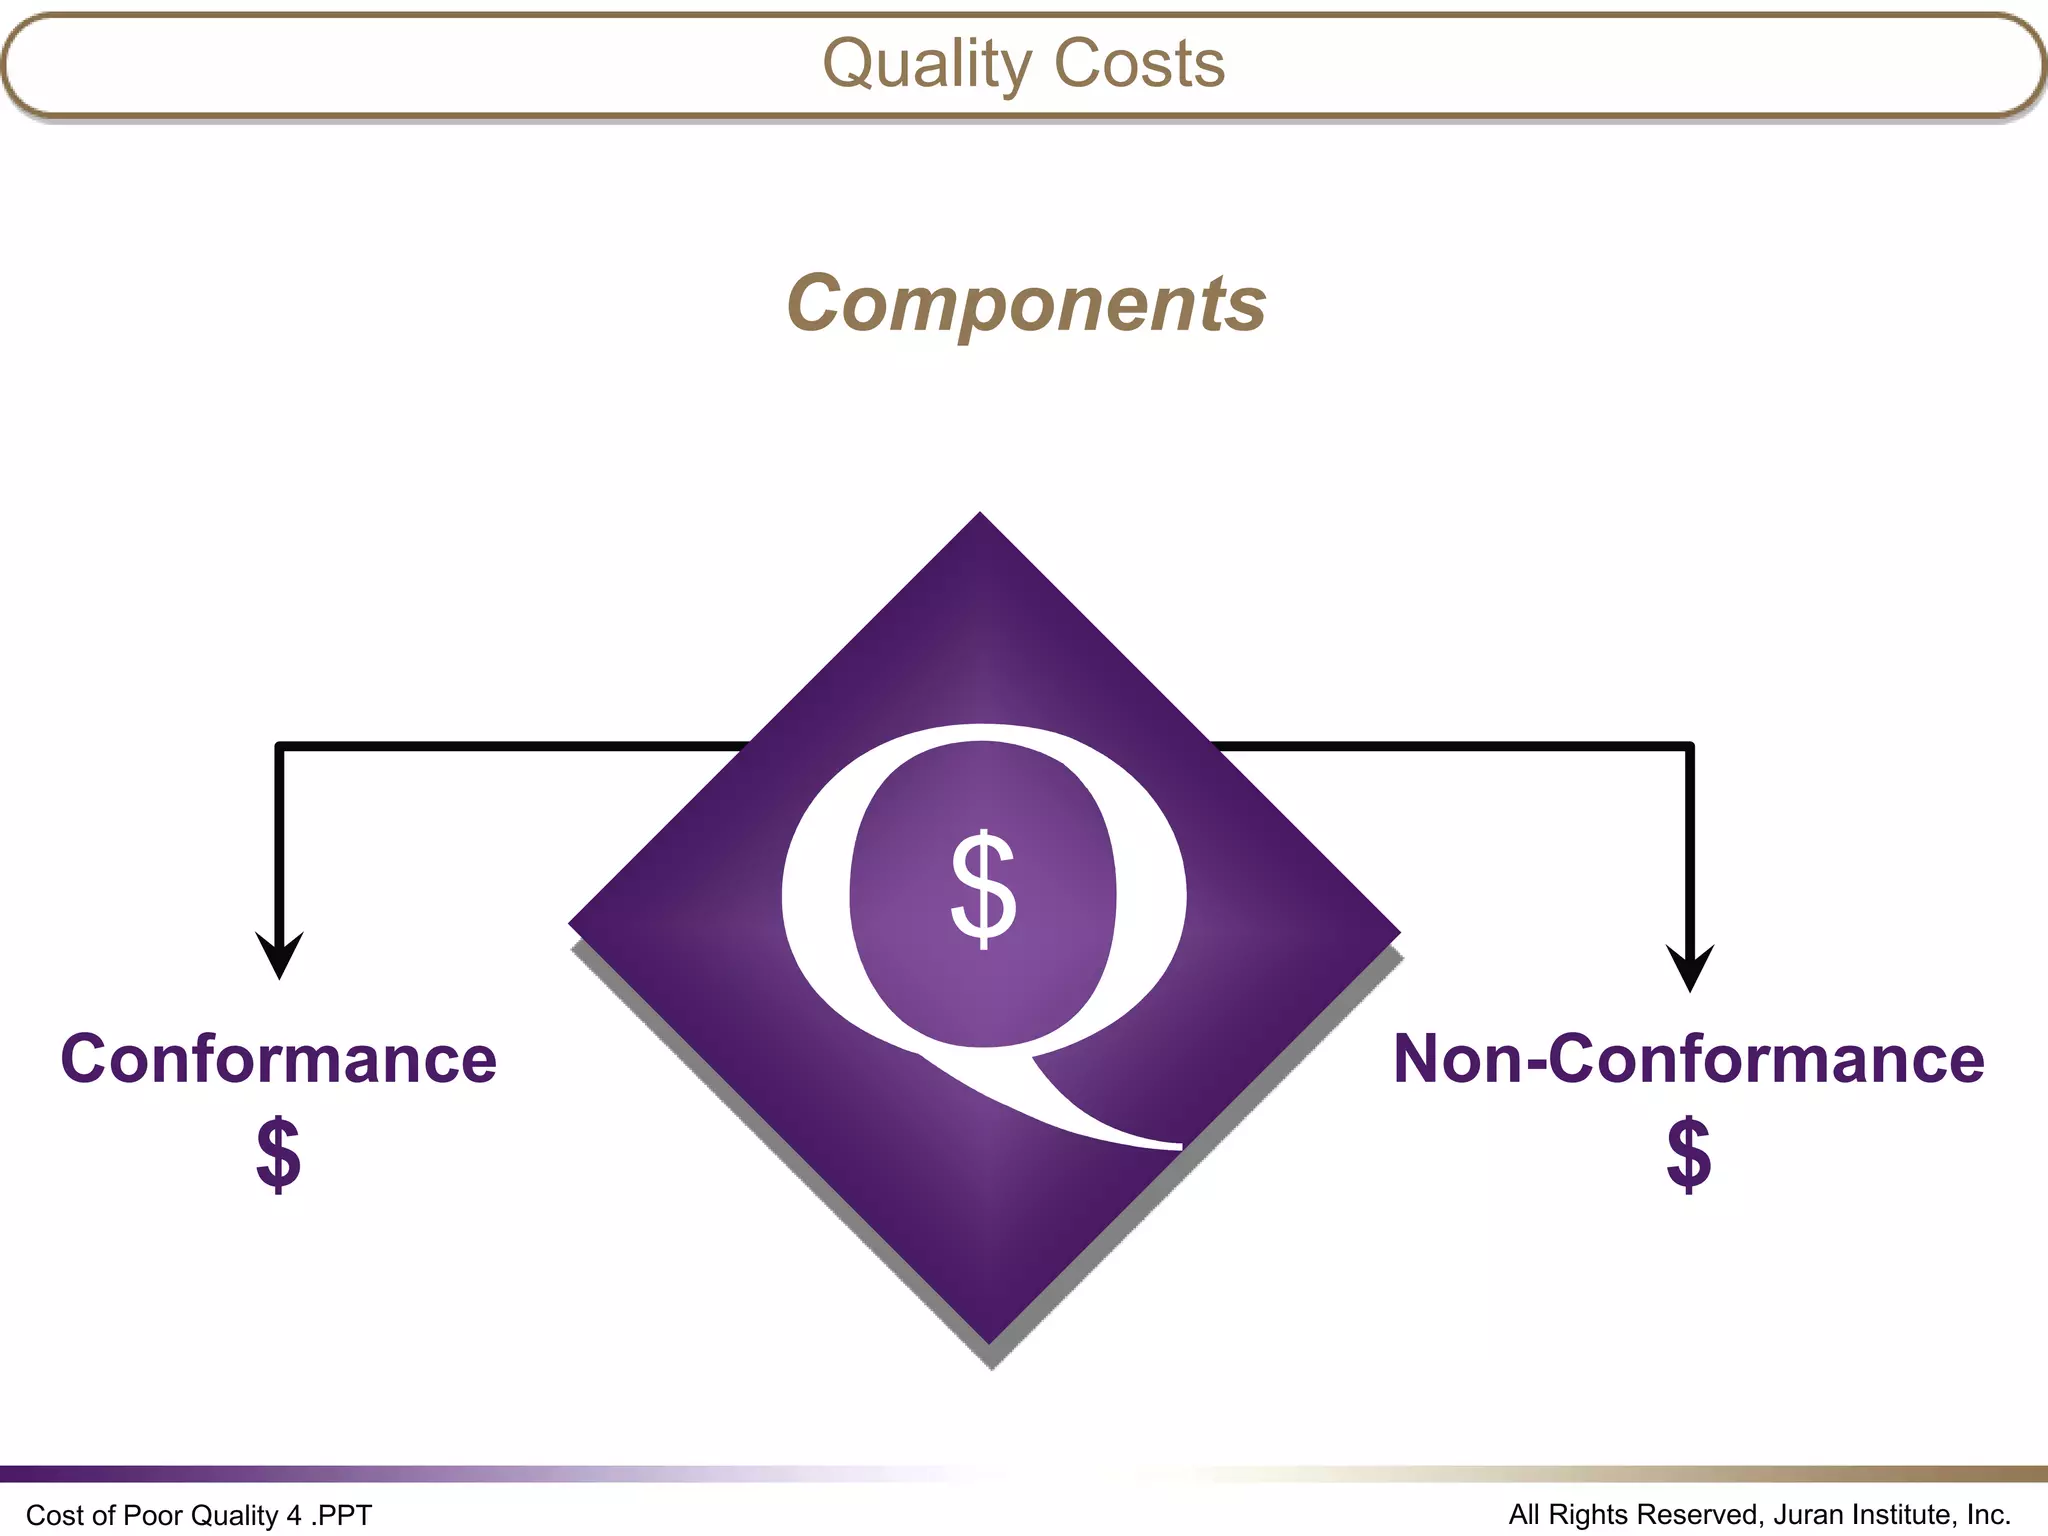
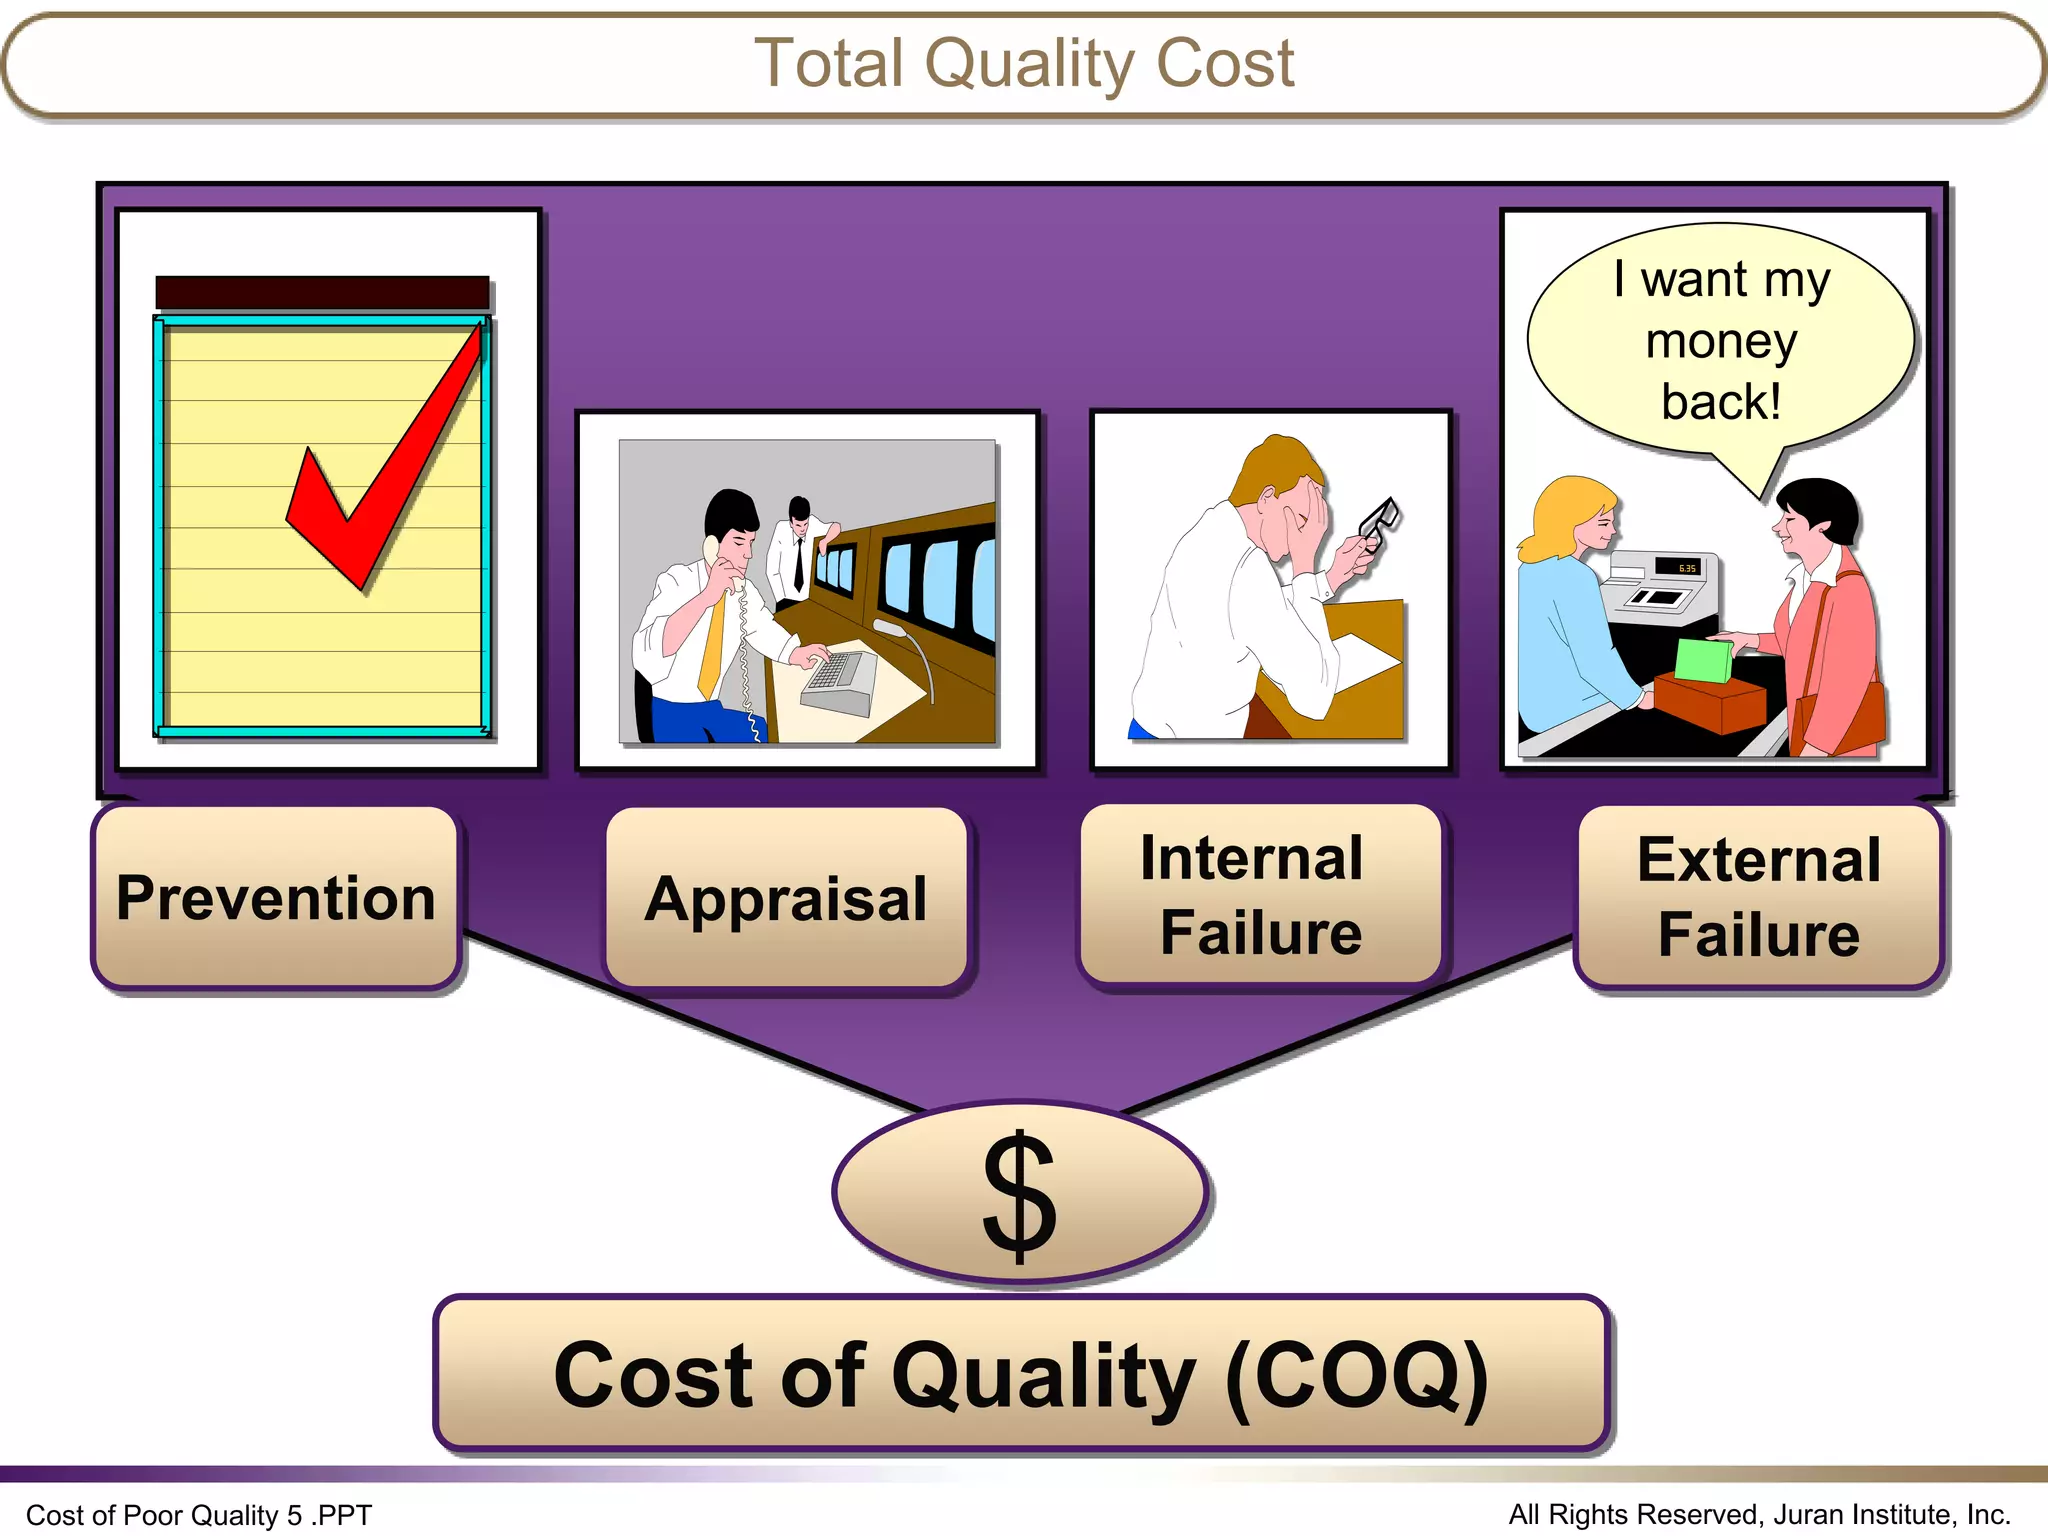
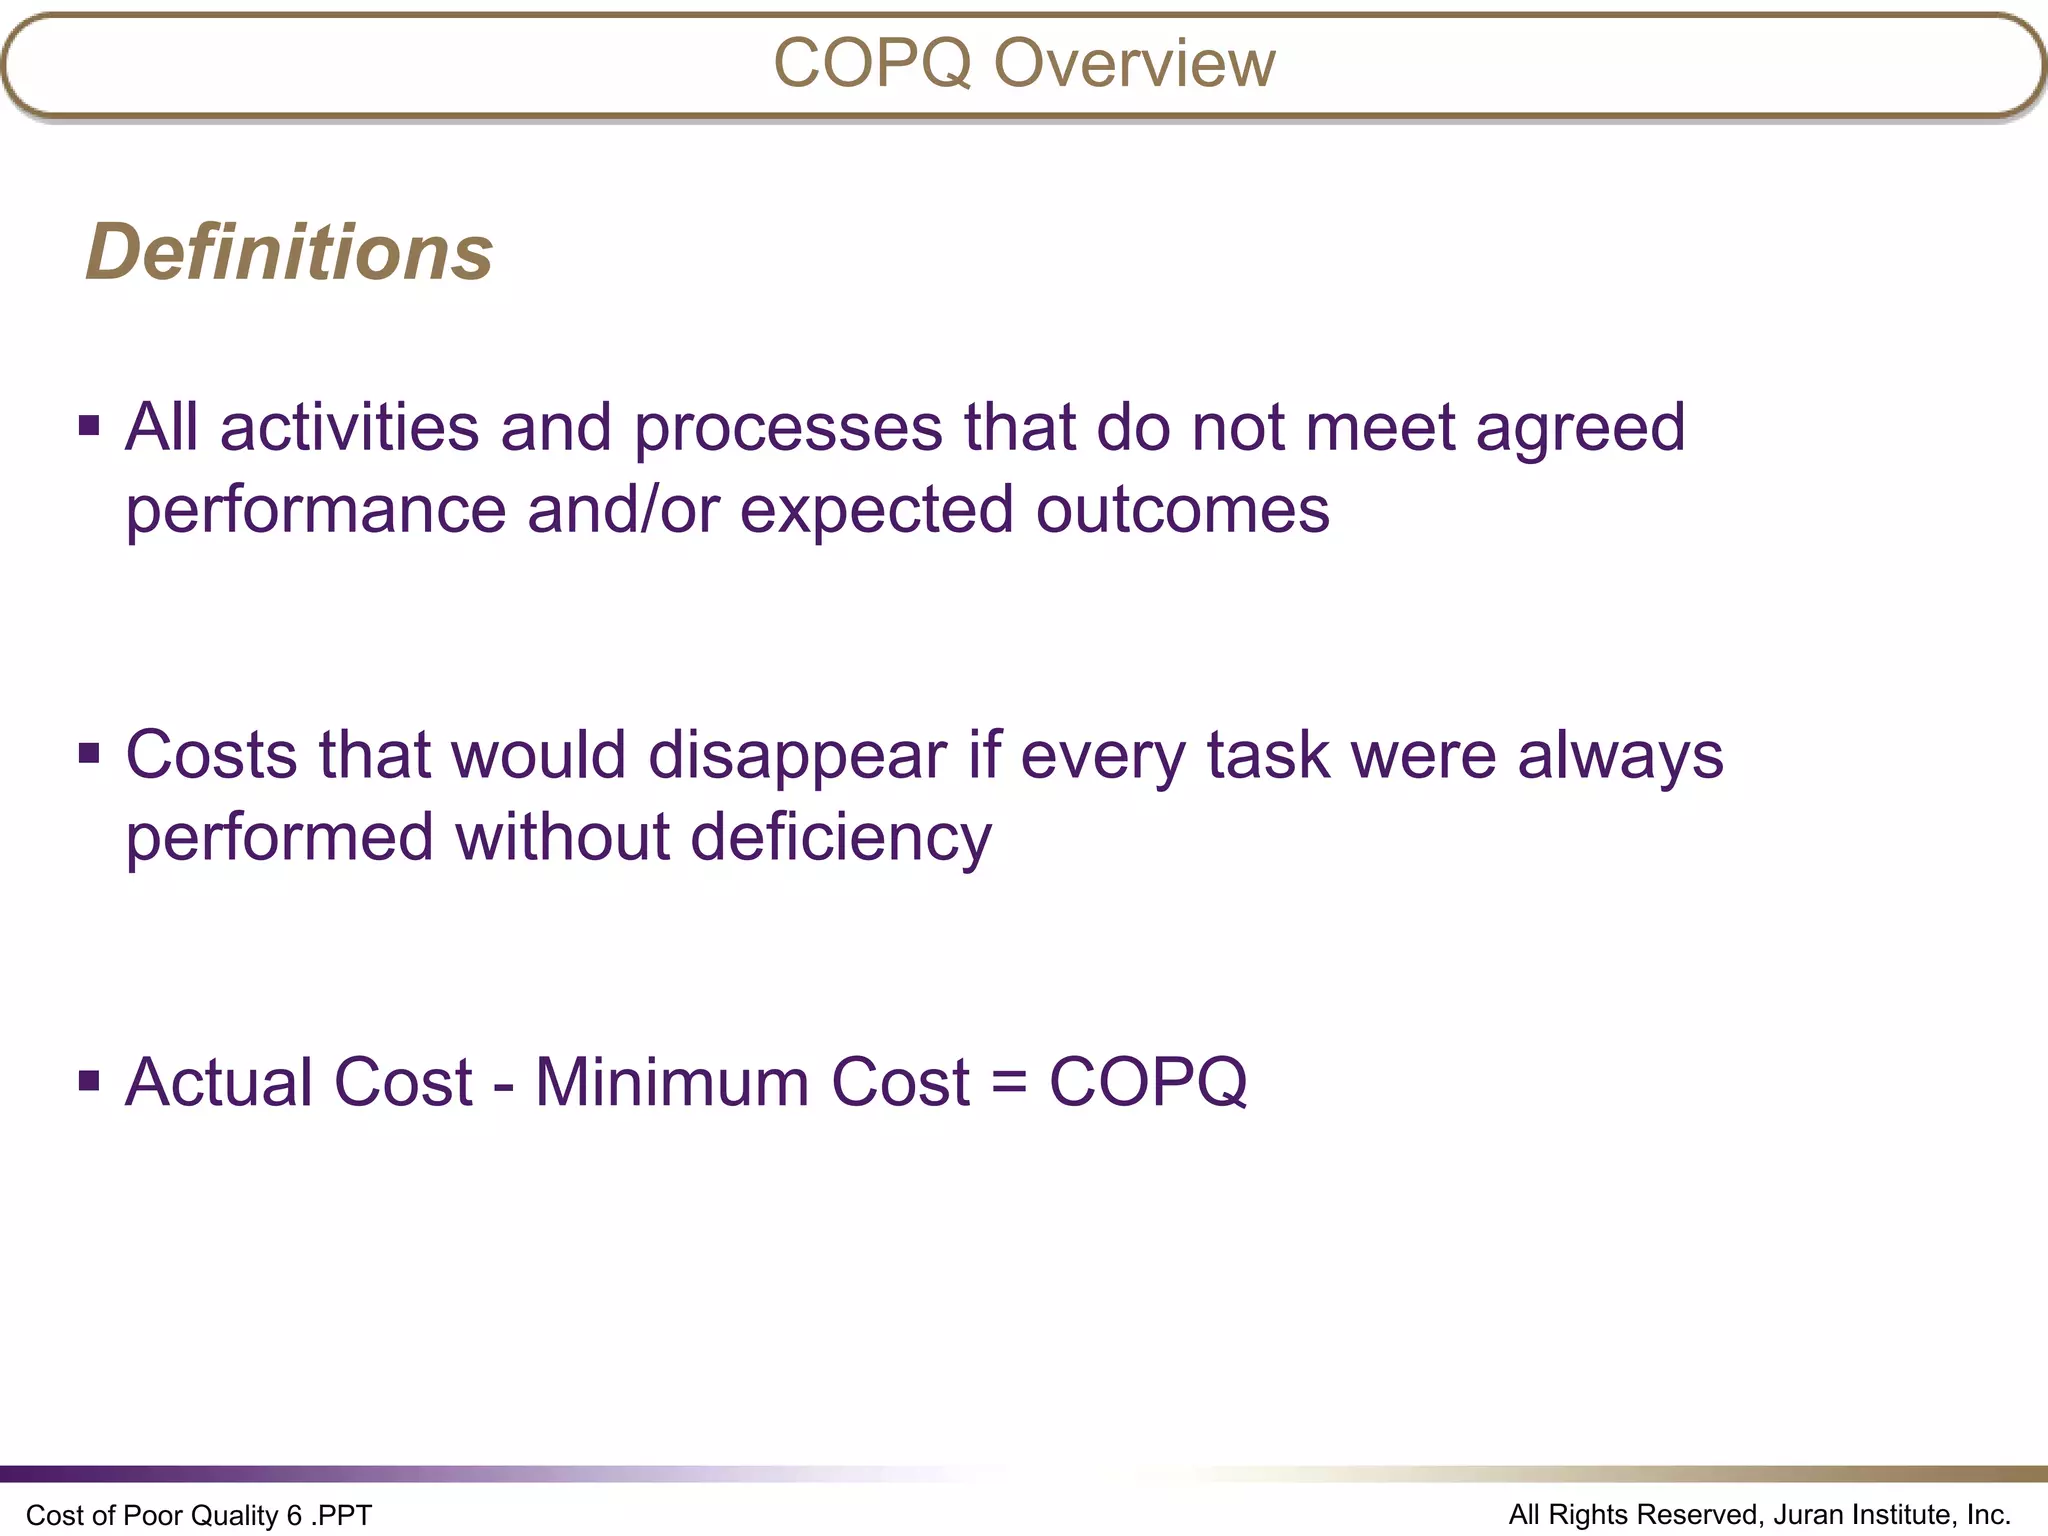

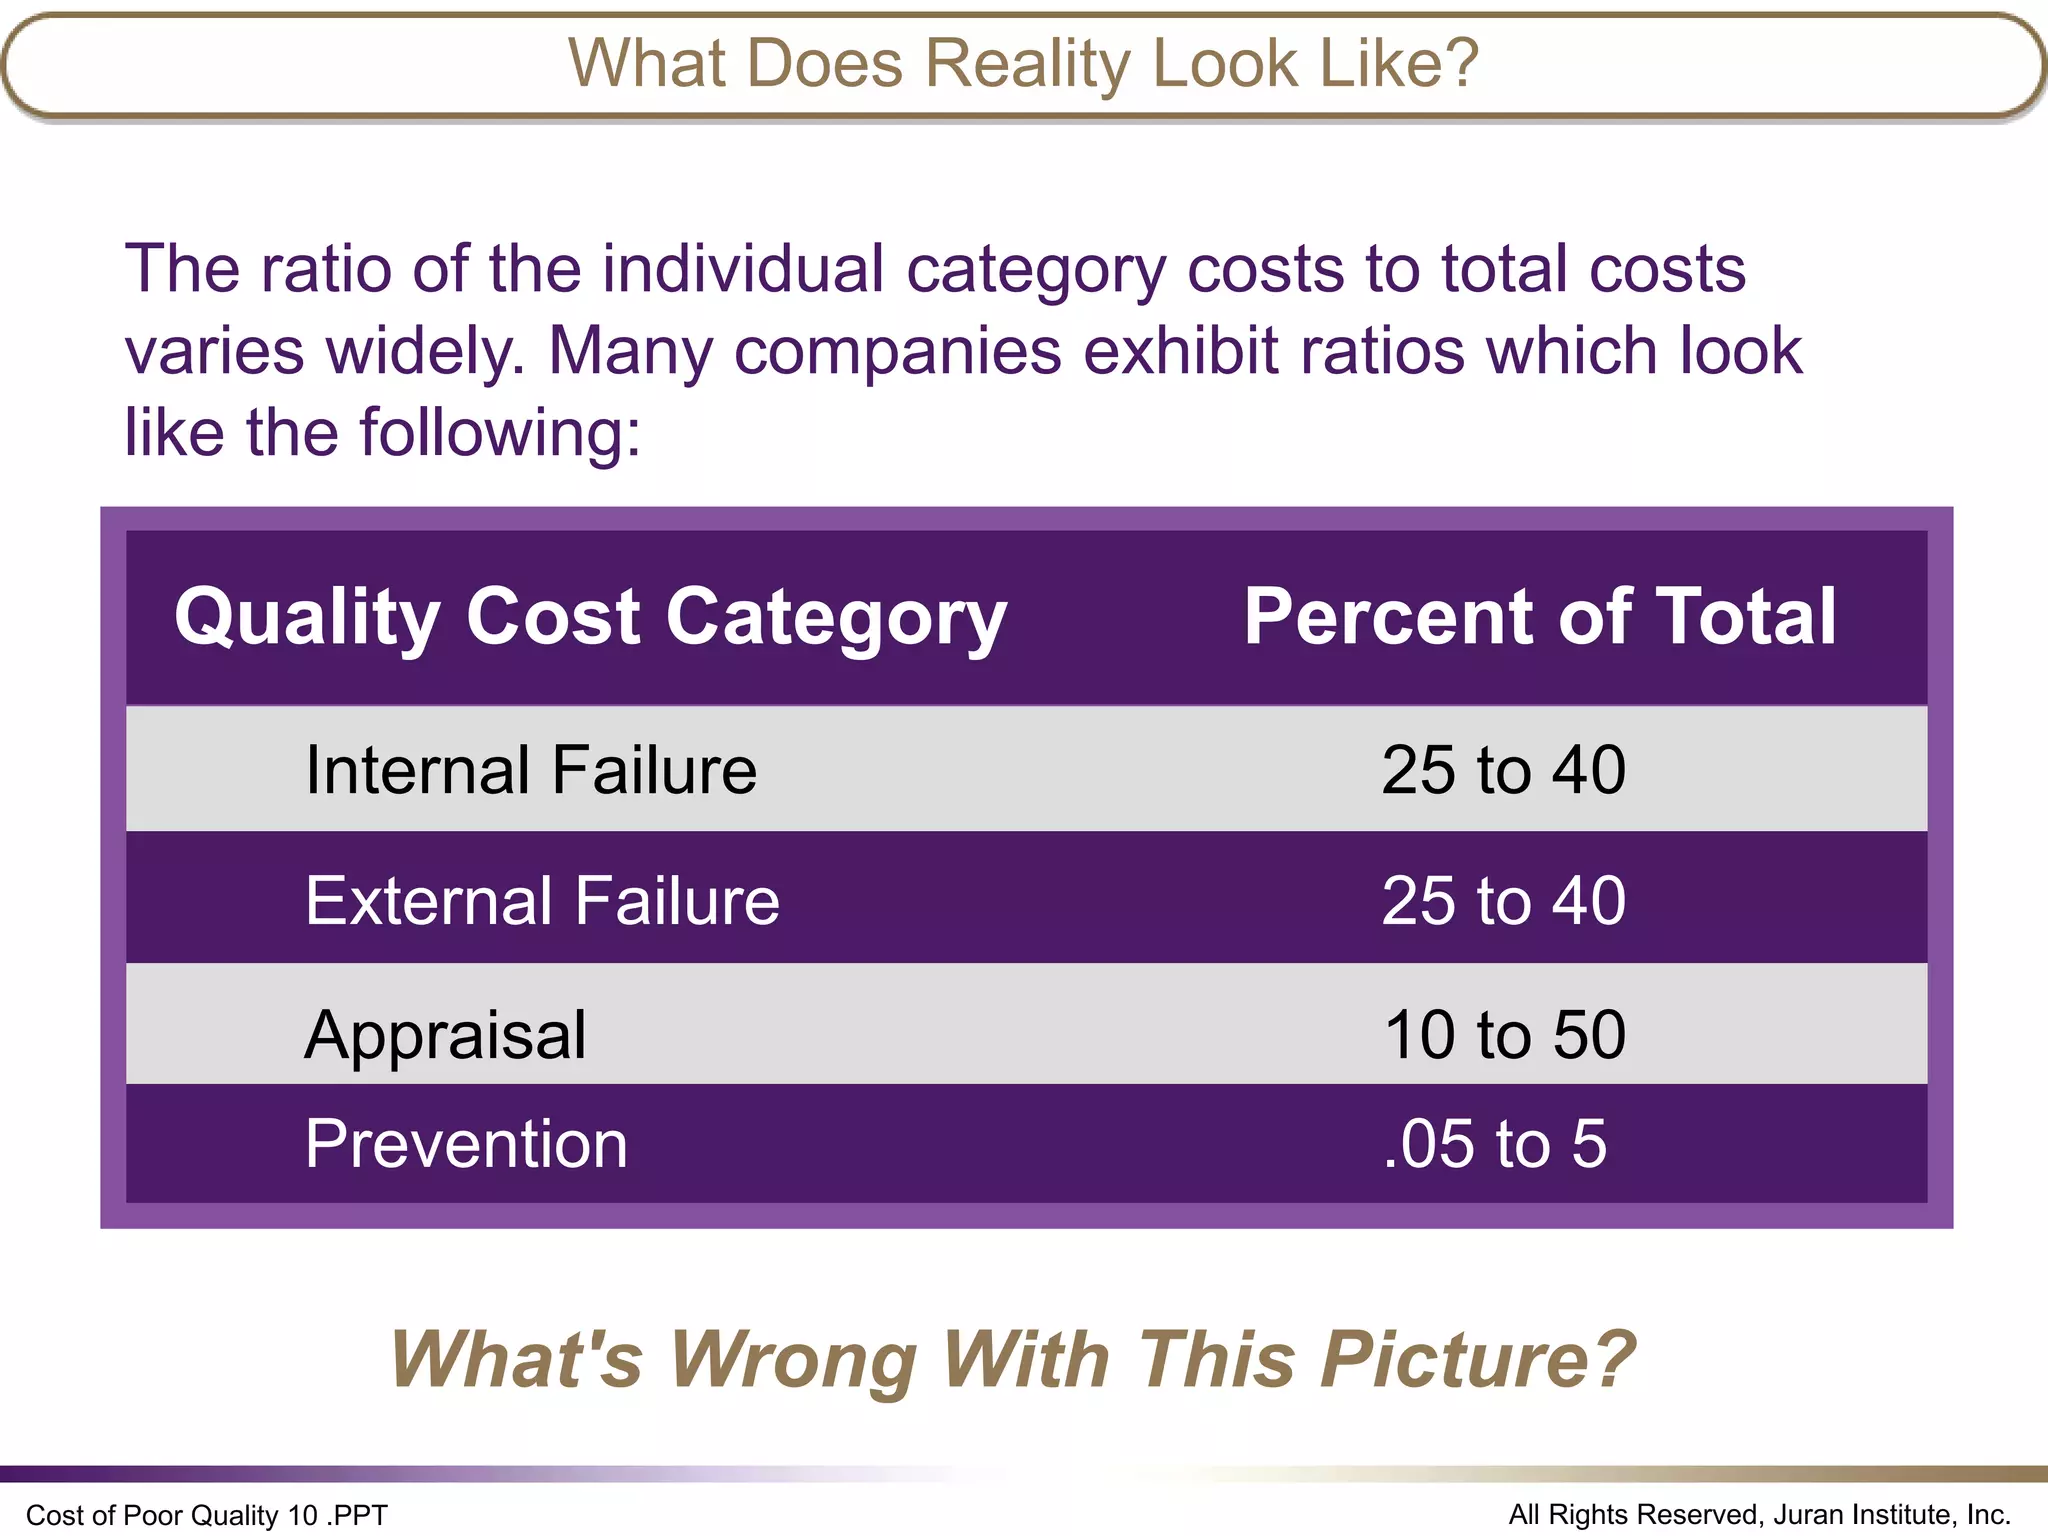


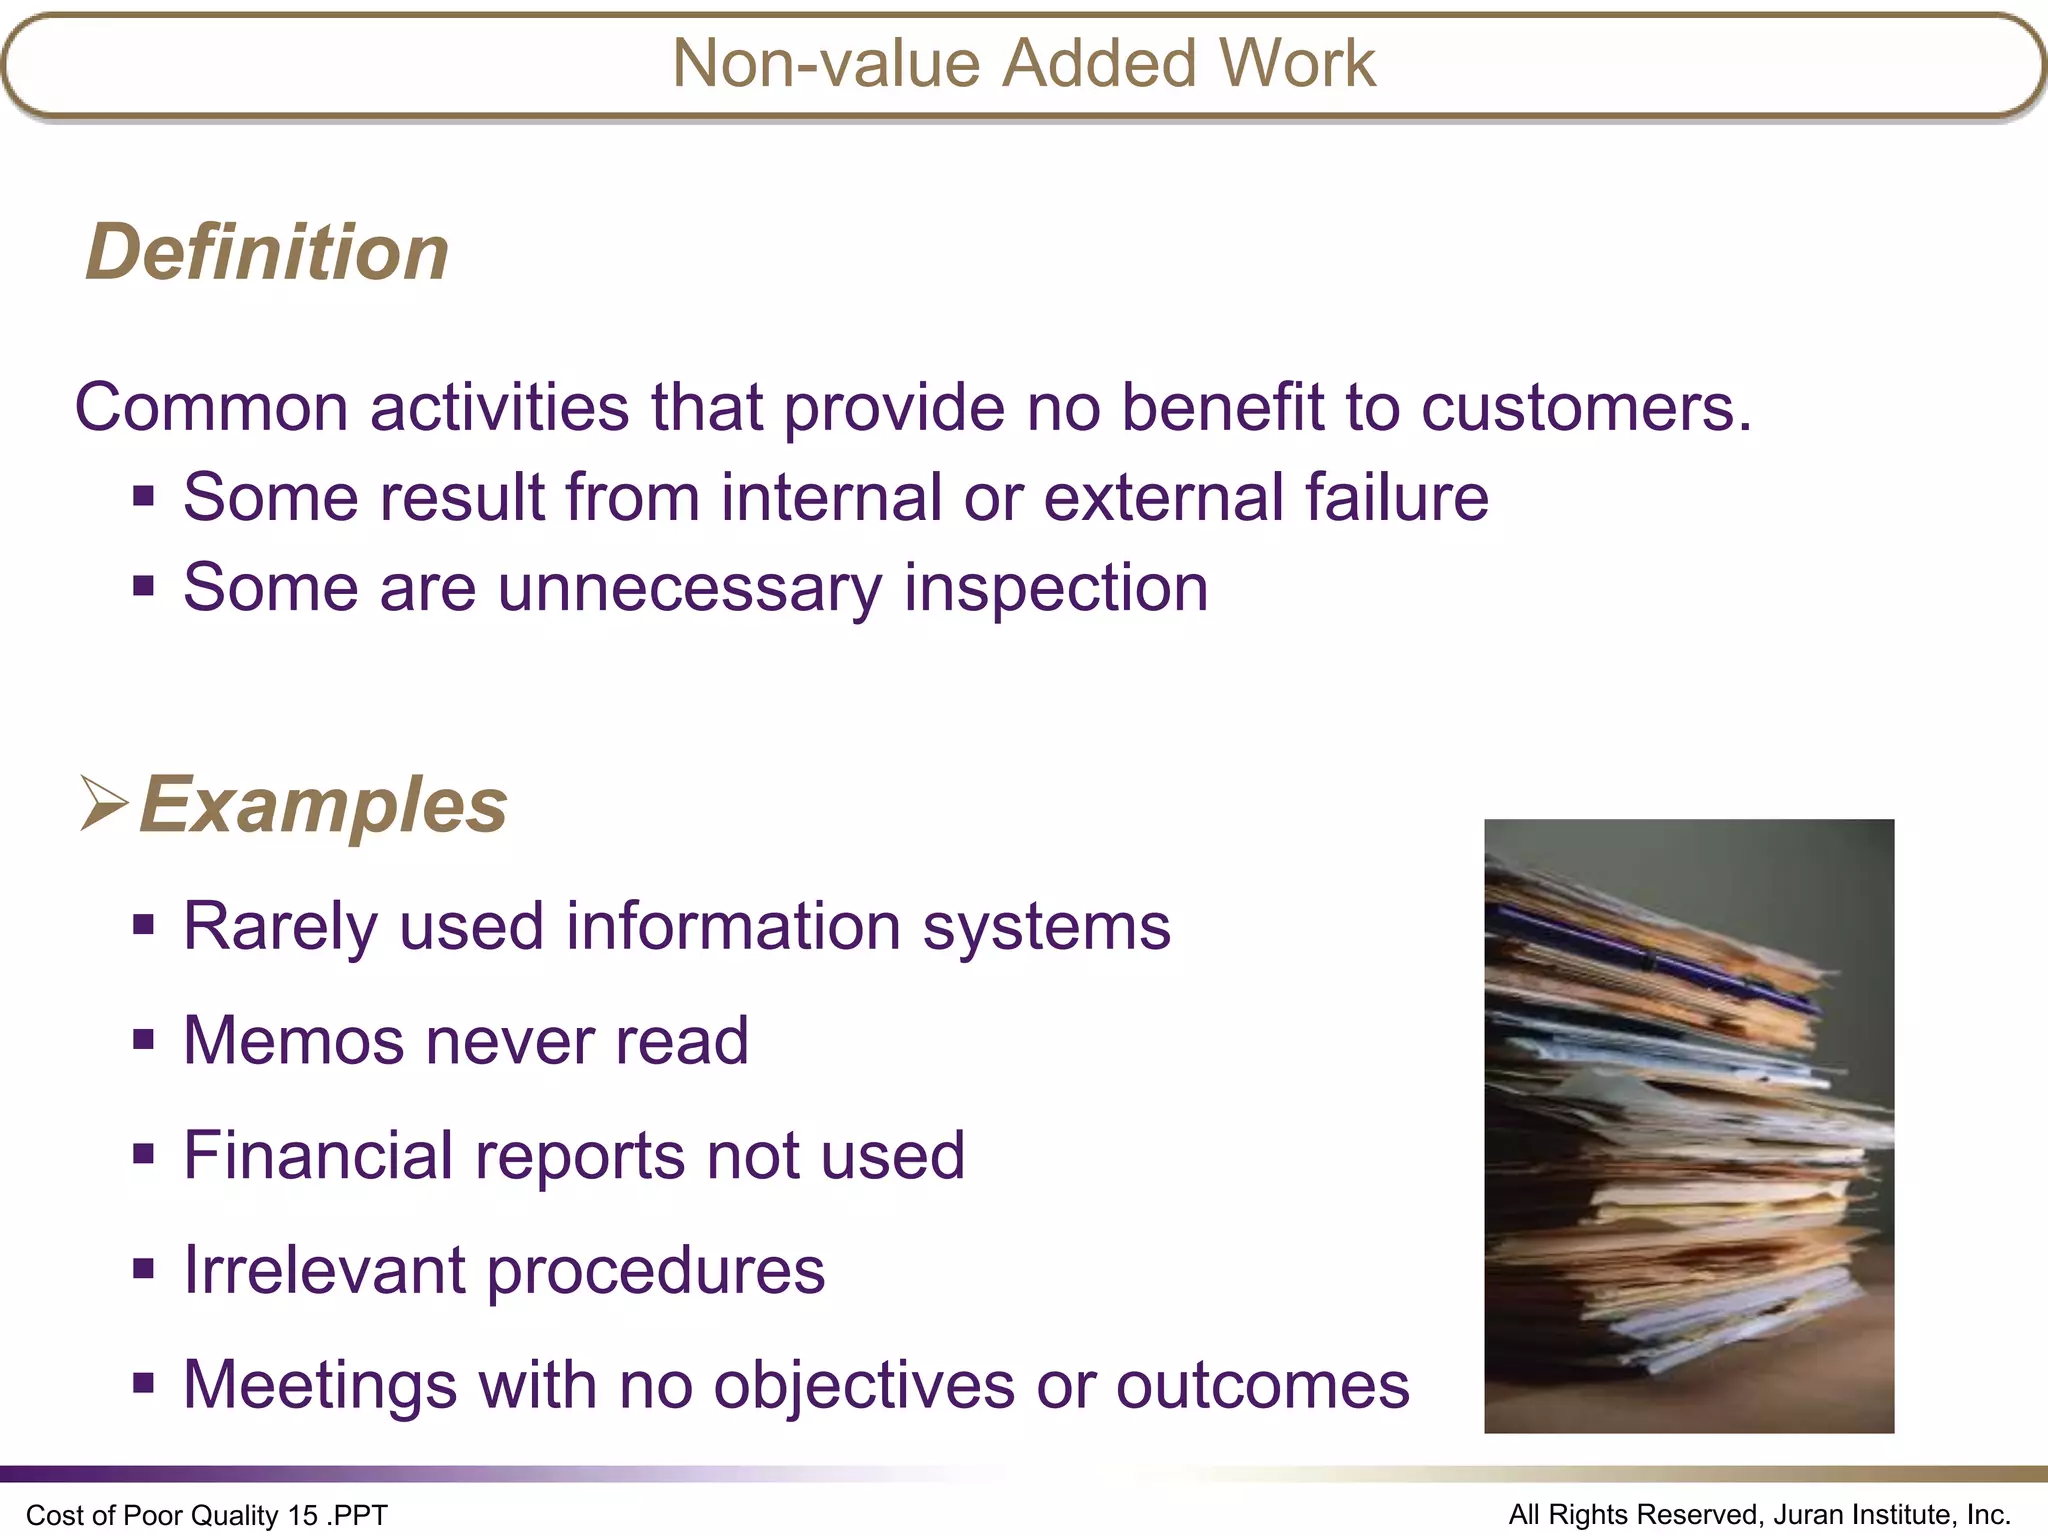
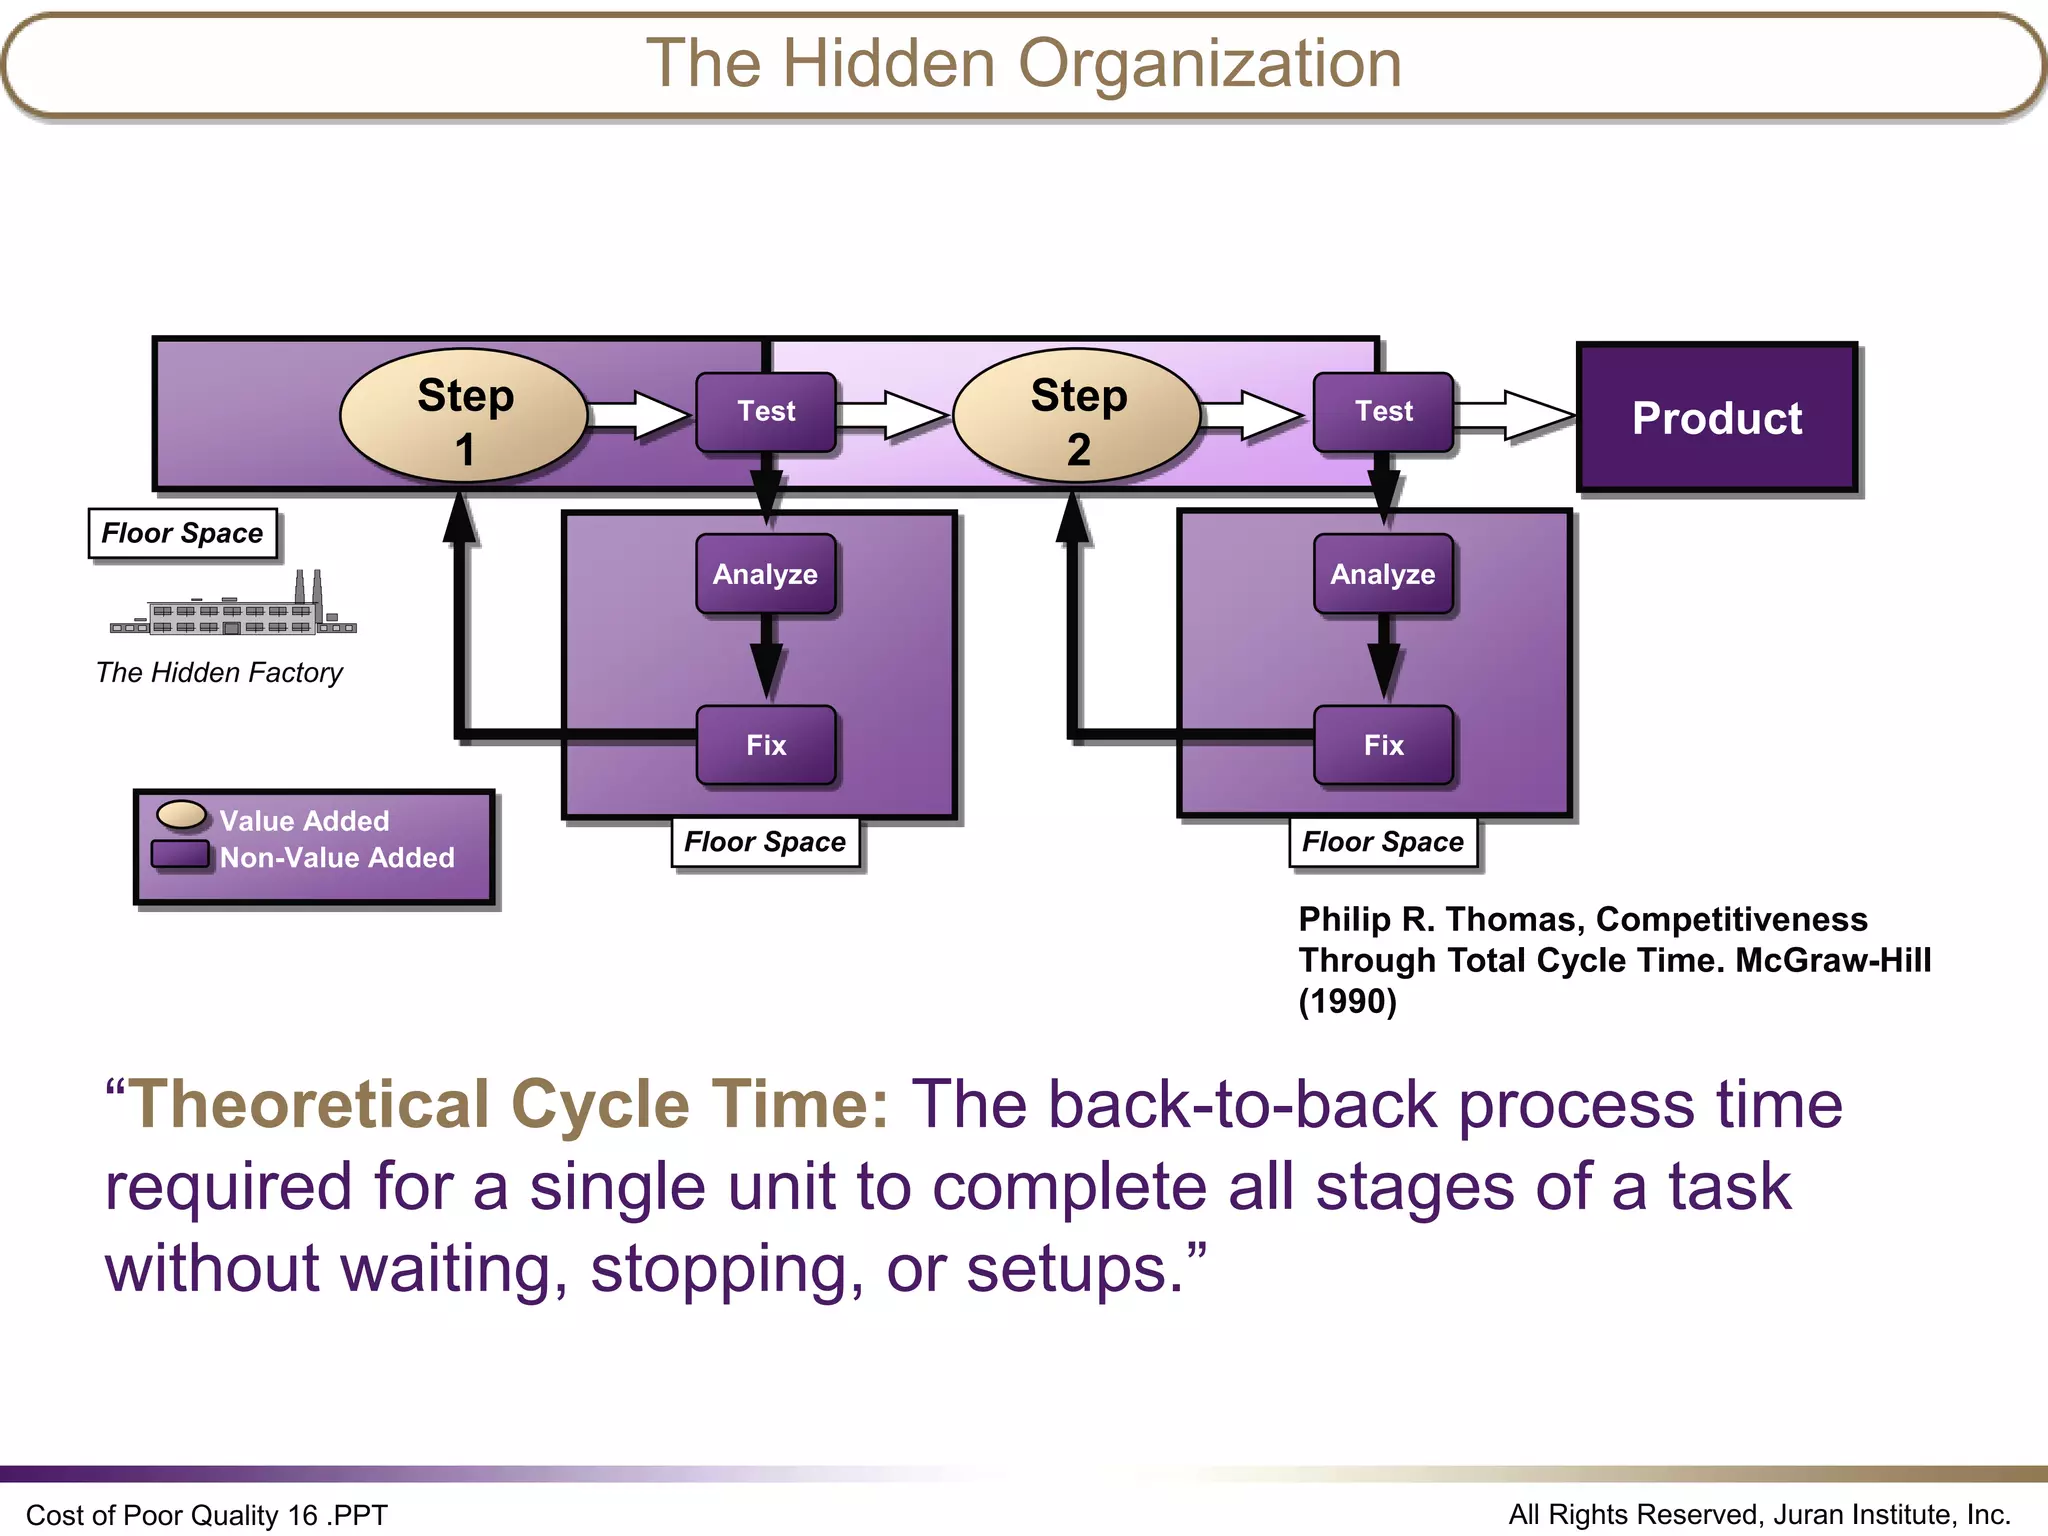

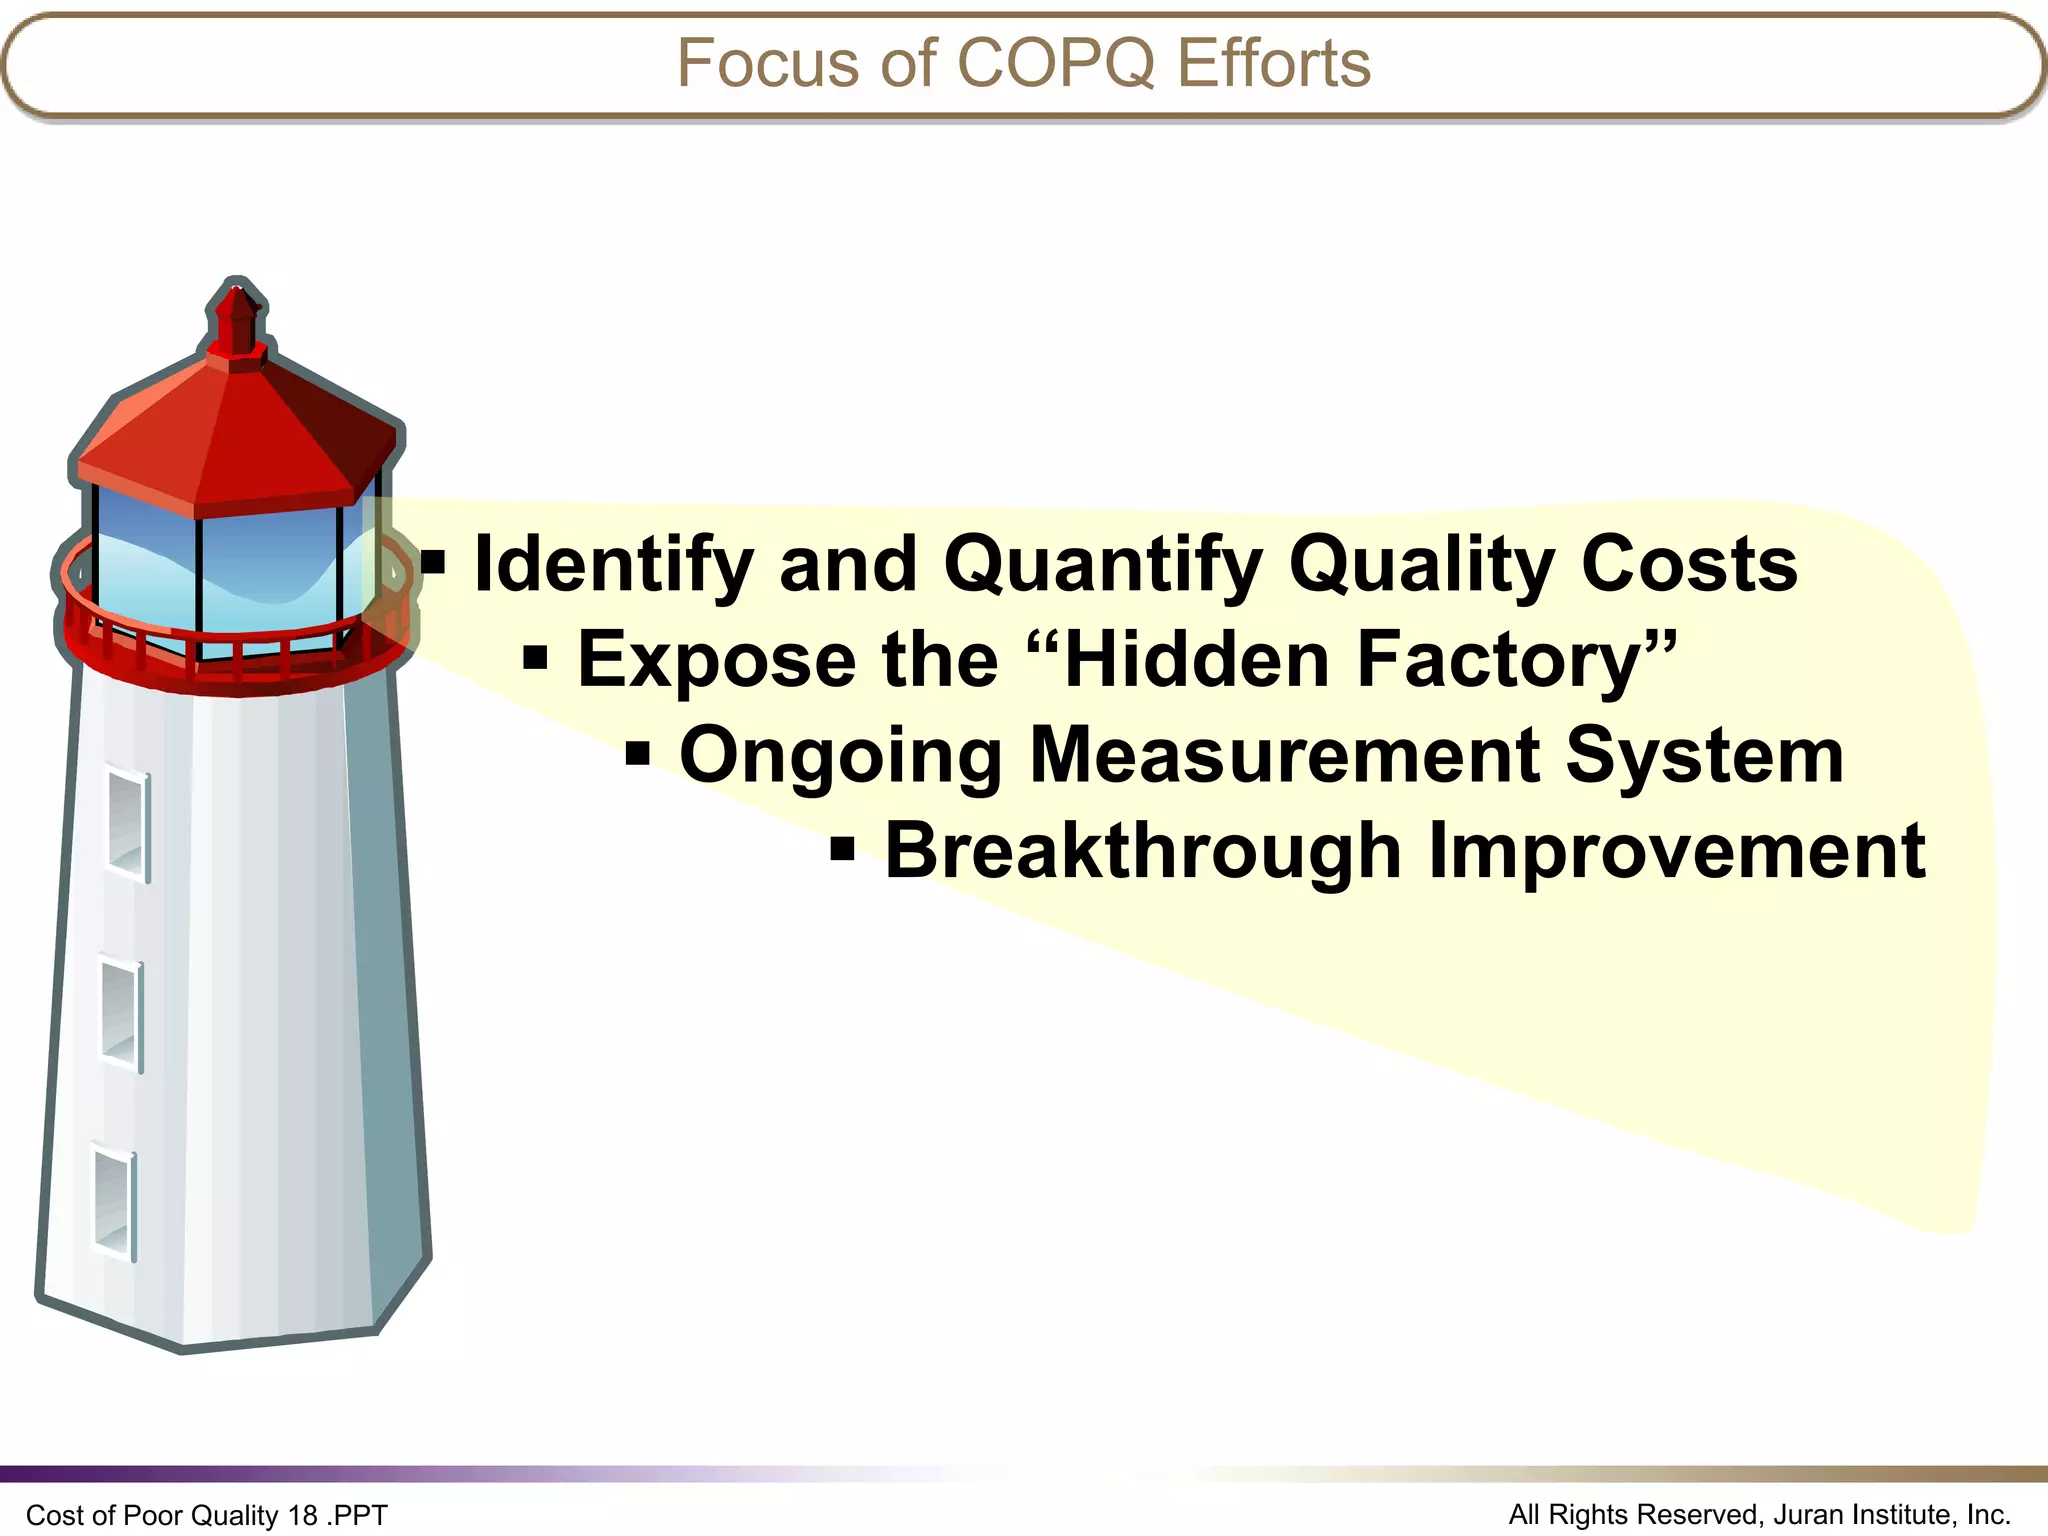
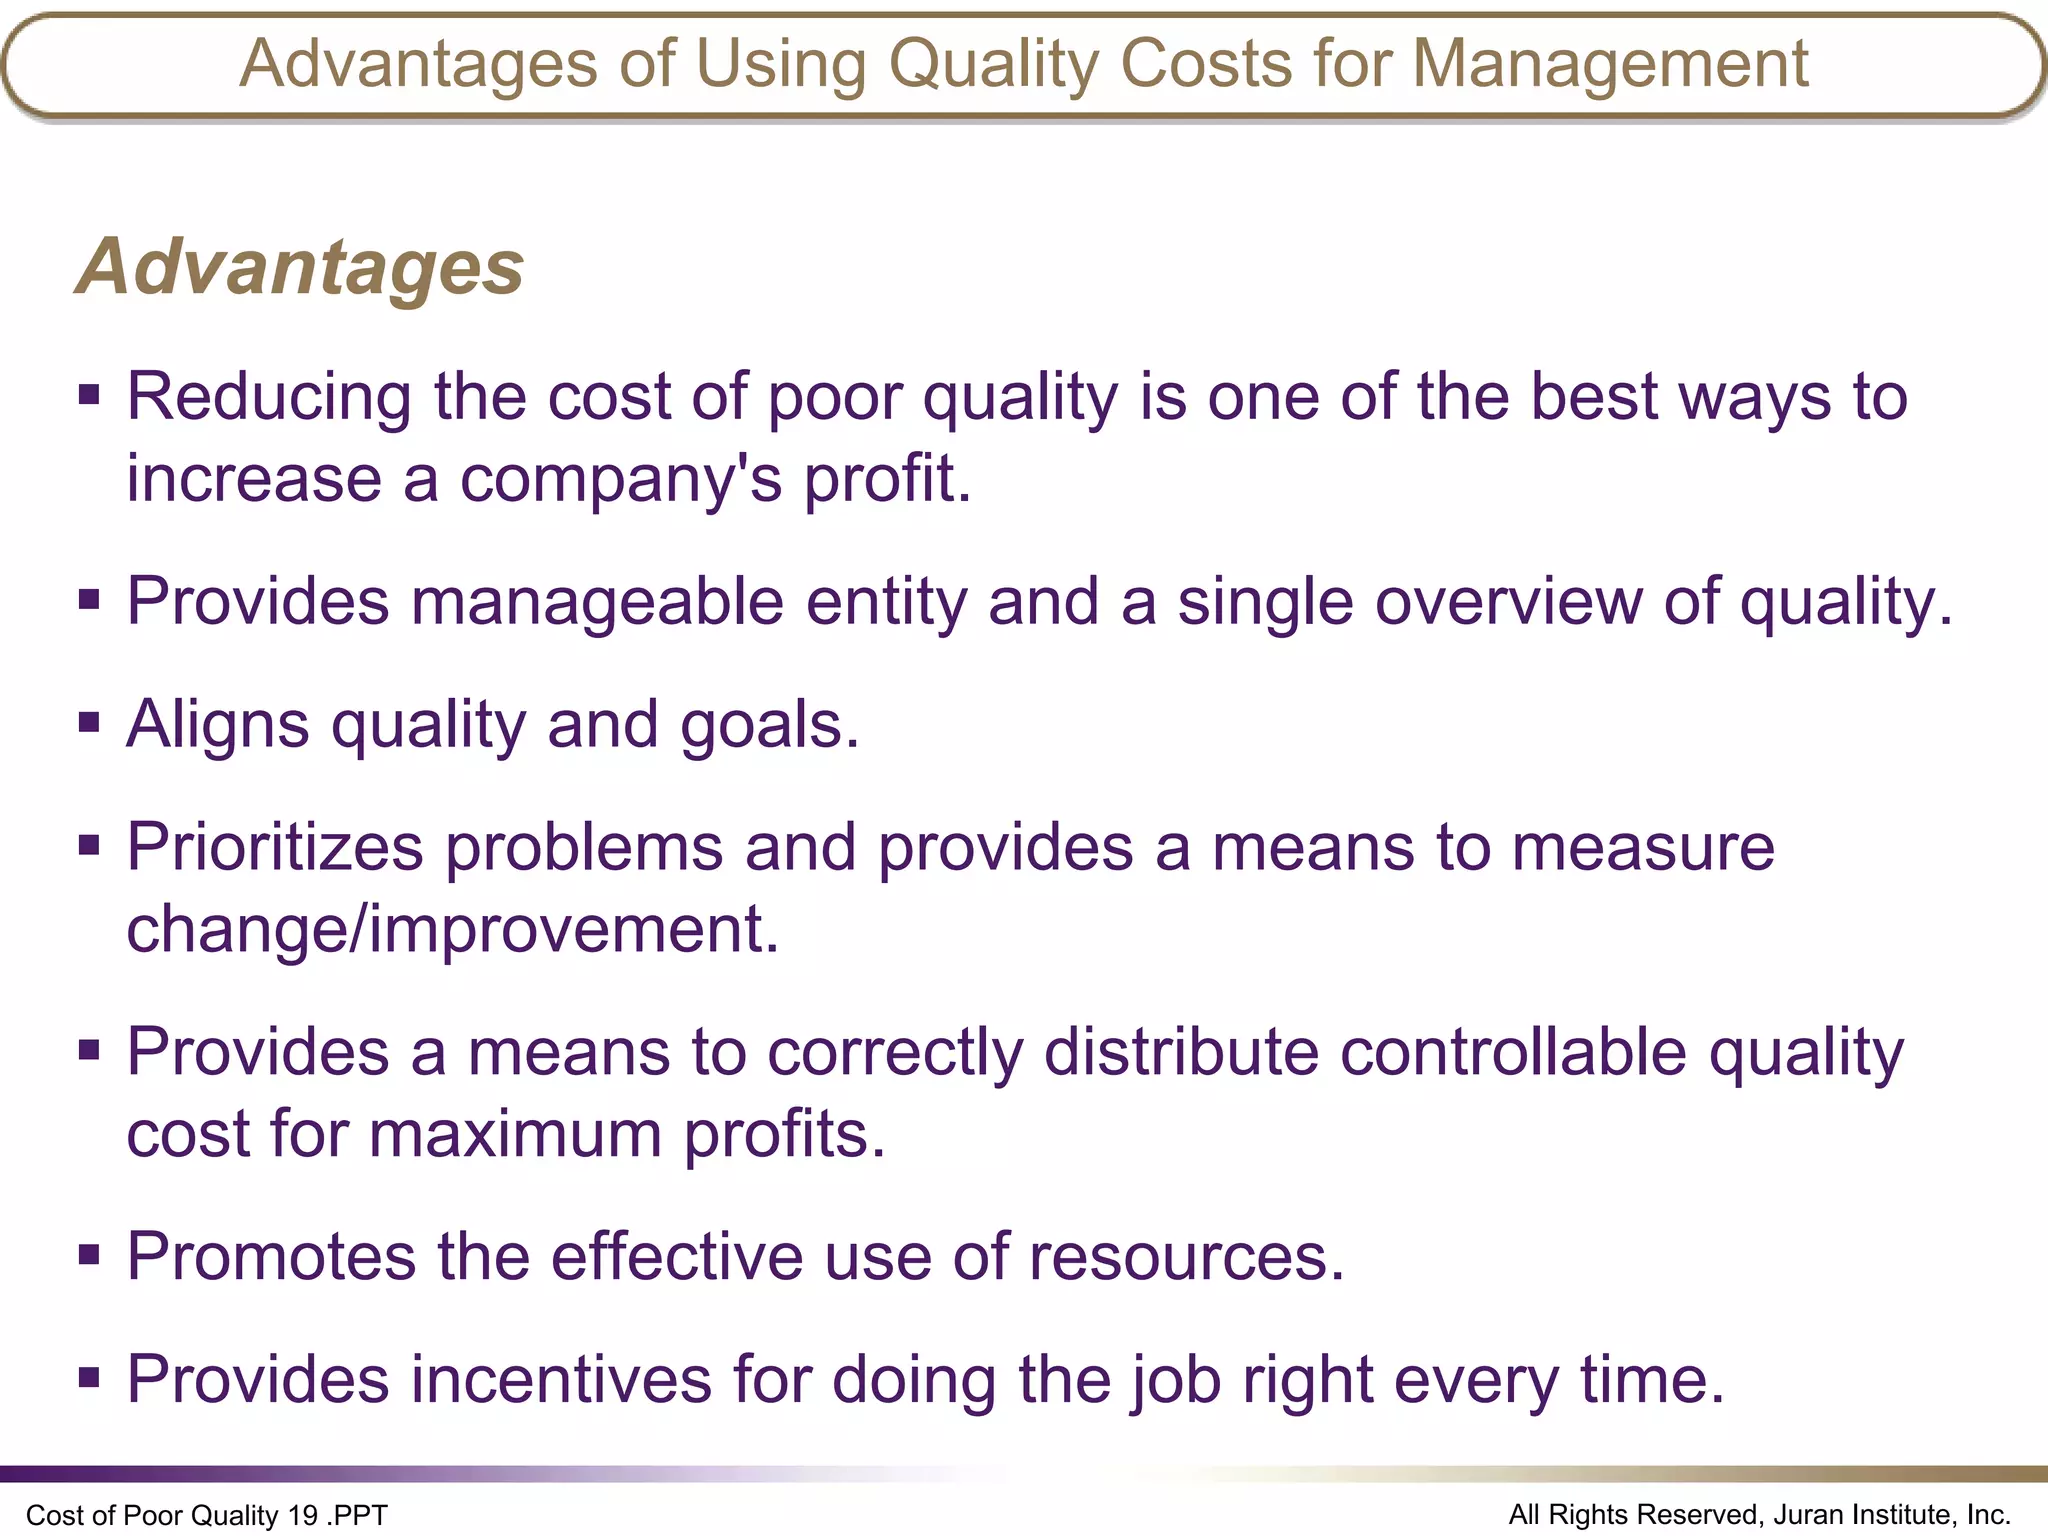

The document discusses the cost of poor quality (COPQ), which allows managers to quantify the financial impact of quality issues in terms that senior leaders understand. It defines COPQ categories like prevention, appraisal, internal failure, external failure, and provides examples of costs that fall under each category. Tracking COPQ provides benefits like prioritizing problems, measuring improvements, and incentivizing doing work right the first time.


![Suresh_Lulla-Presentation[1].pdf FOR VOLVO REQUIREMENT](https://cdn.slidesharecdn.com/ss_thumbnails/sureshlulla-presentation1-250506105147-60dbafce-thumbnail.jpg?width=640&height=640&fit=bounds)


