Downloaded 104 times


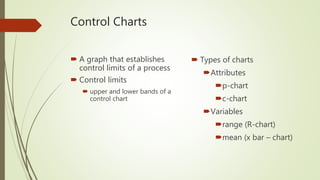
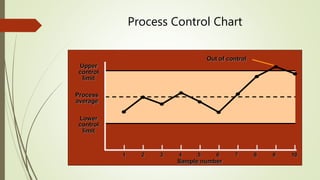
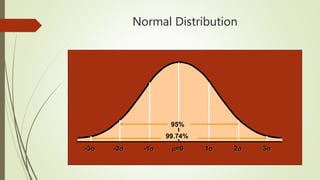
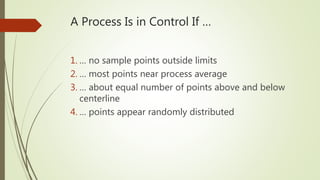
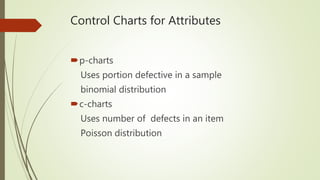
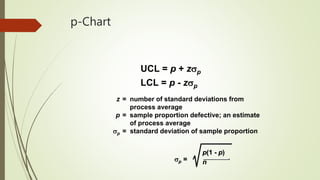
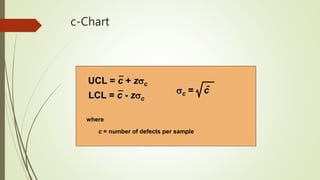
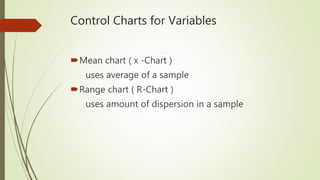
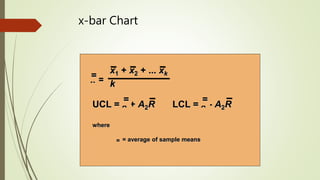
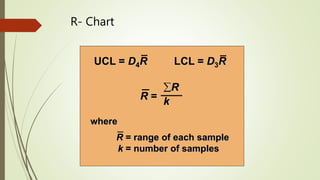
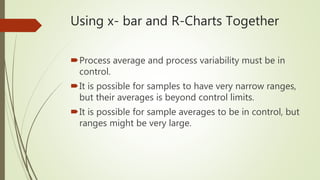
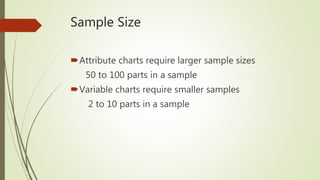

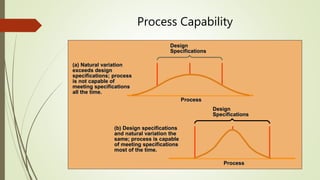
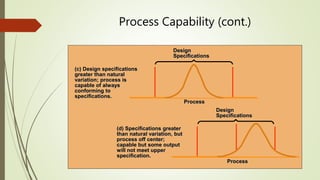
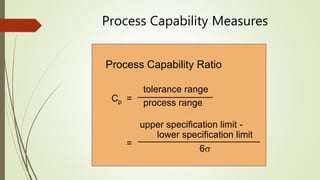
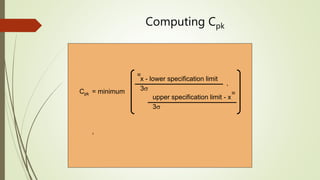
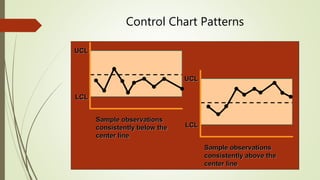
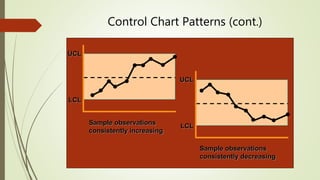
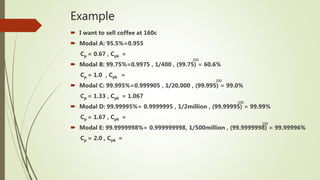


The document explains statistical process control (SPC) as a method for monitoring production processes to ensure quality through the use of control charts and understanding process capability. It highlights the historical development of SPC, its application in various industries, and the importance of continuous improvement in quality management. Additionally, the document details different types of control charts and their usage in identifying process variation and capability.


