Downloaded 105 times


![A
B
C
PART
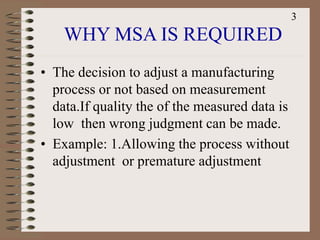
1 2 3 4 5 6 7 8 9 10
1 9.490 9.490 9.490 9.480 9.480 9.470 9.480 9.470 9.490 9.480 9.482
2 9.490 9.480 9.490 9.490 9.480 9.480 9.490 9.490 9.490 9.490 9.487
3 9.490 9.480 9.490 9.490 9.480 9.480 9.490 9.490 9.490 9.490 9.487
9.490 9.483 9.490 9.487 9.480 9.477 9.487 9.483 9.490 9.487 Xa= 9.4853
0.000 0.010 0.000 0.010 0.000 0.010 0.010 0.020 0.000 0.010 Ra= 0.0070
1 9.470 9.470 9.480 9.470 9.460 9.480 9.490 9.480 9.480 9.470 9.475
2 9.490 9.470 9.470 9.490 9.480 9.490 9.480 9.480 9.480 9.480 9.481
3 9.470 9.470 9.490 9.470 9.480 9.480 9.490 9.470 9.480 9.490 9.479
9.477 9.470 9.480 9.477 9.473 9.483 9.487 9.477 9.480 9.480 Xb= 9.4783
0.020 0.000 0.020 0.020 0.020 0.010 0.010 0.010 0.000 0.020 Rb= 0.0130
1 9.470 9.470 9.480 9.480 9.470 9.480 9.470 9.470 9.470 9.460 9.472
2 9.480 9.460 9.470 9.470 9.470 9.480 9.470 9.470 9.480 9.480 9.473
3 9.480 9.480 9.470 9.480 9.470 9.470 9.480 9.480 9.470 9.470 9.475
AVERAGE 9.477 9.470 9.473 9.477 9.470 9.477 9.473 9.473 9.473 9.470 Xc= 9.4733
RANGE 0.010 0.020 0.010 0.010 0.000 0.010 0.010 0.010 0.010 0.020 Rc= 0.0110
PART AVERAGE (Xp) 9.481 9.474 9.481 9.480 9.474 9.479 9.482 9.478 9.481 9.479 Rp= 0.0078
Xp = 9.4790
R = 0.0103
X Diff = Max X - Min X X Diff= 0.0120
UCL (R) = D4 X R D4 = 2.575 0.0266
LCL (R) = D3 X R D3 = 0.000 0
UCL (x ) = [Xp + A2R] A2 = 1.023 9.4896
LCL (x ) = [Xp - A2R] 9.4684
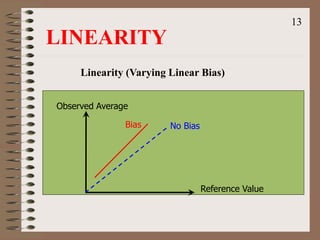
AVERAGE
RANGE
C
Xp = [ Xa + Xb +Xc] / 3
A
AVERAGE
RANGE
B
OPERATOR TRIAL NO. AVERAGE
Specification Gauge Least Count 0.02mm
Characteristic Gauge Type -----
Part Name Fuel pump Gauge Name V.C
GAUGE REPEATABILITY AND REPRODUCIBILITY DATA SHEET
Part No. HA196100-3101 Gauge No. XXXXX Operator Name (s)
R = [ Ra + Rb +Rc] / 3
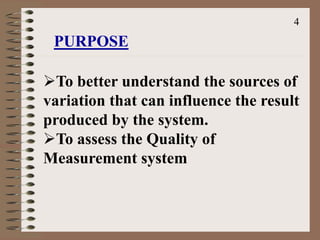
17](https://image.slidesharecdn.com/msatraining-191018130659/85/Msa-training-17-320.jpg)
![Doc. No. Written
Line Name
Date YYYY MM DD
No. of Trials 3 3 10
1
2
3
R
REPEATABILITY - EQUIPMENT VARIATION (EV)
R = 0.0103 % EV = 100 [EV/TV]
K1 = 3.05 Trials K1
EV = R X K1 2 4.56 = 68%
= 0.031517 3 3.05
REPRODUCIBILITY - APPRAISAR VARIATION (AV)
X Diff = 0.012 % AV = 100[AV/TV]
K2 = 2.70
= 68%
AV = SQRT OF [(X Diff X K2) - (EV / n x r) ]
= 0.032
Note: n = number of parts; r = no. of trials
2 3
3.65 2.70
REPRODUCIBILITY & REPEATABILITY (R&R)
%R&R = 100[R&R/TV]
R&R = SQRT OF ( EV + AV )
= 0.045 = 96%
PART VARIATION (PV) Parts (n) K 3
2 3.65 % PV = 100[PV/TV]
Rp = 0.008 3 2.70
K3 = 1.62 4 2.30 = 27%
5 2.08
PV = Rp X K3 6 1.93
= 0.0126 7 1.82
8 1.74
9 1.67
10 1.62
TOTAL VARIATION (TV)
TV = SQRT OF (R&R + PV )
= 0.0466
PERFORMED BY : DATE :
MEASUREMENT UNIT ANALYSIS % PROCESS VARIATION
No. of Operators
K 2
From Data Sheet:
0.0103 X diff 0.012 Rp 0.008
Specification 0.6 ~ 1.0mm
Characteristic Gauge Type
Operator Name (s)
Part Name Gauge Name
Part No. Gauge No.
No. of operators No. of Parts
GAUGE REPEATABILITY AND REPRODUCIBILITY ANALYSIS REPORT
Rev. No. Approved Checked
22
22
2 2
18](https://image.slidesharecdn.com/msatraining-191018130659/85/Msa-training-18-320.jpg)


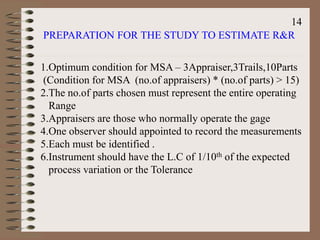
The document discusses measurement system analysis (MSA) which is used to evaluate measurement systems and understand sources of variation. Key points: - MSA assesses measurement quality and identifies sources of error like bias, repeatability, reproducibility, stability, and linearity. - It is required to make informed process adjustments and avoid wrong decisions from low quality measurement data. - MSA studies involve multiple appraisers measuring multiple parts multiple times to calculate variation percentages. - A sample MSA study shows data collection, calculations for repeatability, reproducibility, and overall variation to evaluate the measurement system.


![Rodebaugh sixsigma[1]](https://cdn.slidesharecdn.com/ss_thumbnails/rodebaugh-sixsigma1-191102025225-thumbnail.jpg?width=640&height=640&fit=bounds)


