Downloaded 325 times
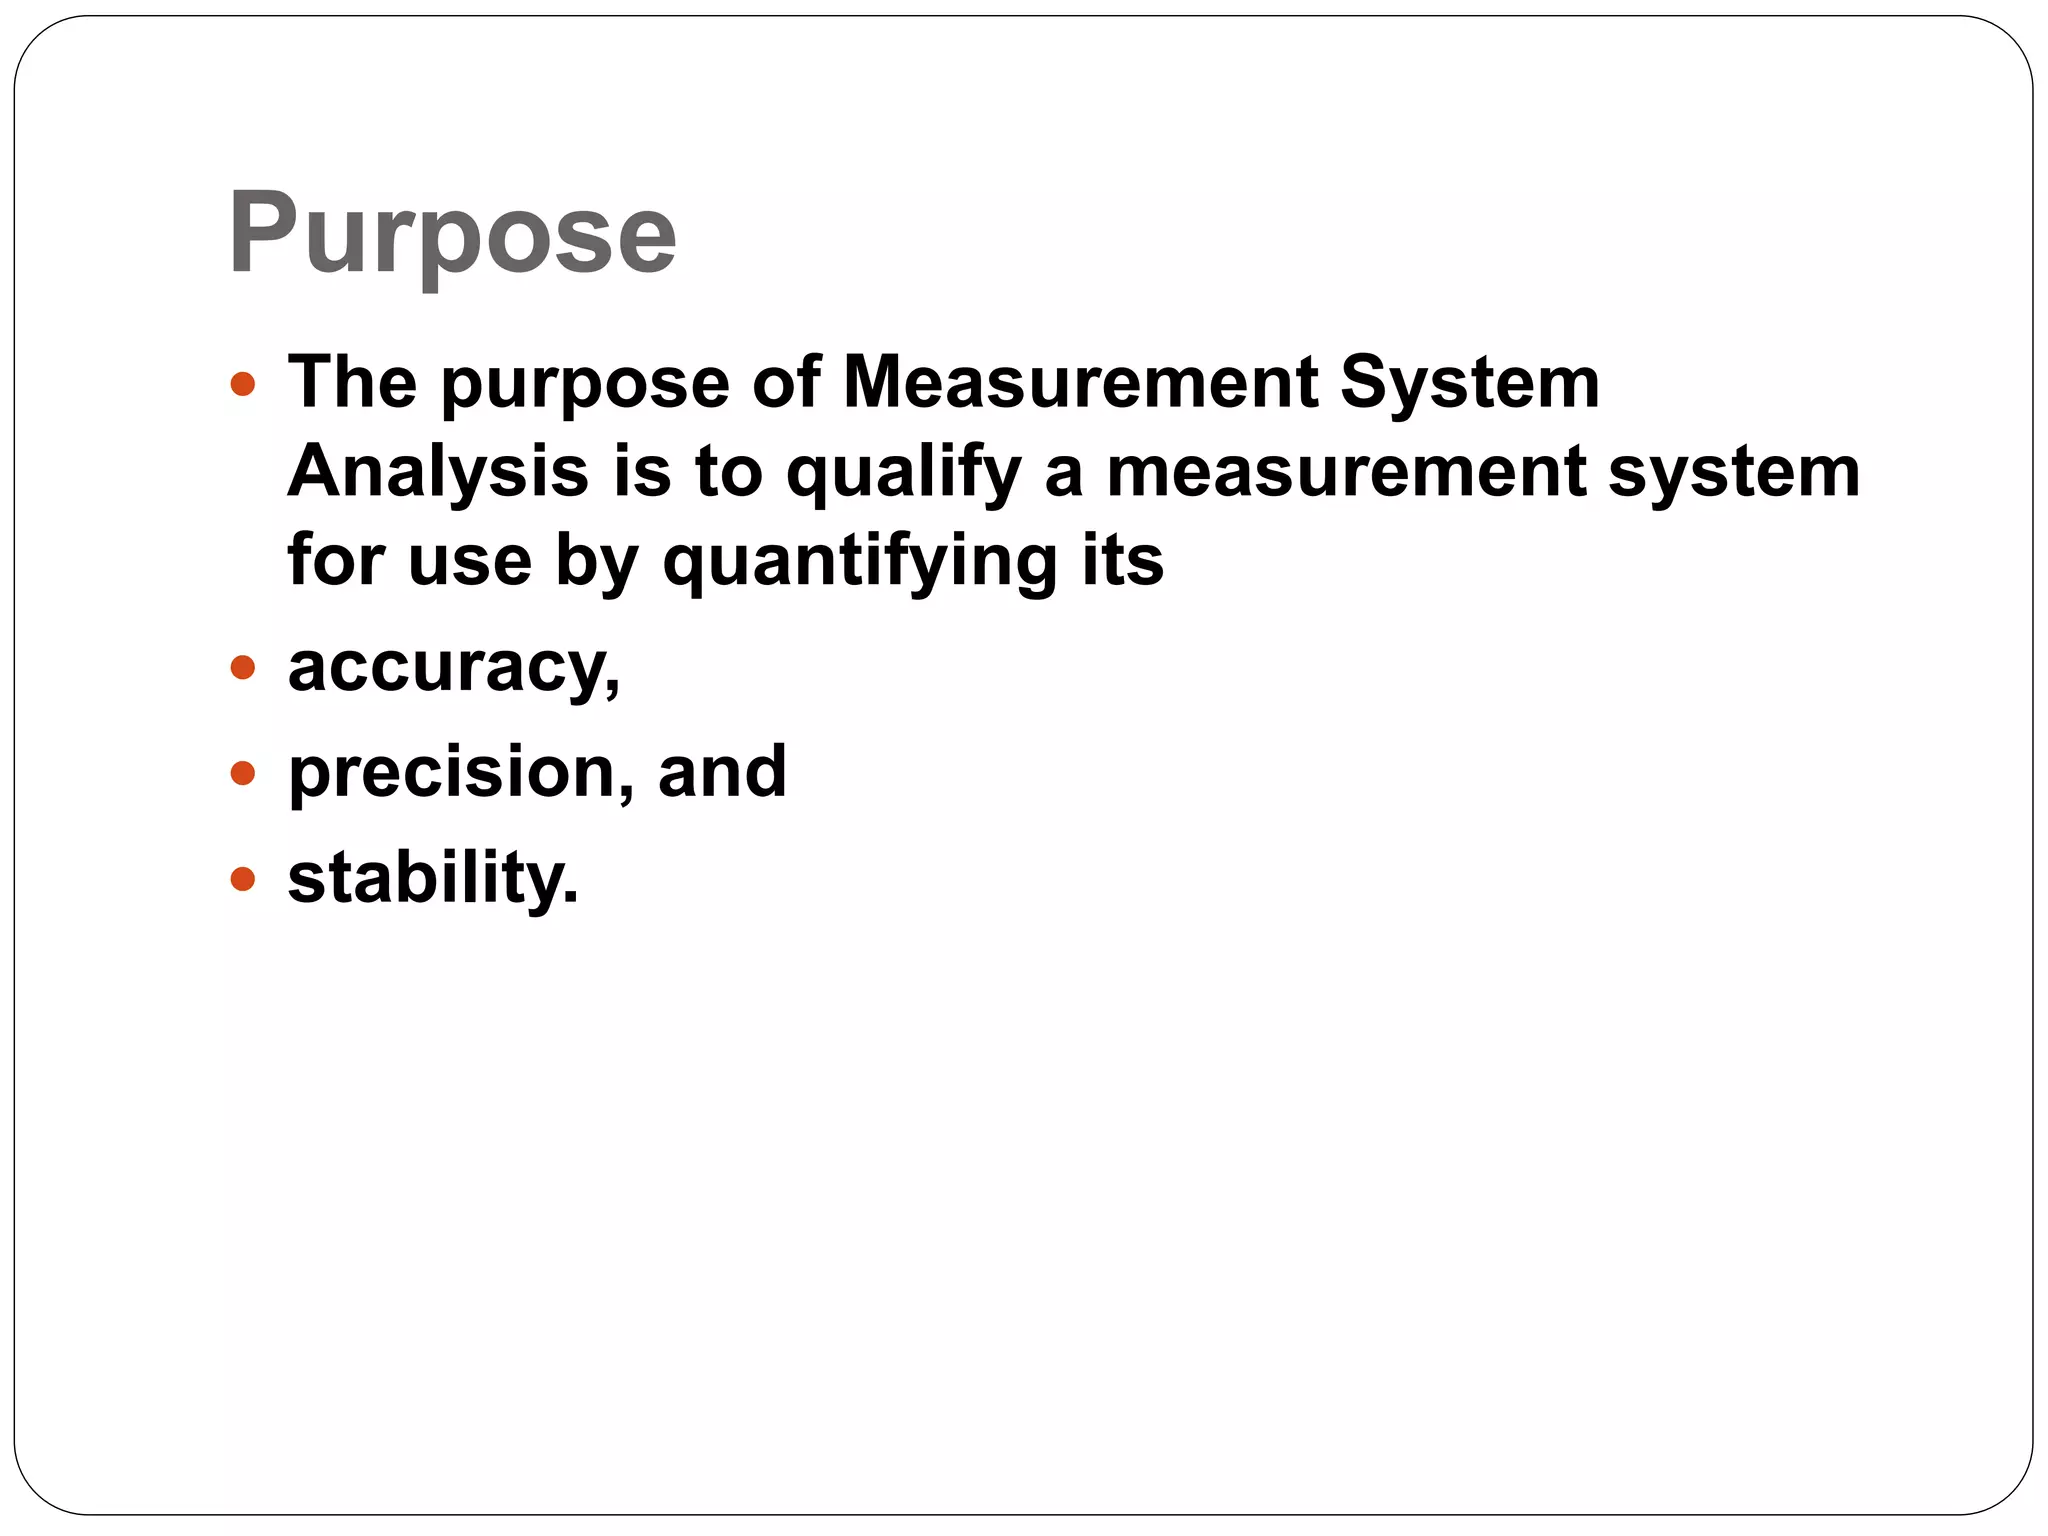
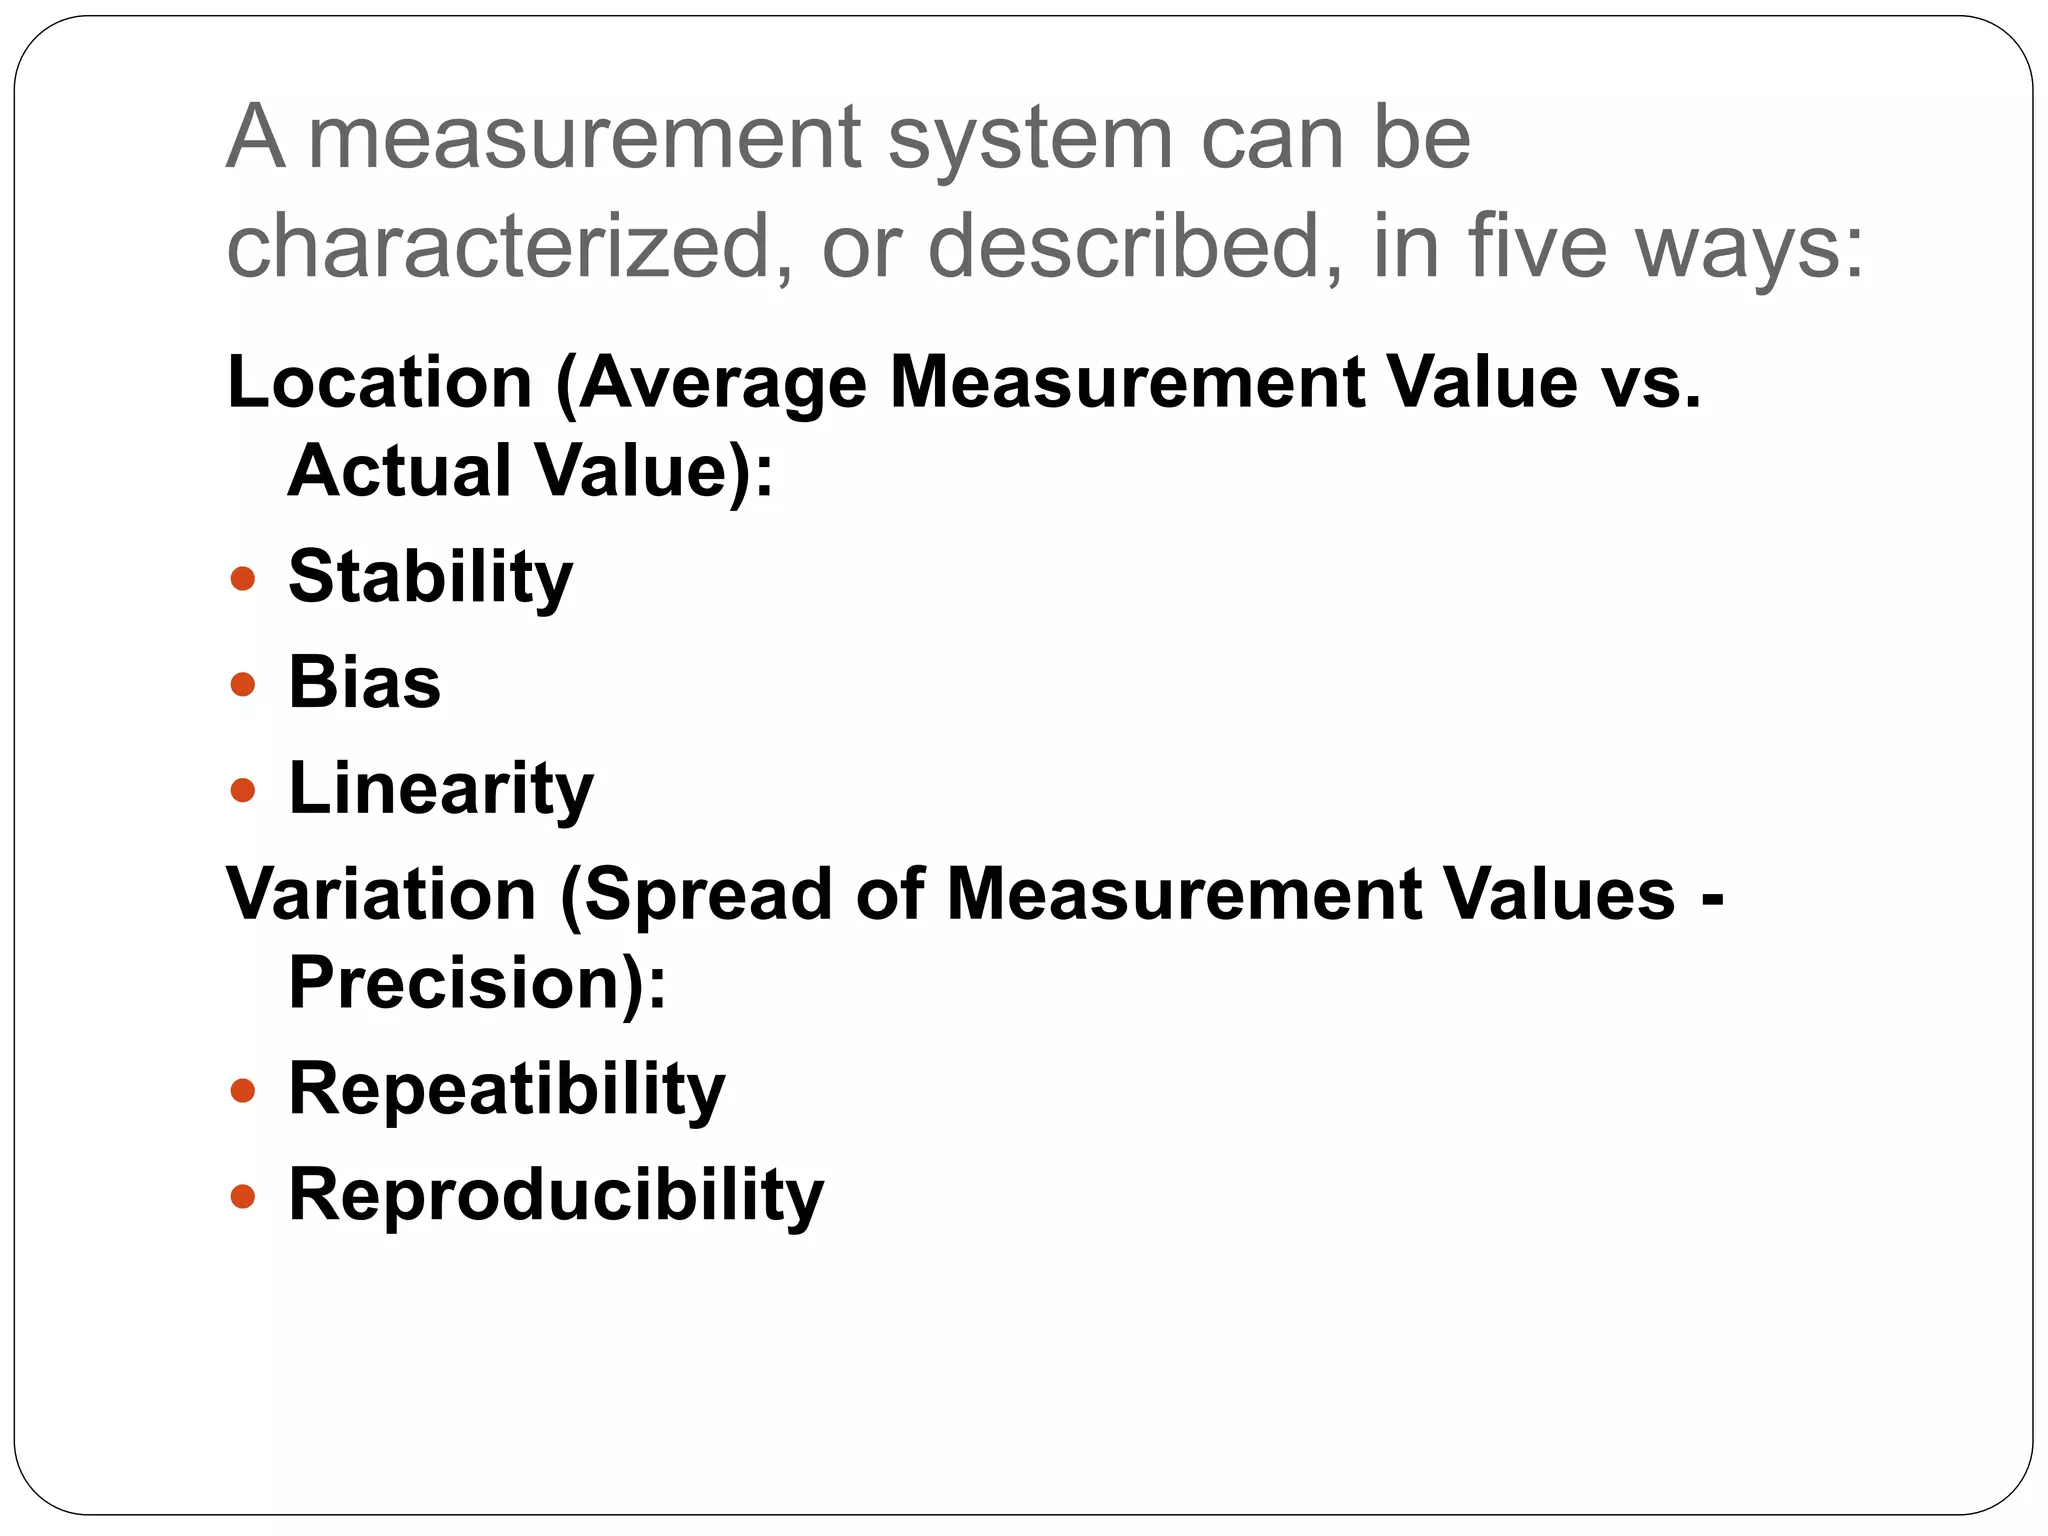
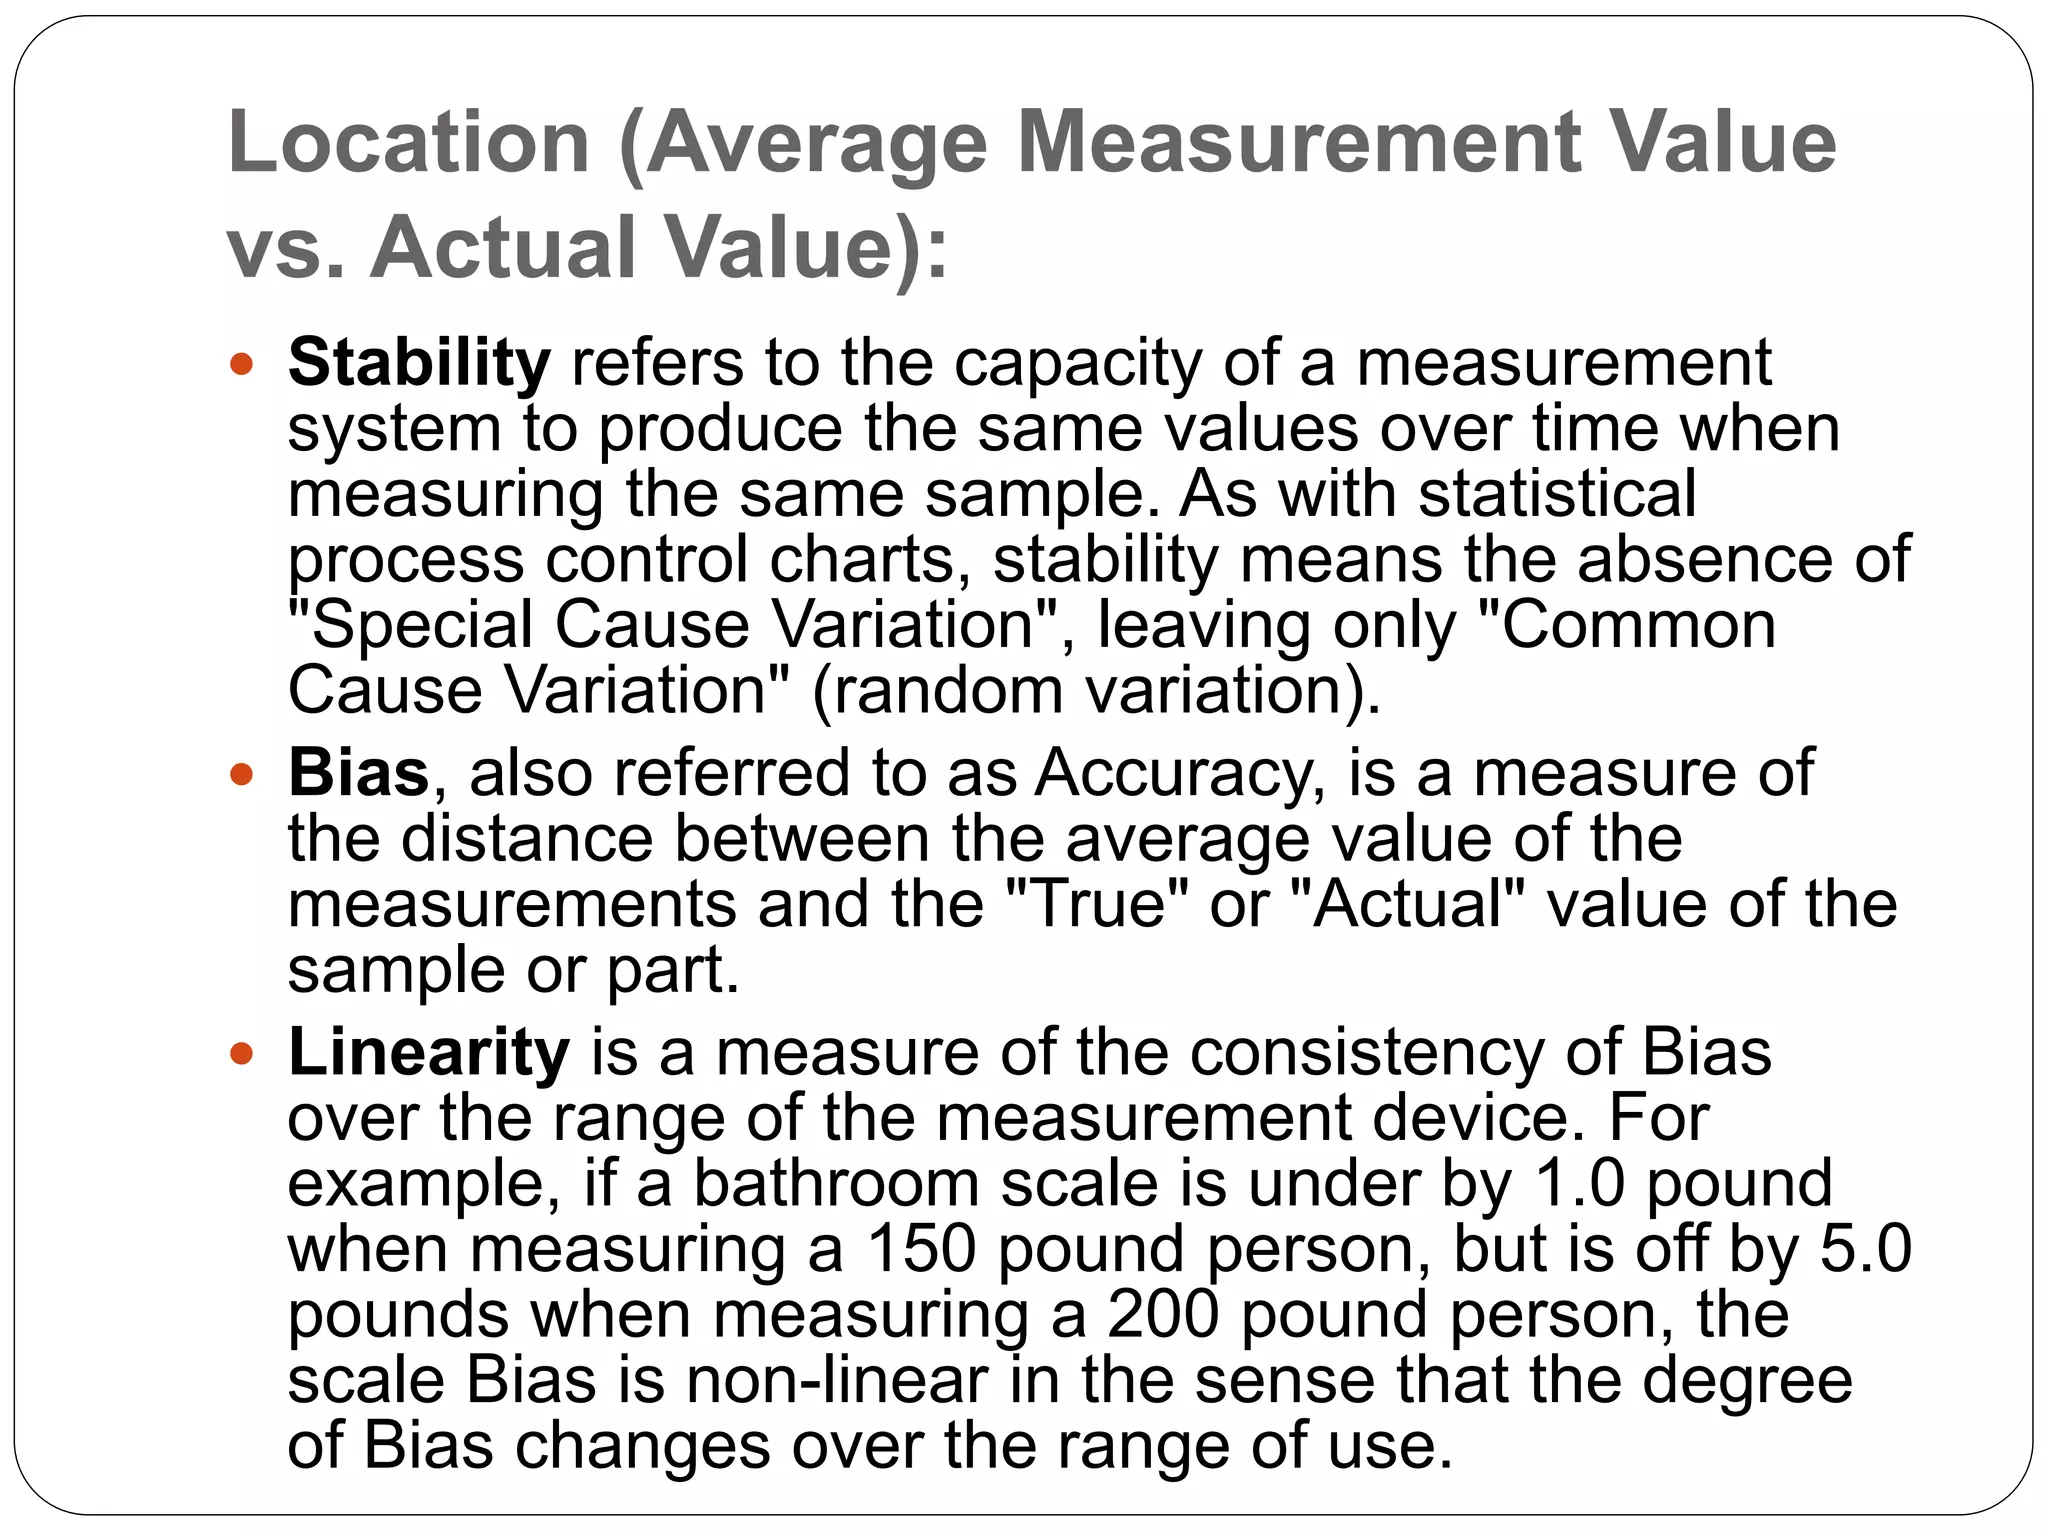
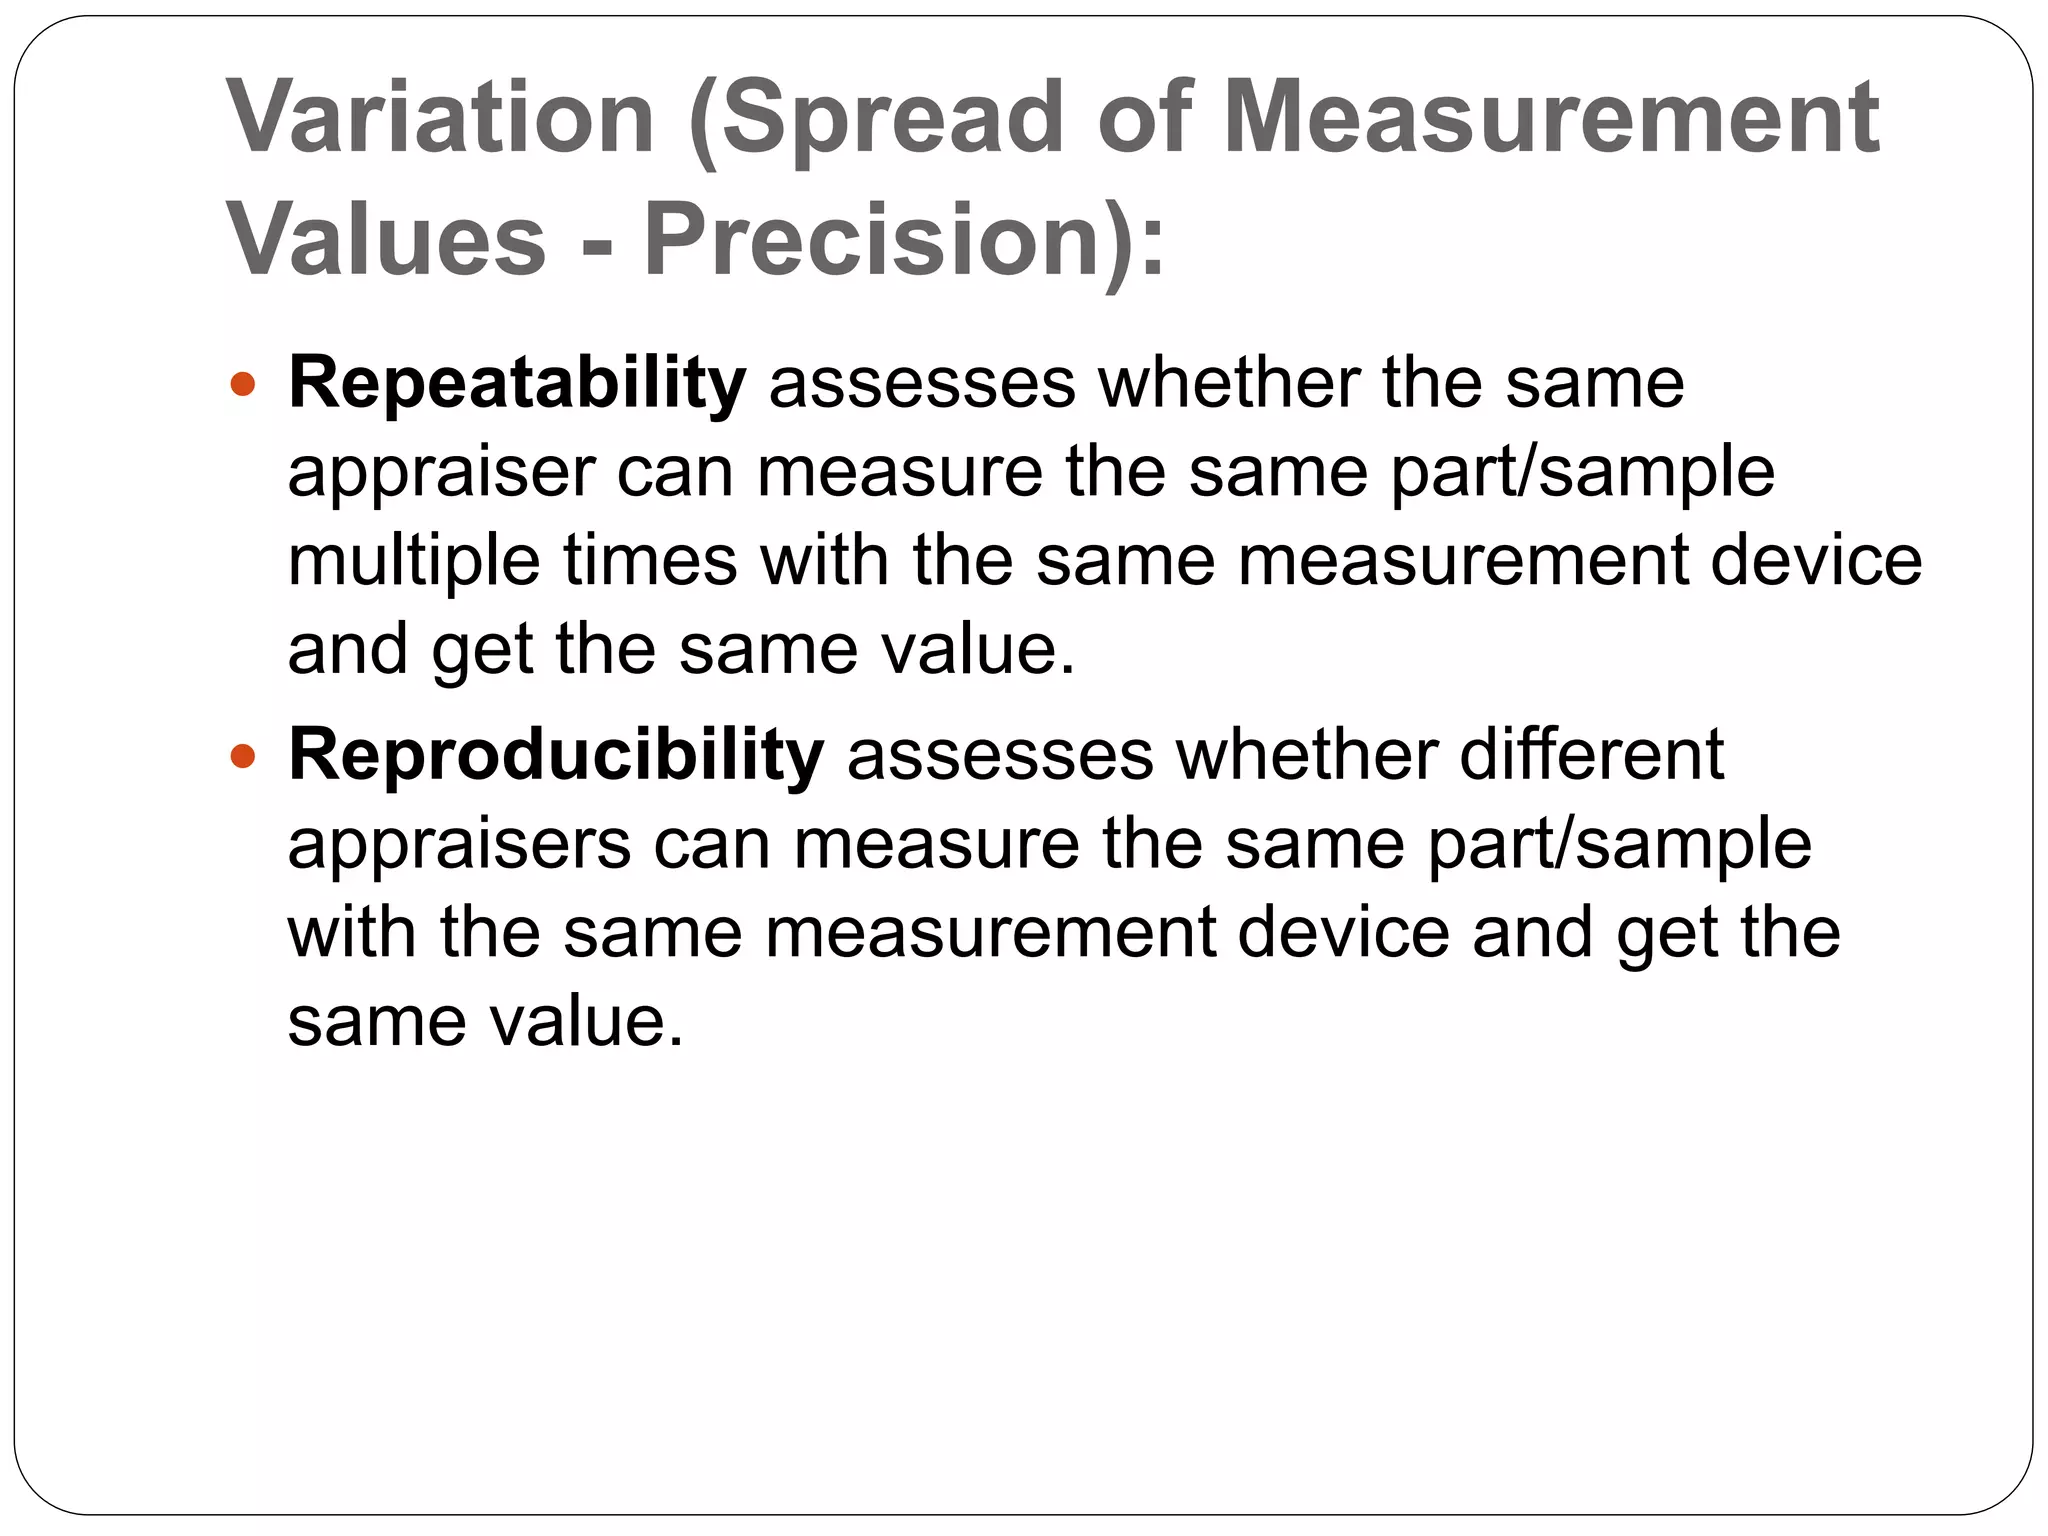
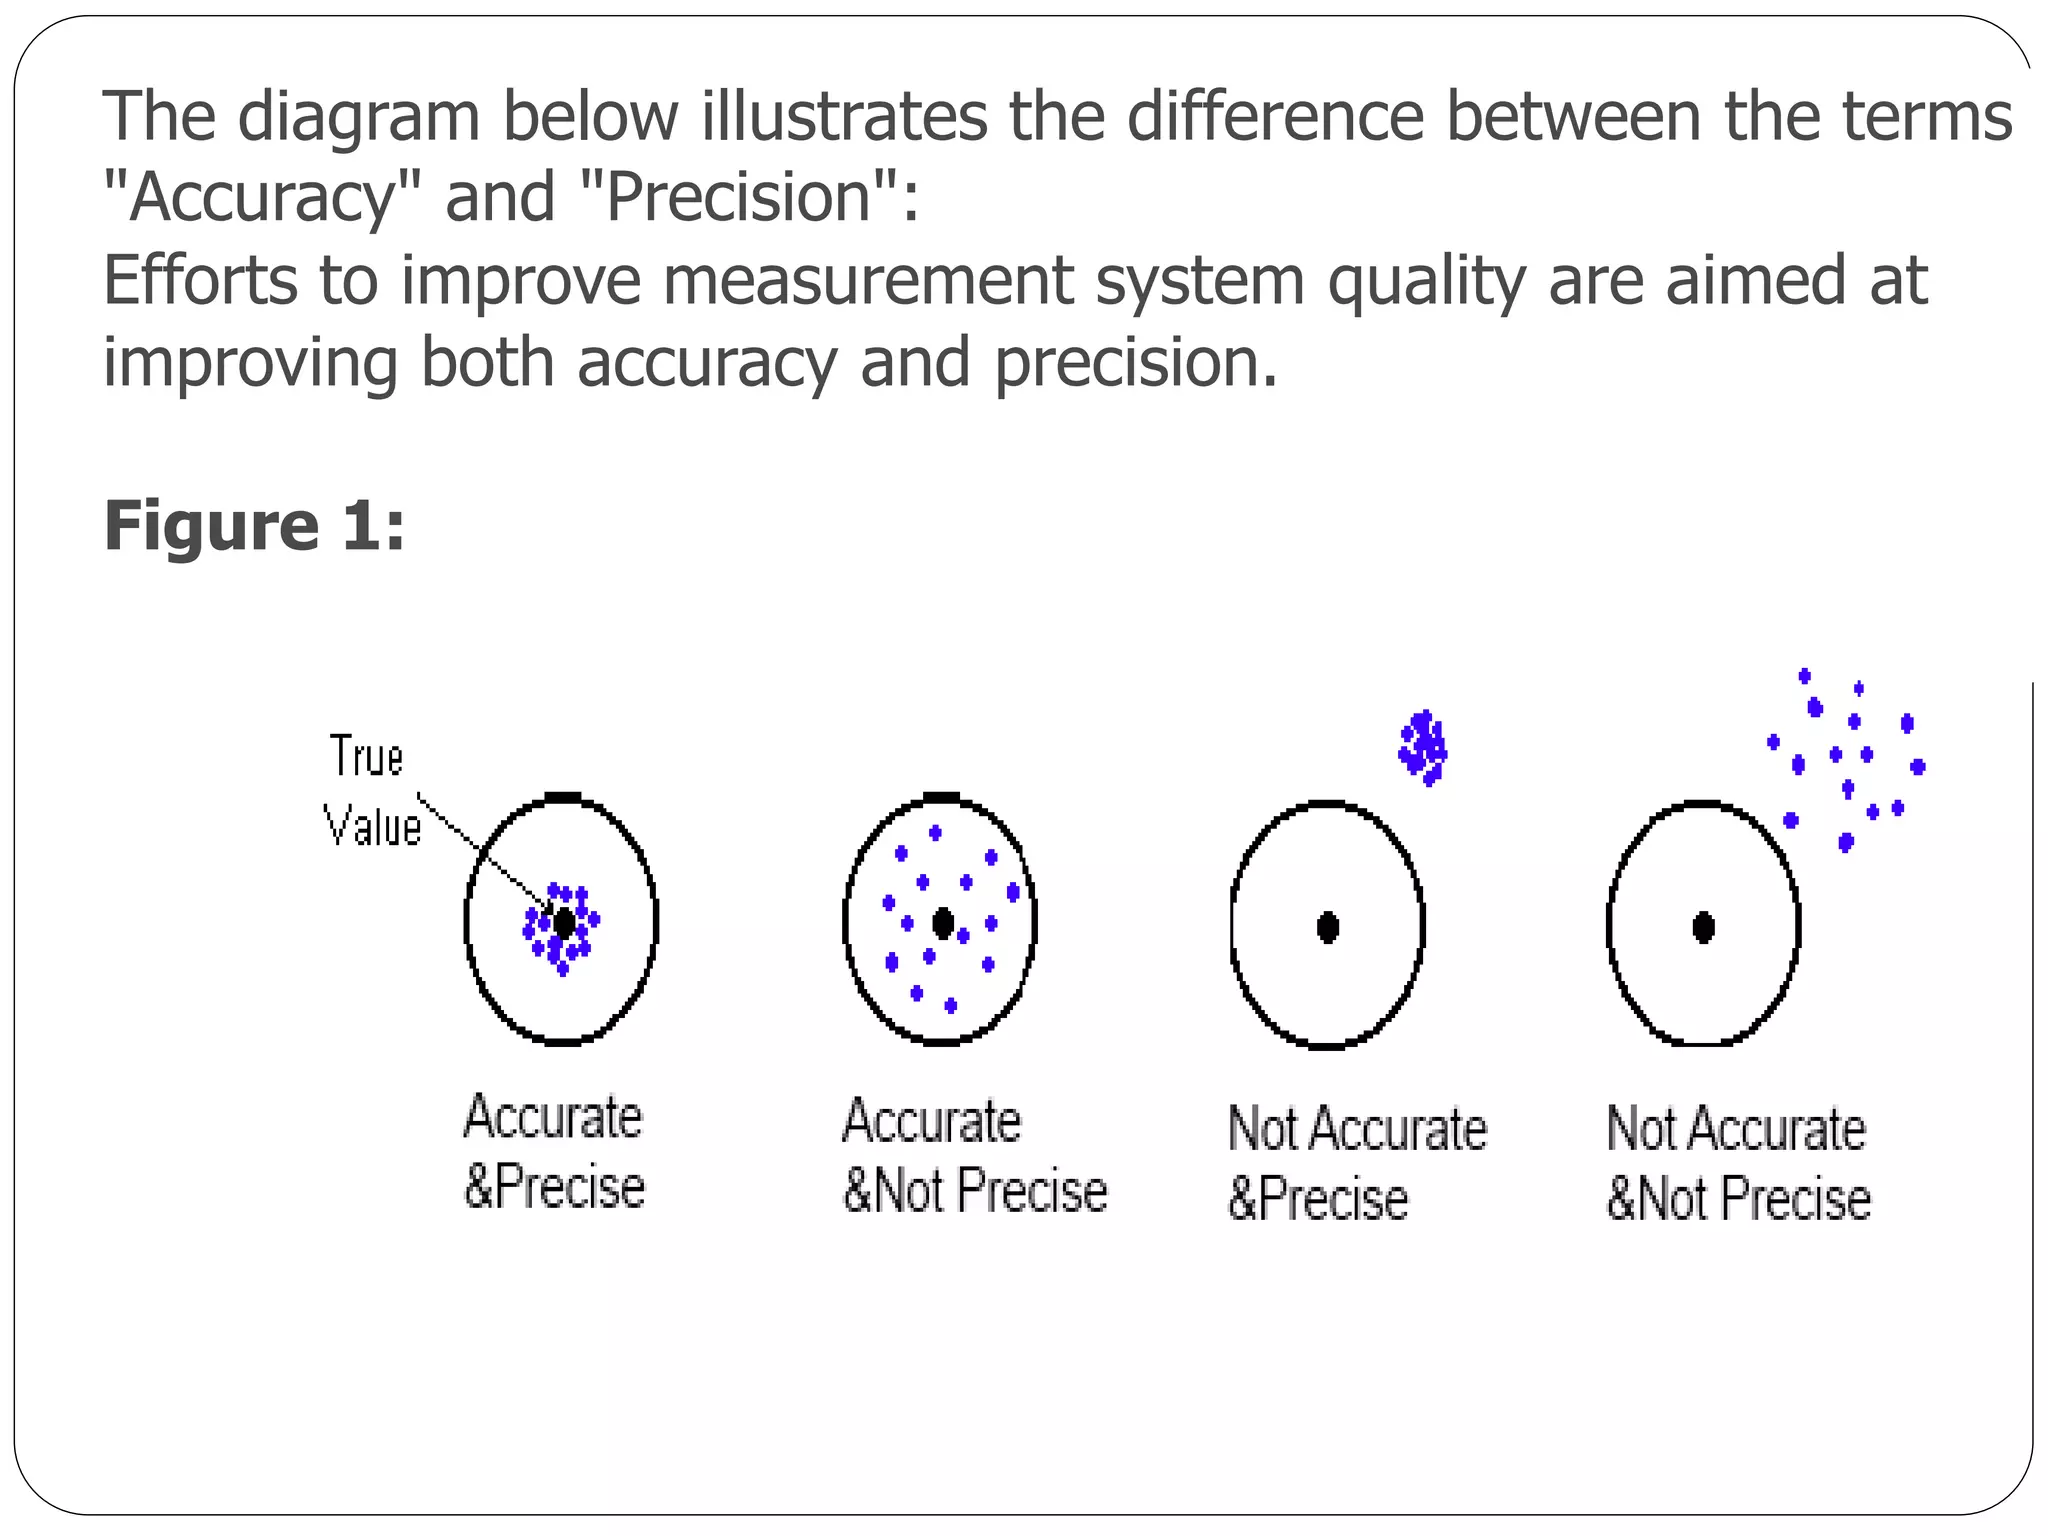


This document defines key concepts in measurement system analysis including accuracy, precision, stability, bias, repeatability, and reproducibility. It provides guidelines for conducting a measurement system analysis, including determining the number of appraisers and parts to measure, ensuring the measurement procedure is documented and followed, and analyzing the results in terms of stability, bias, and gauge R&R to determine if the measurement system is capable and can be used for decision making. The goal is to qualify measurement systems and identify opportunities for improvement.


![7 qc tools training material[1]](https://cdn.slidesharecdn.com/ss_thumbnails/7qctoolstrainingmaterial1-120925054558-phpapp02-thumbnail.jpg?width=640&height=640&fit=bounds)